

1 Introduction
On the shores, storms cause two phenomena (Nielsen, 2009; Sallenger, 2000): (i) an abnormal increase of mean water surface due to the combined effect of minimum atmospheric pressure and maximum wind speed at the coast, which is commonly referred to as storm surge; (ii) in addition, waves that break on shores directly exposed, produce a wave set-up, a rise in the mean water level above the still-water elevation of the sea, and a swash (water that washes up on shore after an incoming wave has broken). The combined effect of wave set-up and swash represent the wave run-up, or maximum level reached by the waves on land. In terms of risk, storms can have two major impacts on coastal areas (Masselink and Hughes, 2003; Paskoff, 1998). They increase the vulnerability of coastal areas in terms of erosion. The waves hit the shore higher and with more energy, thus strengthening their destructive impact during the swash. They can cause flooding of low-lying areas located behind the shoreline, mainly because of the storm surge, but also because of wave set-up and swash, which may cause overtopping flows over dams or dune ridges (Cariolet, 2010; Nielsen, 2009; Reeves and Burgess, 1993; Sallenger, 2000).
Coastal flooding is particularly important on the shores of Languedoc-Roussillon. Indeed, this coast is subject to recurrent storms and vulnerability is high since the massive expansion of beach resorts relative to the establishment of the Mission Racine in the 1960s. The large resorts (Port-Leucate, Port-Barcarès, Cap d’Agde, La Grande Motte, etc.) built on low-elevation and largely urbanized coastal zones make the risk of flooding even more important (Durand, 1999). Although efforts are made to take into account this risk into land use planning, they are still insufficient. Indeed, the threshold to establish the most exposed areas (2 m NGF) is based solely on tide gauge observations. It is regularly exceeded during the most severe storms.
The aim of this article is to present an empirical approach allowing a better estimation of extreme storm-related water levels. We recall the importance of flooding risk in coastal areas, as well as conditions for its inclusion in regulatory documents. The proposed method considers all parameters involved in the formation of these water extreme levels: (i) parameters related to storm surges, determined from tidal predictions, atmospheric pressure and by using numerical modelling with ADCIRC (Bunya and Dietrich, 2010a, b) of wind set-up; (ii) parameters related to wave phenomena that occur within the surf zone (wave set-up and swash), calculated from a semi-empirical formula (Stockdon et al., 2006) and SWAN® numerical modelling of waves propagation (The SWAN team, 2010). The selected area is the southern part of Leucate district (Aude) which is particularly exposed to the risk due to the extent of urbanization along the shore, as well as the very low elevation sand spit, which does not exceed 3 m above mean sea level (Fig. 1). To test the method, water levels reached during the two last storm events (January and October 2010) have been reconstructed and the simulation of submerged areas was carried out by numerical modelling (Anselme et al., 2008; Durand et al., 2010). The results of simulations were validated using archival materials (photographs) as well as direct measurements during fieldwork.
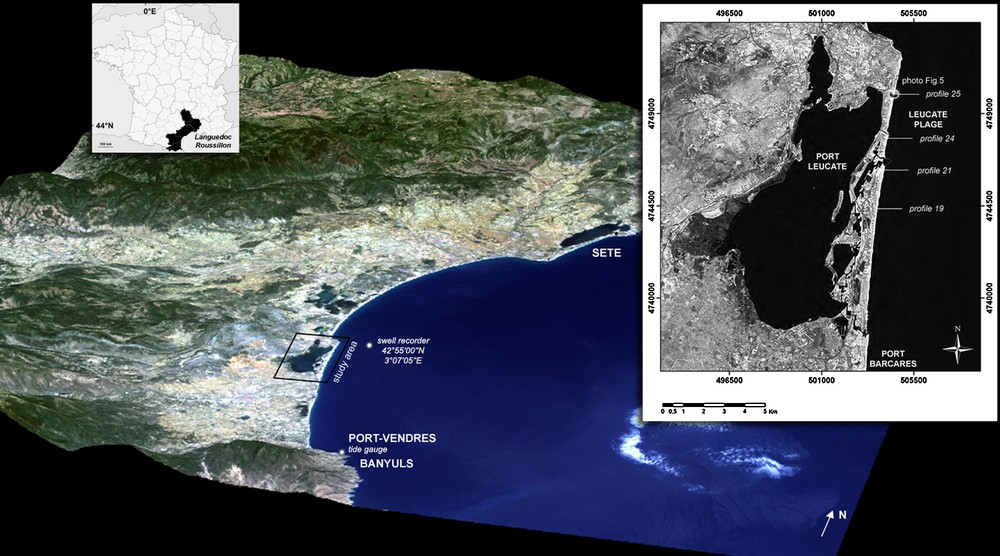
Location of the study area and topo-bathymetric profiles (elevation from +3 to −10 m) used for modelling storm extreme levels.
Localisation du secteur d’étude et des profils topo-bathymétriques (altitudes comprises entre 3 et −10 m) utilisés pour la modélisation des niveaux extrêmes de tempête.
2 Context for the study
2.1 Coastal flooding: a significant risk on the shores of Languedoc-Roussillon
The shores of Languedoc-Roussillon are located in a micro-tidal environment (Table 1). They are subject to recurrent storms that can generate strong swells and significant storm surges (Table 2). However, observations and accurate measurements of these two parameters do not go back further than the late 1990s. They show that, during the storm of December 1997 (return period of 20 years, source DREAL LR, 2008), the significant and maximum wave heights reached 6.98 and 10.81 m respectively at the Sète tide gauge station and the difference between the predicted and the observed tide was 0.73 m (for a measured height of 1.06 m NGF). During the storm of October 2010 (five-year return period), values were lower but still exceeded 8 m for the maximum wave height in Leucate (the swell data recorder, a Datawell Directional Waverider, is located 2.9 miles east of Leucate – 42°55′00′′N and 3°07′05′′E – at 40 m depth) and 0.70 m for the tidal level in Port-Vendres (measured height of 0.782 m NGF).
Paramètres de la marée astronomique à Sète et à Port-Vendres référés au système altitudinal français N.G.F. (niveau 0 m correspond au niveau moyen de la mer au marégraphe de Marseille sur la période 1884–1897).
| Sète (m) | Port-Vendres (m) | |
| Mean Tidal Range | 0.46 | 0.43 |
| Mean Lower Low Water (MLLW) | −0.05 | −0.07 |
| Mean Sea Level (MSL) | 0.18 | 0.14 |
| Mean Higher High Water (MHHW) | 0.41 | 0.36 |
Hauteurs d’eau mesurées et paramètres de houle sur le littoral du Languedoc-Roussillon lors d’évènements tempétueux récents.
| 8–15 Oct 2010 |
14–15 Jan 2010 |
2–4 Jan 2008 |
19–22 Nov 2007 |
04 Dec 2003 |
16–18 Dec 1997 |
|
| BANYULS | ||||||
| Hsig (m) | 3.81 | 2.95 | 4.21 | No mooring | 8.33 | No mooring buoys |
| Tsig | 5.69 | 8.94 | 8.63 | buoy | 11.7 | |
| Hmax (m) | 5.09 | 4,74 | 8.42 | 13.78 | ||
| SETE | ||||||
| Hsig (m) | 3.64 | 4.87 | 5.08 | 4.48 | 5.72 | 6.98 |
| Tsig | 8.36 | 8,29 | 9.01 | 8.08 | 10.2 | 10.37 |
| Hmax (m) | 5.93 | 7.85 | 9.08 | 8.57 | 8.67 | 10.81 |
| LEUCATE | ||||||
| Hsig (m) | 5 | 4.22 | 4.72 | 4.56 | No mooring buoys | |
| Tsig | 9.55 | 8.72 | 8.66 | 8.71 | ||
| Hmax (m) | 8.82 | 6.99 | 8.07 | 7.58 | ||
| SETE | ||||||
| Tidal station (height measured in m NGF) (m) | 0.767 | 0.752 | 0.833 | 0.714 | 0.85 | 1.06 |
| PORT VENDRES | ||||||
| Tidal station (height measured in m NGF) | 0,782 | 0.566 | 0.629 | 0.592 | 0.87 | No measurement |
These storms generate regular flooding and widespread damage, especially as urbanization developed over low elevation dune ridges (about 3 m or less, with a downward slope toward the laguna located backward). In addition, many buildings are encroaching on foredunes or even on beach tops, as in Port Barcares or in Leucate districts. It means that they are located partly in the wave swash zone during the most intense storms (Durand, 1999). Therefore, the vulnerability is particularly high. For instance, during the storm of December 1997, the waterfront in Port-Leucate and in Leucate Plage has been totally flooded with water spreading over several hundred meters inland (Anselme et al., 2008).
2.2 A misjudged hazard?
2.2.1 Risk assessment and regulation
The Regional Maritime Service Management of Languedoc-Roussillon (DREAL LR) has recently developed a methodological guide for considering coastal flood hazard in natural risk prevention plans (PPR), (DREAL LR, 2008). This guide should help to harmonize regional regulation for future coastal flooding PPRs (today, only one such PPR has been prescribed in the Languedoc region), as it is done for river flood PPR (Cœur and Lang, 2008). The guide specifies that, behind the wave swash zone (where building must of course be banned), the reference sea level to be taken into account in coastal flooding PPRs should be a mean centennial sea level of 2 m NGF, or the highest sea level already observed, if higher than 2 m NGF. According to this principle, all unoccupied sandbanks less than 2 m are declared unfit for any building or as priority protection area if they are already urbanized. Only the areas already urbanized behind the swash zone and located higher than 2 m can accommodate new construction.
2.2.2 A flood height underestimated
The reference sea level of 2 m NGF was determined from analysis of historical tide gauge records at the Port -Vendres and Sète harbours (Fig. 1). According to the DREAL LR guide (2008), tide gauge data were used to set the value of the higher mean sea level in Languedoc-Roussillon for the period 1982–1999. Then the value has been extrapolated to take into account local effects such as swell. The problem is that water levels reached in harbours during storm events do not correspond to extreme levels observed on beaches. For instance, Table 1 shows that maximum tidal levels have exceeded 1 m only in December 1997 (1.06 m NGF in Sète). Similarly, during the same period, visual witnesses stated that the sea level reached 1.5 m on docks and harbours (DREAL LR, 2008). However, at the same time, maximum levels reached on beaches and even quite far inland were obviously much higher. Thus, 3 km north of the cape of Leucate in November 1999, a cargo ship with a draught of approximately 3 m has even wrecked on the beach, suggesting that the sea reached at least this level (Anselme et al., 2008). In Leucate-Plage in December 1997 and October 2010, several photographs show waves surge over the wall (2.5 m high NGF, (cf. § 4.2.2)) delimiting the sea-front promenade, flooding the residential area located backward. Finally, in Port-Leucate, especially in the north area of the harbour, many witnesses mention periodical floods of waterfront constructions, located behind and below the dune ridge, during storm events.
This apparent underestimation is related to the fact that tide gauge records refer only to storm surges, which are the result of the combined effect of low atmospheric pressure and persistent strong winds pushing on the ocean surface and accumulating water to the coast (wind set-up). But, due to their sheltered position, tide gauges cannot take into account two fundamental additional phenomena which are related to the wave action within the surf zone: (i) the wave set-up, that corresponds to a rise in the mean water level above the still-water elevation of the sea resulting from the gradient in radiation stress (Longuet-Higgins and Stewart, 1964) within the surf zone; (ii) the swash, corresponding to the water projection on the beach during the surf process. According to Nielsen (2009), their sum is the highest sea level reached by the waves within the surf zone (run-up). These two phenomena contribute significantly to extreme levels reached on beaches during storms. They can significantly contribute to the risk of flooding by the sea by fostering wave overtopping costal defenses built along the coast to protect backward areas below sea level against flooding or breaching the dunes that constitute natural protection (Cariolet, 2010; Nielsen, 2009; Reeves and Burgess, 1993; Ruggiero et al., 2001; Sallenger, 2000).
3 Methodology
3.1 Methodology for assessing storm extreme levels: a brief state of the art
In the U.S., much research has been conducted to improve the assessment of extreme sea levels reached by the waves on beaches during storm events, by taking into account wave set-up and swash phenomena. The initial work took place in the 1960s from laboratory experiments (Bowen et al., 1968; Dean, 1977; Longuet-Higgins and Stewart, 1963). In the 1980s, research works were completed by field measurements (Apotsos et al., 2007; Guza and Thornton, 1981, 1982; Holman and Sallenger, 1985; Komar, 1998; Lentz and Raubenheimer, 1999; Mase, 1989; Nielsen, 1989; Nielsen and Hanslow, 1991; Raubenheimer et al., 2001; Ruggiero et al., 2004; Sallenger, 2000; Stive and Wind, 1982). In France, research on this topic appeared only recently, in studies conducted on the Atlantic coast (Cariolet, 2010; Cariolet and Suanez, 2008; Sénéchal et al., 2011; Suanez and Stéphan, 2006) and in the Mediterranean sea (Anselme et al., 2008; Sabatier et al., 2009). All these studies were conducted using empirical formulae based on tide gauge records, wave data in deep water (significant wave height and period, wavelength) as well as bathymetric data of the foreshore slope or beach slope within the surf zone. The most accomplished recent work was conducted by Stockdon et al. (2006). It relies on the whole dataset and advanced research accumulated since the 1980s on hydrodynamic phenomena associated with wave set-up and run-up on micro and meso-tidal environments. From this review, the authors propose a new formula allowing the separate estimation of both set-up and swash. Furthermore, the formula is applicable regardless of topographical conditions, except for high dissipative systems (cf. § 3.2.2). Research synthesis on wave set-up and swash also formed the basis of recent developments of numerical models for wave propagation and wave breaking, such as SWAN® from the Delft University of Technology, in the Netherlands (The SWAN team, 2010) or MIKE BW®, developed by the DHI international consulting and research organization (DHI, 2006).
3.2 Storm extreme levels empirical approach by integration of both storm surges and swell effects within the surf zone (wave set-up et swash)
3.2.1 Identification of the different components constituting a storm extreme level
The proposed method is based on a parametric approach which consists of identifying and modelling the various components of a storm extreme level so that it can be applied to conduct predictive analysis. According to this principle and if in a first approximation, we neglect secular variations due to sea level changes, the Htotal maximum level reached by waves on a beach during a storm can be estimated from the following expression:
Htotal = Hzm + Δhm + Δ hp + Δhsv + Δhsd + Δhsw
where Hzm = altitudinal datum reference (for example the MLLW); Δhm = diurnal or semi-diurnal variation due to the astronomical tide; Δhp = variation due to the barometric tide; Δhsv = variation due to the wind set-up; Δhsd = variation due to the wave set-up; Δhsw = variation due to the swash.
The Htotal maximum level includes two classes of components. The first five components represent a mean surge, depending on the time step used for modelling, while the last parameter Δhsw corresponds to the maximum displacement from the mean position. The last three components, Δhsv, Δhsd and Δhsw, can be determined through the use of semi-empirical formulae and/or numerical models (see above). The originality of this approach relies on the fact that each component can be processed individually.
3.2.2 Estimate of the different components
3.2.2.1 Altitudinal datum reference, astronomical and barometric tide (components 1 to 3)
In France, the Naval Hydrographic and Oceanographic Service (SHOM) provides for each region a table indicating official altimetric references of the sea (MLLW, MSL, MHHW) in the French NGF system. SHOM also provides astronomical tide forecasts from which the second parameter Δhm can be calculated. The third parameter can be estimated from atmospheric pressure data, according to the “inverted barometer” rule - a drop in pressure of 1 hecto-pascal induces a sea level rise of 1 cm.
3.2.2.2 Modelling of the wind set-up (component 4)
The 4th parameter, Δhsv can be estimated using ADvanced CIRCulation (ADCIRC) circulation model, which is a system of computer programmes for solving time dependent, free-surface circulation and transport problems in two and three dimensional barotropic mode (Luettich and Westernink, 2007). It uses the finite element method with highly flexible, unstructured grids. This approach is optimal for complex bathymetry and coastline boundaries as elements of varying size can be incorporated as needed. The ADCIRC model can be ‘forced’ by gravity/tidal potential and meteorological conditions. It can be used for modelling tides and wind driven circulation during storm surges (Bunya and Dietrich, 2010a, b).
3.2.2.3 Modelling of wave action within the surf zone (components 5 and 6)
The two last magnitudes, Δhsd and Δhsw, will be estimated using the formulation proposed by Stockdon et al., 2006. This formula which has been developed for micro- and meso-tidal beaches is the only way to estimate wave setup and swash separately:
This formula is very robust since it was developed from a large number of in situ observations and is theoretically applicable to most beaches. However, it faces three limitations:
- • it is not valid for beaches under highly dissipative conditions, where the Irribareni number ξ0 (Battjes, 1974) is less than 0.3, and for which the authors propose a simplified formulationiii;
- • the approach used by Stockdon et al. (2006) for determining the slope βf is questionable. The slope is in fact not known at the beginning but calculated from multiple wave run-up in situ measurements provided by continuous video recording. The slope is estimated from bathymetric surveys performed during video recording (see Stockdon et al., 2006, pp. 576–578). This slope corresponds to the beach transect between the maximum run-up and minimum run-down during the study period. Therefore, it does not exactly correspond to the slope of the foreshore, defined as that part of the beach extending from minimum to maximum sea levels. The slope is actually difficult to assess without any large set of in situ run-up measurements. Therefore, some authors have recently applied the formula (Cariolet, 2010; Cariolet and Suanez, 2008; Suanez and Stéphan, 2006) using the foreshore slope for convenience;
- • the Stockdon formula was set up from numerous in situ run-up measurements but without direct measurement of the wave set-up. It was deduced from run-up measurements on the assumption (made in many early studies) that run-up is approximately equal to the sum of set-up and half of the swash. Coefficients used in the formula have been adjusted according to this hypothesis. In such circumstances, it seems interesting to comparatively test another formulation of the set-up, which has been validated in many recent studies (Abadie et al., 2005; BRGM, 2010; Dugor et al., 2010; The SWAN team, 2010) and upon which is based the SWAN® model.
The wave-induced set-up computed by the SWAN® model is based on exact equations in one-dimensional cases: this computation is based on the vertically integrated momentum balance equation which is a balance between the wave force and the hydrostatic pressure gradient, as follows:
To run the model, it is necessary to know the characteristics of deep water waves and to have a high-quality bathymetry. Since the model does not calculate the swash, we operate the modelling by coupling the SWAN® model with the Stockdon formula. Thus, modelling of Δhsd and Δhsw, was performed both by the use of Stockdon formula alone (for set-up and swash) and a coupled approach SWAN® (for set-up) - Stockdon (for swash), which includes the following steps: (1) 2-D modelling of wave propagation with SWAN® until the beginning of the surf zone, to get local wave data (Hsig and Tsig); (2) from the obtained wave data, 1-D wave set-up modelling using SWAN® for bathymetric profiles–simulations are performed in 1D because the model offers only approximate modelling in the case of 2D simulations (the effects of currents induced by waves are not taken into account); (3) then, for each profile, the Stockdon formula is used to calculate the Δhsw values (swash); (4) finally, the maximum level reached by the sea (run-up) is estimated for each profile by summing the values determined during the previous two steps.
3.2.3 Simulation of flooding surges
Flood simulations will be performed through a water propagation model based on a recursive algorithm (Anselme and Bessat, 2006, Anselme et al., 2008). The algorithm relies on data provided by a digital elevation model (DEM) built from topographical site survey using differential GPS (DGPS).
As all the static models (Murray and Paola, 1994), this model is time independent and does not calculate flow velocities: a water level to be achieved is specified by the operator at the beginning of a run process, as well as a flood increment. Then the model will simulate the flood progressively for each increment until the water level specified at the beginning of the process is reached. It is therefore well suited to identify the most vulnerable coastal areas affected by costal flooding during a storm due to a rising of wave set-up which allows, associated with the effect of the swash, an overtopping of coastal defenses or dune ridges and a flooding of backward low areas.
4 Modelling storm extreme levels on the shoreline of the Leucate district
4.1 Dataset used
Flood simulations using the formula outlined in cf. § 3.2.1 were performed on four topo-bathymetric transects located between Leucate and Port-Leucate-Plage (Fig. 1), on dissipative and intermediate (number ξ between 0.31 and 0.89) beaches. In these areas, a seafront walk-way, between 2.5 and 3 m NGF, encroaches on coastal dunes. No low wall delimits the waterfront, except along profile 25 (cf. § 4.2.2).
Flood simulations were performed for the last two storms that occurred during the months of January and October 2010 (Table 1). These two storm events were chosen because: (i) they are of a similar nature, both characterized by southeast swells associated with a low pressure system in the southern part of Golfe du Lion (DREAL LR, 2010a, b); (ii) high-quality bathymetric data were provided by DREAL LR (high resolution airborne LIDAR data collected in September 2009, with a vertical resolution of ± 20 cm, Vanroye et al., 2010) for modelling wave setup and swash (Δhsd and Δhsw); (iii) they are the first storms after the acquisition of the data, which minimize imprecision to calculate the beach slope, due to morphological changes which may have taken place between the time of the surveys and the storms occurrence, (iv) oral witnesses and photographs are available for these two storm episods.
For both storms, two modelling of wave setup and swash are proposed in a comparative approach, as described in cf. § 3.2.2: by the use of Stockdon's formula (called the STK method), by coupling the SWAN® model with Stockdon's formula (the STK-SWAN® method). As run-up in situ measurements were not available to calculate the beach slope according to Stockdon's procedure, we considered the foreshore slope, between the absolute minimum sea level (Mean Lower Low Water), determined from tide gauge records at Port-Vendres (MLLW = −0.07 m NGF) and the absolute maximum sea level observed on study beaches, where, according to witnesses (DREAL LR, 2008 and 2010a and b), beaches can be completely submerged during the most intense storm events (flooding to the edge of the waterfront walk-way, from 2.5 to 3 m depending on each profile). The whole dataset used for the study is summarized in Table 3. Fig. 2 provides examples of wave set-up Δhsd obtained with the SWAN® model.
Données utilisées pour la modélisation des niveaux extrêmes de tempête à Leucate.
| Data | Source | Use |
| Tidal | SHOM (official altimetric references of the sea, astronomical tide forecasts) Sea level observing system (SONEL, http://www.sonel.org) (tide records, time resolution 0 h 30 mn) |
Estimate of components 1 and 2 (Hzm et Δhm) Tide gauge records at Port-Vendres (validation of components 3 and 4) |
| Meteorological Pressure winds | Global Forecast System (GFS) data base of National Climatic Data Center (NCDC) (spatial grid resolution: 0.5°, time resolution 1 hour) |
Estimation of components 3 (Δhp) and 4 (Δhsv) |
| Swell recorder | DREAL LR (buoy of Leucate, see localisation Fig. 3a) Significant and max wave heights and periods and directions (time resolution: 1 h) |
Estimation of components 5 (Δhsd) and 6 (Δhsw) STK method: wave set-up and swash calculation SWAN®-STK method: 2-D waves propagation with SWAN® (Fig. 3a) and 1-D SWAN® simulations to estimate wave set-up for each profile (Fig. 3b) swash calculation by STK |
| Bathymetric | SHOM (bathymetric charts) DREAL LR (topo-bathymetric profiles, LIDAR data, spatial grid resolution: 5 m) |
bathymetric mapping for modelling swell propagation using SWAN® (Fig. 3a) Beach slope calculation for each profile for modelling wave set-up and swash |
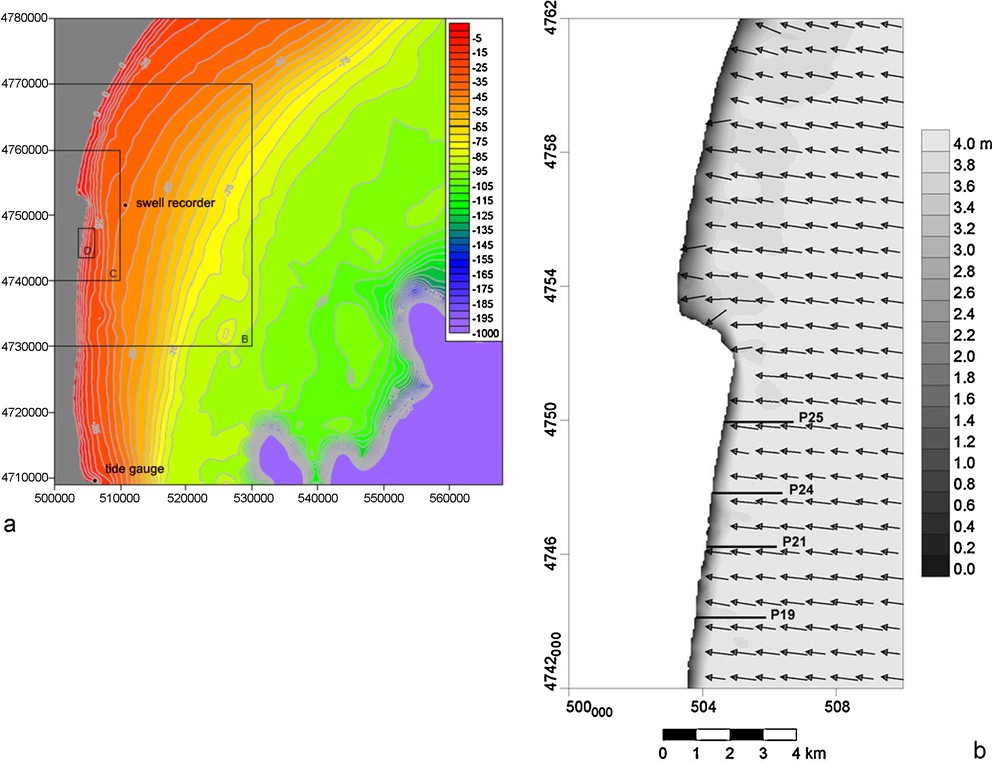
Illustration of extreme sea level modelling by coupling the SWAN® model with Stockdon's formula. (a) DEM used for 2-D modelling with SWAN® (200 m grid resolution). Frame B corresponds to the spatial limits of the model, frames C and D are the boundaries of 2D and 1D nested models. The black dot corresponds to the swell recorder buoy at Cap Leucate. (b) Computed significant wave height pattern in meters and mean direction of energy transport (denoted with vectors) for the SWAN® 2-D nested grid simulation ‘Leucate D’ and location of bathymetric profiles P19 to P25. In this example, Hsig determined at the starting point of each profile are between 3.8 and 4 m. These data are used to estimate wave set-up by the SWAN®-STK method (1-D SWAN® simulations, cf. Table 3).
Illustration de la modélisation des niveaux extrêmes par recours au modèle SWAN® et à la formule de Stockdon. (a) MNT utilisé pour la modélisation SWAN® 2D (résolution : 200 m). Le cadre B correspond aux limites de l’aire utile du modèle, les cadres C et D aux limites des modèles 2D et 1D imbriqués, le point noir « houlographe » à la localisation de la bouée houlographique du Cap de Leucate. (b) Exemple de sortie de modélisation SWAN® 2D et localisation des profils bathymétriques P19 à P25. Dans l’exemple présenté, les Hsig déterminées au point de départ de chaque profil grâce aux modélisations SWAN® 2D sont comprises entre 3,8 m et 4 m. Ce sont ces données qui ont été utilisées pour la détermination du wave set-up par SWAN® 1D dans la méthode SWAN®-STK (cf. Table 3).
4.2 Results
4.2.1 Modelling of extreme sea levels for the storms of January 2010 and October 2010
Simulation results are presented on Fig. 3. Calculation results from the two modelling approach (the STK and the STK-SWAN® methods) suggest some comments:
- • for both storms, highest sea levels exceed 2 m NGF (altitude from which beaches are largely submerged) during several hours for all profiles, except for profile 21 where water levels are significantly lower. Water levels are also lower in January than in October. Thus, on January 14, the 2 m threshold is exceeded from 4 to 11 h, whereas in October this level is exceeded for approximately 40 h during two days (October 10 and 11, from the 100th to 140th hour);
- • the swash can vary significantly from one profile to another, the highest values corresponding to beaches having the steepest slopes, as showed by Ruggiero et al. (2004): very high values are observed in P24, in the northern part of Port-Leucate harbour, where the eroded beach is very narrow, while in the southern part, where the accreting beach is wider (DREAL LR, 2008), the values are lower, particularly for profile 21;
- • storm surges estimated on beaches (by adding Δhm, Δhp and Δhsv) are substantially lower than those recorded by tide gauge at Port-Vendres: for example, at the height of the storm in January 2010 (January 14 at 9:00 pm, 45th hour, cf. Fig. 3a), the storm surge estimated is 0.32 m at Leucate while at the same time, it reaches 0.47 m in Port-Vendres. At the height of the storm in October 2010 (October 11 at 6:00 am, 126th hour), the values are respectively, 0.50 and 0.62 m. This surges overestimation at the tide gauge could be related to the morphology of the bay in Port-Vendres, fairly deep (about 2 km) and open eastward, and where water accumulation caused by wind during storm events may be higher than that observed on Leucate open beaches;
- • the influence of the storm level components related to wave breaking (the set-up and especially the swash) is dominant: it represents at least two-thirds of the maximum height computed for each simulation and in some cases, more than four-fifths. It may be noted about these two components that, wave set-up values calculated by SWAN® are systematically lower than those calculated by Stockdon's formula up to 0.7 m for the profiles with steepest slopes (P25 and particularly P24). This difference is probably related to the calculation of wave set-up in both approaches: SWAN® calculates the set-up in an iterative manner over the entire profile length between the beginning of the surf zone and the breaking point (cf. § 3.2.2); in the Stockdon formula, the set-up is calculated from the slope of the emerged part of the beach (βf, which corresponds in our case study to the foreshore slope cf. § 4.1). The calculation method used in SWAN® seems more rational since the wave set-up is generated within the surf zone (Nielsen, 2009), not on the emerged part of the beach, after waves have swept.
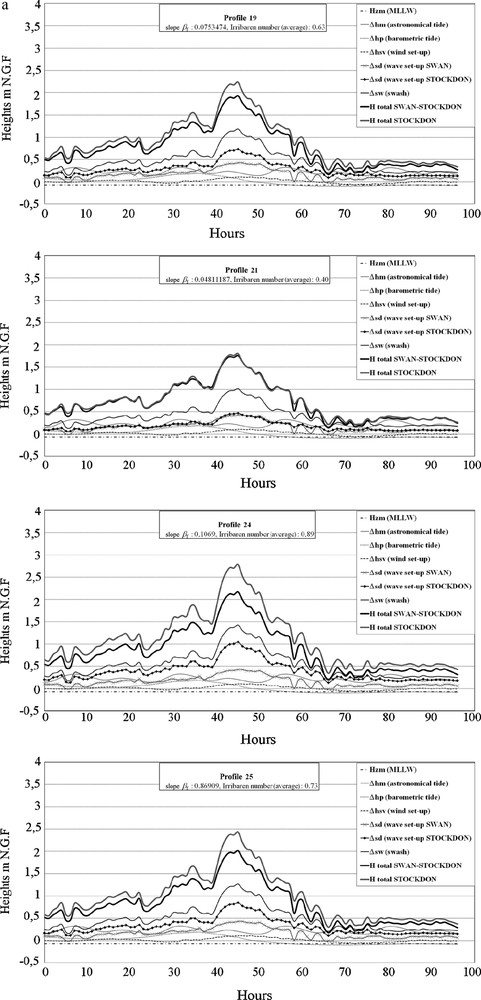
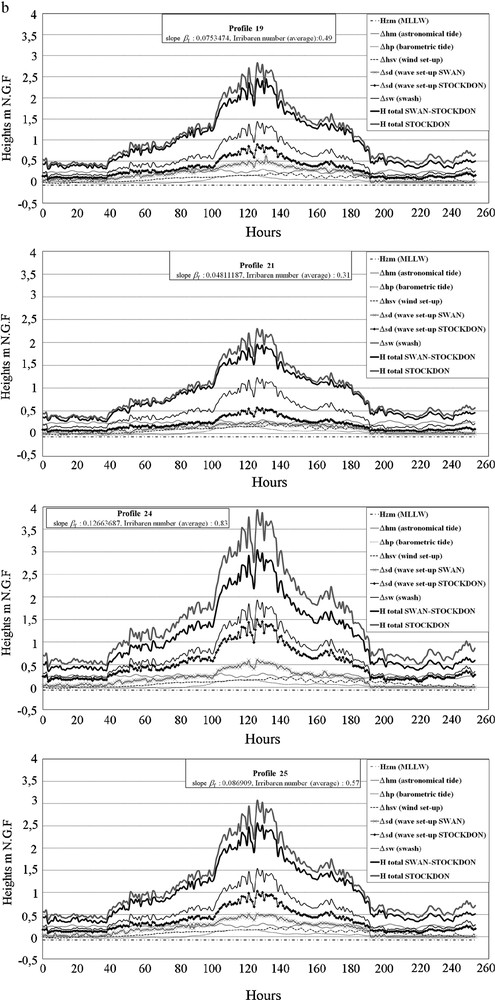
Results of storms extremes level modelling in Port-Leucate (a: January 2010 storm; b: October 2010 storm).
Résultats des modélisations des niveaux extrêmes à Port-Leucate (a : tempête de janvier 2010; b : tempête d’octobre 2010).
4.2.2 Flooded areas
Flood simulations were performed for the area of Port-Leucate (P19, P21 and P24), for which a DEM built from a topographical site survey using DGPS is available with a sub-centimeter accuracy. In Leucate-Plage (P25), a DEM is not yet available. Simulations were made using the highest water levels reached during each storm event, either (Fig. 4):
- • for the storm of January 2010 (Fig. 4a and b), respectively, 2.02 m for wave set-up and swash modelling by the STK method and 1.82 m for the SWAN®-STK method southward from harbour (P19 to P21), respectively, 2.79 and 2.17 m northward (P24);
- • for the storm of October 2010 (Fig. 4c and d) respectively 2.56 m for the STK method and 2.21 m for SWAN®-STK modelling method southward from harbour (P19 to P21), respectively, 3.50 and 2.84 m northward (P24).
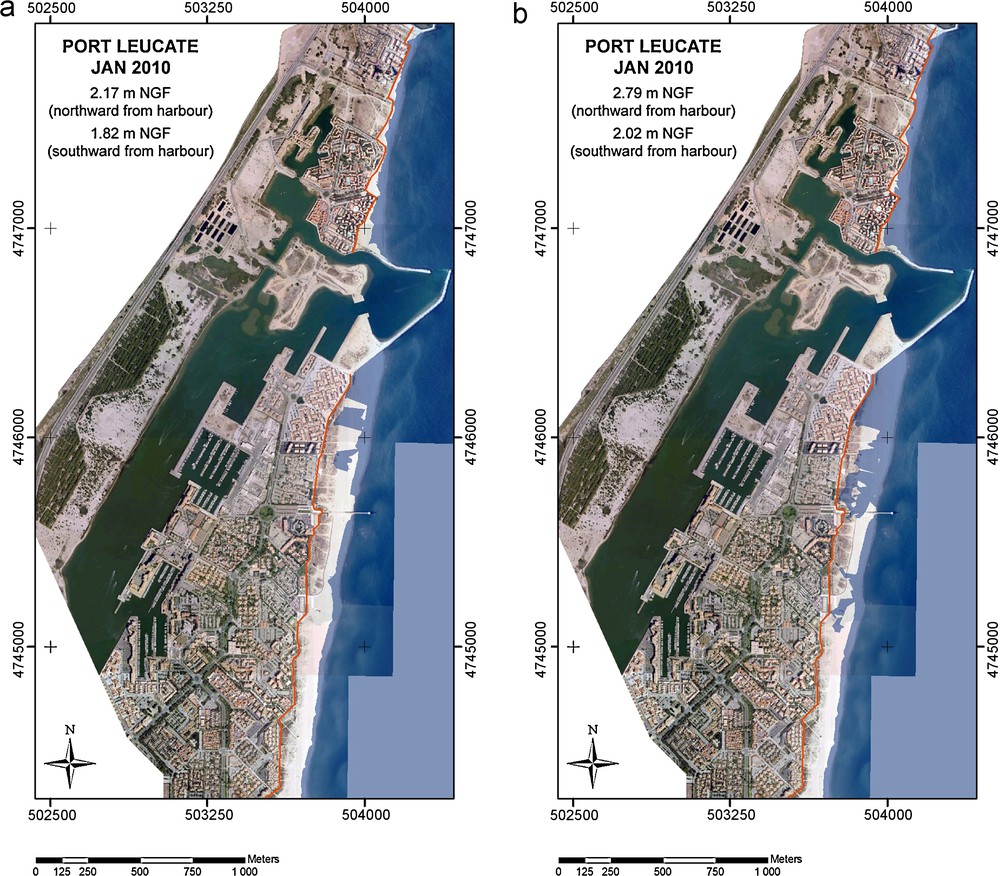
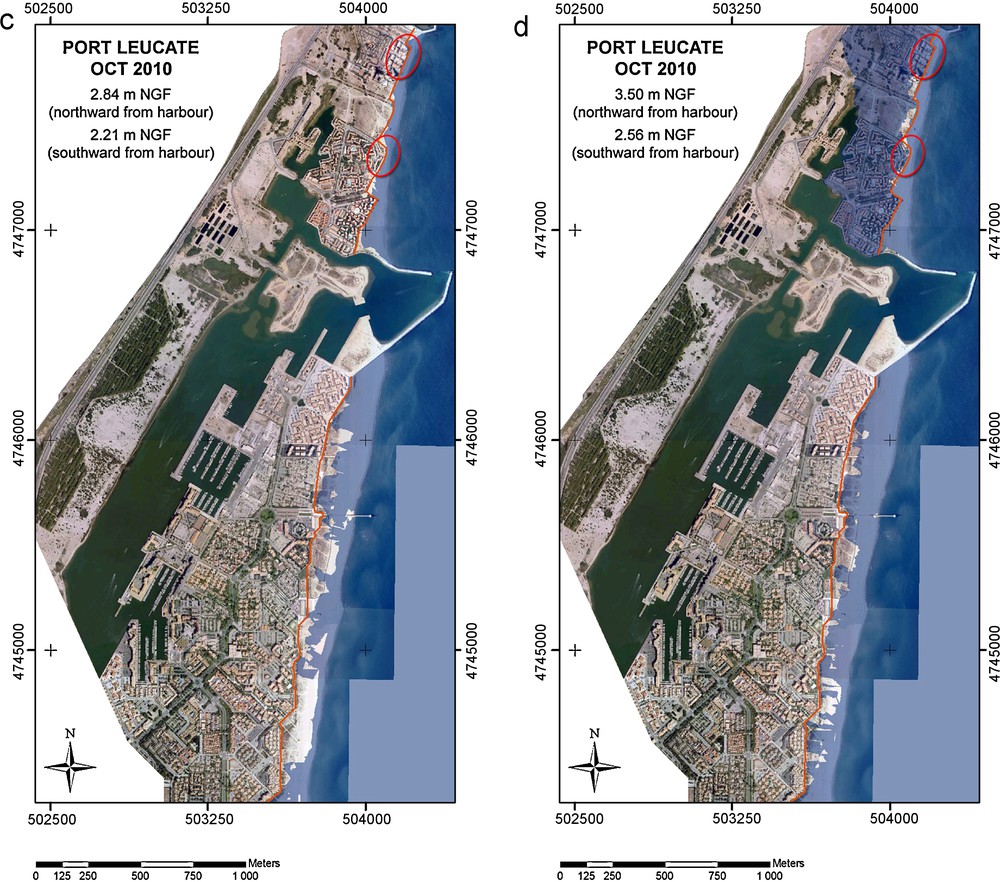
Flood simulations in Port-Leucate, for the storms of January (a and b) and October (c and d) 2010. The orange line indicates the waterfront walk-way limit. Red circles show urban areas partially flooded during the storm of October 2010, according to oral witnesses.
Simulation des inondations à Port-Leucate pour les tempêtes de janvier (a et b) et octobre (c et d) 2010. La ligne orange indique la limite de la promenade de front de mer. Les cercles rouges localisent les zones urbaines partiellement inondées pendant la tempête d’octobre 2010, d’après les témoignages.
Flood simulations reveal that the beach is largely flooded during the October storm, much less in January. In October, the water would rise up in many places to the edge of the waterfront walk-way. A significant difference occurs especially northward from the harbour, depending on the modelling method used (P24, Fig. 3). If we consider maximum heights estimated by the SWAN®-STK method, the beach is completely flooded, but the water does not reach residential areas located backward and below (Fig. 4c). The situation is different if we consider water levels estimated by the STK method (Fig. 4d). In that case, the waterfront walk-way (altitude between 2.9 and 3.7 m) is flooded in many places and water is spreading over all urban areas.
Validation criteria for selecting one or the other of the two approaches are few. Indeed, there is no video monitoring system in place on Leucate beaches. However DREAL LR services mention in their reports oral witnesses collected just after these two storms (DREAL LR, 2010a, b). These witnesses all report large flooding of beaches in October but not of the waterfront walk-way southward from Port-Leucate harbour. In October, floods only occurred northward from the harbour where houses located in areas where the beach is narrow were partially flooded. But no witnesses refer to widespread flood of all urban areas, as shown by the STK simulation approach, which appears to overestimate the real situation. Conversely, the SWAN®-STK approach seems to underestimate the situation, since no houses are flooded. For the storm of October 2010, a photograph acquired on October 11th during the afternoon (between noon and 6 PM) close to profile 25 is also available. The photograph shows that the beach was completely flooded, the waves swept over the low wall delimiting the waterfront walk-way, partially flooding the area located backward (Fig. 5). Although the DEM is incomplete in this area, the wall heights–base and top–are precisely known. According to these data, a complete submersion of the beach involves a water level higher than 1.7 and waves overtopping over the wall 2.5 m high. On Fig. 3a (between the 132nd and the 138th hour), the model estimates show maximum levels varying respectively from 2.77 to 2.03 m and from 2.46 to 1.88 m for the STK and SWAN®-STK methods, with a swash component (Δhsw) representing a part of the total level up to 1.37 m (Fig. 3a). Thus, the modelling underestimate reality for the mean surge level because the sum of the first 5 components, including the wave set-up but excluding the swash, is always lower than 1.7 m. On the other hand, it seems to reflect reality quite well for the maximum water levels (H total) because the 2.5 m height is approached or exceeded, which generates a wave overtopping as we can see on the photograph–even if water levels only approach the 2.5 m height, waves breaking against sea walls could throw water higher than the maximum wave run-up that would have resulted if the waves would have broken on a shoreline without any coastal structure.
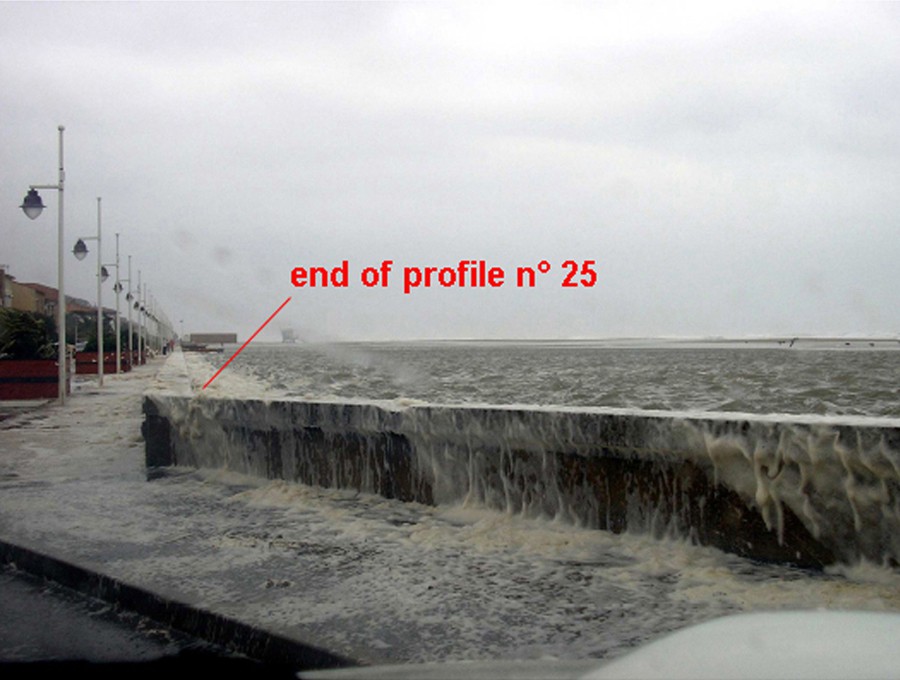
Submersion of the waterfront walk-way in Leucate-Plage, October 11, 2010. The top of the wall is 2.5 m NGF, its base on the road side is 1.7 m.
Submersion de la promenade de front de mer à Leucate-Plage le 11 octobre 2010. Le sommet du muret est à 2,5 m NGF, la base côté route à 1,7 m NGF.
Source and acquisition time: DREAL LR, October 11, 2010, during the afternoon, between 12 and 18 PM.
5 Discussion
Our integrated parametric approach with regard to flood hazard holds many advantages: (i) it provides a method to work on the various components that constitute a storm extreme level; (ii) it considers essential, but often neglected, hydrodynamic processes related to the wave action within the surf zone, such as wave set-up and swash; (iii) it allows the mapping of flooded areas during storm events, through the use of a water propagation model; (iv) it can be applied to conduct prospective analysis by modelling the various components of a storm extreme level through different scenarios. However, this approach has several limitations.
First, it does not necessarily take into account all complex hydrodynamic interactions involved in the formation of storm extreme levels, since it relies on empirical formulations, particularly for wave set-up and swash modelling.
Secondly, the data required for modeling are sometimes difficult to acquire. For instance, tide gauge stations are rarely close enough to studied beaches to allow direct application; this often prevents to have accurate values of storm surges at the beginning of each profile (the Δhm, Δhp and Δhsv components), even if the wind set-up modelling using the ADCIRC software gives a good estimate of the Δhp and Δhsv components (cf. § 3.2.2). The use of bathymetric profiles acquired several months prior to storm events to calculate beach slopes constitutes another limitation. This assumes that no morphological changes occurred over the elapsed time period. However, this limitation is inevitable, just because surveys are technically impossible to do during storm episodes. Uncertainty can be reduced by working on profiles in areas where no storm has occurred between the surveys and the storm modelling: in our study, this is the case for modelling the storm of January 2010, it is less so for the storm of October 2010, which came after the previous one.
The difficulty to estimate the beach slope (βf) as advocated by Stockdon (cf. § 3.2.2) constitutes an accuracy limiting factor in the modelling of wave set-up and swash, since one is forced to consider the foreshore slope, as has been done in many recent studies. However, this slope is very close to the βf slope, particularly during periods of winter storms, during which the action of breaking waves tends to remove sand from the berm and smooth the beach profile, leading to a fairly steady beach slope (Certain, 2003; Durand, 1999).
Finally, process modelling is hampered by the lack of fieldwork measurements for calibration and validation of the models. In France, direct measurements of extreme water levels reached on beaches during storms were nonexistent until very recently. Oral interviews and photographs are the only available data to validate models, as was the case with the first two storm events on which we worked. In the U.S., however, many studies include field measurement campaigns of wave set-up using pressure sensors for several weeks (Holman and Sallenger, 1985; Lentz and Raubenheimer, 1999; Nielsen, 1989; Ruggiero et al., 2004). In addition, video monitoring systems have been used since the 1980s to assess wave set-up and run-up heights during storm events (Foote and Horn, 1999; Foote et al., 2002; Holman and Guza, 1984; Ruggiero et al., 2004). Such systems have been implemented recently in France on South-West beaches and in Languedoc (Almar et al., 2008). These systems constitute essential instruments in the modelling process, because they are used to calibrate and validate models on the basis of well-known events.
6 Conclusion and prospects
The storms that periodically hit the coast of Languedoc lead to recurrent episodes of coastal flooding. It is evident that the commonly accepted threshold of 2 m NGF for mapping vulnerable areas is insufficient. Considering exclusively tide gauge observations, regardless of the effects related to wave phenomena within the surf zone (wave set-up and swash), this threshold is regularly exceeded during most severe storms. The method presented here aims to improve the assessment of extreme storm-related water levels, by decomposing an extreme level into its various components: astronomical, barometric tides and wind set-up (which are related to storm surges), wave set-up and swash. It has been applied on the coast of the Leucate district in order to reconstruct sea levels reached during two well-documented storm events (January and October 2010). Wave set-up and swash were taken into account by coupling the SWAN® numerical model for swell propagation with Stockdon's formula. Once extreme levels were determined, they were used to simulate flood propagation in urban areas through numerical modelling.
Results are consistent with findings derived from visual observations and oral interviews collected for these two storm events. They highlight the dominant influence of wave set-up and swash on the maximum levels reached (at least two-thirds of the maximum wave height computed for each simulation). They confirm that considering only storm surges may lead to significant underestimation of storm extreme levels. Therefore, it is important to support such modelling efforts of wave set-up and swash and to implement means to assess directly these two phenomena. To this end, video monitoring systems for coastal zone management and engineering seem to be attractive alternatives because they are used to calibrate and validate the models. This retrospective approach (modelling of past storm events) is a prerequisite step to use the models for forecasting purposes, to predict maximum heights that can be reached in the future, in the context of the ongoing rise in relative sea level. The method presented here lends itself particularly well to this type of approach because it allows to work individually (e.g. with probabilistic approaches) on each of the components constituting a storm extreme sea level.
Acknowledgments
We wish to thank the DREAL Languedoc-Roussillon for supplying swell and tidal data used in this study. We would like to thank the reviewers for their constructive and valuable comments and suggestions which have improved the quality of our initial manuscript. Special thanks to Ghislain de Marsily for encouragement and reviewing the English translation.
i Irribaren number ξ0 = β/√(H0/L0) where β is the foreshore slope.
iii When ξ0 < 0.3, R2 = 0,043 H0 L01/2.