

1 Introduction
Nearshore sandbars are often characterised by the presence of rhythmic or quasi-rhythmic features such as crescentic patterns and rip channels. The dynamics of these three-dimensional patterns is characterized by a wide range of temporal and spatial variability, undergoing different ‘states’ depending on the wave energy, the short-term history of the bar, the beach slope and the sediment characteristics. From these parameters, three main beach states were identified as dissipative, intermediate and reflective states (Wright and Short, 1984). Intermediate beaches were further divided into four sub-states. Immediately below the high-energy dissipative state is the Longshore Bar and Trough (LBT), then the Rhythmic Bar and Beach (RBB), next Transverse Bar and Rip (TBR) and finally the Low Tide Terrace (LTT) or ridge and runnel system (Wright and Short, 1984). These rhythmic features guide and constrain intense horizontal circulations driven by alongshore differential broken-wave energy dissipation (Bonneton et al., 2010) into strong offshore currents across the bays. The so-called rip currents (MacMahan et al., 2006) play an important role during storm events, as they determine the place where localized beach and dune erosion occurs (Thornton et al., 2007). Therefore, understanding sandy pattern dynamics and their link with hydrodynamics forcing is of strong interest for coastal risk assessment.
The phenomena involved in 3D sandbar dynamics are complex. This is now established that the development of 3D patterns can be attributed to self-organization processes (Coco and Murray, 2007), that is, the positive feedback between bottom perturbations, sediment processes and hydrodynamics (waves and currents). The sandy patterns that arise through self-organisation are called morphodynamic instabilities. Their emergence is commonly analysed using either Linear Stability Analysis (LSA) or Non-Linear Stability Analysis (NLSA) models (Calvete et al., 2005; Klein and Schuttelaars, 2006; Smit et al., 2008).
LSA models focus only on the initial development stage of instabilities (infinitesimal perturbations). As they are exploratory models, they are commonly used for understanding the mechanisms governing sandbar dynamics rather than making quantitative comparisons with field data. Typical LSA studies commonly consist in making sensitivity analysis, for instance considering slight variations in wave conditions (Calvete et al., 2005; Deigaard et al., 1999) or on bed profiles (Calvete et al., 2007; Damgaard et al., 2002; Deigaard et al., 1999). These studies showed, among other findings, that wavelength of instabilities increases with increasing wave obliquity and that the effect of wave period can be different if shore-normal or oblique waves are considered. The emerging pattern characteristics were also found to be as sensitive to the initial beach profile as to wave conditions. More recently, Tiessen et al. (2010) used a LSA for predicting the development of observed morphological patterns of a real double-barred beach with the purpose to validate LSA as a potential coastal engineering tool. Most of these studies focused on single-barred beaches and the investigations of double-barred beaches dynamics with LSA are limited (Coco and Calvete, 2009; Klein and Schuttelaars, 2006).
In the present study, rather than in-depth investigating the physical processes involved in sandbar dynamics, the objective is to determine whether LSA can characterize the overall 3D beach response, considering a wide range of hydrodynamic and morphodynamic configurations. To that purpose, a key step is accurately characterizing both the wave climate and a basic state bathymetry. The considered site is Truc Vert beach (French Aquitanian coast) which is a double bar system, i.e. a beach characterized by two alongshore submarine bars (one outer bar and one inner bar, Fig. 4). Typically, the outer bar (more seaward) and the inner bar (more shoreward) exhibits crescentic patterns and a Transverse Bar and Rip morphology, respectively (Castelle et al., 2007).

Cross-shore profiles of the two idealized bathymetries: post-storm (dashed line) and quite weather (solid line) conditions bathymetries (Z (m), the altitude, is defined in relation to the Lowest Astronomical Tide level).
Profils perpendiculaires à la côte des bathymétries idéalisées : bathymétrie tempête (pointillé) et bathymétrie temps calme (ligne continue) (l’altitude Z (m) est définie par rapport au zéro hydrographique).
The article proceeds as follows: Section 2 presents the site description and gives some background about Truc Vert beach. Section 3 describes briefly the LSA model Morfo60 (Calvete et al., 2005). Section 4 deals with the choice of scenarios for actual climate conditions. Section 5 is dedicated to the analyses of the numerical results for these conditions. Conclusions are drawn in Section 6.
2 Description of the site
2.1 General settings
The Aquitanian Coast (SW France) is an approximately 250 km long straight low coast bordered by high aeolian dunes. The tide is of meso-macro type, with a mean tidal range of 3.2 m and about a 5 m maximum tidal amplitude during spring tides. The sediments are composed of fine to medium quartz sand with mean grain sizes ranging from 200 to 400 μm (Pedreros et al., 1996).
This coast is exposed to high energy Atlantic waves. Waves at the Aquitanian Coast are generated by west-east tracking subpolar deep low pressure systems over the North Atlantic Ocean. They are, therefore, strongly seasonally modulated. A significant interannual variability of the wave climate is related to the NAO Index (Charles et al., 2011; Dupuis et al., 2006; Le Cozannet et al., 2011). Wave conditions vary from north-west reasonably low-energy waves during summer and occasional storms with a mean north-west direction to very high-energy west to WNW swells during winter. Since 1998, most of the field experiments along the Aquitanian Coast took place at Truc Vert beach (Fig. 1) because it is both considered as being representative of most of the Aquitanian Coast beaches and non-exposed to human activity.

Location of the study area.
Emplacement du site d’étude.
2.2 Beach morphology
Truc Vert beach has received increasing attention over the last decade. This stretch of coastline has been studied through different approaches: hydrodynamic measurement analysis (Butel et al., 2002), topographic surveys (De Melo Apoluceno et al., 2002; Sénéchal et al., 2009), satellite imagery analysis (Lafon et al., 2004, 2005), numerical modelling (Castelle and Bonneton, 2006) and time exposure imagery (Almar et al., 2010). Truc Vert beach has been observed to be systematically double-barred.
The inner bar has been found to go through all the states within the intermediate classification of Wright and Short (1984) with the Transverse Bar and Rip (TBR) morphology observed most of the time (58% of occurrence according to Sénéchal et al., 2009). This morphology becomes a Low Tide Terrace (LTT) morphology (16% of occurrence according to Sénéchal et al., 2009) after at least 10 days of fair weather conditions (Castelle et al., 2007). The other morphologies, i.e. the Rhythmic Bar and Beach (RBB) and the Longshore Bar and Trough (LBT) states have 14% and 12% of occurrence (Sénéchal et al., 2009), respectively. Based on satellite Spot imagery and considering the alongshore wavelength as the mean rip spacing, Lafon et al. (2004) showed that the inner bar alongshore wavelength ranges from 370 to 463 m.
The outer bar exhibits quasi-persistent crescentic patterns (Fig. 2), i.e. a RBB morphology. The average alongshore wavelength of the outer crescentic bar ranges from 579 to 818 m (Lafon et al., 2004). The outer bar geometry vary from a typical crescent shape to a strong asymmetric shape with the landward part of the bar being linear and oriented NW-SE (Lafon et al., 2004). Only during severe storms the outer bar was suspected to reshape into a shore-parallel linear bar (Castelle et al., 2007), resulting in a LBT morphology. This was recently corroborated by video observations during a storm event with significant wave height (HS) of about 8 m (Almar et al., 2010). Of note, the inner bar rhythmicity sometimes appears to couple to that of the outer bar (Castelle et al., 2007), which is in line with previous observations of other double sandbar systems (Ruessink et al., 2007) and was recently depicted through linear (Coco and Calvete, 2009) and nonlinear (Castelle et al., 2010; Thiébot et al., 2012) stability analysis. Accordingly, coupling will not be addressed in this contribution.
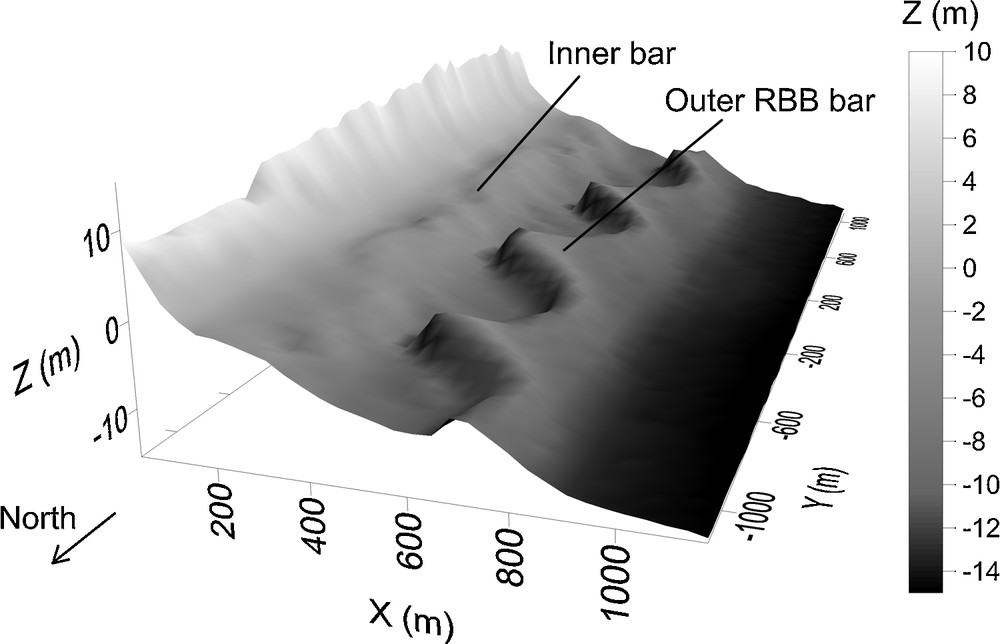
Typical morphology of the Truc Vert beach: outer bar: rhythmic bar and beach (RBB) (600 < λ < 800); inner bar: no clear rhythmicity (from the ECORS survey, February 2008, from Parisot et al., 2009). Z (m), the altitude, is defined in relation to the Lowest Astronomical Tide level.
Morphologie typique de la plage du Truc Vert : barre externe : Rhythmic Bar and Beach (RBB) (600 < λ < 800) ; barre interne : aucune rythmicité visible (campagne ECORS, février 2008, de Parisot et al., 2009). Z(m), l’altitude, est définie par rapport au zéro hydrographique.
3 Model description
The morphological model used in this study, Morfo60 (Calvete et al., 2005), is based on linear stability analysis. It is used to identify the morphological instabilities that can arise from self-organization processes. This model is based on depth- and wave-averaged continuity and momentum equations, coupled with wave-energy, wave-phase and sediment conservation equations. Waves are assumed to dissipate their energy according to the model of Thornton and Guza (1983). In the momentum equation, the Reynolds stresses are parameterized using a horizontal viscosity coefficient (Battjes, 1975) and the bed shear is described using a linear friction law. The sediment flux calculation is based on the formula of Soulsby (1997). It includes the contribution of bedload and suspended load, as well as gravitational downslope sediment transport (for more details about the model: Calvete et al., 2005).
For each simulation, the input parameters are an alongshore-uniform bathymetry (the bed level depends only on the cross-shore distance to the coast, as for instance in Fig. 3a), the characteristics of the offshore waves (significant wave height: HS, peak period: TP and peak direction: DP) and a water level which includes the contribution of both tide and storm surge (the level is given relatively to the Lowest Astronomical Tide level). This defines a basic state which is time-invariant, i.e. in equilibrium with all the alongshore-uniform dynamical variables. The LSA consists in adding periodic perturbations of different wavelength to the basic state solution, assuming a quasi-steady state. The response of the system to the perturbations is analysed with the relationship between the growth rate and the perturbations wavelength (Fig. 3b). Depending on their characteristics, the perturbations are amplified at different rate. The instability with the higher growth rate, called Fastest Growing Mode (FGM), is the one that is the more likely to emerge. Fig. 3b illustrates an example of computation. For the considered inputs, the maximum growth rate corresponding to the FGM is reached for λ = 750 m; the corresponding bathymetry and instabilities are plotted respectively in Fig. 3c and d. The model output are the characteristics of the morphodynamic response: the wavelength of the instabilities λ; its growth rate σ or its e-folding time denoted by “Efold” (“Efold” = 1/σ), that gives an indication of the characteristic formation time in nature; and its migration velocity in the longshore direction “Vmig”. Moreover the variable “Dist.-Pert.” (abbreviation for distance between the maximum perturbations amplitude and the shore) indicates the distance from the shore where instabilities emerge (inner or outer bar). This distance is measured graphically, as shown in Fig. 3c. In the following, the term instability refers to the FGM.
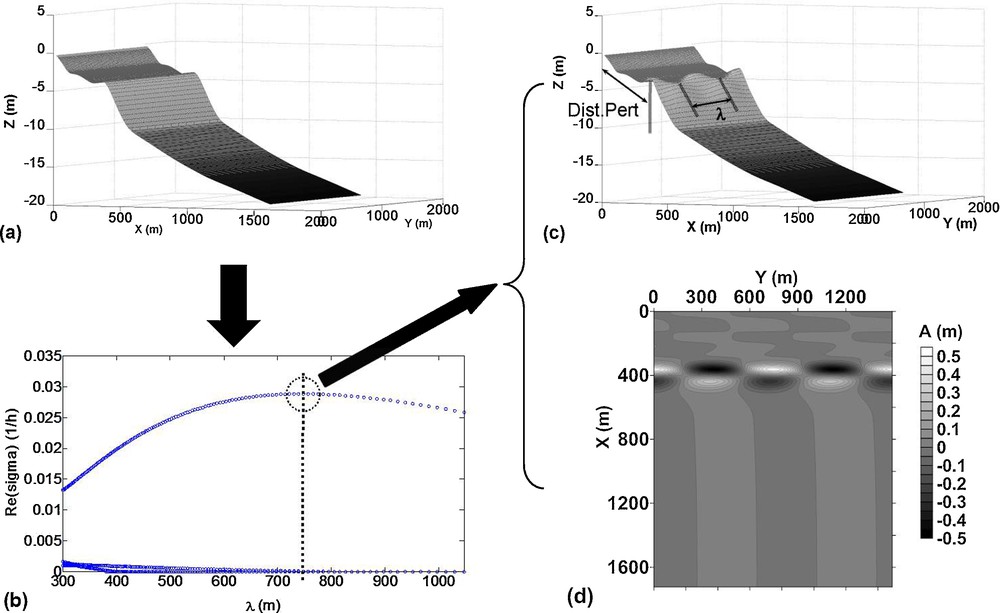
Illustrated principle of Morfo60. a: longshore uniform initial bathymetry; b: growth rate curve as a function of the instabilities wavelength (got for: significant wave height HS = 3 m; peak period TP = 11 s; incidence = 5°; and a sea level of 1.46 m above the Lowest Astronomical Tide level); c: initial bathymetry plus the perturbations for the Fastest Growing Mode; d: bed perturbations amplitude (A (m) is the amplitude value).
Principe de fonctionnement de Morfo60. a : bathymétrie initiale uniforme ; b : taux de croissance fonction de la longueur d’onde des instabilités (obtenu pour : hauteur significative de vagues HS = 3 m ; période pic TP = 11 s ; incidence = 5°; et un niveau marin égale à 1,46 m par rapport au zéro hydrographique) ; c : bathymétrie initiale plus les perturbations du Fastest Growing Mode (FGM : mode à croissance la plus rapide) ; d : amplitude des perturbations du fond (A (m) la valeur de l’amplitude).
In this study, simulations that give e-folding times longer than 50 days are not considered, as it is far larger than the typical time scale at which wave regimes change. The range of wavelength instabilities tested by Morfo60 in this study is between 100 to 3000 m. The upper value (3000 m) has been chosen intentionally high to avoid testing values too close to the observed values in the field and to check the ability of the model to find realistic wavelengths from a large range of possibilities.
For some configurations, the relation between the wavelength and the growth rate is characterized by two maxima (i.e. two FGM), meaning that two modes of instabilities with different wavelength emerge. In this case, if the maxima correspond to instabilities located on different bar, both FGM are considered independently. This configuration will be hereafter referred to as a “double point”. If the two maxima correspond to the same bar, only the instabilities with the higher growth rate will be kept.
4 Climate scenarios
To characterize the global beach dynamics, a limited number of configurations have been determined from field data. These configurations are combinations of: (1) idealized bathymetries (cross-shore profiles); (2) wave classes (significant wave height HS, peak period TP, peak direction DP); (3) tidal levels (given relatively to the Lowest Astronomical Tide level); and (4) storm surges. All these discrete combinations are representative of a large number of physical configurations commonly observed at this site. The method used to determine these configurations is detailed in the following section.
4.1 Bathymetries
Numerical studies show that the morphological response of a beach is strongly dependent on the initial beach profile, especially on the distance between bars and coast and on the depth of bars (Calvete et al., 2007; Damgaard et al., 2002). Field observations show that beach bathymetries and their morphological responses are very variable depending on close past and present meteorological conditions (Ruessink et al., 2007). Thus, to take into account the different beach configurations and the effects of events chronology, two initial cross-shore profiles are chosen. The first one is representative of high-energy conditions (Fig. 4, dashed line). It has two straight bars. The second one is representative of low-energy conditions (Fig. 4, solid line). It has the outer bar close to the inner. For these two profiles, the distance of the bar crest to the shore has been chosen from typical configurations observed in the field (ECORS campaign, 2008; Parisot et al., 2009). In the following, the high- and low-energy conditions bathymetries (alongshore-uniform bathymetries built from the two previous profiles) will be called the post-storm and quiet weather bathymetries, respectively.
4.2 Hydrodynamic conditions
4.2.1 Waves
The wave forcing has been synthesized into a limited number of wave conditions (HS, TP, DP), thanks to a classification algorithm. The use of wave classification is relatively recent and aims at obtaining a synthetic description of complex wave climate, classifying waves in homogeneous classes based on defined resemblance criteria (Butel et al., 2002). The classification algorithm used in this study is the K-Means algorithm, similarly to Le Cozannet et al. (2011). Each wave class is defined by its mean significant height (HS), peak period (TP) and peak direction (DP), and an empirical probability of occurrence.
The representative wave classes chosen at Truc Vert beach are given in Table 1. They have been obtained following different stages: first a wave classification has been made from NOAA WaveWatchIII data (Tolman, 1992) over the years 1997 to 2008 at an offshore point relatively close to the beach (45°N, 2.5°W; depth: 1100 m). Each of the 12 waves classes found following this first classification has then been propagated, with the code SWAN (Booij et al., 2004), at the offshore boundary of our calculation domain (44°44.65′N; 1°16.19′W; depth: 20 m). Finally, considering each wave class occurrence and according to expert judgment, the number of representative wave classes has been reduced to four (Table 1), their cumulative occurrence representing approximately 60% of time. The three first wave classes originate from WNW, the fourth originates from west (Incid.: the wave peak incidence is defined clockwise relatively to the shore-normal direction).
Classes de vagues représentatives à la frontière au large de notre domaine de calcul (coord. : 44°44,65′ N ; 1°16,19′W) avec HS : la hauteur significative des vagues (en m), TP : la période pic (en s), DP : la direction pic (°) mesurée dans le sens des aiguilles d’une montre par rapport au nord et Incid. : l’incidence correspondante par rapport à la normale à la plage (°).
| Wave Class Number | HS (m) | TP (s) | DP (°) | Incid. (°) |
| 1 | 1 | 6 | 291 | 10 |
| 2 | 2 | 10 | 286 | 5 |
| 3 | 3 | 11 | 286 | 5 |
| 4 | 4 | 13 | 271 | −10 |
4.2.2 Sea level: tide and storm surge
To study the effect of the sea level, three tidal levels corresponding to a mean spring tide are considered in our simulations: one Low Tide (0.62 m), one Mid Tide (2.46 m) and one High Tide (4.1 m) above the Lowest Astronomical Tide level. Moreover, the effect of a possible storm surge is studied adding the maximum observed storm surge to the sea level considered. The value of this maximum observed storm surge is 0.84 m close to Truc Vert beach (Pirazzoli, 2007). All these combinations of bathymetries, wave classes and sea levels represent 48 configurations to be performed by numerical simulation.
5 Results
In this section, the morphodynamic response associated to these configurations are presented and analysed. They are then compared with the available in situ observations.
5.1 Numerical results
The system behaviour is analysed here considering all the combinations of forcing (i.e. 12 configurations for each wave class). The results are presented in Figs. 5 and 6 for the quiet weather bathymetry and post-storm bathymetry, respectively.

Results for all wave classes, quiet weather bathymetry; a: λ, wavelength of instabilities (m); b: Efold, e-folding time (day); c: Vmig, migration velocity positive southward (m/h); d: Dist.-Pert, distance to the coast of the instabilities (m) (“+” corresponds to inner bar; “x” to outer bar).
Résultats pour les quatre classes de vagues, bathymétrie temps calme. a : λ, longueurs d’onde des instabilités (m) ; b : Efold, e-folding time (temps caractéristique de formation) (jour) ; c : Vmig, vitesse de migration positive vers le sud (m/h) ; d : Dist.-Pert, distance des instabilités à la côte (m) (« + » : correspond à la barre interne ; « x » à la barre externe).

Results for all wave classes, post-storm bathymetry; a: λ, wavelength of instabilities (m); b: Efold, e-folding time (day); c: Vmig, migration velocity positive southward (m/h); d: Dist.-Pert, distance to the coast of the instabilities (m).
Résultats pour les quatre classes de vagues, bathymétrie tempête. a : λ, longueurs d’onde des instabilités (m) ; b : Efold, e-folding time (temps caractéristique de formation) (jour) ; c : Vmig, vitesse de migration positive vers le sud (m/h) ; d : Dist.-Pert, distance des instabilités à la côte (m).
Rather than looking each case separately, the following analysis focuses on the global response of the system, describing its main tendencies through the four output variables.
The instabilities wavelength globally increases with increasing offshore wave height (Fig. 5a and Fig. 6a) except for one configuration (CL4 on post-storm bathymetry at High Tide plus storm surge, the right-hand point in Fig. 6a for CL4). When a double point is observed (see Section 3) (for CL3 and CL4 in Fig. 5a and Fig. 6a), the wavelength is systematically larger at the outer bar than at the inner bar (between 2.1 and 3.6 times the inner bar wavelength), which is in line with existing field observations of double sandbar systems (Van Enckevort et al., 2004). The relationship between the water level and the wavelength of the instabilities is more complex and differs from one wave class to another. Non-surprisingly, the e-folding time strongly increases with sea level (Fig. 5b and Fig. 6b): as the bar is deeper, depth-induced wave breaking dissipation across the bar is less intense and therefore drives weaker flow circulations. So the time, or the e-folding time, necessary to create instabilities increases.
The longshore migration rate increases with increasing wave height (Fig. 5c and Fig. 6c). Maximum alongshore migration of inner-bar rip channels typically occurs around mid tide.
The distance from the shore where instabilities emerge (inner or outer bar) depends only on wave height and sea level (Fig. 5d and Fig. 6d): the higher is the wave height, the higher is the sea level for which instabilities emerge on the outer bar. This might be explained by the fact that instabilities appear where the waves break (Van Enckevort et al., 2004), and the higher is the wave height, the most they break on the outer bar for higher sea levels.
Overall, instability behaviour is similar for the two bathymetries. Some differences between them exist due to the different depth of their bars. Firstly, instabilities emerge on the outer bar at higher sea level on quiet weather bathymetry rather than on post-storm bathymetry. Secondly, wavelengths and longshore migration rates of the instabilities are larger for the post-storm bathymetry than for the quiet weather bathymetry.
From these numerical results, the main system tendencies are: (i) a significant wave height (HS) of 1 m can leads to the emergence of rhythmic features for sea levels typically lower than Mid Tide; (ii) for HS of 2 m, instabilities can arise at the inner bar during the whole tidal cycle; (iii) for HS larger 3 m instabilities arise at the outer bar. This threshold value in HS of 3 m is in agreement with observations at Truc Vert beach, as only offshore waves larger than 3 m were observed to drive a significant morphological evolution of the outer bar (Castelle et al., 2007).
5.2 Typical pattern formation
The previous results show a large variability in the instabilities characteristics depending on the configuration considered (bathymetry, wave class and water level). Nevertheless, except for one configuration, all the simulated morphodynamic patterns have a similar shape, that is, a bar and rip system on inner bar and a crescentic bar on outer bar.
All these configurations do not have the same occurrence frequency as some combinations are more likely to occur. Our purpose is to relate a wave class to a particular instability. For a given wave class and bathymetry, the instability the most likely to emerge only depends on the water level and on its corresponding e-folding time (Fig. 5b and Fig. 6b). The histogram of a 10-year period of water level measurements at St-Jean-de-Luz is given in Fig. 7. The two most frequent water levels (1.50 m and 3.40 m) are readily apparent. As the e-folding time increases with water level (model results), instabilities are more likely to arise for the 1.50 m water level.

Histogram of measured sea level values (tide + eventual storm surge) during 10 years at the tide gauge of St-Jean-de-Luz (Aquitanian coast, 300 km down south of the Truc Vert beach).
Histogramme des niveaux marins mesurés (marée + éventuelle surcote) pendant 10 ans au marégraphe de St-Jean-de-Luz (Côte Aquitaine, 300 km au sud de la plage du Truc Vert).
Source: SHOM data (SONEL database)/SHOM, données SONEL.
These morphodynamic patterns are presented for the most common bathymetry, namely the quiet weather bathymetry, in Fig. 8, with their corresponding wavelengths and e-folding time given in Table 2. In Fig. 8, a crescentic bar (similar to RBB morphology) and a bar and rip system, with slightly transverse pattern, is observed at the outer bar and the inner bar, respectively. These beach states are comparable to the most common beach states observed at Truc Vert beach (Castelle et al., 2007; Sénéchal et al., 2009 and Fig. 2).

Example of emerging instabilities for the four wave classes and the quiet weather bathymetry (A, in m, represents the amplitude of the instabilities). The water level considered is 1.46 m above the Lowest Astronomical Tide level.
Exemple d’instabilités émergentes pour les quatre classes de vagues et la bathymétrie temps calme (A, en m, représente l’amplitude des instabilités). Le niveau d’eau est de 1,46 m par rapport au zéro hydrographique.
Longueur d’onde (λ en m) et temps caractéristique de formation (Efold. en jours) des instabilités pour chaque classe de vagues, obtenues avec la bathymétrie temps calme et le niveau d’eau de basse mer le plus fréquent.
| Inner bar | Outer bar | ||
| CL1 | λ | 351 m | No instability |
| Efold. | 8.5 days | ||
| CL2 | λ | 340 m | No instability |
| Efold. | 3.25 days | ||
| CL3 | λ | 345 m | 740 m |
| Efold. | 2.7 days | 2.8 days | |
| CL4 | λ | 419 m | 1496 m |
| Efold. | 2.2 days | 2.4 days |
The only configuration presenting a different morphodynamic pattern concerns the highest sea level (High Tide plus storm surge) for CL4 on post-storm bathymetry (Fig. 6). The corresponding instabilities are presented in Fig. 9b, together with the instabilities obtained with the same conditions at High Tide, in Fig. 9a. At High Tide plus storm surge, the instabilities present a particular pattern. Firstly, the wavelength is much smaller. Secondly, the bar and rip system are strongly oblique and only emerge on the crest of the inner bar (plotted as dotted line on Fig. 9). This is different from every other pattern, for which instabilities emerge simultaneously on the crest and on the offshore face of the inner bar (Fig. 9a and Fig. 8). However, this particular morphology has a very low probability to effectively emerge, as the probability of such level is weak and the corresponding e-folding time is long.

CL4 instabilities on post-storm bathymetry, a: Transverse Bar and Rip (TBR) morphology at High Tide level; b: shore oblique TBR morphology at High Tide plus storm surge level (the dotted line represents the crest of the inner bar, A (m) the instabilities amplitude).
Instabilités créées par CL4 sur la bathymétrie tempête, a : morphologie Transverse Bar and Rip (TBR) obtenue pour le niveau d’eau pleine mer ; b : morphologie TBR oblique à la côte obtenue pour le niveau d’eau pleine mer plus surcote (les lignes pointillées représentent la crête de la barre interne, A (m) l’amplitude des instabilités).
5.3 Discussion and comparison with observations
Morfo60 is an exploratory model dedicated to analyse the development of morphodynamic instabilities during their initial linear growth. Further nonlinear evolution and interaction between modes growing at different rates are not accounted for, while they can play important role in the morphodynamic evolution of the system. Moreover, the stability analysis is performed for stationary conditions (i.e. given water level and wave class) assuming initial alongshore-uniform beach profile and wave field. In reality, pre-existing alongshore variations can exist and can significantly influence the subsequent development of bed patterns (Tiessen et al., 2011). In addition, time-varying wave conditions have been found to lead to different spacing than for the time-invariant wave forcing as a result of nonlinear interactions (Castelle and Ruessink, 2011). Accordingly, LSA results should be considered with care, keeping in mind that they give prediction for the initial development phase of instabilities for idealized conditions.
In this study, LSA is applied to characterize the global morphological behaviour of Truc Vert beach, using idealized initial bathymetries. As the forcing is steady in our numerical simulations, it is possible to relate a given wave condition with preferred instabilities (Table 3). In the field, establishing this relation is difficult, as wave conditions persistently change with timescales smaller than typical morphodynamic time response (Smit et al., 2008). Accordingly comparison of model results with field data is not straightforward.
Longueur d’onde des instabilités (λ en m) calculée sur chaque barre (inner/outer bar), pour les quatre classes de vagues et les deux bathymétries (quiet weather/post-storm bathy.) pour tous les niveaux d’eau considérés.
| Inner Bar | Outer Bar | |||
| Quiet weather bathy. | Post-storm bathy. | Quiet weather bathy. | Post-storm bathy. | |
| Wave class 1 (m) | 331 to 351 | 263 to 403 | No instability | No instability |
| Wave class 2 (m) | 324 to 363 | 365 to 469 | 472 | No instability |
| Wave class 3 (m) | 345 to 398 | 383 to 587 | 739 to 748 | 885 |
| Wave class 4 (m) | 419 to 683 | 202 to 1013 | 1337 to 1611 | 1653 to 1698 |
| Measurements from satellite obs. (Lafon et al., 2004) | From 370 ± 146 m to 462 ± 188 m (min: 85 m; max: 1480 m) | From 579 ± 200 m to 818 ± 214 m (min: 248 m; max: 1569 m) |
As the beach morphologies predict by the model are consistent with observations, a qualitative comparison with available Truc Vert field observations is done below.
The instabilities wavelength values, presented in Fig. 5a and Fig. 6a, are summarized in Table 3; together with the observations in Lafon et al. (2004). The wavelengths of simulated rhythmic pattern are in fair agreement with the observations, except for CL4 (HS = 4 m) that overestimates the emerging wavelength. Concerning the e-folding time, predicted values are of the order of several days (between one and five days for most of the sea levels) which is realistic with respect to observations at Truc Vert beach. This is also consistent with Van Enckevort and Ruessink (2003) who observed the development of crescentic patterns within three days after a storm. For the longshore migration rate, values predicted by the model (Fig. 5c and Fig. 6c) are very strong (from 0.09 to 9.7 m/h) and much larger than those reported at Truc Vert beach (from 0.04 to 0.2 m/h, i.e. 1 to 5 m/d during summer, De Melo Apoluceno et al., 2002). The systematic overestimation of rip channel migration rates with nonlinear morphodynamic models has already been pointed out in Falqués et al. (2008). Yet, recent video observations from the ECORS’08 field experiment showed that the longshore migration of the outer bar crescentic patterns could exceed 20 m in a single day (0.8 m/h), for HS > 4 m with a high offshore wave angle to the shore (Almar et al., 2010).
Overall, the numerical results of the LSA model are relatively consistent with field observations at Truc Vert beach, particularly in term of shapes and wavelengths of the rhythmic features. The formation timescales of the instabilities from the model are realistic, but their migration rates are overestimated.
6 Conclusion
Linear stability analysis model have been mainly used in earlier studies to examine the underlying physical mechanisms that control the development of crescentic bed patterns and to investigate the sensitivity to physical parameters, like the effect of different wave conditions or different bed profiles (Calvete et al., 2005, 2007; Coco and Calvete, 2009; Damgaard et al., 2002; Deigaard et al., 1999). These studies have mainly focused on single bar beach and have compared model prediction with generic field spatial and temporal characteristics. Only recently, Tiessen et al. (2010) have used a LSA for predicting the development of observed morphological patterns of a real double-barred beach.
In this article, a linear stability analysis model has been used to determine the characteristics of morphodynamic instabilities emerging for different hydrodynamic and bathymetric conditions with application to the wave dominated meso-macro-tidal Truc Vert beach, which is double-barred. Model settings have been designed for two contrasting bathymetric profiles (representative of post-storm and quiet weather conditions), four wave classes, and a range of tide levels and maximum observed storm surge level representative of Truc Vert beach. The model predictions, developing outer bar crescentic patterns and bar and rip morphology at the inner bar, show a reasonable agreement with field observations in term of patterns and wavelengths. This application of a LSA model to a double sandbar system with an appropriate knowledge of the field site (beach profile, wave climate and tidal range) suggests that LSA can provide quantitative information on the 3D surfzone sandbar patterns that can be typically found along a given beach.
Nevertheless, our approach presents some limitation inherent to the use of linear stability analysis. Using a nonlinear model could be useful to estimate the possible differences in behaviour in the nonlinear regime. Concerning the input data, using wave classification gives a synthetic representation of the local wave regime. Thus, the analysis is restricted to a limited number of wave conditions. However, in the field the waves vary constantly. Discretizing the wave conditions with a higher sampling could improve our description of the system response.
Acknowledgments
This work has been supported by French research National Agency (ANR) through VMC 2006 program (project VULSACO, no. ANR-06-VUNL-009). Also we wish to thank Étienne Delvallée and Emmanuel Romieu.