

1 Introduction
In the Sahel, surface runoff constitutes the main source of water resources available for human, agricultural and pastoral activities. The mobilization and management of this resource in this region are very sensitive to the variability of climate (Mahé and Paturel, 2009) and require tools to quantify the runoff aptitude of the different types of soils of a catchment. However, the complexity of hydrological processes, their large variability in space and time, raise a number of basic questions on watershed hydrology (Beven, 1995; Blöschl and Sivapalan, 1995): at which scales do the major runoff physical processes occur? Which scales have to be selected for measurements and observations?
In recent decades, the evaluation of runoff has referred to experimental plots from 1 m2 to several tens of m2. These studies have shown and justified that runoff decreases with increasing plot surfaces. However, the causes of the identified scale effect are related to the characteristics of the plots, their localization on the hillslope and the objectives of each study. Thus, Cerdan et al., 2004, Gomi et al., 2008, and Mayor et al., 2011 justify the scale effect on plots by the spatial variability of soil infiltration capacity. Others indicate the dynamics of the intensity of precipitation (Stomph et al., 2002; Van de Giesen et al., 2005, 2011) and threshold effects for some processes (Le Bissonnais et al., 2006) or the development of emergent properties of soils at certain scales (Reaney et al., 2007).
In the Sahel regions, several “soil surface features units” have been identified (Casenave and Valentin, 1992) and their hydrodynamic and morphological characteristics play a significant role in the formation of runoff and the subsequent transfer within the hydrographic network. Consequently, variability in surface conditions, soil surface crusting, vegetation, and roughness can all produce different hydrologic regimes at different spatial scales.
In this study, we propose to analyze the scale effect on two types of surfaces:
- • cultivated soils;
- • degraded uncultivated soils, and we make an attempt to identify the factors explaining this observed scale effect.
2 Materials and methods
2.1 Study site, experimental design and measurements protocol
Runoff measurements were performed for 2 years (2010–2011) on the Tougou watershed (37 km2) located in the Sahel zone of Burkina Faso (Fig. 1). The geographical coordinates of its outlet are: 13° 40′ 56′′ N and 2° 13′ 39′′ E. It is characterized by a unimodal annual rainfall regime, and the average annual rainfall varies between 400 and 650 mm. Rainfall shows an irregular distribution over the year: large storms occurring from early or mid-May to mid- or late October provide 95% of the annual rainfall, while the other 7 months are dry. Rainfall from July to September is about 80% of annual rainfall. There has been, on average over 2 years, respectively nine, 13 and eight rainfall events (rainfall ≥ 1 mm) during these 3 months. In the high rainy season, rainstorms are recorded mainly in August and September, with maximum intensities that can reach 130 mm/h during 5 min and 70 mm/h during 30 min. The watershed, like other Sahelian watersheds, is characterized by Hortonian runoff because soils have little vegetation cover and encrusted surfaces, and a relatively deep aquifer with as main recharge points the bottom of the beds of the river network (Favreau et al., 2002).
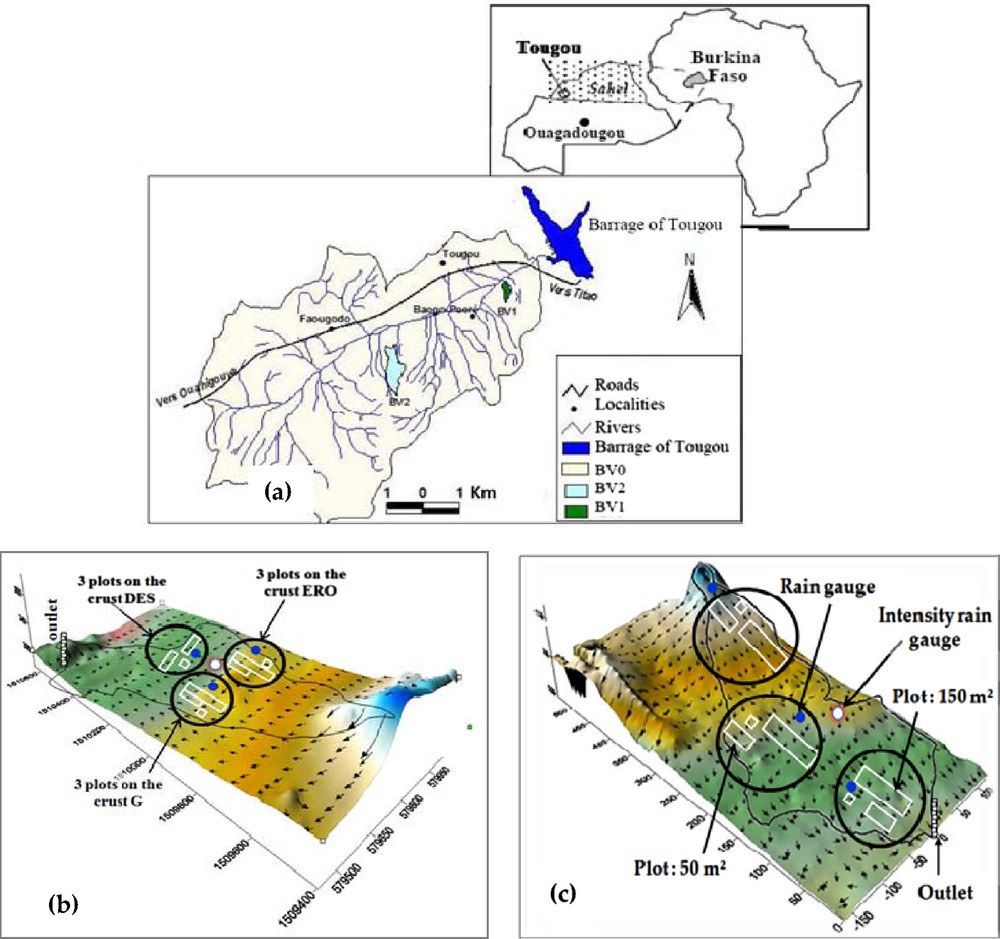
(a) The Tougou watershed and location of sub-basins; (b) sub-basin in degraded soils and experimental plots; (c) sub-basin in cultivated soils and experimental plots.
(a) Bassin versant de Tougou et localisation des sous-bassins ; (b) sous-bassin en sols dégradés et parcelles expérimentales ; (c) sous-bassin en sols cultivés et parcelles expérimentales.
In the catchment, two homogeneous hydrological units in terms of land use were identified on the basis of a thematic mapping of soils and cropping systems: the first hydrologic unit is a cultivated sub-basin (6.1 ha) and the second is a degraded uncultivated sub-basin (33.8 ha). These two units represent the main soil surface feature of the catchment area according to Casenave and Valentin (1992).
Inside each of these hydrological units, three sites were identified. On each site, a block of three plots (1 m2 (1 × 1), 50 m2 (10 × 5) and 150 m2 (25 × 6)) was installed. A network of 12 rain gauges (one per site) and five tipping bucket rain gauges (one per hydrological unit) were placed across the watershed to monitor the spatial variability of the rainfall. Each year, except for a few rainy episodes which were localised only on portions of the watershed, the entire rainfall network has always recorded some rain but with amounts varying between stations.
An overview of the experimental setup is shown in Fig. 1. The experimental design by soil surface types is presented in Table 1. Tillage, crop type and soil physical properties are described in Table 2. The hydrodynamic properties of the soil are strongly heterogeneous in cultivated areas, as evidenced by the magnitude of the parameter changes in this sub-basin. However, within the same site, the variations are much weaker. Thus, on each site, the hydrodynamic properties of the soil are assumed to be homogeneous. Only the micro-relief (slope and storage capacity) is different from one plot to another. Although the crop types are almost identical on the three sites, we observe a difference in the tillage type although we cannot tell if it is significant.
Dispositif expérimental de l’étude.
| Name of site | Name of the units | Type of hydrological surface | Size | Average slope (%) | Type of surface feature | Type of land use |
| Site S1 | S1-1 | Plot | 1 m2 | 1.60 | ||
| S1-50 | Plot | 50 m2 | 1.80 | |||
| S1-150 | Plot | 150 m2 | 1.35 | |||
| Site S2 | S2-l | Plot | 1 m2 | 1.70 | Cultural (C) | Cultivated soils |
| S2-50 | Plot | 50 m2 | 1.40 | |||
| S2-150 | Plot | 150 m2 | 1.60 | |||
| Site S3 | S3-1 | Plot | 1 m2 | 4.00 | ||
| S3-50 | Plot | 50 m2 | 4.20 | |||
| S3-150 | Plot | 150 m2 | 2.85 | |||
| Site S4 | S4-1 | Plot | 1 m2 | 0.75 | Erosion (ERO) | |
| S4-50 | Plot | 50 m2 | 1.25 | |||
| S4-150 | Plot | 150 m2 | 0.93 | |||
| Site S5 | S5-1 | Plot | 1 m2 | 0.90 | Gravelly (G) | Degraded and uncultivated soils |
| S5-50 | Plot | 50 m2 | 0.96 | |||
| S5-150 | Plot | 150 m2 | 0.80 | |||
| Site S6 | S6-1 | Plot | 1 m2 | 2.30 | Desiccation (DES) | |
| S6-501 | Plot | 50 m2 | 2.10 | |||
| S6-502 | Plot | 50 m2 | 3.55 | |||
| BV1 | Sub-catchment | 6.1 ha | 1.91 | Cultural (C) | Cultivated soils | |
| BV2 | Sub-catchment | 33.8 ha | 1.18 | ERO, G, DES | Degraded and uncultivated soils |
Labour, type de culture et propriétés physiques des sols des six sites.
| Site | Soil type | Tillage type | Crop type | Ksat (mm/h) |
Ksat (Casenave and Valentin, 1992) |
Bulk density Da (g/cm3) |
Porosity (%) |
| S1 | Loam | Light tillage + weeding + mounding | Millet, sorghum and cowpea | 21–25 | 1.40–1.46 | 45–47 | |
| S2 | Sandy | Means tillage + weeding + mounding | Millet, sorghum and cowpea | 27–33 | 15–35 | 1.36–1.44 | 46–49 |
| S3 | Sandy gravelly | Light tillage | Millet, sorghum and groundnut | 16–19 | 1.46–1.48 | 44–45 | |
| S4 | Dry clay | No tillage | No crop | 2–2.5 | 2–4 | 1.58–1.61 | 39–40 |
| S5 | Gravelly | 3–3.5 | 3–5 | 1.88–1.94 | 27–29 | ||
| S6 | Sand | 12–15 | 10–20 | 1.66–1.70 | 36–37 |
2.2 Methodology of analysis
Statistical analysis was conducted on runoff coefficients to detect the scale effect for each type of soil surface. The aim was to investigate whether on each soil surface type, the mean of the runoff coefficient (arithmetic mean of the event values) was equal or significantly different on the three observation scales. The statistical analysis was made to determine, for each soil surface characteristics, the minimum representative area of the elementary processes causing the runoff.
To that end, we applied a nonparametric test, the Kruskall-Wallis test, at the threshold of 5% using the TANAGRA software (H0 = equality of the mean values of the runoff coefficient of the three plots of the same site). The Kruskall-Wallis test is the generalization of the Mann-Whitney test, which compares two samples. The power of each test has been calculated to allow confidence in the obtained result, especially when it signals “not significant”.
Then, the sources of variation were analysed on the same surface characteristics, then between them.
Since the measured hydrodynamic properties are homogeneous, the assumption that the source of variation was the slope, which differs from one plot to another, was tested. To better understand the scale effect, it is necessary to remove the influence of the slope on the runoff. For this, we defined a dimensionless number Pr, which is the ratio of the runoff coefficient of the plot by the square root of its slope. This dimensionless number Pr can be considered as the potential runoff of the plot thus overcoming the effect of the slope on runoff production. This formulation is similar to Manning's equation, which also uses the square root of the slope. Indeed, the storage surface on each plot is dependent on the runoff intensity, in steady-state regime, and on a parameter (Lafforgue, 2009) relying on the characteristics of the plot (roughness and slope). An increase of the slope causes a decrease of the storage surface, and this effect is all the more significant since the slope is weak.
To approach the scale effect between two samples, we used a scale factor defined as the ratio between the dimensionless number Pr of the largest scale (Prl) and of the smallest scale (Prs). Van de Giesen et al. (2000) defined a similar ratio by directly using the runoff coefficients of the plots.
The heterogeneity of soil hydraulic properties was tested as a source of variation in runoff on soils with different surface characteristics. For this, we compared the runoff potential of plots of equal size.
In both cases, the observed scale effect was analysed by taking into account the rainfall characteristics.
3 Results and discussion
3.1 Spatial variability of runoff
Table 3 shows at various scales the mean runoff coefficient of the main soil surface characteristics of the watershed. A comparison of results obtained on units of different land use clearly shows that the runoff is significantly higher on bare and degraded soils than on cultivated ones. These results confirm those of Rey et al. (2004) and illustrate the role of vegetation in the protection against surface hydric erosion.
Pluviométrie et ruissellement observés pour les années 2010 et 2011 et pour différentes échelles.
| Location | Name of the plot | Year 2010 | Year 2011 | ||||||
| Total rainfall (mm) |
Runoff coefficient | Total rainfall (mm) |
Runoff coefficient | ||||||
| Average | Standard deviation | Coefficient of variation | Average | Standard deviation | Coefficient of variation | ||||
| Site S1: cultivated | S1-1 | 645 | 0.320 | 0.213 | 0.665 | 460 | 0.279 | 0.123 | 0.441 |
| S1-50 | 0.285 | 0.190 | 0.666 | 0.209 | 0.120 | 0.575 | |||
| S1-150 | 0.272 | 0.158 | 0.580 | 0.181 | 0.134 | 0.744 | |||
| Site S2: cultivated | S2-1 | 651 | 0.191 | 0.142 | 0.741 | 461 | 0.208 | 0.111 | 0.533 |
| S2-50 | 0.186 | 0.109 | 0.588 | 0.177 | 0.115 | 0.650 | |||
| S2-150 | 0.132 | 0.114 | 0.864 | 0.121 | 0.080 | 0.657 | |||
| Site S3: cultivated | S3-1 | 652 | 0.276 | 0.171 | 0.621 | 459 | 0.256 | 0.133 | 0.520 |
| S3-50 | 0.246 | 0.143 | 0.580 | 0.183 | 0.099 | 0.539 | |||
| S3-150 | 0.218 | 0.140 | 0.644 | 0.142 | 0.103 | 0.724 | |||
| Site S4: erosion | S4-1 | 654 | 0.654 | 0.206 | 0.315 | 468 | 0.696 | 0.151 | 0.217 |
| S4-50 | 0.711 | 0.217 | 0.305 | 0.760 | 0.132 | 0.174 | |||
| S4-150 | 0.613 | 0.209 | 0.341 | 0.657 | 0.145 | 0.222 | |||
| Site S5: gravelly | S5-1 | 663 | 0.726 | 0.213 | 0.293 | 466 | 0.770 | 0.154 | 0.200 |
| S5-50 | 0.658 | 0.229 | 0.348 | 0.700 | 0.146 | 0.209 | |||
| S5-150 | 0.599 | 0.221 | 0.369 | 0.640 | 0.152 | 0.238 | |||
| Site S6: desiccation | S6-l | 659 | 0.473 | 0.233 | 0.492 | 466 | 0.499 | 0.156 | 0.313 |
| S6-501 | 0.264 | 0.126 | 0.480 | 0.296 | 0.087 | 0.293 | |||
| S6-502 | 0.342 | 0.172 | 0.504 | 0.382 | 0.101 | 0.265 | |||
| BV1 | 649 | 0.159 | 0.076 | 0.478 | 460 | 0.142 | 0.073 | 0.518 | |
| BV2 | 664 | 0.484 | 0.153 | 0.316 | 473 | 0.497 | 0.093 | 0.188 |
In cultivated areas, the event values of the runoff coefficient of plots of 50 m2 vary from 4 to 58%. The average value of the runoff depth for each scale of observation varies from one site to another. The low values of runoff were measured on site S2 because of the hydrodynamic properties of the soil surface and the tillage type (Table 2). Low runoff occurs when rain falls after a dry period or after tillage of the plots. Tillage generally decreases the bulk density, increases the porosity and changes the granulometric distribution of the soil, which causes an increase in surface storage (decrease in the connectivity rate of furrows) and an increase in the soil seepage potential (Ahuja et al., 1998; Allmaras et al., 1966; Xu and Mermoud, 2001). On the other hand, the highest runoff takes place when the soil is already wet, and in the case of exceptional rainfall events and thunderstorms.
In bare and degraded environments, runoff varies according to the nature of the crust. It is much higher on erosion (ERO) and gravelly (G) crusts than on the desiccation (DES) crust. On the 50 m2 plots, the event values of the runoff coefficient vary between 16 and 95% for the ERO and G crusts, and between 10 and 70% for the DES crust. The lowest runoffs are generally caused by small amounts of rain, which correspond to low-intensity rainfall events. On the other hand, the high runoff coefficients are recorded during high-intensity rainfall events even if the total amount of rainfall is not very large.
3.2 Statistical analysis of the runoff at various scales
The results of statistical tests applied to the obtained runoff coefficient series are shown in Table 4. The size of each series is 41 for the plots in cultivated areas and 52 in bare and degraded environments. According to the Kruskal-Wallis test, the H0 hypothesis (equality of the mean values of the runoff coefficient of the three plots at the same site) is accepted for the two cultivated sites S1 and S3, and rejected for the four other sites. However, the power of the tests for these two sites is not satisfactory when we consider the low obtained values. For the last cultivated site S2, the hypothesis H0 is rejected and the values of the power of the tests are acceptable: there is a consensus to consider a power of 80% suitable for a first kind risk. Note that the larger the sample size, the higher the power. Additional measurements must be carried out on these three sites to conclude on the equality or not of the means of the runoff coefficients.
Résultats des tests statistiques.
| Name of the site | Type of plot | Name of the test | ||||
| Kruskal-Wallis | Mann-Whitney | |||||
| Results | Hypothesis H0 | Results | Power of the test (%) |
|||
| Hypothesis H0 | Power of the test (%) |
|||||
| Site S1: cultivated | 1 m2 | Acc | 31 | Acc | 20 | |
| 50 m2 | Acc | 38 | ||||
| 150 m2 | Acc | < 10 | ||||
| Site S2: cultivated | 1 m2 | Rej | 67 | Acc | < 10 | |
| 50 m2 | Rej | 64 | ||||
| 150 m2 | Rej | 64 | ||||
| Site S3: cultivated | 1 m2 | Acc | 54 | Acc | 22 | |
| 50 m2 | Acc | 54 | ||||
| 150 m2 | Acc | 19 | ||||
| Site S4: erosion | 1 m2 | Rej | 90 | Rej | 85 | |
| 50 m2 | Rej | 86 | ||||
| 150 m2 | Acc | 54 | ||||
| Site S5: gravelly | 1 m2 | Rej | 84 | Rej | 82 | |
| 50 m2 | Rej | 85 | ||||
| 150 m2 | Acc | 62 | ||||
| Site S6: desiccation | 1 m2 | Rej | 96 | Rej | 94 | |
| 50 m2 | Rej | 95 | ||||
| 50 m2 | Acc | 75 |
On the other hand, on bare and degraded sites, the high values of the power of the test confirm the alternative hypothesis: the average runoff coefficients at the tested scales are significantly different. According to the Mann-Whitney test, the mean values of the plots of 50 and 150 m2 are equal but significantly different from the 1 m2 plots at the threshold of 5%. From these results, we can say that on degraded sites, a plot of 50 m2 is sufficient to study the elementary processes of runoff generation.
3.3 Measure of the scale effect
Fig. 2 shows the average values of the scale factor of the plots. A trend is observed on degraded soils. The ratio of runoff potential between plots of 50 and 1 m2 is about 0.86 for the erosion and gravelly crusts and 0.60 for the desiccation crust. This means that for a slope length ratio equal to 1/10, an isolated plot of 1 m2 generates about 1.16 times more runoff per unit surface than an area of 50 m2 for the erosion and gravelly crusts, and about 1.66 times more for the desiccation crust. Moreover, the ratio of potential runoff between the plots of 150 and 50 m2 is equal to 1 for the three crusts. This also confirms the results of the statistical analysis of the functioning of the plots in degraded areas. We can confirm that it is the same dominant processes that occur at both scales. It can be assumed that beyond a length of 10 m (= length of the plot of 50 m2), there is sufficient runoff energy for the entire flow from upstream to reach the downstream of the plot.
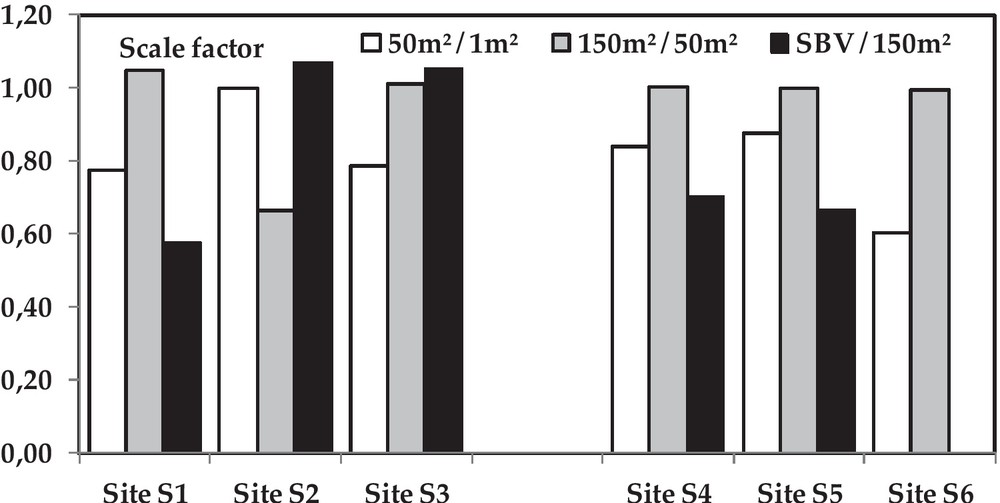
Scaling factors for runoff at different scales of observation on six sites (S1 to S3: cultivated sites; S4 to S6: degraded sites).
Facteurs d’échelle pour le ruissellement à différentes échelles d’observation pour les six sites (S1 à S3 : sites cultivés ; S4 à S6 : sites dégradés).
On cultivated soils, the values of the scale factor vary much more, depending on the site: this is due to the heterogeneity of the soil surface characteristics of the sub-basin. Sites S1 and S3 have a similar hydrological behaviour; the ratio between 50 and 1 m2 plots is about 0.77. However, the same ratio between the plots of 150 and 50 m2 is about 1.03. This means that the runoff-generating surfaces on the plots of 50 m2 are fragmented whereas they are connected on the plots of 150 m2. This phenomenon can be explained by the depressions caused by the tillage. This dimensionless analysis confirms that both in cultivated soils and bare and degraded soils, runoff decreases as the plot size increases.
3.4 Factors explaining the scale effect
In order to understand the causes of this scale effect, we compared the mean runoff coefficients per plot of the same size, and the runoff coefficients by events of three plots on each of the soil surface types.
The comparison of plots of the same size showed that the mean runoff coefficient varies significantly from one site to another. These results concur with those of Cammeraat (2004) and show that the measurement site strongly influences the results. They are related to the variation of the hydrodynamic properties of soil surface characteristics: slope and in cultivated areas, tillage techniques (Table 2).
At the same scale of observation, the production of runoff depends more on the hydrodynamic properties of soils surface characteristics than on the rainfall parameters. Some results of the comparison between the runoff coefficients per rainfall event on the three plots within the same site are illustrated in Fig. 3. The coordinates of each point correspond: on the x-axis, to the event runoff coefficient of the smaller plot and on the y-axis, to the event runoff of the largest plot. The black dots in Figs. 3a,b correspond to rainfall events of short duration or low intensity.
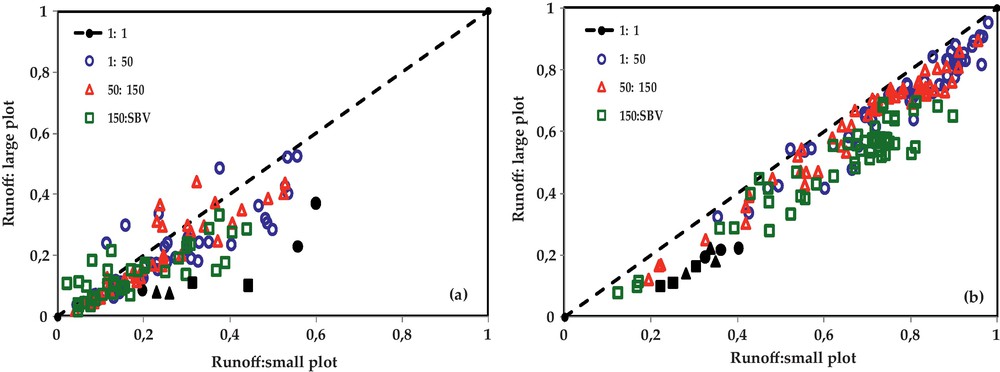
Comparison by event of the runoff coefficients of three plots set up on each of the surface textures: (a) cultivated site S3; (b) degraded site S5.
Comparaison, par évènement, des coefficients de ruissellement de trois parcelles installées sur chacune des textures de surface : (a) site cultivé S3 ; (b) site dégradé S5.
On degraded and bare soils (Fig. 3b), we see that almost all dots in the cloud are below the diagonal. The surface characteristics have not changed, the slope of the plots and the dynamics of precipitation are the only sources of variation.
On the cultivated soils (Fig. 3a), the results are a little mixed due to the edaphic soil conditions (tilled or not) of the plots which are not the same before each rain event. Some dots on the three graphs are above the diagonal. They correspond to the points where the conditions of surface characteristics are different. For example, some (150: SBV) dots are above the diagonal because the plot of 150 m2 is tilled while much of the sub-basin is not. If the soil moisture and surface characteristics are comparable, the runoff decreases with the increase in the plot size.
The analysis by class of rainfall events corroborates those of Stomph et al. (2002) who showed that the decrease in runoff with increasing slope length becomes more pronounced with shorter rain duration.
4 Conclusions
The results presented in this article illustrate the complexity of the hydrological processes and the number of parameters involved in the genesis of runoff. Through this study, we identified and analysed at different plot scales the causes of the well-known phenomenon of “decreasing runoff when the area of the plots increases”. Our results show that the scale effect observed in the runoff is mainly due to the spatial heterogeneity of soil-surface characteristics. It becomes more pronounced when the duration of the rain decreases.
For both cultivated and bare and degraded soil surfaces, the scale effects are not the same and the position on the hill slopes of measurement plots strongly influences the results.
On the basis of statistical and dimensionless analyses, the results show that in degraded environments, the runoff generation processes on plots of 150 and 50 m2 are identical and significantly different from those on the 1 m2 plot. In cultivated areas, additional measures are needed to better understand the differences in functioning at various scales. In cultivated areas, the tillage increases soil infiltration, and reduces the connectivity of runoff areas.
Indeed, the scale effect issue is critical when attempting to transpose to larger spatial scales, the knowledge of the processes discovered at the scale of a plot. Our results are consistent with other studies that indicate the existence of a large-scale effect between the plot and the watershed.
Acknowledgments
The study received financial support from the European Union within the framework of the AMMA program (African Monsoon Multidisciplinary Analyses), the Swiss Cooperation (SDC) and IRD/HSM (HydoSciences Montpellier). The authors thank all field observers, technicians and trainees who contributed to data collection. They also thank the two reviewers Pierre Dubreuil and Bénédicte Augeard, and an anonymous referee for constructive suggestions to improve this article.