


 CC-BY 4.0
1. Introduction
In the hydrological cycle, the factors driving catchment-scale processes are mainly climate and land use [de Marsily 2007]. Here, “land use” both includes land cover, land use and land management [Yin et al. 2017]. Climate change and variability are primarily driven by large scale conditions and result in global and regional substantial changes [Bhagat et al. 2022; Connors et al. 2022; IPCC 2022]. Locally mitigating the harming impacts of climate change on the water cycle could be fostered by informed land use and water management at the community level [Zipper et al. 2018].
The issue is more acute to the West African Sahel, which is known to be an ecoclimatic context strongly affected by intense droughts, severe rainfall deficits and increased rainfall variability driven by abrupt climate oscillations [Biasutti 2019]. The region also features the highest populations exerting strong pressure on natural resources (land clearing for cropping, ecosystem services). Besides, the capacity of populations living in these regions to adapt to climate change and variability impacts remains low [Serdeczny et al. 2017]. In such drought-prone contexts, improving local resilience through integrated water management should both consider land use decisions, water use and allocation [Belemtougri et al. 2021; Fovet et al. 2021; Kafando et al. 2021; Zipper et al. 2018]. This, in turn, requires, at the core, a deeper understanding of the individual and combined contributions of climate and land use changes on the hydrological cycle, which is generally not well assessed, especially for such West African watersheds [Aich et al. 2015; Yira et al. 2017; Yonaba 2020; Gbohoui et al. 2021, 2022].
The complexity of processes in the water cycle in Sahelian watersheds remains a major challenge to hydrologists to date, for various reasons: first, rainfall conditions in this context are specifically defined by high intensities rainfall of short durations [Biasutti 2019], which quickly onsets a highly non-linear Hortonian surface runoff response [Mounirou et al. 2020]. Second, surface runoff generation mechanisms are typically dependent on both antecedent rainfall but also soil surface conditions, the latter being prone to surface crusting and sealing; which, in turn, affects other key processes such as infiltration, and evaporation [Valentin 2018; Zouré et al. 2019]. Third, long-term and spatially complete sets of rainfall-runoff observations are scarce and rarely gap-free, since monitoring networks are lacking [Mahé and Paturel 2009]. These conditions severely hamper hydrological modelling applications in these contexts, which are nevertheless the preferred approach to assess the combined and individual contributions of climate and land use dynamics on the water cycle [Yin et al. 2017].
To the best of our knowledge, few modelling studies in the Sahel have been dedicated to this exercise still [Aich et al. 2015; Akoko et al. 2021; Angelina et al. 2015; Dembélé et al. 2022; Gal et al. 2017; Grippa et al. 2017; Karambiri et al. 2011; Séguis et al. 2004]. Among the reasons often put forward, some authors mention the difficulty in representing accurately Sahelian hydrological processes in most of the available models [Cornelissen et al. 2013; Karambiri et al. 2003], or the data scarcity [Mahé and Paturel 2009]. Another difficulty in achieving accuracy in simulating the water balance in hydrological models resides in a full acquaintance of land use/land cover changes (LULCC) during long-term runs in modelling experiments. Usually, a single and static LULC map of the landscape at a given time point is used, which might lead to failure in picturing the spatial and temporal patterns of evolution of hydrological processes [Wagner et al. 2016; Yonaba et al. 2021a]. Some hydrological models, such as the Soil and Water Assessment Tool [Arnold et al. 1998] provide mechanisms to integrate a dynamical update of LULC conditions during simulations, through a dedicated land use update (LUP) module, which reportedly helped in achieving significant higher model performance [Aghsaei et al. 2020; Yonaba et al. 2021a].
The question of which of the two factors between climate and land use changes is mainly responsible for the alteration of hydrological processes is yet to be answered in the case of Sahelian watersheds. The most often occurring landscape trajectory in this region is the loss of natural vegetation, which has been primarily associated with the increase in surface runoff [Amogu et al. 2015; Gal et al. 2017; Yonaba 2020]. Yet, some studies highlight that the attribution of the observed changes in surface runoff remains unclear, probably without a single definitive answer across all contexts [Aich et al. 2015; Descroix et al. 2018]. Regarding climate change, most future climate projections converge for warming in average temperatures and an increase in potential evapotranspiration over the Sahel [Diedhiou et al. 2018], whereas for rainfall, forecasts remain mixed [Dosio et al. 2020]. Such perspectives are leaving large uncertainties about the overall impact of climate or LULC change on the hydrological cycle [Stanzel et al. 2018; Sylla et al. 2018; Todzo et al. 2020].
To meet this challenge, in this study, we introduce a methodological framework to assess the combined and relative contribution of future climate and LULC changes on the hydrological cycle, with a focus on surface runoff, in a typical Sahelian landscape under semi-arid climate. The Tougou watershed (37 km2), located in northern Burkina Faso, has been an observatory for the study of interrelations between climate, environment and population dynamics for more than 5 decades [Yonaba 2020] and is selected as a support for this research. In a previous study, LULC maps of the Tougou watershed have been produced using remote sensing for the years 1999, 2009 and 2017; the landscape evolution has also been projected to 2030, 2040 and 2050, through land change modelling, under the hypothesis of business as usual trends [Yonaba et al. 2021b]. Also, the SWAT model has been calibrated based on rainfall-runoff observations between 2000 and 2017, using dynamics LULCs maps available for this period [Yonaba et al. 2021a]. Building upon these results, the aim of this study is twofold: (i) to forecast the projected changes in the hydrological balance using future climate and land use; (ii) to quantify the combined and individual contribution of climate and land use to average annual and daily extreme surface runoff.
2. Materials and methods
2.1. Study area
2.1.1. Location and physical setting of Tougou watershed
The study is carried out in the Tougou watershed (13.65° N; 2.26° E), which lies in north-eastern Burkina Faso, in the upper Nakanbe River Basin, within the Yatenga province. The location of the watershed, covering an area of 37 km2, is shown in Figure 1a. The climate on the watershed is semi-arid, with a single rainy season from July to October. The major soils types (Figure 1b) are slightly evolved soils (25% of the area), crude mineral soils (35% of the area, prone to physical degradation into glacis) and hydromorphic soils (40% of the area) [IGB 2002]. Elevation on the watershed varies between 318 to 338 meters, with slopes between 0–17% (Figure 1c).
Location of the Tougou watershed (northern Burkina Faso). (a) Elevation and hydrography. (b) Soil types [IGB 2002]. (c) Slope map, derived from elevation map.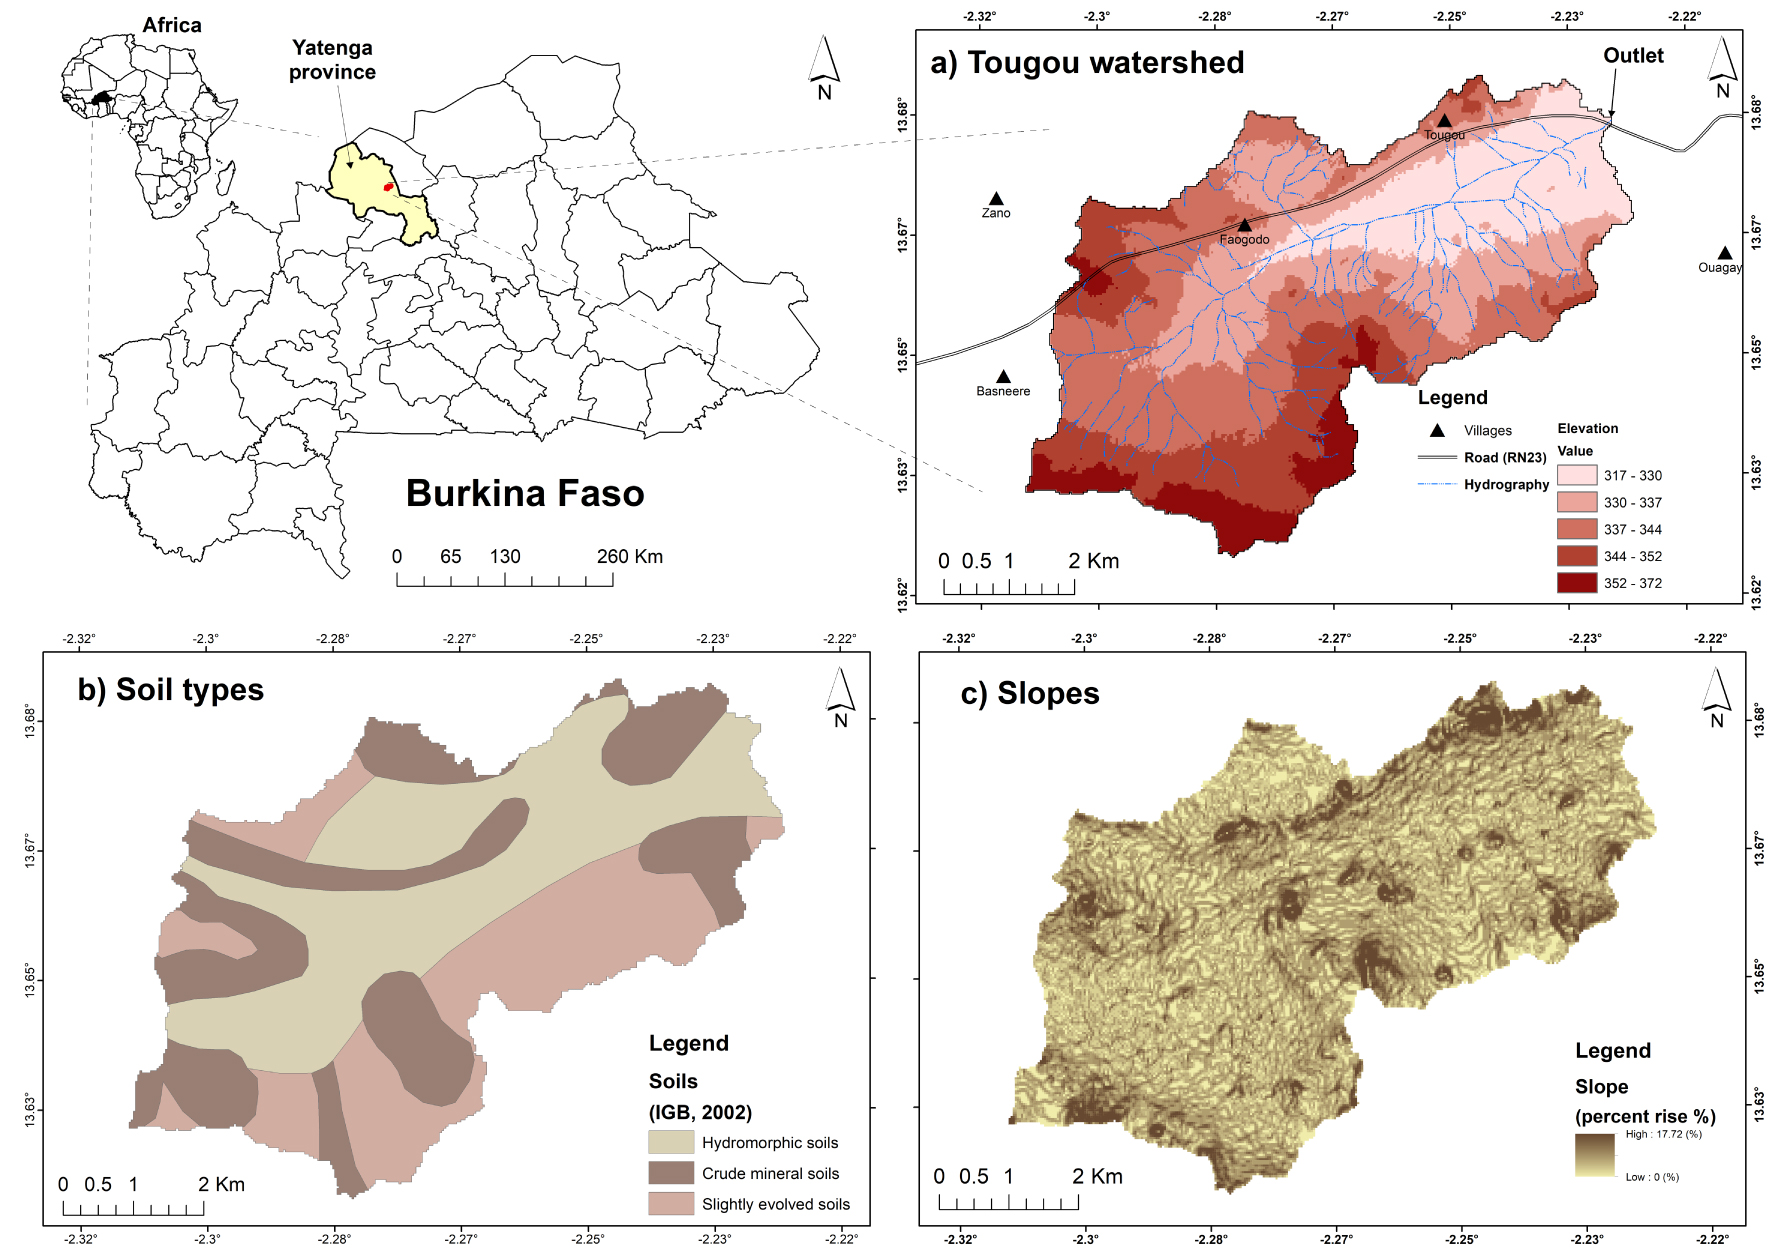
According to the meteorological records provided by the National Meteorology Agency (ANAM-BF), over the reference period 1995–2014, the average annual rainfall is 700 mm. Daily temperatures range from 12 to 45 °C. The vegetation cover is sparse on the watershed and mostly made of savannah, shrubs, steppes and agrarian parklands. The drainage network consists of a dendritic network of ephemeral streams, collecting overland runoff to a main and intermittent river, long of 8 km [Mounirou 2012; Yonaba 2020].
2.1.2. LULC evolution in Tougou watershed
Land use maps of the Tougou watershed for the years 1999, 2009 and 2017 (Figure 2a–c) have been previously produced in Yonaba et al. [2021b] through the analysis of Landsat satellite images. A land change model built around a Multilayer Perceptron neural network has been used, in conjunction with population growth trends, to further forecast the land use maps of the watershed in 2030, 2040 and 2050 (Figure 2d–f), under a business-as-usual scenario [Yonaba et al. 2021b]. The land use categories considered in these maps are natural vegetation, bare lands and croplands. Natural vegetation areas are under permanent vegetation all the year-round, covered with herbaceous plants, shrub or trees; they are mostly found along the main river channel in the watershed. Bare lands exhibit a typically very low vegetation cover (less than 5%), made of residual clumps and herbaceous, with crusts and sealing developing at the surface, therefore limiting infiltration. Croplands are growing cereals (millet, sorghum) in the wet season (early June to mid-October), during which traditional farming practices are carried out on these soils to sustain crop production [Zouré et al. 2019; Yonaba et al. 2021b]. In the watershed, populations are relying of traditional wells (of 15–30 m depth) for water consumption; however, the amounts of such withdrawals are negligible [Rusagara et al. 2022] and were therefore not considered in this study.
Land use maps of Tougou watershed for the period 1999–2050. Land use maps in 1999, 2009 and 2017 were produced through remote sensing images analysis. Land use maps in 2030, 2040 and 2050 were produced through land change modelling. Further details are given in Yonaba et al. [2021b].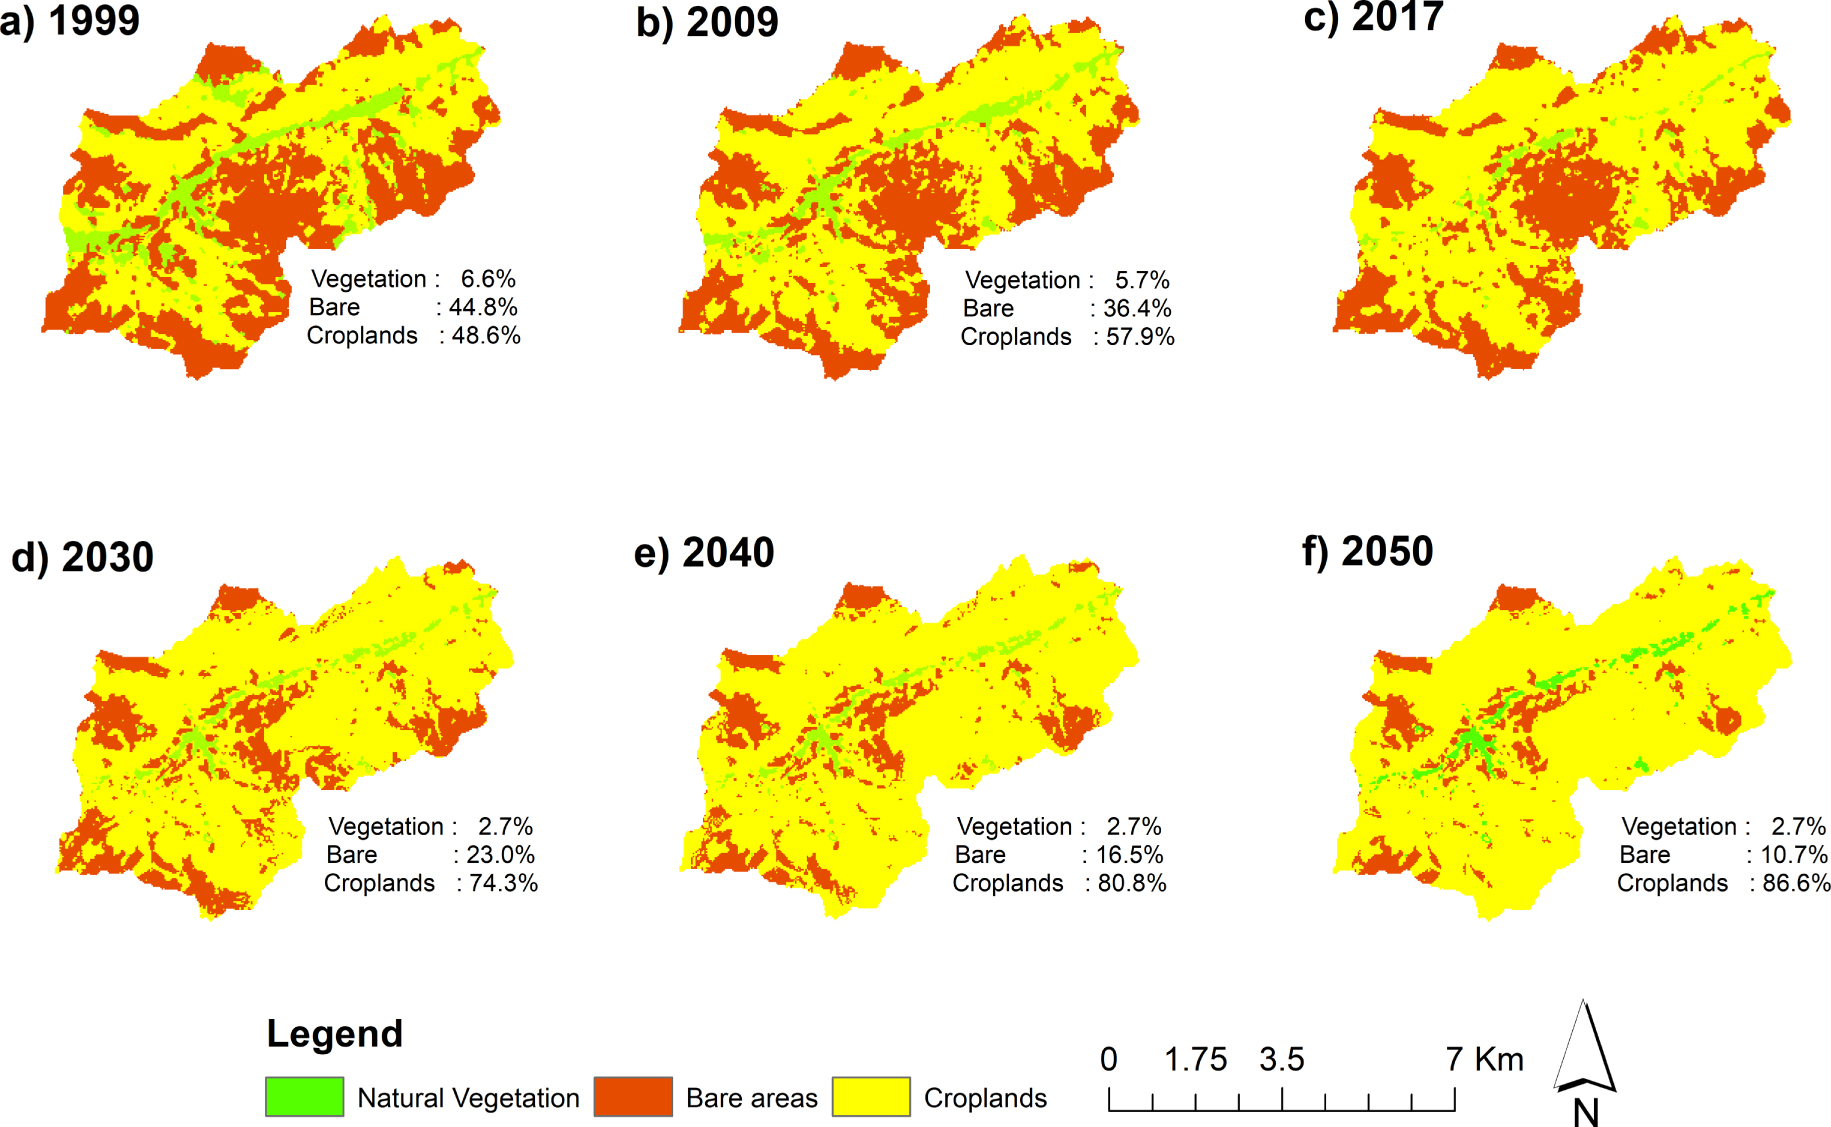
In total, from 1999 to 2050, croplands are projected to increase from 48.6% to 86.6%, bare lands to decrease from 44.8% to 10.7% whereas natural vegetation is expected to decrease from 6.6% to 2.7%. The large increase in croplands is mostly driven by the population growth trends. Conversely, the land use type targeted for conversion to croplands is bare land, thanks to the wide array of farming techniques and soil conservation measures introduced in the region since the 1990s [Lèye et al. 2021; Nyamekye et al. 2018; Zouré et al. 2019].
2.2. Overview of the methodology used in this study
The general methodology adopted in this study is presented in Figure 3. The major steps consisted in selecting CMIP6 Global Circulation Models (GCM), then carrying out a bias correction of these models using observations during the baseline period 1995–2014. The SWAT model is then used to simulate hydrological processes in the baseline period (using LULC maps in 1999, 2009 and 2017), and the future period (using future LULC maps in 2030, 2040 and 2050). The comparison of changes in surface runoff under baseline and future conditions is used to assess the relative contributions of climate and land use changes.
Flowchart of the study methodology.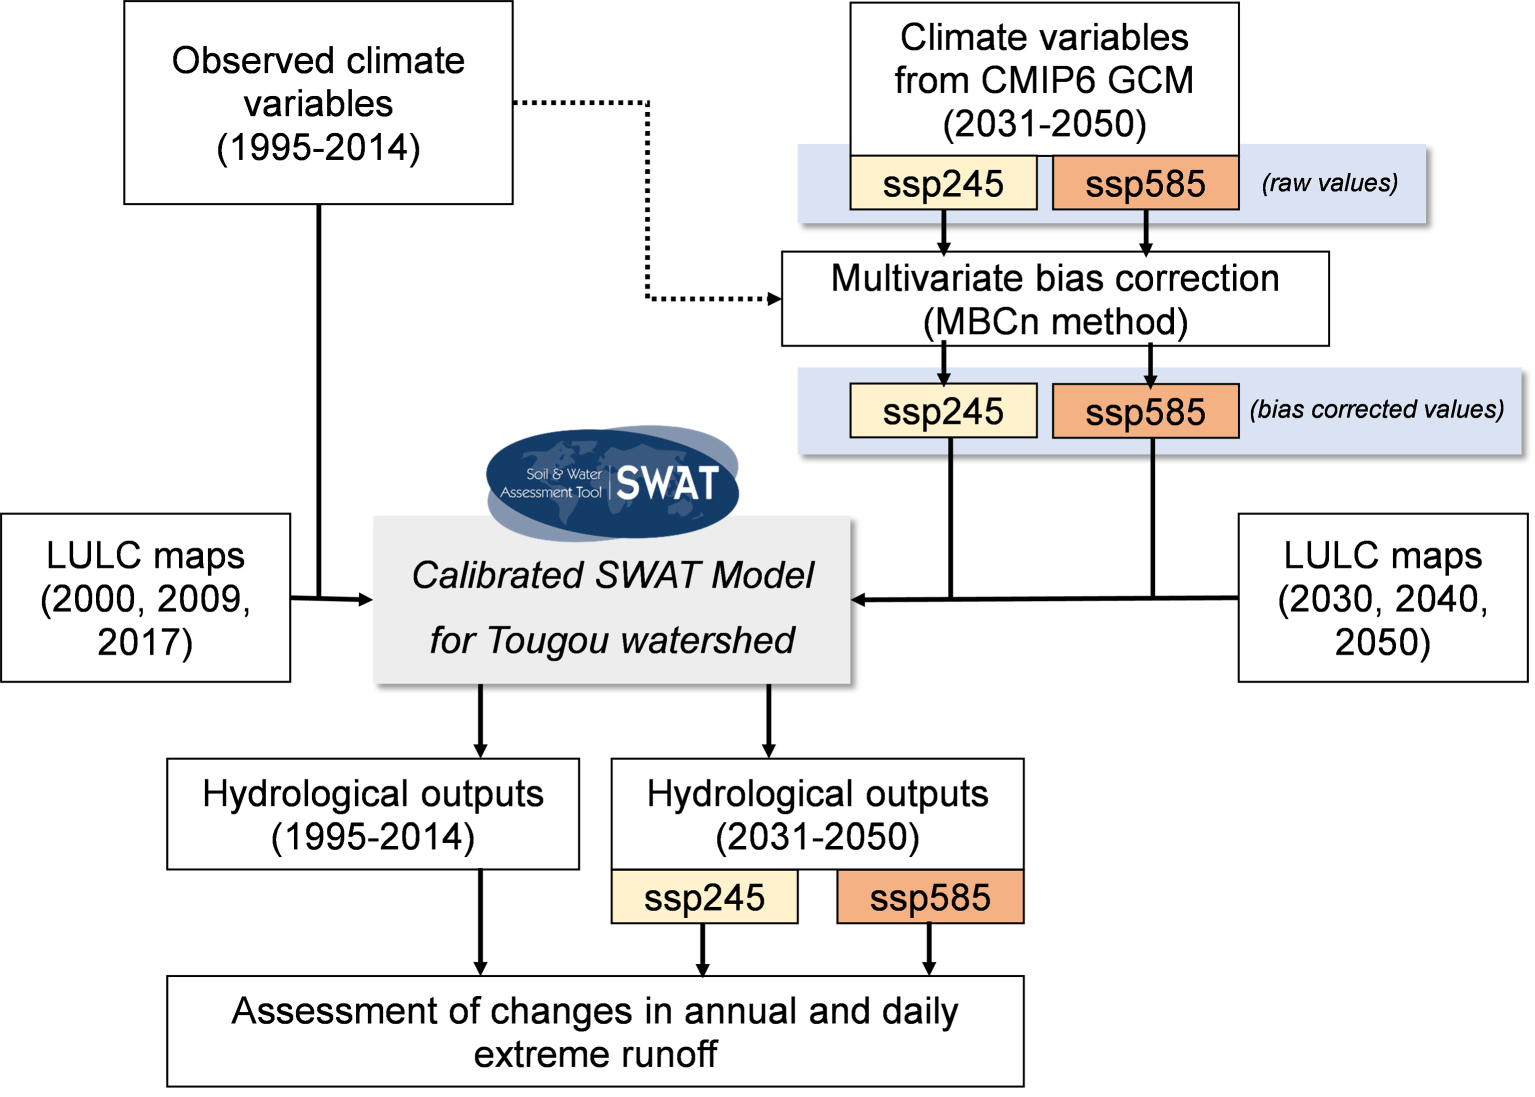
2.3. Estimation of daily potential evapotranspiration (PET)
The observed climate variables available for the baseline period (1995–2014) are rainfall (pr), average daily temperature (tas), minimum daily temperature (tasmin), maximum daily temperature (tasmax), both provided by the National Meteorology Agency (ANAM-BF), at the daily timestep. Therefore, the use of the reference FAO-56 Penman–Monteith (PM) method is not applicable. To estimate daily PET, the Hargreaves–Samani (HS) equation [Hargreaves and Samani 1985] is therefore selected as an alternative for its parsimonious estimation of PET solely relying on temperature data, which is available for the considered baseline period. The HS equation is given as in Equation (1) [Raziei and Pereira 2013]:
| (1) |
Previous studies reported the reliability of HS equation for PET estimation in Burkina Faso, yet highlighted significant biases often occurring in daily estimates, which can be further reduced by calibrating the empirical coefficients in the formula against reference data [Ibrahim 2002; Ndiaye et al. 2017; Zouré 2019; Yonaba 2020]. In this study, these coefficients were calibrated for each month in the year, using PET data calculated from Penman–Monteith (PM) reference model over the previous period 1985–1994 (for which complete climate data were available). The calibration procedure is carried out using an adaptive non-linear least squares algorithm. The improvement of the calibration step is evaluated through graphical methods (including scatterplots and box-plots) and also statistical evaluation (coefficient of determination—R2, Mann–Whitney U-test for the mean at 𝛼 = 5% significance level, root mean square error—RMSE, and percent bias—PBIAS) Some of these metrics are calculated as in Equation (2):
| (2) |
2.4. Processing future climate projections
2.4.1. Selection of GCM models
In this study, CMIP6 climate projections [Eyring et al. 2016] are used to project the future hydrological response. The data were retrieved from Copernicus Climate Data Store (CDS, https://cds.climate.copernicus.eu/cdsapp#!/dataset/projections-cmip6) for the baseline period 1995–2014 and the future period 2031–2050. Two Shared Socio-Economic Pathways (SSP) are considered: SSP2-4.5, a modest mitigation case scenario, standing as a most-plausible near future outcome (∼2.5 °C global warming by 2100, relative to pre-industrial levels); and SSP5-8.5, a worst-case scenario defined by business-as-usual fossil-fuel intensive use, stringent of climate mitigation (∼5 °C warming by 2100). The choice of these scenarios is also influenced by the fact that they remain comparable to the previous Representative Concentration Pathways (RCP) 4.5 and 8.5 scenarios, issued from CMIP5 and broadly used in past studies [Ayugi et al. 2022]. It is noteworthy to outline that as compared to the land use narratives in the Shared Socio-Economic Pathways (SSPs) scenarios, the LULC futures in Tougou watershed used in this study are more in line with the “middle of the road” SSP2-4.5 scenario [Popp et al. 2017].
The initial set of models available within the CDS archive was filtered to retain only models providing complete daily data for rainfall, temperature (minimum, maximum and average) and for both SSP2-4.5 and SSP5-8.5 pathways. An ensemble of 9 climate models, listed in Table 1, is finally considered for this study. These models all have a horizontal resolution of 250 km and are issued from the same ensemble member (r1i1p1f1).
List of CMIP6 models used in this study
| In this study | Abbreviation | Model name |
|---|---|---|
| M1 | ACCESS-CM2 | Australian Community Climate and Earth System Simulator Model Version 2 |
| M2 | CNRM-CM6-1 | Centre National de Recherches Meteorologiques Model Version 6.1 |
| M3 | CNRM-ESM2-1 | Centre National de Recherches Meteorologiques—Earth System Model Version 2.1 |
| M4 | INM-CM4-8 | Institute for Numerical Mathematics (INM) Model Version 4.8 |
| M5 | INM-CM5-0 | Institute for Numerical Mathematics (INM) Model Version 5 |
| M6 | MIROC6 | Model for Interdisciplinary Research on Climate Version 6 |
| M7 | MIROC-ES2L | Model for Interdisciplinary Research on Climate—Earth System Model |
| M8 | MPI-ESM1-2-LR | Max-Planck-Institut für Meteorologie—Earth System Model |
| M9 | MRI-ESM2-0 | Meteorological Research Institute Earth System Model Version 2.0 |
2.4.2. Multivariate bias correction of future climate data
GCM outputs generally feature systematic biases over the historical baseline, which needs to be removed before their use in impact studies. To address this issue, the application of bias correction techniques is recommended [Dieng et al. 2022]. In this study, a multivariate trend preserving bias correction method, termed as MBCn [Cannon 2018] is used. The general steps of application of this method are as follows: (1) the data for each variable of interest are pooled by individual months in the baseline (1995–2014) and the future (2031–2050) periods; (2) for each climate model and for each time series (one for each month), model-projected quantiles are detrended, then adjusted through quantile mapping constructed from a sampling of the baseline observations. In this study, a sampling of 50% of the observations is used to construct the optimal targeted quantile distributions; then, the initial trends are re-introduced. These steps form the so-called Quantile Delta Mapping (QDM) bias-correction, which is further detailed in Cannon et al. [2015]. The MBCn algorithm further comes as a multivariate generalization of the QDM method for simultaneous bias-correction of multiple variables, to preserve joint dependence [Cannon 2018].
The bias-corrected variables in this study are daily rainfall and temperatures (average, minimum and maximum). Future daily PET is further calculated with the calibrated HS equation (presented in Section 2.3). This strategy is adopted here since correcting biases in dependent variables (here, temperature) has the potential of significantly reduce biases in PET forecasts [Yang et al. 2021].
2.5. Hydrological simulation
The SWAT model is used in this study for the simulation of hydrological processes in the Tougou watershed. SWAT is a physically-based and semi-distributed hydrological model, which simulates hydrological processes at the scale of Hydrological Response Units (HRUs) [Arnold et al. 1998]. The water balance equation as represented by the SWAT model is given by Equation (3):
| (3) |
| (4) |
The SWAT model for the Tougou watershed was built using the elevation data from ASTER GDEM Digital Elevation Model, the soil map from the National Geographic Institute in Burkina Faso [IGB 2002] and the available land use maps from Yonaba et al. [2021b]. The Land use Update (LUP) module within the SWAT model [Moriasi et al. 2019; Pai and Saraswat 2011] is used to activate dynamic changes in land use during the simulations. The simulation during the baseline period used land use maps in 1999, 2009 and 2017, whereas the simulation during the future period used projected land use maps in 2030, 2040 and 2050.
The SWAT model has been previously calibrated for the Tougou watershed (over the period 2004–2018) with satisfactory performance (Kling-Gupta efficiency: KGE = 0.95∕0.94; percent bias: PBIAS = −2.30%∕2.90% for calibration/validation periods). The Table 2 is adapted from Yonaba et al. [2021a] and shows the calibrated values (and uncertainty range) for the model parameters, which were used in this study for hydrological simulation. Among these parameters, CN2 (SCS Curve Number), SOL_AWC (soil water content), ESCO (soil evaporation compensation factor), OV_N (Manning’s n roughness for overland flow), SOL_K (saturated hydraulic conductivity) are the ones which are affected straight by land use [Amogu et al. 2015; Gal et al. 2017; Descroix et al. 2018; Yonaba et al. 2021a].
Calibrated SWAT model parameters in Tougou watershed
| Parameter | Description (Unit) | Calibration method | Initial range | Fitted values (Uncertainty range) |
|---|---|---|---|---|
| CN2 | SCS Curve number (-) | r | −0.3–0.3 | −0.0787 (−0.249;0.057) |
| EPCO | Plant uptake compensation factor (-) | v | 0–1 | 0.2036 (0.091; 0.402) |
| SOL_K | Saturated hydraulic conductivity (mm⋅h−1) | r | −0.3–0.3 | −0.0232 (−0.157;0.272) |
| GW_DELAY | Groundwater delay time (days) | v | 0–500 | 52.584 (25.203; 53.799) |
| RCHRG_DP | Deep aquifer percolation fraction (-) | v | 0–1 | 0.3566 (0.078; 0.239) |
| GW_REVAP | Groundwater “revap” coefficient (-) | v | 0.02–0.2 | 0.0948 (0.065; 0.156) |
| OV_N | Overland flow Manning roughness (s⋅m−1∕3) | r | −0.3–0.3 | −0.3038 (−0.595; 0.152) |
| CH_K2 | Hydraulic conductivity in channels (mm⋅h−1) | v | 0–300 | 50.173 (23.66; 114.30) |
| SOL_AWC | Available soil water content (mm) | r | 0–0.5 | 0.3707 (0.326; 0.405) |
| REVAPMN | Threshold depth of water for “revap” (mm) | v | 0–500 | 344.08 (247.69; 416.06) |
| CH_N2 | Manning’s roughness for channels (s⋅m−1∕3) | v | 0.01–0.3 | 0.178 (0.175; 0.287) |
| ALPHA_BF | Baseflow recession constant (days) | v | 0–1 | 0.3791 (0.367; 0.790) |
| ESCO | Soil evaporation compensation factor (-) | v | 0–1 | 0.9879 (0.966; 1.000) |
The parameters are ranked out by order of decreasing importance in the model. The units provided in the description stand for the absolute parameter value [Neitsch et al. 2011]. The calibration method refers to the strategy used for updating the model parameters during the calibration phase: r (for relative) is the relative deviation applied to the original parameter value, which therefore preserves its spatial variability; v (for replace) is the absolute and unique value given to the parameter in the model, regardless of its location [Abbaspour et al. 2007; Yonaba et al. 2021a].
2.6. Extreme value analysis
Extreme values (EV) often constitute the rationale for designing hydraulic structures for flood control, or devise mitigation strategies for water management at the community level. Such extremes are likely to be affected by land use or climate change [Hounkpè et al. 2019; Tazen et al. 2019]. In this study, different EV distributions (including Gumbel, GEV, Gamma, Weibull) were fitted over the daily annual maximum rainfall and annual maximum surface runoff values distributions over the baseline period 1995–2014. The quality of the fit was evaluated using the Kolmogorov–Smirnov test (at 𝛼 = 5% significance level). The three-parameter Weibull distribution (W3) was finally selected as the optimally fitting EV distribution (p‐value = 0.992 and 0.945 for rainfall and surface runoff extremes respectively) and is therefore used in this study, similarly as in Sawadogo and Barro [2022] in Burkina Faso, or in Li et al. [2015] and Olivera and Heard [2019]. The probability density function (PDF) and the quantile (inverse cumulative distribution function) of this distribution are given in Equation (5):
| (5) |
The fitted W3 distributions are used to derive extreme daily rainfall and surface runoff for 2, 5, 10, 15, 20, 25 and 30-years return periods. These values are further used to assess the various contributions of climate and land use change on surface runoff extremes.
2.7. Evolution of ecohydrological signatures
To assess the change in ecohydrological signatures of the Tougou watershed between the baseline and the future periods, the water-energy budget of Tomer and Schilling [2009] is used in this study. This framework states that as the climate change signal affects the watershed response, a tendency in maximizing unused water (defined as Pex) and unused energy (Eex) occurs, as a depiction of the shift in ecohydrological signatures of the watershed. The direction of the change can therefore be explained in terms of: (i) increasing runoff or water stress (moving right or left along the Pex axis, respectively); (ii) increased humidity or drier conditions (moving upward or downward along the Eex axis, respectively). The excess water Pex and excess energy Eex are calculated as given by Equation (6):
| (6) |
2.8. Contributions of climate and land use changes to surface runoff
The total relative change in average annual surface runoff signal between the baseline and the future (SSP2-4.5 and SSP5-8.5) is averaged over the climate model ensemble between the baseline period and the future SSP scenario considered, as shown in Equation (7):
| (7) |
As this total relative change is both affected by climate and land use change, the isolated contributions of each factor are evaluated using a “fixing-changing” method, where a single factor (either land use or climate) is changing [Yonaba et al. 2021a]. This needs intermediate simulations summarized in Table 3. The separation method however assumes that land use changes are independent of climate change, and the land-use change affects only actual evapotranspiration (ET). The latter assumption holds since actual ET is mostly dependent on vegetation (cover fraction, growing stage and development) and land use management [Dey and Mishra 2017; Gbohoui et al. 2021; Yonaba et al. 2021a].
Simulation runs to isolate land use and climate change effects on surface runoff
| Climate period | LULC period | Response | Description | Effect |
|---|---|---|---|---|
| Baseline | Baseline | Qb | Runoff in the baseline period | - |
| Baseline | Future | Qlulc | Changing land use while holding climate constant | Land use change |
| Future (ssp2-4.5, ssp5-8.5) | Baseline | Qclimate | Changing climate while holding LULC constant | Climate change |
| Future (ssp2-4.5, ssp5-8.5) | Future | Qfuture | Runoff in the future period | Land use + Climate change |
The relative contributions of climate (𝜂climate) and land use (𝜂lulc) changes to the total changes in surface runoff are evaluated under the assumption that these relative contributions, along with climate-land use interaction effects [Gbohoui et al. 2021; Yonaba et al. 2021a] sum up to 100%, as given in Equation (8).
| (8) |
3. Results
3.1. Climate data processing
3.1.1. Calibration of HS model for daily PET
The calibrated parameters of the Hargreaves–Samani equation for daily PET estimation is presented in Table 4, for each of the months in the year for which the formula is independently calibrated.
Monthly calibrated parameters of Hargreaves–Samani equation for daily PET estimation in Tougou watershed
| Parameters | J | F | M | A | M | J | J | A | S | O | N | D | |
|---|---|---|---|---|---|---|---|---|---|---|---|---|---|
| k | Estimate | 0.190 | 0.190 | 0.190 | 0.190 | 0.190 | 0.190 | 0.190 | 0.165 | 0.172 | 0.190 | 0.190 | 0.190 |
| Std. error | 0.072 | 0.071 | 0.087 | 0.088 | 0.079 | 0.051 | 0.062 | 0.066 | 0.050 | 0.118 | 0.071 | 0.068 | |
| p-value | 0.009 | 0.008 | 0.030 | 0.031 | 0.017 | 0.000 | 0.002 | 0.014 | 0.001 | 0.108 | 0.008 | 0.006 | |
| n | Estimate | 0.221 | 0.229 | 0.234 | 0.232 | 0.389 | 0.502 | 0.468 | 0.506 | 0.495 | 0.175 | 0.275 | 0.213 |
| Std. Error | 0.056 | 0.060 | 0.052 | 0.045 | 0.072 | 0.066 | 0.071 | 0.077 | 0.053 | 0.051 | 0.059 | 0.056 | |
| p-value | 0.000 | 0.000 | 0.000 | 0.000 | 0.000 | 0.000 | 0.000 | 0.000 | <2 × 10⁻¹⁶ | 0.001 | 0.000 | 0.000 | |
| b | Estimate | 50.000 | 50.000 | 50.000 | 50.000 | 22.926 | 10.000 | 10.000 | 10.000 | 10.000 | 47.423 | 34.179 | 50.000 |
| Std. Error | 22.127 | 24.905 | 37.118 | 38.718 | 19.677 | 8.571 | 9.325 | 11.486 | 8.176 | 47.241 | 20.293 | 20.984 | |
| p-value | 0.025 | 0.046 | 0.179 | 0.198 | 0.245 | 0.245 | 0.285 | 0.385 | 0.222 | 0.316 | 0.093 | 0.018 | |
| Residual error | 0.648 | 0.781 | 0.967 | 0.895 | 1.114 | 1.010 | 0.846 | 0.816 | 0.591 | 0.609 | 0.592 | 0.576 | |
Figure 4 compares the distribution of daily PET values calculated with the reference Penman–Monteith (PM) model, the original HS model (HSraw) and the calibrated HS model (HScalib) over the period 1985–1994.
Comparison between PET estimates from Penman–Monteith (PM) reference method and Hargreaves–Samani (HS) equation over the period 1985–1994. Panels (a) and (b) compare PM and uncalibrated HS formula. Panels (c) and (d) compare PET estimates from PM and calibrated HS formula.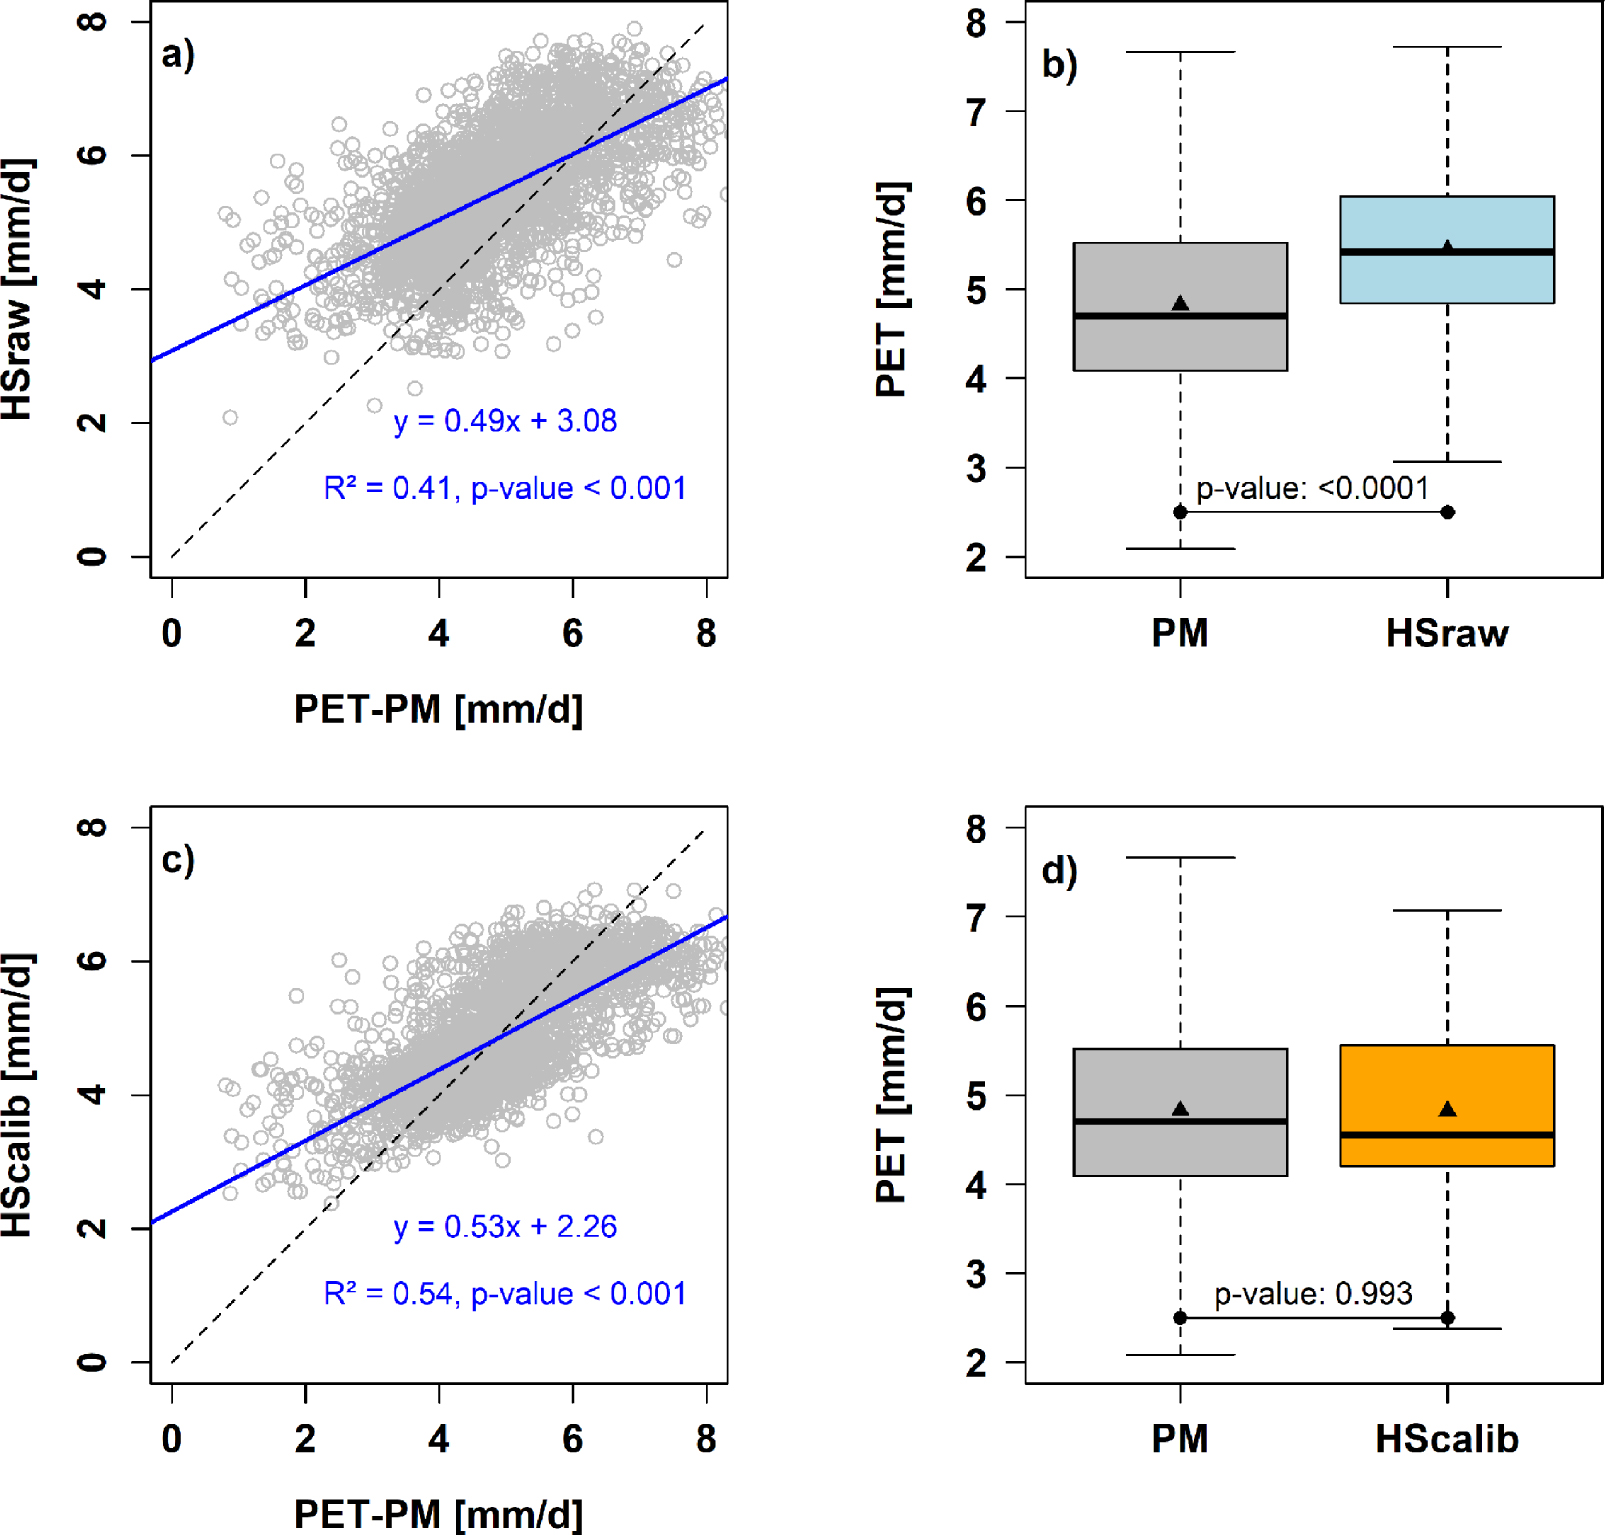
The HSraw values overestimate daily PM (Mann–Whitney: p-value <0.0001; RMSE = 1107 mm∕d; PBIAS = −17.8%), whereas the calibrated HScalib values are closer in distribution to PM values, with non-significant differences in the mean (Mann–Whitney: p‐value = 0.993; RMSE = 0.801 mm∕d; PBIAS = −3.7%). The calibrated HS model is therefore expected to provide reliable estimates of daily PET in the Tougou watershed.
3.1.2. Multivariate bias-correction of future climate data
Figure 5 shows the cumulative distribution functions (CDF) of the 9 climate models selected in this study, compared to those of observations over the baseline period 1995–2014, before and after the application of the multivariate bias-correction MBCn.
Cumulative distribution functions (CDFs) of climate variable before and after multivariate bias-correction over the baseline period 1995–2014. The x-axis scale for all panels were log-transformed to clearly visualize the differences in distributions (especially in rainfall).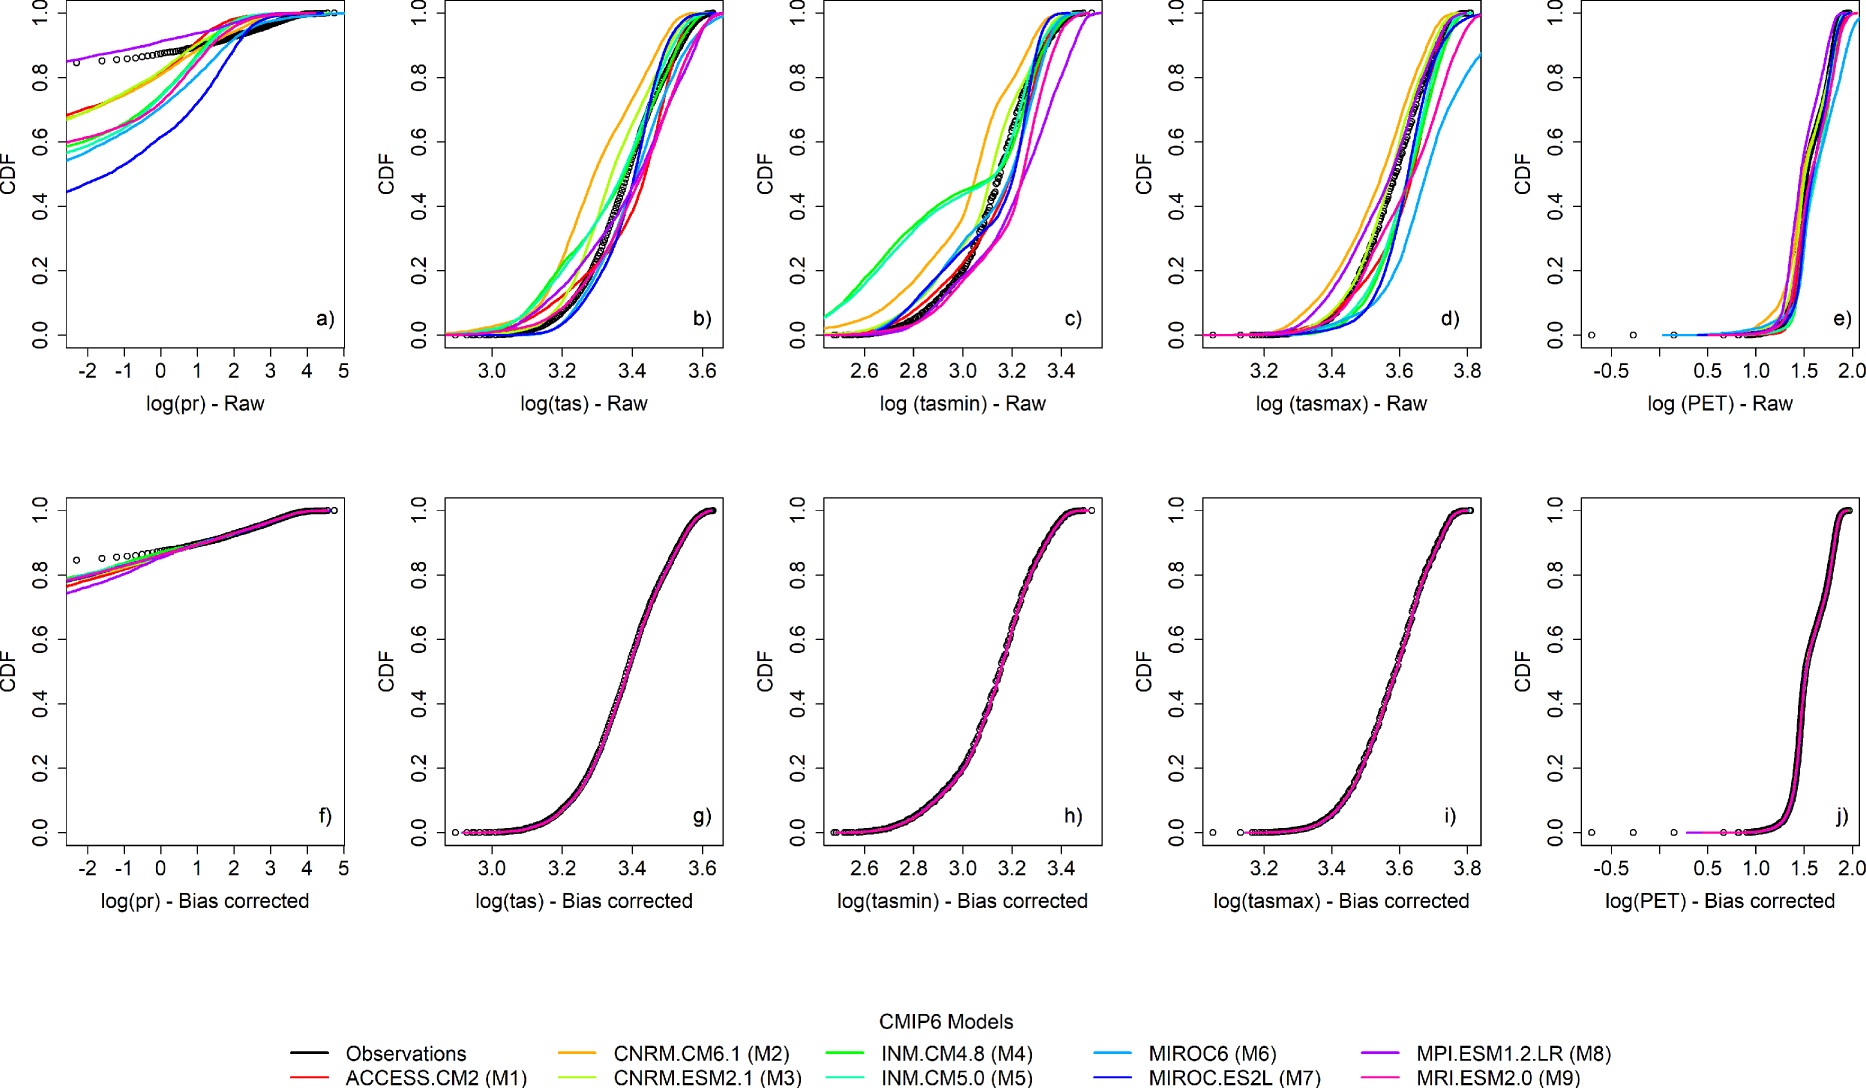
The moderate to large discrepancies observed in CDFs (especially in rainfall) initially become marginal after the bias-correction, hence demonstrating the performance of the bias-correction method in adjusting the distributions for all the considered climatic variables. The transfer functions used for adjusting the historical climate model outputs were applied to the future forecasts (SSP2-4.5 and SSP5-8.5), hence providing more skilful climate projections.
3.2. Analysis of the climate change signal
3.2.1. Projected changes in annual average rainfall and PET
The climate change signal in SSP2-4.5 and SSP5-8.5 relative to the base line period is presented in Figure 6a. The majority of the climate models within the ensemble project an increase in annual rainfall by 13.7% on average in SSP2-4.5 (−7.6% to 58.2%) and by 18.8% on average in SSP5-8.5 (−2.3% to 61.0%). Regarding annual PET, an increase is also expected by 1.3% on average in SSP2-4.5 (−0.2% to 2.5%) and by 1.5% on average in SSP5-8.5 (0.3% to 3.4%). The projected increase in PET is likely caused by the projected increase in temperatures.
Annual and seasonal climate change signal in rainfall and PET relative to the baseline period 1995–2014. (a) Relative change in annual rainfall and PET. (b) Relative change in monthly rainfall. (c) Relative changes in monthly PET.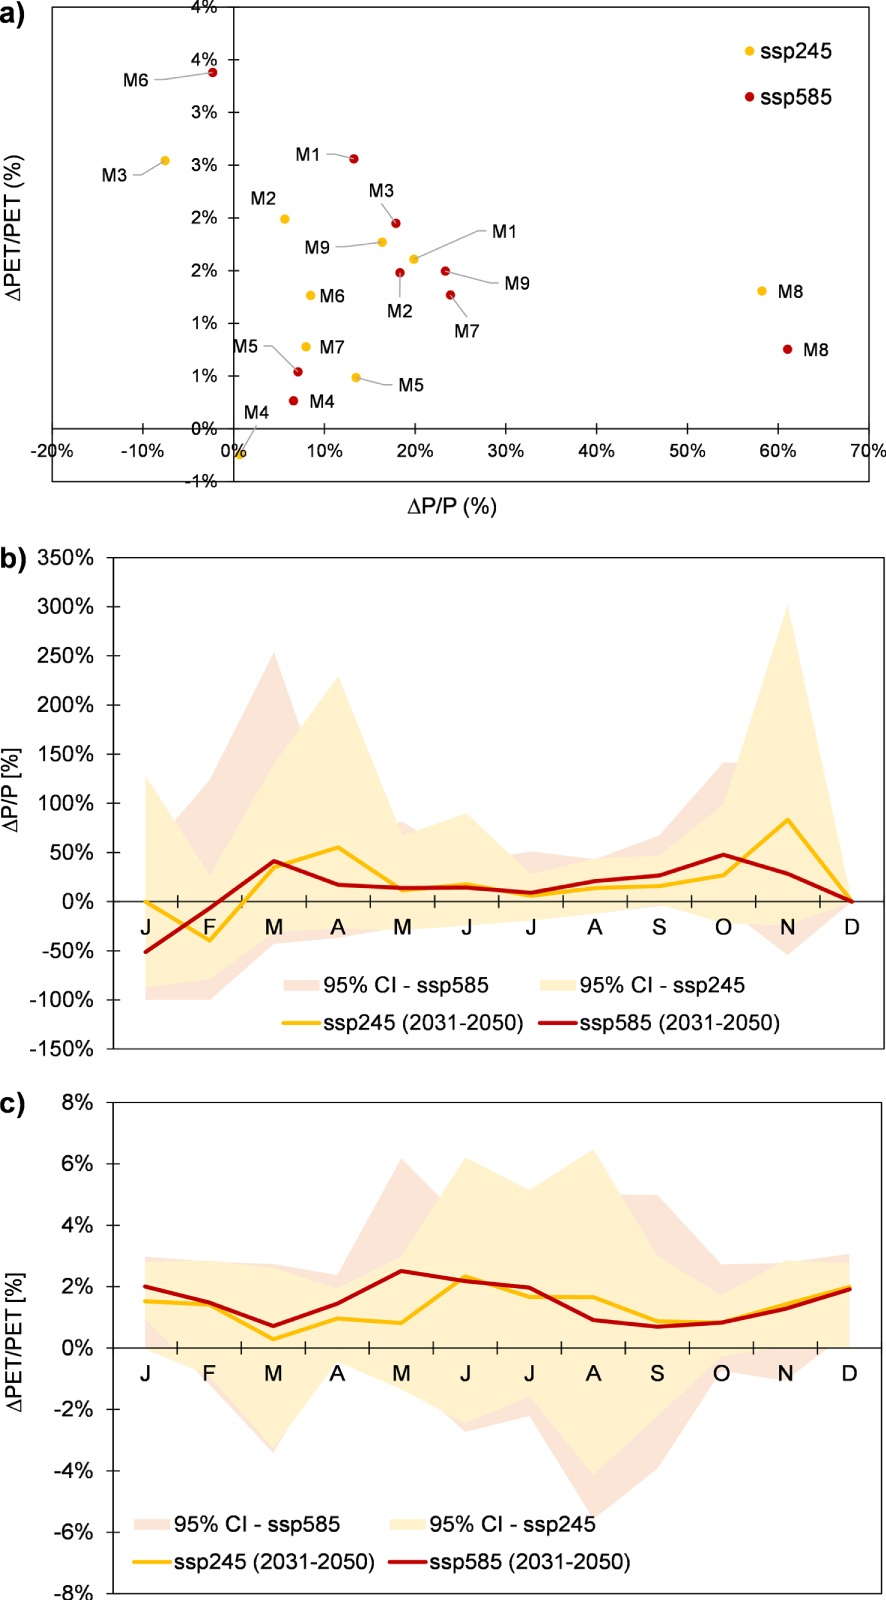
An increase in monthly rainfall is expected (Figure 6b) for the months of June (17.6% and 14.3%), July (5.9% and 8.9%), August (13.7% and 20.8%) and September (15.8% and 26.5%), respectively under SSP2-4.5 and SSP5-8.5 scenarios. Similarly, for monthly PET, an increase is also projected, mostly for the warmest months of April (1.0% and 1.4%) and May (0.8% and 2.5%), but also for the rainy months of June (2.3% and 2.2%), July (1.7% and 2.0%) and August (1.7% and 0.9%).
3.2.2. Projected changes in daily rainfall extremes
Figure 7 shows the evolution of selected rainfall quantile projected by SSPs scenarios in comparison to the baseline period, for return periods of 2, 5, 10, 15, 20, 25 and 30 years. The projected rainfall extreme considered in this study are defined as the median of the GCM ensemble. The projected increase in rainfall quantiles is significant and is estimated at 26.6% to 45.1% (under SSP2-4.5) and 35.5% to 77.2% (under SSP5-8.5) over the different return periods.
Projection of daily annual rainfall extremes in baseline (1995–2014) and future (2031–2050) periods. (a) Median projection under SSP2-4.5 scenario. (b) Median projection under SSP5-8.5 scenario. The shaded areas in light yellow and light orange represent the 90% uncertainty band around the median projections across the GCM ensemble. The blue shaded area refers to the 90% uncertainty band around Weibull-3 (W3) quantiles over the baseline period.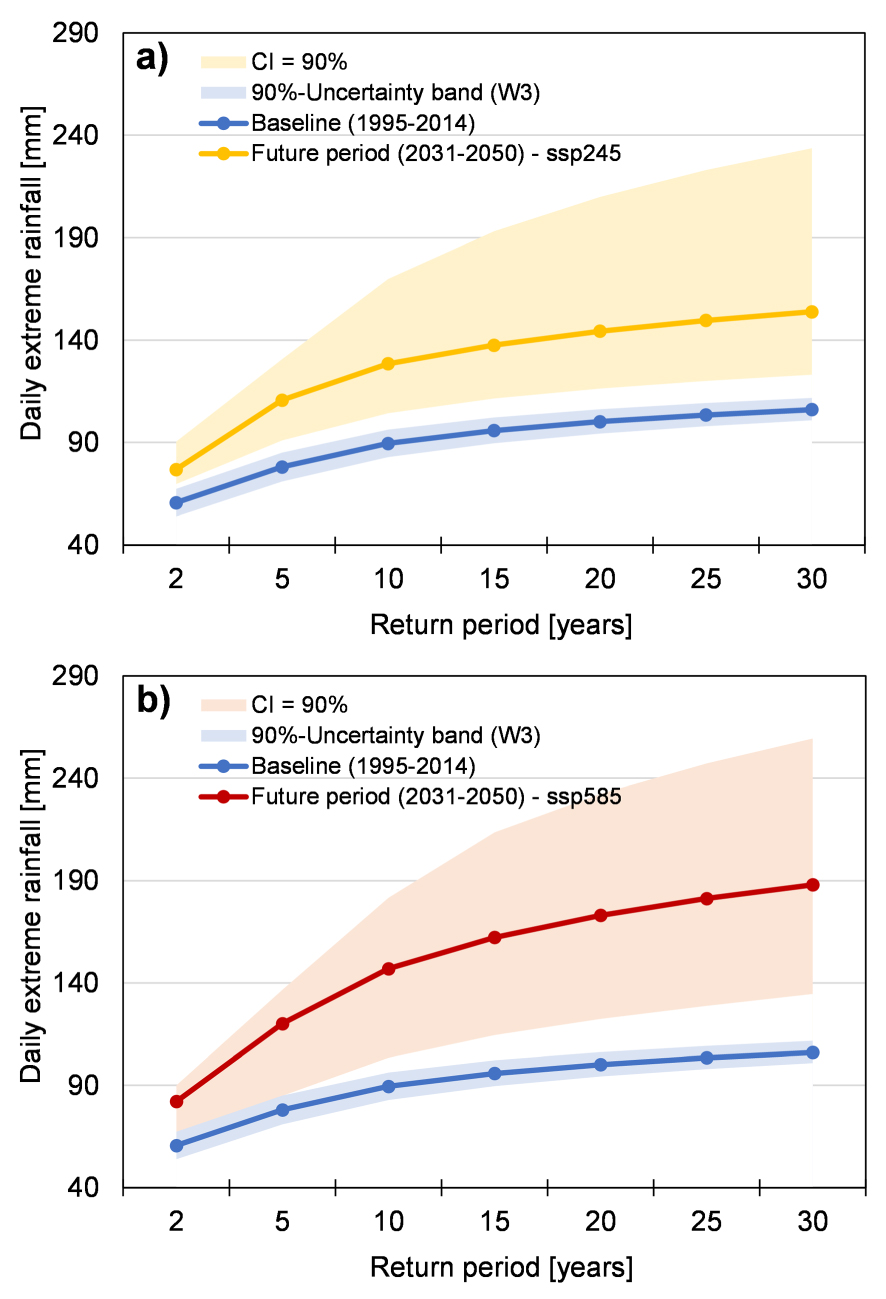
3.3. Projected changes on surface runoff
3.3.1. Annual changes
The analysis of hydrological simulation outputs for the baseline and the future period reveals significant changes in average annual components of the watershed hydrological balance, as shown in Figure 8. The increase in annual rainfall and PET is significant for both scenarios (p‐value = 0.0032 and 0.0003 respectively). Furthermore, significant increase in surface runoff (SURQ) by 24.2% (SSP2-4.5: p‐value = 0.0018) and by 34.3% (SSP5-8.5: p‐value = 0.0001) is projected. Likewise, the annual runoff coefficient (RC) is also projected to increase significantly by 11.7% under SSP5-8.5 scenario (p‐value = 0.0095).
The relative changes in annual rainfall and surface runoff reported for each climate model in the ensemble are presented in Figure 9. Under both SSPs, 8 climate models out of 9 (i.e. 89%) are projecting an increase in annual rainfall (Figure 9a) from 0.7% to 58.2% and from 6.6% to 61.0% (respectively under SSP2.4-5 and SSP5-8.5). Only 1 model (i.e. 11%) in the ensemble is projecting a decrease in rainfall of 7.6% (SSP2-4.5) and 2.3% (SSP5-8.5). Likewise, future average annual surface runoff (Figure 9b) is projected to increase under SSP2-4.5 (7 models, from 9.3% to 101.7%) and SSP5-8.5 scenarios (8 models, from 10.9% to 110.8%).
Comparison of annual changes in hydrological processes in the Tougou watershed. PET: potential evapotranspiration. SURQ: surface runoff. RC: runoff coefficient, calculated as RC = SURQ∕Rainfall.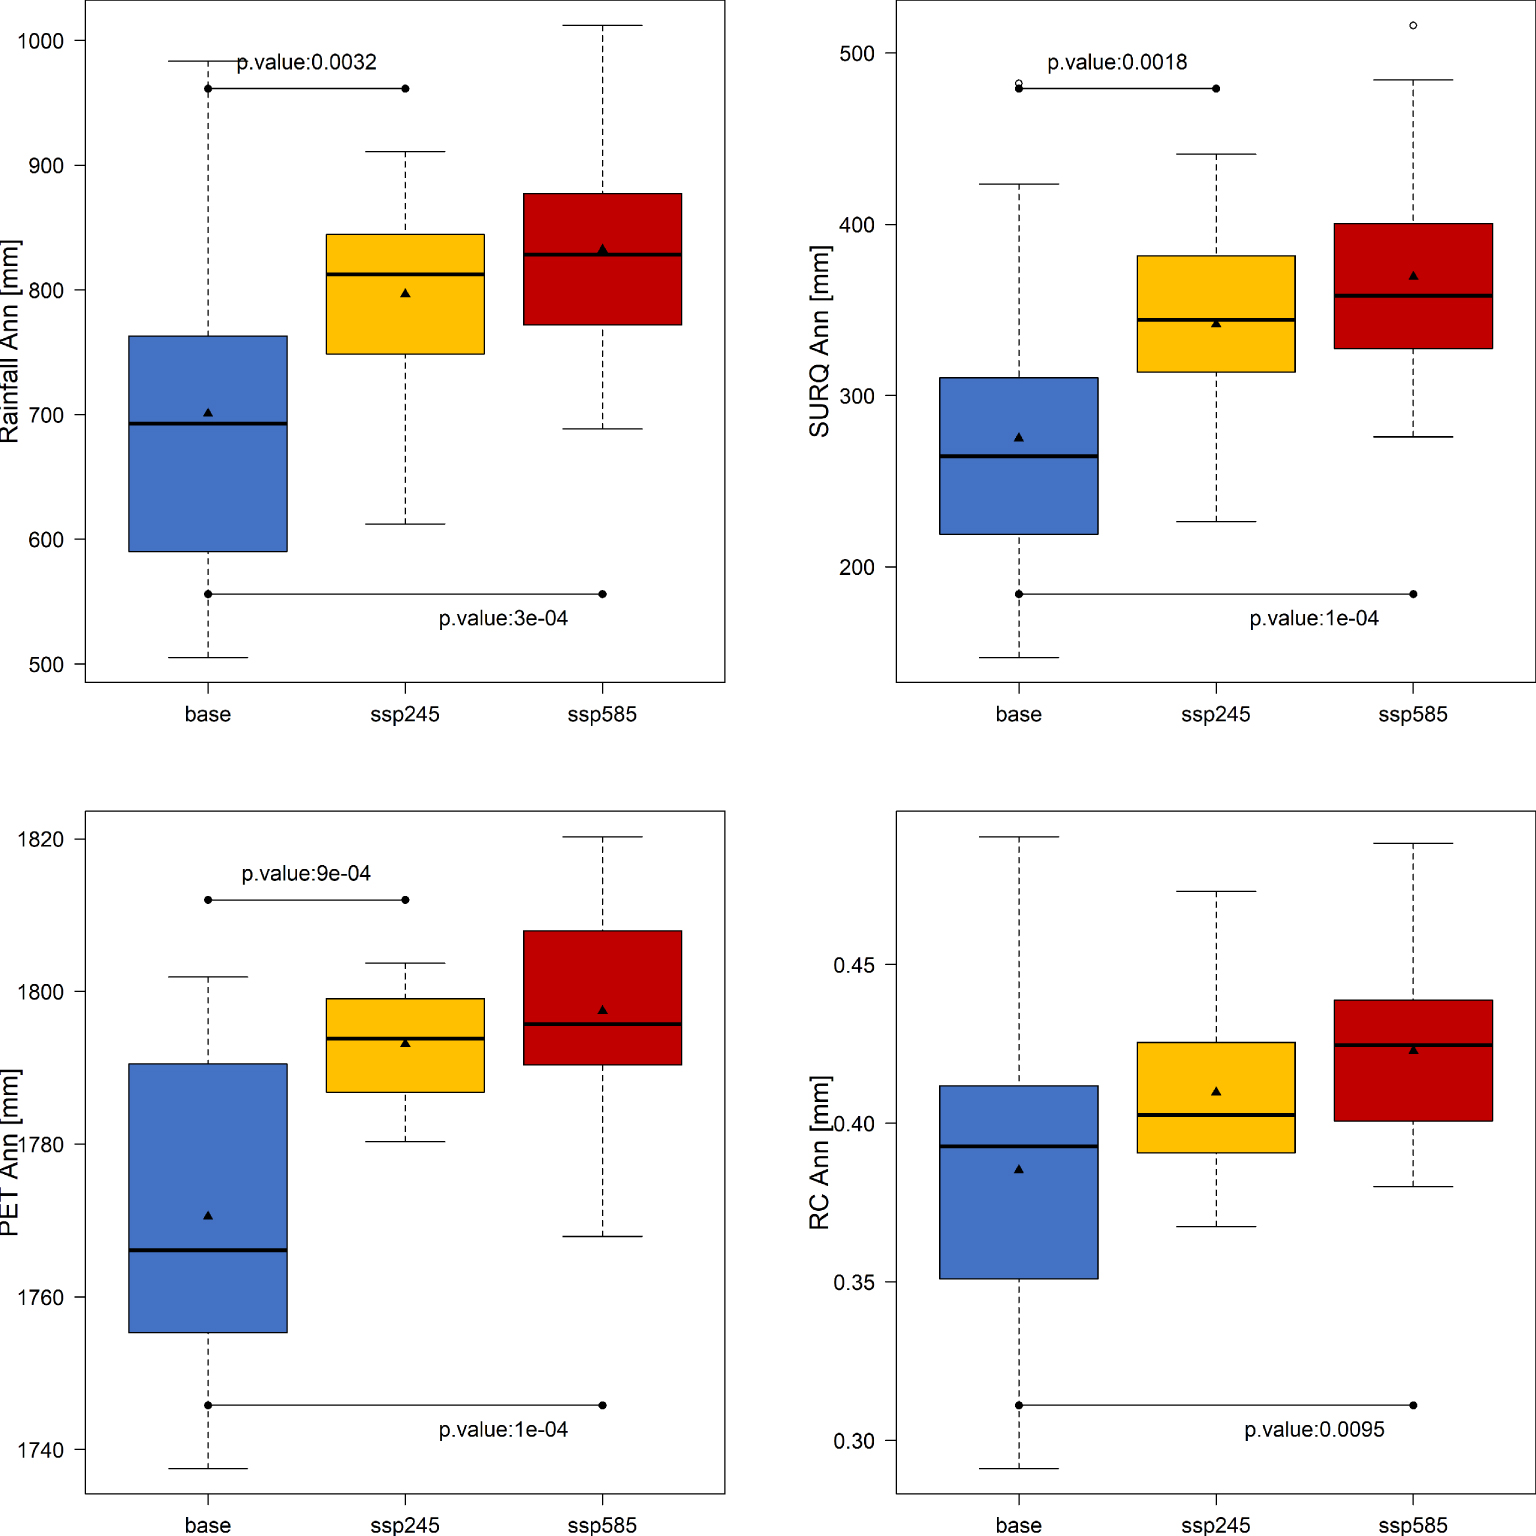
Relative average annual changes in rainfall (a) and surface runoff (b) between the baseline (1995–2014) and the future (2031–2050) period under SSP2-4.5 and SSP5-8.5 scenarios.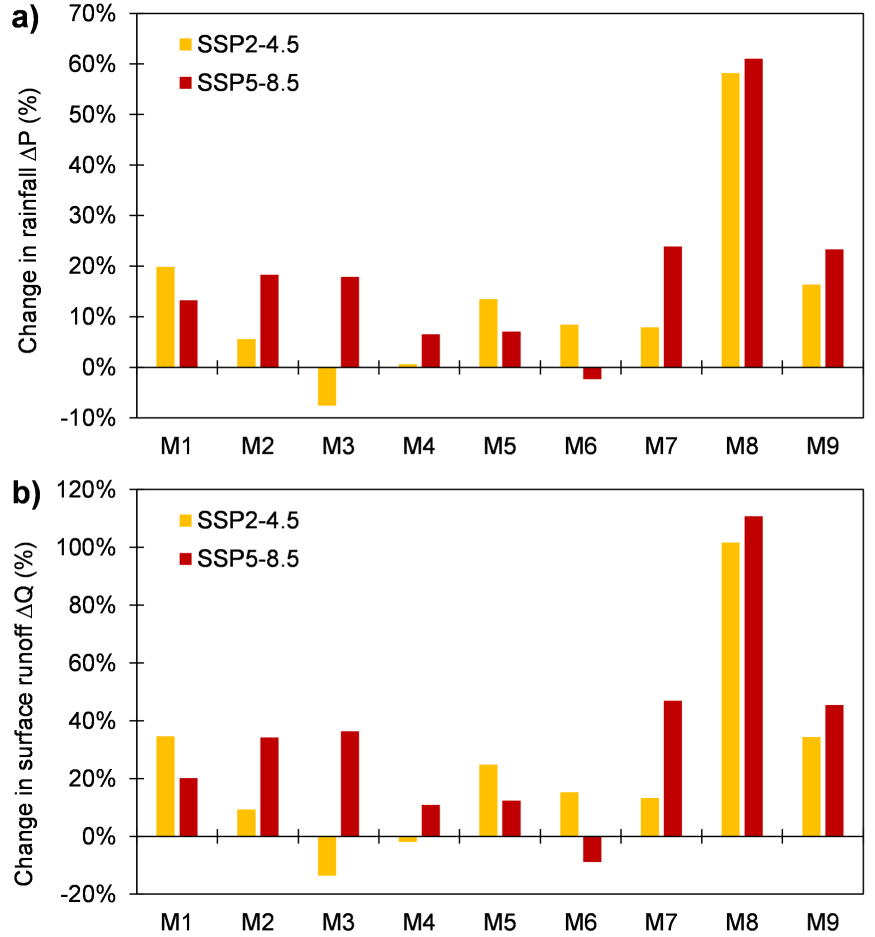
3.3.2. Seasonal changes
The seasonal changes in surface runoff in the Tougou watershed are presented in Figure 10, superimposed with changes in monthly rainfall. Under the SSP2-4.5 scenario (Figure 10a), surface runoff is projected to increase especially in the months of June (15.7 mm) and August (23.6 mm), resulting in a bimodal distribution of the projected increase. Under the SSP5-8.5 scenario (Figure 10b), the projected increase is rather unimodal, with a peak projected in August (35.4 mm), gradually decreasing in September (23.9 mm). It also appears that the reported increase in surface runoff appear to be driven by the increase in rainfall, which shows that rainfall is likely the prominent factor driving seasonal changes in surface runoff, further altered to a lesser extent by other external factors.
Monthly projected changes in surface runoff in the Tougou watershed. (a) Under SSP2-4.5 scenario. (b) Under SSP5-8.5 scenario. The error bars on rainfall and the yellow and orange grey bands shows the 95% confidence interval around projected, calculated from the ensemble values.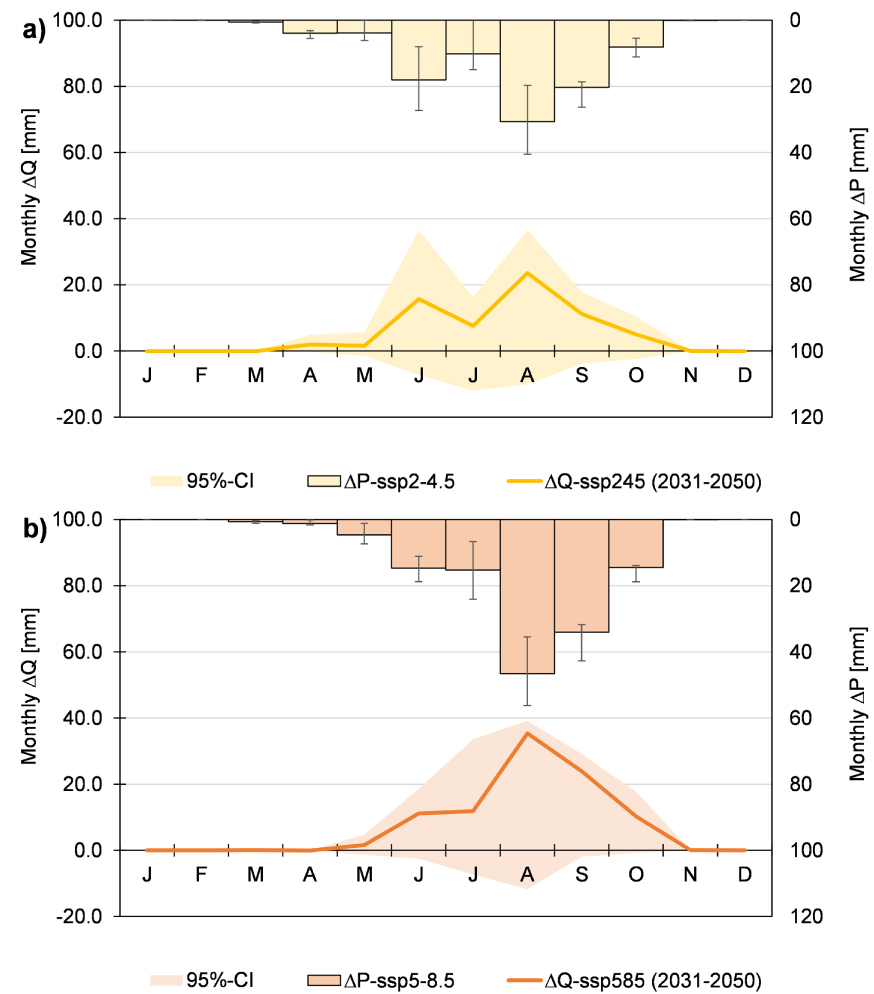
3.4. Evolution of ecohydrological status
The evolution of the ecohydrological status of the Tougou watershed is presented in Figure 11. The majority of the climate projections (8 models under SSP2-4.5, 7 models under SSP5-8.5) shows a shift to the right in terms of excess rainfall (Pex), which translates as an increase in surface runoff under both SSP2-4.5 and SSP5-8.5 scenarios. However, in terms of aridity, less agreement is observed within the climate ensemble. A total of 4 models (out of 9) project a shift towards increased aridity or drier conditions (increase in excess energy Eex), whereas 5 models project a shift towards more humid conditions (decrease in excess energy Eex). The direction of the shift for the majority of the models in terms of (Eex) (in the positive Pex − Eex quadrant) suggests changes in land use such as deforestation, removal of perennials or the use of conservation tillage [Tomer and Schilling 2009], which is in line with the future land use maps in the Tougou watershed (increase in agricultural areas, decrease of natural vegetation).
Projected shifts in the ecohydrological status of the Tougou watershed.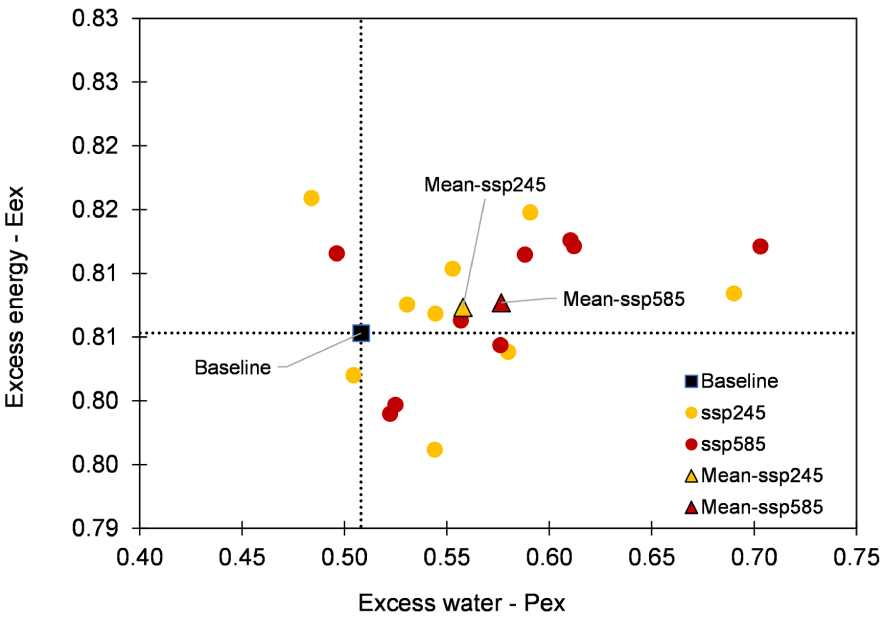
However, it should be critically assumed that such picture of the ecohydrological evolution of the Tougou watershed does not quantify streamflow change, but rather provide qualitative insights regarding whether the reported change is mostly driven by climate or land use [Dey and Mishra 2017].
3.5. Evolution of surface runoff
3.5.1. Sensitivities of surface runoff to rainfall and PET
The sensitivities of annual runoff change to rainfall and PET change under SSPs scenarios are presented in Figure 12 for all climate models in the ensemble used in this study. Such sensitives, commonly referred to as streamflow elasticity, describes the change in streamflow related the changes in one climate variable [Andréassian et al. 2016]. In this study, the analysis reveals that in the Tougou watershed, the change in surface runoff is not significantly affected by changes in annual PET (Figure 12a), as shown by the very small coefficients of determination (SSP2-4.5: R2 = 0.0002, p‐value = 0.973; SSP5-8.5: R2 = 0.1519, p‐value = 0.300). However, rainfall appears as the major factor driving changes in annual surface runoff (SSP2-4.5: R2 = 0.9949, p‐value < 0.0001; SSP5-8.5: R2 = 0.9928, p‐value < 0.0001), following a linear relationship (Figure 12b). Moreover, it can be inferred from Figure 12b that the projected average annual elasticity of streamflow to rainfall under SSP2-4.5 scenario is 0.69 (ratio of average annual increase of 66.6 mm in surface runoff out of 95.8 mm in rainfall). This elasticity increases to 0.72 under SSP5-8.5 scenario (ratio of average annual increase of 94.2 mm in surface runoff out of 131.6 mm in rainfall).
Sensitivities of annual surface runoff to rainfall and PET across all climate models in the ensemble of 9 models. Each dot shows the relative change in annual average for a given climate model between the baseline (1995–2014) and the future period (2031–2050).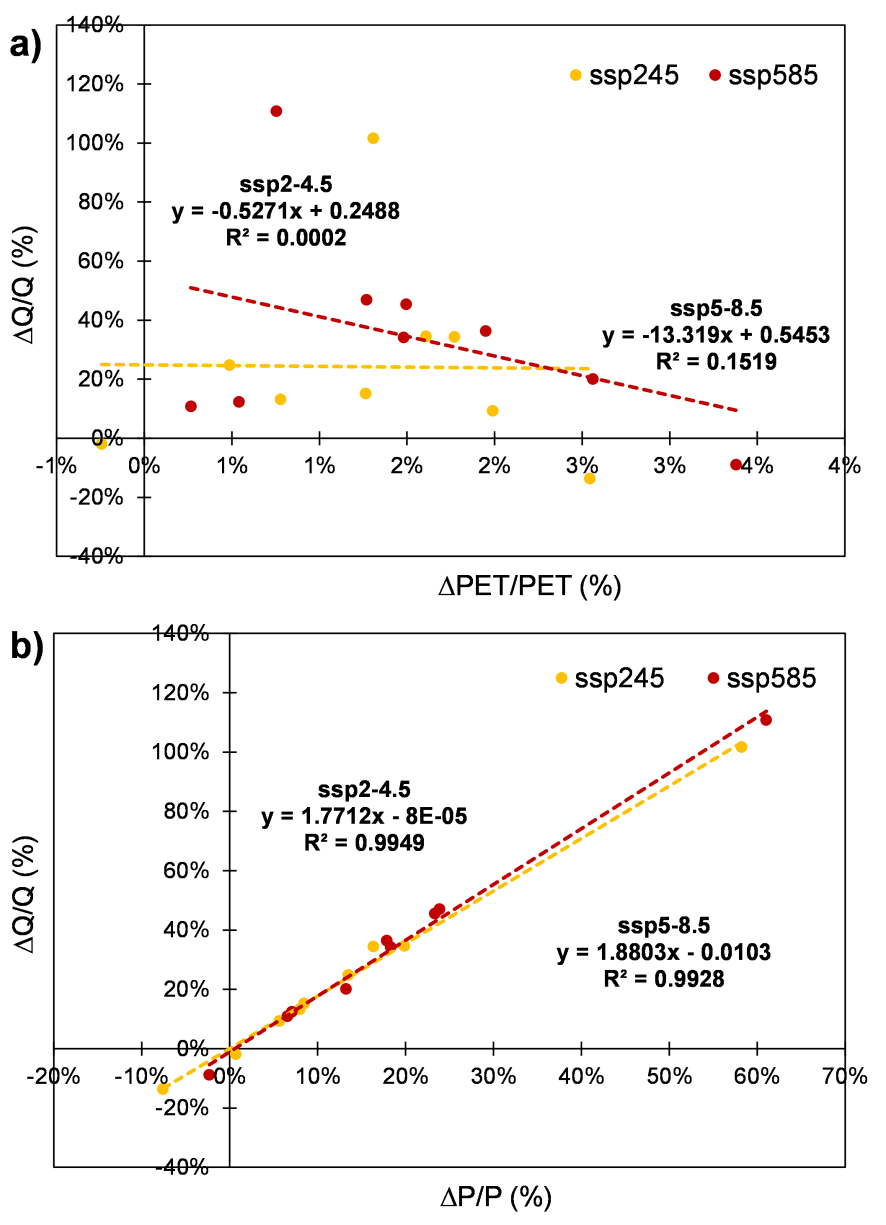
3.5.2. Changes in daily Flow Duration Curve (FDC)
The changes in daily flow duration curves (FDC) during the rainy season (June to October) in the Tougou watershed are presented in Figure 13. The analysis shows that an increase in daily surface runoff is expected under both SSPs scenarios. For instance, Q10 (surface runoff equalled or exceeded 10% of the time) increases from 4.0 mm (baseline) to 4.2 mm (SSP2-4.5) or 4.6 mm (SSP5-8.5). Also, Q50 (surface runoff equalled or exceeded 50% of the time) increases from 1.2 mm (baseline) to 2 mm (under both SSPs). Likewise, Q80 (surface runoff equalled or exceeded 80% of the time) increases from 0.35 mm (baseline) to 0.70 mm (SSP2-4.5) or 0.80 (SSP5-8.5). The observed increase in FDC suggest and shift towards an intensification of flow regimes, likely driven by the intensification in the rainfall over the Tougou watershed.
Projected changes in flow duration curve (FDC) in the Tougou watershed. (a) Changes in FDC under SSP2-4.5 scenario. (b) Changes in FDC under SSP5-8.5 scenario. The grey shaded area represents the 90%-confidence interval around the FDC curves for both scenarios.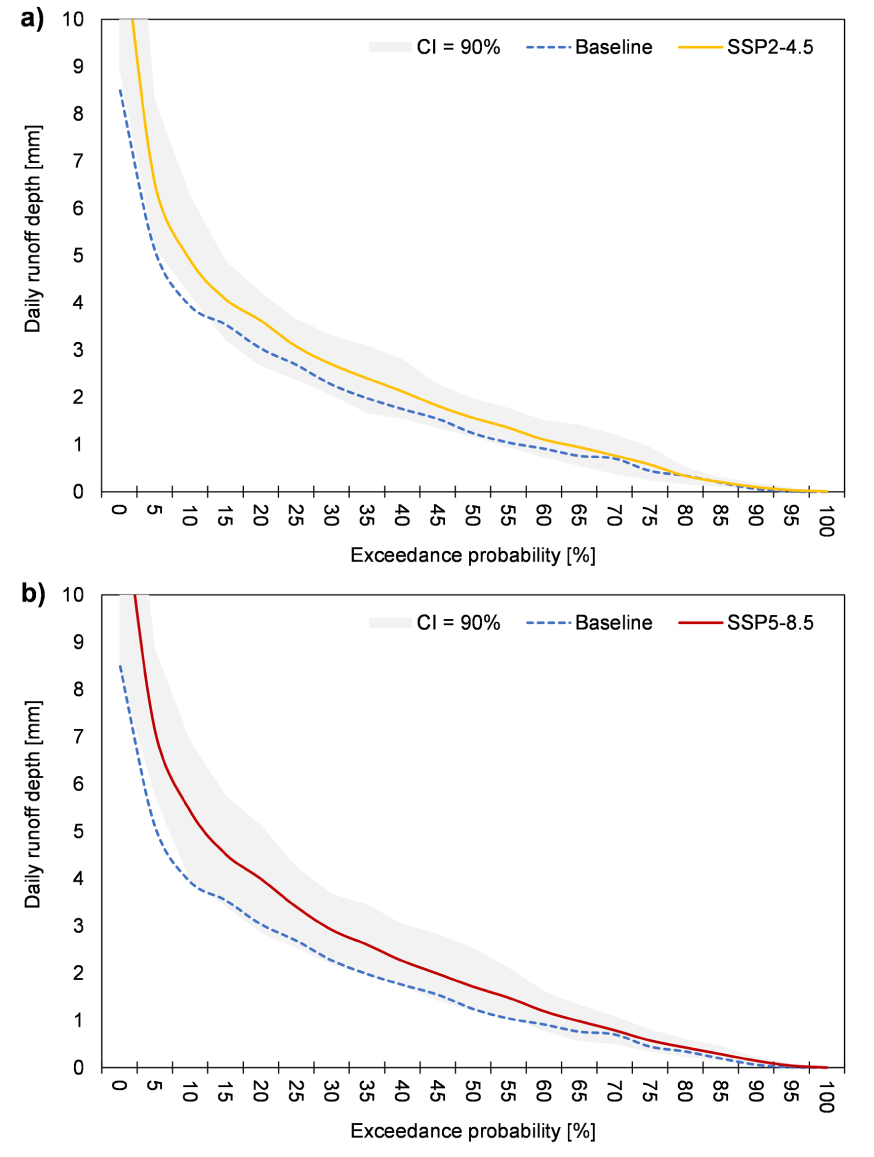
3.6. Effects of climate and land use changes on surface runoff
3.6.1. Contribution of climate and land use to changes in annual surface runoff
The isolated relative contributions of climate and land use changes to annual surface runoff are presented in Figure 14, averaged over the period 2031–2050. Figures 14a and c shows the relative contribution of climate and land use for the specific case where surface runoff is projected to increase (respectively under SSP2-4.5 and SSP5-8.5 scenarios). At the opposite, Figures 14b and d shows the relative contribution of climate and land use for the specific case where surface runoff is projected to decrease (respectively under SSP2-4.5 and SSP5-8.5 scenarios). For all panels in Figure 14, a positive (or relative) contribution translates that the projected changes in the factor (climate or land use) tends to cause an increase (or a decrease) in surface runoff.
Average relative contributions of climate (𝜂climate) and land use (𝜂lulc) to changes in average annual surface runoff between the baseline (1995–2014) and future (2031–2050) periods in Tougou watershed. (a) SSP2-4.5 scenario, surface runoff projected to increase. (b) SSP2-4.5 scenario, surface runoff projected to decrease. (c) SSP5-8.5 scenario, surface runoff projected to increase. (d) SSP5-8.5 scenario, surface runoff projected to decrease. 𝜂int refers to the average relative contribution of interaction effects between climate and land use.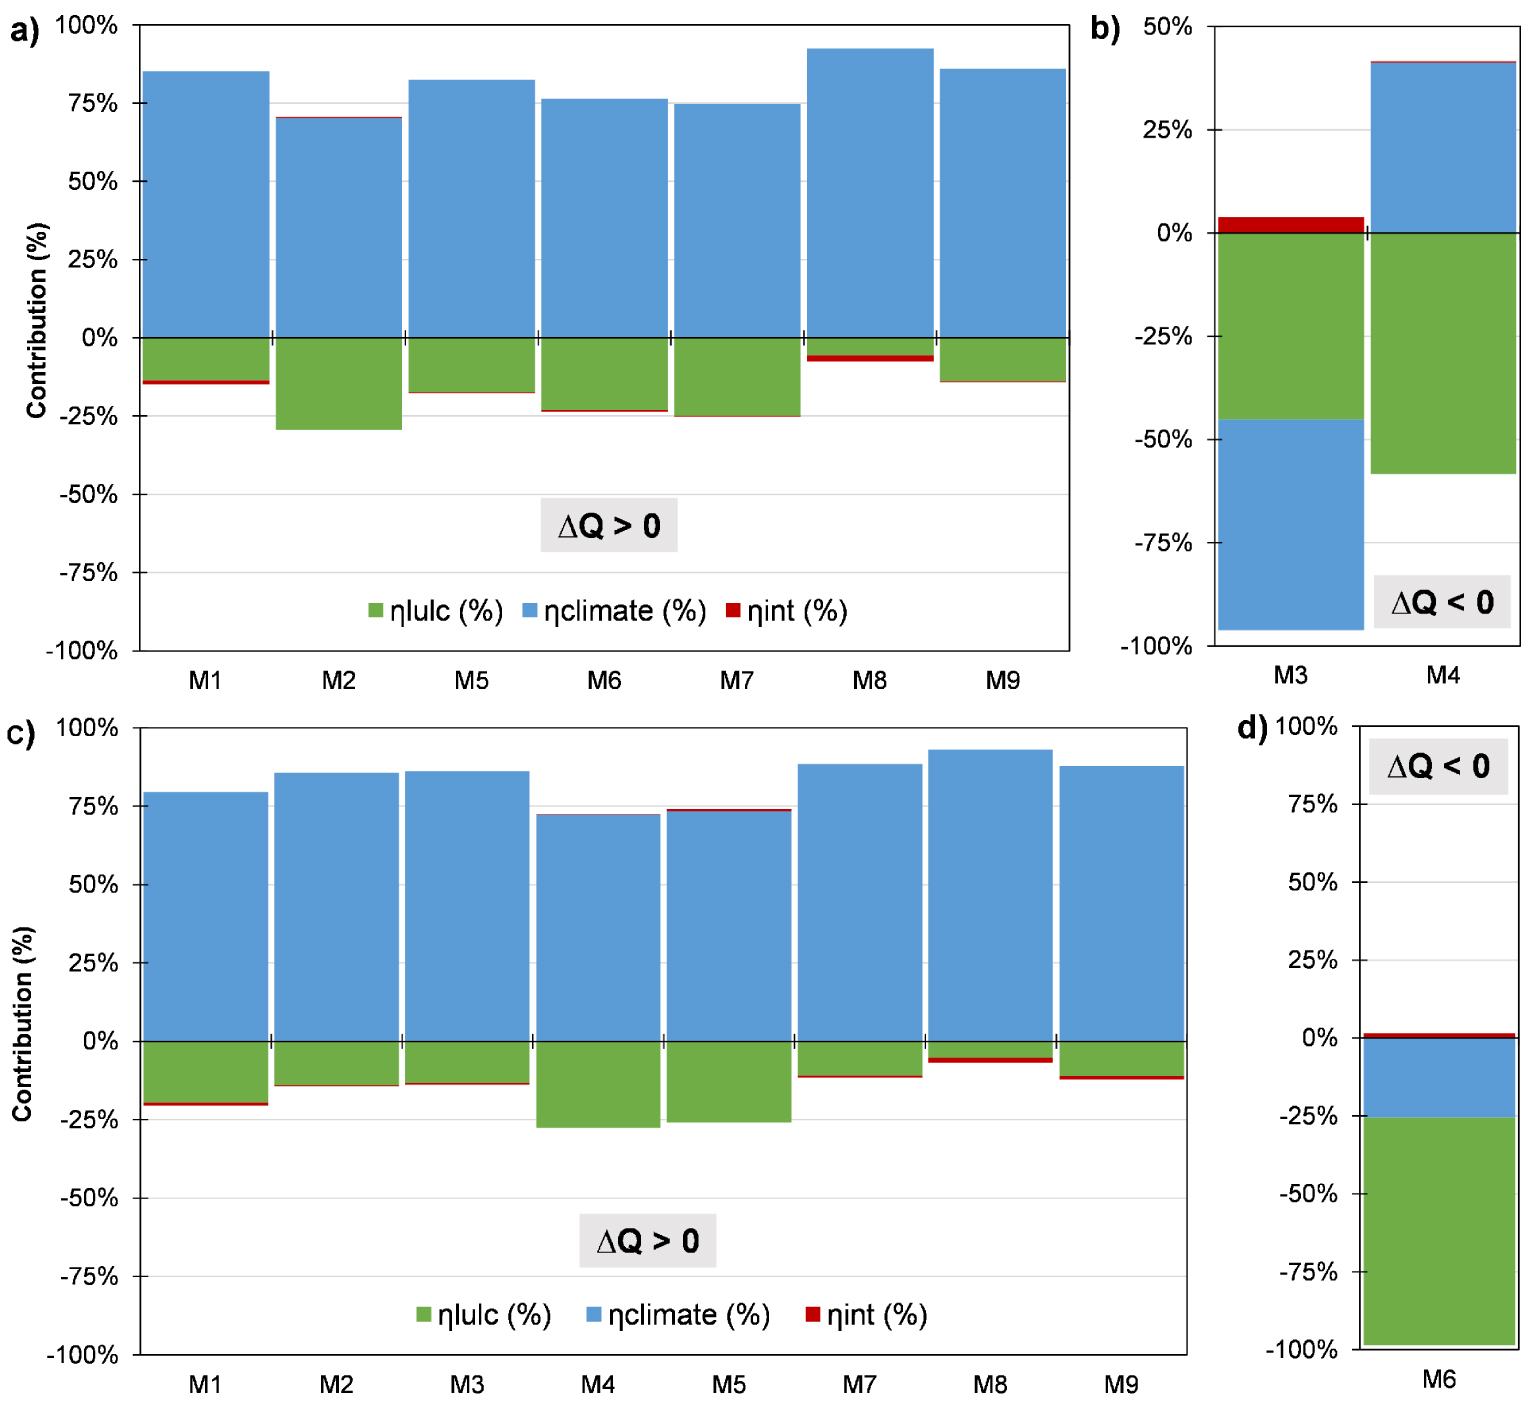
Under SSP2-4.5 scenario, surface runoff is projected to increase (between 25.7 mm and 279.6 mm) for 7 climate models (Figure 14a), which are the wetter ones (increase in average annual rainfall projected between 5.6% and 58.2%). In contrast (Figure 14b), for the 2 remaining drier climate models M3 and M4 (average annual rainfall change projected between −7.6% and 0.7%), surface runoff is projected to decrease (between 2.3 and 37.5 mm). When surface runoff is projected to increase (Figure 14a), the relative contributions of climate and land use to such increase range from 109.0% to 170.7% and from −6.6% to −71.5% respectively. When surface runoff is projected to decrease (Figure 14b), these relative contributions now range from −246.9% to 55.3% and from 48.9% to 349.3%. In this case, the model M4 shows a positive contribution as it projects a small rainfall increase (0.7%), which tends to increase surface runoff, albeit this contribution appears minor in comparison to the land use effect (which consistently tends to decrease surface runoff).
Under SSP5-8.5 scenario, the projected figures are similar: for 8 climate models in the ensemble (Figure 14c), surface runoff is projected to increase (between 29.9 mm and 304.7 mm). These 8 climate models are mostly wet (average annual rainfall increase projected between 6.6% and 61.0%). The relative contributions of climate and land use to the projected increase in surface runoff range from 108.0% and 160.9% and from −6.0% to −61.3% respectively. For the remaining drier climate model, M6 (projecting a decrease in annual rainfall of 2.3%), the annual surface runoff is projected to decrease by 24.4 mm: the relative contributions of climate and land use to this decrease are of 26.3% and 75.2% respectively (Figure 14d).
Overall, it appears that the relative contribution of climate is dominant under both SSP2-4.5 and SSP5-8.5 scenarios, as it is on absolute average 1.1 to 16.6 times higher (under SSP2-4.5) and 2.6 to 17.9 times higher (under SSP5-8.5) than that of land use. The increase in surface runoff could mainly be attributed to the increase in rainfall, further lessened by the effect of land use changes which typically tends to decrease surface runoff under all scenarios. The decrease in surface runoff can be explained by the decrease in bare areas between the baseline and the future period (from 44.8% to 10.7%). This decrease tends to produce less surface runoff. These bare areas are further replaced by cropland (which increased from 48.6% to 86.6%); these croplands tends to produce less surface runoff than bare areas [Yonaba et al. 2021a].
Smaller residual contributions, which range from −4.2% to 0.7% and from −2.0% to 1.6% under SSP2-4.5 and SSP5-8.5 respectively can be attributed to climate-land use interactions effects on surface runoff. Such contribution appears to be relatively small at the scale of the Tougou watershed. However, it should be acknowledged that these contributions convey various forms of uncertainties [Gbohoui et al. 2021; Onyutha et al. 2021; Yonaba et al. 2021a].
3.6.2. Contribution of climate and land use to changes in maximum daily surface runoff
Projected changes in maximum surface runoff quantiles under climate and land use changes. (a) Changes under SSP2-4.5 scenario. (b) Changes under SSP5-8.5 scenario. The error bars delineate the 90% confidence interval around the estimates across the models in the GCM ensemble.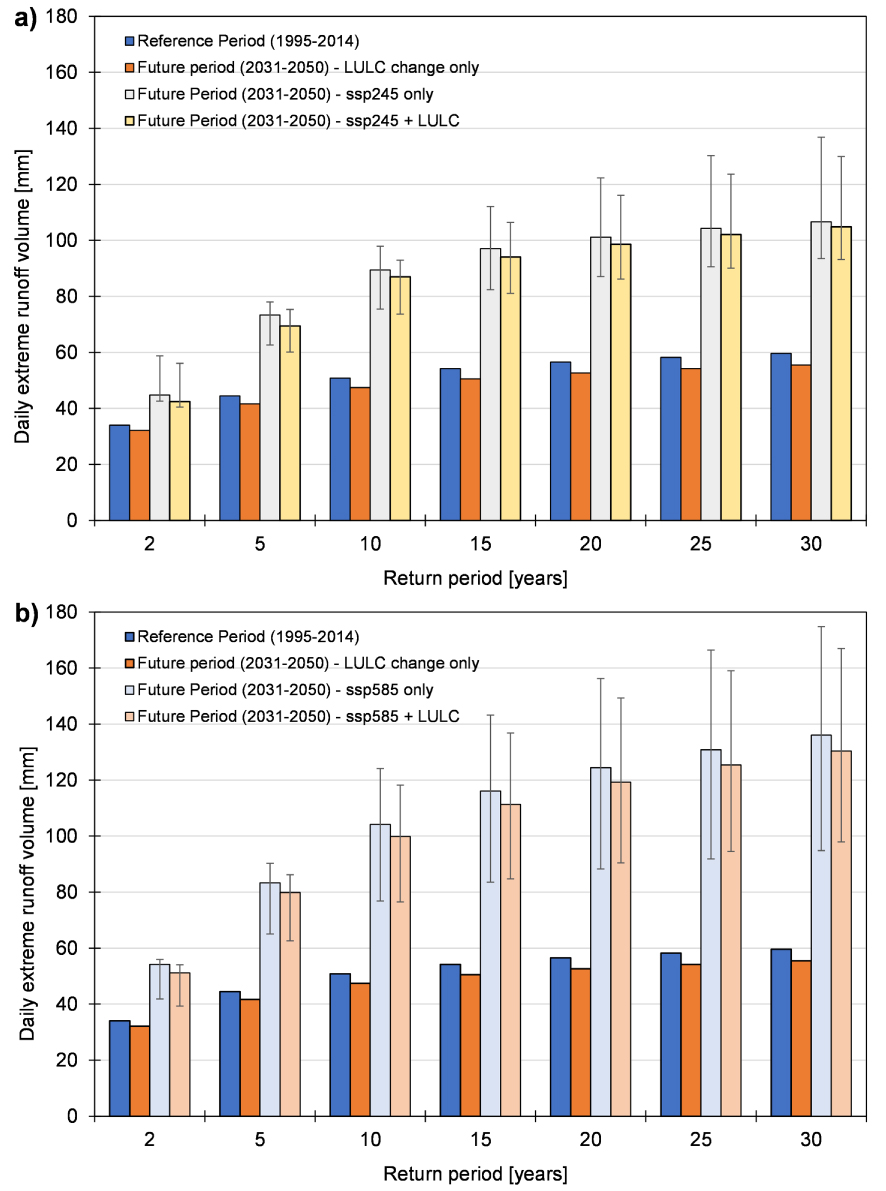
The Figure 15 pictures the evolution of daily maximum surface runoff for return periods from 2 to 30 years, under various scenarios (climate change, land use change). The quantification of these changes is presented in Table 5. A total increase in maximum daily surface runoff (SSP2-4.5: 8.4 mm to 45. 2 mm; SSP5-8.5: 17.1 mm to 70.8 mm) is projected. The analysis reveals that land use change causes of a decrease in maximum daily surface runoff (SSP2-4.5: 𝜂lulc = −22.8% to −9.1%; SSP5-8.5: 𝜂lulc = −11.1% to −5.8%). Also, the absolute reduction induced by land use changes decreases for increasing return periods. At the opposite, climate change causes an increase in maximum daily surface runoff (SSP2-4.5: 𝜂climate = 127.2% to 104.0%; SSP5-8.5: 𝜂climate = 117.7% to 108.0%). Climate-land use interactions effects are also quantified (SSP2-4.5: 𝜂int = −4.4% to 5.1%; SSP5-8.5: 𝜂int = −6.5% to 2.1%), although being relatively small in comparison to the isolated impact of climate and land-use changes. In definitive, the projected contributions of climate and land use on maximum daily surface runoff are similar to those observed on average annual values, albeit larger in magnitude.
Isolated contributions of climate and land use to changes in daily surface runoff quantiles
| Future scenario | Q2 | Q5 | Q10 | Q15 | Q20 | Q25 | Q30 | |
|---|---|---|---|---|---|---|---|---|
| SSP2-4.5 | 𝛥Qt (mm) | 8.4% | 25.0% | 36.2% | 39.8% | 42.1% | 43.8% | 45.2% |
| 𝛥Qlulc (mm) | −1.9% | −2.8% | −3.4% | −3.7% | −3.9% | −4.0% | −4.1% | |
| 𝛥Qclimate (mm) | 10.7% | 28.9% | 38.6% | 42.8% | 44.7% | 46.0% | 47.1% | |
| 𝜂lulc (%) | −22.8% | −11.3% | −9.3% | −9.2% | −9.2% | −9.2% | −9.1% | |
| 𝜂climate (%) | 127.2% | 115.8% | 106.7% | 107.6% | 106.1% | 105.0% | 104.0% | |
| 𝜂int (%) | −4.4% | −4.5% | 2.7% | 1.7% | 3.1% | 4.2% | 5.1% | |
| SSP5-8.5 | 𝛥Qt (mm) | 17.1% | 35.4% | 49.0% | 57.1% | 62.8% | 67.2% | 70.8% |
| 𝛥Qlulc (mm) | −1.9% | −2.8% | −3.4% | −3.7% | −3.9% | −4.0% | −4.1% | |
| 𝛥Qclimate (mm) | 20.2% | 38.9% | 53.4% | 61.9% | 67.9% | 72.6% | 76.5% | |
| 𝜂lulc (%) | −11.1% | −8.0% | −6.9% | −6.4% | −6.2% | −6.0% | −5.8% | |
| 𝜂climate (%) | 117.7% | 109.8% | 108.8% | 108.5% | 108.2% | 108.1% | 108.0% | |
| 𝜂int (%) | −6.5% | −1.8% | −2.0% | −2.0% | −2.1% | −2.1% | −2.1% | |
Q2 refers to the daily extreme surface runoff for 2-years return period. Likewise, Q30 is the daily extreme surface runoff for a 30-years return period. 𝛥Qt is the total change in surface runoff affected both by climate and land use changes. 𝛥Qlulc is the change in surface runoff caused by land use change, and 𝛥Qclimate is the change in surface runoff caused by climate change.
4. Discussion
4.1. On the contributions of climate and land use changes to surface runoff
In this study, using a hydrological modelling framework, the combined and isolated impact of climate and land use changes on surface runoff have been assessed between a baseline period 1995–2014 and a future period 2031–2050, under two warming scenarios (SSP2-4.5 and SSP5-8.5). The overall analysis results showed that rainfall and PET are projected to increase (under both SSPs), which is likely to cause an increase in actual evapotranspiration as well. Furthermore, the increase in rainfall is likely causing an increase in surface runoff, overriding the minor streamflow reduction caused by land use changes.
In previous studies, the hydrological response of West African watersheds to changes in climate and land use have been reported for past (historical) and current conditions. Many studies established that surface runoff generating mechanisms in the Sahel region are tightly dependent on soil surface conditions, hence explaining the dominant effect of land use changes over past and current climate conditions on changes in hydrological balance [Descroix et al. 2018; Gal et al. 2017; Karambiri et al. 2011; Paturel et al. 2017; Séguis et al. 2004; Yonaba et al. 2021a]. Yet, few studies have assessed the specific contributions of climate and land use changes on surface runoff variability and changes in West Africa.
Aich et al. [2015] used the Soil and Water Integrated Model (SWIM) with dynamic land use update to assess the relative contributions of climate and land use to the change in trends in floods magnitude. Without drawing a general answer, roughly equal shares of contributions for land use and climate contributions are reported for Gorouol and Sirba catchments. Sidibe et al. [2019] showed that in most of the West African Sahel, changes in land use are the major driver in surface runoff fluctuations over the period 1950–1990, further amplified by climate variability that occurred within the same period. Yonaba et al. [2021a] used the SWAT model in the Tougou watershed, over the historical period 1952–2005 and found that the fluctuations in surface runoff along with the hydrological paradox that occurred within the 1970s (likewise, in most Sahelian hydrosystems) could mainly be attributed to land use changes. Gbohoui et al. [2021], in the Nakanbe River Basin, reported similar conclusions using a Budyko-type separation approach; however, the same authors observed an increasing contribution of climate-environment interaction effects on surface runoff fluctuations.
Regarding future climate projections over the Sahel area, essentially for rainfall, forecasts are mitigated, with high zonal contrasts. For the 2050 timeline, Mbaye et al. [2016] projected a decrease in rainfall over the western part of the Sahel; Tazen et al. [2013] projected a change in annual rainfall in the range of −3% to +10% over the Nakanbe River Basin; Badou et al. [2018] reported an increase in rainfall (1.7% to 23.4%), but with contrasting changes (−8.5% to 17.3%) over the Niger River basin. Recently, Dieng et al. [2022] projected a significant increase in rainfall between 5% to 20% for Sahara and Western Sahel regions using bias-corrected high-resolution climate change simulations. Ultimately, there is still no consensus across studies on the direction in which rainfall is likely to evolve over the West African Sahel [Almazroui et al. 2020], let alone the resulting impacts on hydrological processes [Stanzel et al. 2018]. Also, large uncertainties across climate models are still persistent, bringing a supplemental layer of complexity in assessing future forecasts [Hattermann et al. 2018; Laux et al. 2021]. It should also be acknowledged that most of the previous studies use datasets issued from CMIP5 models. In this regard, this study sheds new insights in comparison, as it is among the first (to the best of our knowledge) to assess the latest available iteration of climate change simulations, that is CMIP6, in northern Burkina Faso.
In terms of future projections, this study reported an increase in surface runoff, more likely controlled by an increase in rainfall, although slightly mitigated by future land use changes. The dominant control of climate (i.e. rainfall) expected in the future is clearly at the opposite of what occurred in past and current conditions, and is likely attributable to: (1) the large increase in rainfall conditions; (2) the almost exclusive sensitivity of surface runoff to rainfall conditions; (3) the scale of observation which is, in this study, relatively small (37 km2). As shown in Mounirou et al. [2020, 2021], surface runoff generating processes change with scale. Likewise, Gbohoui et al. [2021] showed that for varying nested watersheds scale, the control of environmental conditions (i.e., land use) is dependent on the size of the watershed. In contrast for example, in southwestern Burkina Faso, Idrissou et al. [2022] projected to the 2050 horizon an increase in surface runoff (12% to 95%) and also a decrease (24% to 44%), primarily driven by land use changes in both cases.
Regarding annual maximum surface runoff, an increase in the amplitude of runoff quantiles is reported in this study, largely caused by the increase in rainfall quantiles. These findings agree with previous studies, which reported an intensification of rainfall over the Sahel region, with a subsequent increase in surface runoff in most of the cases [Panthou et al. 2018; Taylor et al. 2017; Tazen et al. 2019; Tramblay et al. 2020]. Hounkpè et al. [2019] showed that land use changes (especially the conversion of natural vegetation to croplands) could contribute to the increase in both the frequency and magnitude of floods, amplifying the contribution of the projected rainfall increase.
4.2. Practical implications of this study
In the light of the findings presented in this study, a few major practical implications to hydrologists and water resource managers can be drawn:
- there is a need to assess, at larger and various scales and contexts, the direction of the future evolution of climate based on future climate projections. Yet, the cautious use of such data in impact studies is recommended, since they can be fraught with large discrepancies with past observations over their historical baselines [Dieng et al. 2022]. Post-processing these simulations is always possible (bias-correction), even though the added value of such processing is questionable, and should be critically discussed depending on the impact study to be carried out [Laux et al. 2021]. This also relates to the need for large sets of observations, which are scarce in the Sahelian context. Gridded datasets [Dembélé et al. 2020; Satgé et al. 2020], which provide estimations of rainfall from satellite observations, or bottom-up inversion from soil humidity [Brocca et al. 2019; Yonaba et al. 2022] can be considered as reliable alternatives.
- There is also a growing need to include hydrological modelling at the core of water resource management. With the increase of available hydrological models of varying complexity, interesting insights can be drawn regarding how various processes and inputs affects a watershed balance, and therefore developing informed strategies for water resource management can be further considered [Karambiri et al. 2011; Lèye et al. 2021].
- Also, regarding hydrological modelling, it is established that land use changes significantly affect surface runoff, especially in the Sahel region. Yet, in its current practice, most hydrological modelling applications still represent land use with static conditions, which leads to either inaccurate representation of spatial/temporal patterns of hydrological processes, or over/under parametrization of such models [Hounkpè et al. 2019; Wagner et al. 2016; Yonaba et al. 2021a]. Therefore, there is a need to develop integrated modelling frameworks, to fully account for dynamic land use changes during hydrological simulations, for more reliable outputs.
4.3. Limitations of this study
Some of the limitations this study is fraught with should be acknowledged, to clarify the scope to which the reported results should be fully assessed.
First, for future rainfall projections, only the mean (or the median) of the model ensemble was considered most of the time, which is valid since the ensemble features a large number of models [Maraun 2016]. However, an in-depth assessment of the uncertainty range around future projections should be carried out to draw a more complete picture of the possible contribution of climate change and land use to changes in surface runoff. In this study for example, uncertainties stem from multiple sources, including the GCM selection, the climate data pre-processing (statistical bias-correction), the land use/land cover maps (which embody spatial and structural uncertainties) and the hydrological model parametrization and simulations. The issue is acute in general to all impact studies which use a hydro-climatic modelling chain to assess the contributions of climate and land use on the water resource [Clark et al. 2016]. In this study, in an effort to bridge this gap, uncertainties around GCM projections in rainfall and surface runoff are provided to some extent, based on aggregation of the individual models in the GCM ensemble. However, the uncertainty range around the hydrological model parameters range was not fully assessed on surface runoff estimates. However, dedicated research paths are proposing explicit approaches to decompose uncertainties (i.e. variance decomposition) according to its various sources to provide a better quantitative and qualitative insight regarding how trustful the projected impacts should be perceived [Bosshard et al. 2013; Gao et al. 2019].
Second, regarding future land use, a single business-as-usual narrative, was considered in this study [Yonaba et al. 2021b]. This trajectory is actually closely similar to the land use narrative built within SSP2-4.5 [Popp et al. 2017]. However, different land change scenarios should be assessed through the framework used in this study, to provide a larger picture of the contribution of various land use narratives on surface runoff in the study area. Such future land use maps can be developed using statistical pattern-based approaches (cellular automata or artificial neural networks, for example), coupled with land demand models build around future scenarios: expansion of croplands to meet increasing food demand, mitigation policies to preserve natural vegetation for sustainability, etc. [Yonaba et al. 2021b].
5. Conclusion
This study seeks to quantify the contribution of climate and land use to changes in surface runoff in the Tougou watershed, a typical Sahelian hydrosystem, located in the Upper Nakanbe River basin, in Burkina Faso (in West Africa). Between the baseline period (1995–2014) and the future period (2031–2050), a multi-model ensemble of 9 GCMs (issued from CMIP6 simulations) is used to drive a calibrated hydrological SWAT model, along with a dynamic land use update of LULC maps (for past and future conditions). An increase in annual rainfall (13.7% and 18.8%, respectively under SSP2-4.5 and SSP5-8.5 scenarios) and also in daily maximum rainfall (from 26.6% to 45.1% under SSP2-4.5 and from 35.5% to 77.2% under SSP5-8.5 scenarios), is projected. This increase is found to be the major cause of a significant increase in daily surface runoff, as shown by the rise of flow duration curve. The annual streamflow is projected to increase (24.2% and 34.3% under SSP2-4.5 and SSP5-8.5 respectively). In terms of relative contributions, land use change (mainly the conversion of bare lands to croplands) is expected to cause a decrease in annual surface runoff, with a contribution of −27.6% to −19.5% (under SSP2-4.5 and SSP5-8.5 scenarios respectively), and also in maximum daily surface runoff (SSP2-4.5: −22.8% to −9.1% and SSP5-8.5 11.1% to −5.8%). In contrast, the contribution of climate (i.e., the rainfall) to the annual surface runoff increase is dominant, with a contribution of +128.8% and +120.7% (respectively under SSP2-4.5 and SSP5-8.5 scenarios), and likewise for maximum daily surface runoff (SSP2-4.5: +127.2% to +104.0%; SSP5-8.5: +117.7% to +108.0%).
Overall, these results shed light on the isolated contributions of climate and land use, and their interaction to the changes in hydrological processes. It also shows that such processes stem from the complex nature and interplay between climate and land change (both including natural and anthropogenic change), which should be fully assessed and integrated within an integrated modelling framework for more realistic and more reliable outputs. Finally, as the increase in surface runoff in the Tougou watershed is likely, future strategies should focus on: (i) mitigation of associated risks such as flood control; (ii) surface runoff management through farming practices (zaï, half-moons, stone rows) to increase soil water content for agricultural production; (ii) and finally, mitigation of runoff erosion. The results of this study might significantly help in framing such policies, as it unveils increased risks relating to climate change in the future, which could be effectively mitigated through local and effective land use decisions.
Conflicts of interest
Authors have no conflict of interest to declare.
Acknowledgements
This study has been carried out under the financial support of the Work Bank, through the Government of Burkina Faso (grant IDA n° 5420-BF). The authors are also extremely grateful to the local community of the Tougou village (in Burkina Faso) for their helpful assistance and cooperation; especially since this local community is nowadays hardly affected by the ongoing security crisis in Burkina Faso.