

1 Introduction
Climate variability in the dry and arid parts of India poses a great risk to the people and resources of these regions (INCCA, 2010) as the smallest fluctuations of weather parameters like precipitation not only damage the agriculture and economy of the region but disturb the overall water cycle (Krishna Kumar et al., 2004; Zhang et al., 2011). Study of the space-time variability of rainfall assumes great importance for India, as its economy is largely dependent on agriculture (Davey and Peilke, 2005). Undeniable regional and global impacts have been observed due to the slightest variability in the precipitation patterns (Dash et al., 2004; New et al., 2001; Pal and Al-Tabbaa, 2009). Time series analysis is used to understand this random mechanism and to predict future series based on past data.
The study explores the rainfall behavior in the pre-monsoon season over a period 1949–2009 for the western part of India; the importance of this study is that it uses long series station-wise data for western part of India, which is semi-arid and has extremely low pressure conditions and intense dust storms during this season. Differential heating of land and sea is the precursor for monsoons, so understanding the trend of rainfall during these months in the north-western part of India is important to understand the overall pattern of monsoon (Bhutiyani et al., 2009; Chatterjee et al., 2009; Das et al., 2002).
The statistical and practical significance of trend was analyzed using a pre-whitened Mann Kendall test, percentage changes over the long term mean were calculated using Theil Sen's median slope estimator. Forecast was done using ARIMA model for a period 2010 to 2030. We have tried to understand the changes in pre-monsoon rainfall which is distinctly convective in nature and has direct influence on different monsoon branches. Computation of trends during the pre-monsoon season gives a clear indication of performance of subsequent monsoons if correlated with meteorological attributes. The study indirectly focuses on the changes and connection in the western branch (which is special because this region is influenced by dust storms) of the monsoon, and the overall trend of pre-monsoon rainfall in the country.
2 Methodology and data
Data used for this study were obtained from Indian Meterological Department (IMD). Monthly Rainfall data for March, April, May (MAM) for six stations (Abu (Ab), Ahemdabad (Ah), Ajmer (Aj), Amritsar (Am), Bikaner (Bk), Jodhpur (Jd)) for a period of 60 years were analyzed. Consistency checks and data gaps were filled according to standard procedures. Trend analysis was performed on rainfall data using a pre-whitened Mann Kendall Test, autocorrelation removal was done in the required datasets at the chosen level of significance (α = 10%). The magnitude and practical significance of trend has been estimated using the Theil and Sen's median slope estimator, and by assessing the percentage change over the mean for the period concerned (Yue and Hashino, 2003; Yue et al., 2002).
In this study, a rank-based non-parametric Mann Kendall (MK) test is used. The MK test is the most common test used for trend analysis of hydro meteorological data (Yue et al., 2002). The limitation of the MK test is that in the case of positive autocorrelation present in series, it shows a positive trend even when trend is not present (Bayazit and Önöz, 2007). The pre-whitened Mann Kendall (PWMK) test was developed by Von Storch to remove the effect of autocorrelation from the series (Bayazit and Önöz, 2007). The pre-whitened Mann Kendall test removes the autocorrelation at lag 1 assuming an AR (1) model and then applies Mann Kendall test to the independent series (Bayazit and Önöz, 2007; Yue et al., 2002), in case autocorrelation is detected at the same significance level.
2.1 Mann Kendall test
The null hypothesis H0 states that the data series is independent and identically distributed and the alternate hypothesis H1 states existence of a trend.
The general MK test has test statistics S defined as:
| (1) |
| (2) |
Results of Mann Kendall test are supposed to be normally distributed for n ≥ 8 with mean and variance described as:
| (3) |
| (4) |
| (5) |
The standard MK statistic Z follows the standard normal distribution with zero mean and unit variance.
2.2 Pre-whitened Mann Kendall test
A modification of the MK test, PWMK test is generally applied in presence of autocorrelation. The removal of autocorrelation is accomplished by:
| (6) |
| (7) |
Here and Var (xt) are the sample mean and sample variance of the first (n–1) terms and and Var (xt+1) is the sample mean and sample variance of the next (n–1) terms. The presence of significant autocorrelation in the series is checked by Student's t test (Cunderlik and Burn, 2004), where the null hypothesis of no autocorrelation is rejected if
| (8) |
The MK test was applied after the removal of the autocorrelation wherever it was present at the chosen level of significance (α = 10%).
2.3 Theil and Sen's median slope estimator
The magnitude of trend has been estimated using the Theil and Sen's median slope estimator. This method gives a robust estimate of trend (Yue et al., 2002) as it is not influenced by outliers. The slope estimates of N pairs of data are first computed by
| (9) |
Here xj and xk are data values at time j and k, respectively, where (j > k).
The median of the N values of Qi is the Sen's estimator of slope where:
| (10) |
The trends which have statistical significance might not have practical significance and vice versa (Yue and Hashino, 2003), hence the practical significance of trend was assessed by estimating the Theil and Sen's median slope and assessing the percentage change over the mean for the period concerned.
3 Forecasting
Climate modelling using GCMs has been used extensively to predict pattern of climatic variables globally (IPCC, 2007). However, GCM forecasts have certain limitations (Sun et al., 2009; INCCA, 2010). In recent years, time series modelling approach for climatic variables is gaining popularity amongst researchers (Boochabun et al., 2004; Chattopadhyay and Chattopadhyay, 2010), and has been followed here.
3.1 Choice of model and parsimony
In the current study, ARIMA model has been used for forecasting rainfall for the period 2010–2030. ARIMA modeling predicts future values as a product of several past observations and random errors (Yurekli et al., 2007). As a modeling technique, ARIMA has been beneficial for predicting hydro meteorological parameters (Boochabun et al., 2004; Chattopadhyay and Chattopadhyay, 2010; Chattopadhyay et al., 2011; Hipel et al., 1977).
The ARIMA (p, d, q) can be expressed as (Box et al., 2007):
| (11) |
| (12) |
The modeling process includes model identification and diagnostic checking. The identification test is done to obtain the value of order of differencing ‘d’ in ARIMA (p, d, q) and also the values of AR and MA operators. The need for differencing to make the series stationary has been thoroughly explained by Dickey and Fuller (1979).
3.2 ADF test for unit roots
| (13) |
Climatic data has no fixed mean, and for ARIMA modeling, stationarity is a prerequisite. So when the observed data exhibits trend and heteroscedasticity, application of differencing, a log or a square root transformation is required to reduce it to a stationary series (Yurekli et al., 2007). Parsimonious model selection was done by using Akaike Information Criterion (AIC), a model with minimum AIC being considered.
The AIC is expressed in the form:
| (14) |
After fitting the parsimonious model, the residuals were subjected to a diagnostic test to check the randomness of the residuals. An ARIMA model with random residuals at particular significance level (α = 10%) is considered as the best fit model. The randomness was checked using the Ljung–Box test statistics for checking the presence of autocorrelation in the residual series.
The Rank test was used as another test of randomness. It is particularly suitable for detecting presence of linear trend in the time series. Here P is defined as the number of pairs (i, j) such that yj > yi (Brockwell and Davis, 2009). The assumption of randomness of the series yj is rejected at level α if .
The whiteness of the residual was checked by examining the Residual ACFs (RACF) of the models. The RACF can be calculated by Hipel et al. (1977):
| (2) |
The ARIMA model for each station was then used to forecast the rainfall values until 2030.
4 Results and discussions
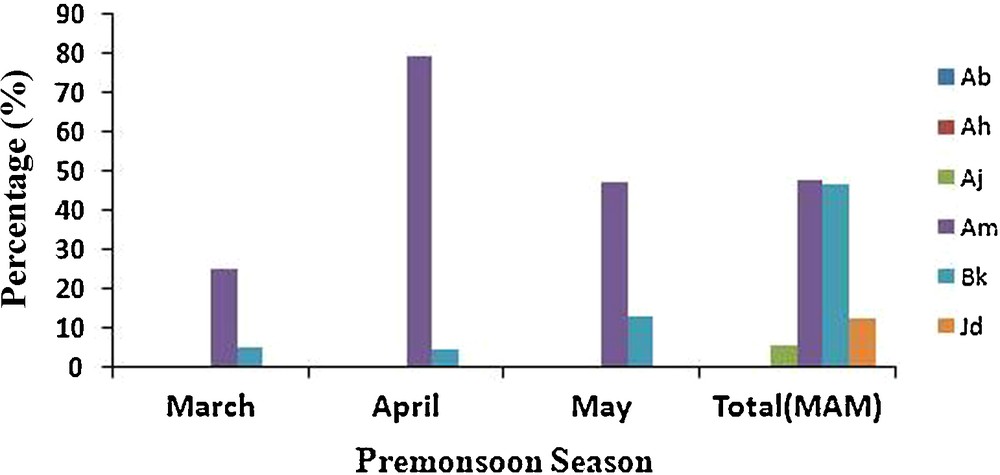
Sixty years of data have been analysed for six stations on the western side of India. Table 1 represents the location of stations and the mean rainfall. The stations located on the western side of India fall in the semi-arid zone which is characterized by both scant and random convective rainfall. Statistical significance at (α = 10%) level is analysed for all six stations, From Fig. 1 it is evident in terms of Z statistics that an overall positive trend is observed in April, May for almost all the stations and negative trend in March for four stations; however, at the α = 10% level of significance, two stations (Ah), (Ab) do not show any trend in rainfall during MAM. Significant trend in rainfall is observed in (Bk), (Jd) in April and (Bk), (Am) in May. Two stations (Aj), (Bk) show significant trend for the entire pre-monsoon season. Monthly level analysis of the percentage change in rainfall showed an overall rise for two stations Bk, Am during MAM.
Stations avec leur localisation géographique et la pluviosité moyenne pré-mousson.
| Station | Latitude | Longitude | Altitude (msl) |
Mean MAM rainfall (mm) |
Standard deviation (mm) |
| Abu (Ab) | 24.48 | 72.78 | 1722 | 21.2 | 43.5 |
| Ahmdabad (Ah) | 23.1 | 72.6 | 55 | 10.5 | 21 |
| Ajmer (Aj) | 26.45 | 74.63 | 486 | 21.3 | 25.9 |
| Amritsar (Am) | 31.6 | 74.9 | 234 | 74.3 | 57.2 |
| Bikaner (Bk) | 28 | 73.3 | 227 | 47.1 | 81.2 |
| Jodhpur (Jd) | 26.28 | 73.03 | 230 | 32.9 | 58.2 |
Percentage change (α = 10%) rainfall for different stations during pre-monsoon season.
Pourcentage de changement de pluviosité (α = 10 % pour différentes stations pendant la saison de pré-mousson.
Rainfall in the pre-monsoon period is due to formation of semi permanent heat lows over the northwest parts of India and central parts of Pakistan during the summer months (Chandrashekhar, 2010). The rise in the surface air temperature since 1971 (Krishna Kumar et al., 2004) during the months of March, April and May probably suggests intensification of the convective heating over the region extending from 24°N to 37°N and 68°E to 89°E (Indo Gangetic Plain, Northwest Rajasthan, western India, Indian peninsular region); the trends obtained in the study are consistent with these observations. Similar findings have been reported by Kothawale et al., 2010, indicating the presence of an increasing trend in the number of hot days and hot nights over entire India. The increasing trend in rainfall in the northwest parts of Rajasthan especially in (Bk) and (Aj) might be due to intense heat lows and resultant rainfall. Further, the month of May is characterized by major reversal of surface winds that brings warm, moist and unstable air from Indian Ocean into the Indian Peninsular region under the influence of land sea thermal contrast, which plays a major role in the establishment of planetary scale monsoon circulation over the entire subcontinent for coming months (Chandrashekhar, 2010). Recent studies on the impacts of aerosols on the Indian Summer Monsoon rainfall (Gautam et al., 2009; Lau et al., 2006; Nigam and Bollasina, 2010) have found increasing aerosol loading in the pre-monsoon months (MAM). Lau et al. (2006) reports build up of aerosol loading in the MAM, peaking up in May over the entire North, Northwest India and Indo Gangetic Plains. The source of aerosol in these regions are from the dust transported from deserts of Saudi Arabia, Afghanistan and Pakistan along with black carbon from local emissions (Gautam et al., 2009; Lau et al., 2006). Studies by Beegum et al. (2009), Bollasina and Nigam (2009) and Kumar et al. (2009) have found increased black carbon loading in the recent period. These changes in atmospheric aerosol loading can be correlated with the changes in the rainfall trends.
4.1 ARIMA forecasting
ARIMA modeling was done for forecasting the pre-monsoon rainfall for all the six stations. Root Mean Square Error (RMSE) was computed to check the accuracy of model fitting in Table 2, and Fig. 2 by comparing the forecast results for 2000 to 2009 using input data from 1949 to 1999. The most parsimonious model with minimum AIC, which passed the test of randomness were selected for forecasting rainfall until 2030. The model parameters, along with diagnostic statistics and predicted rainfall as percentage, change over long term mean, see Table 2. From forecast results stations (Ab), (Ah) show negative change in pre-monsoon rainfall: this could be attributed to rapid local change in land use land cover. The stations like Bk show positive change in rainfall; this could be due to the high fine aerosols load in that region (Sarkar et al., 2005).
Modèles ARIMA sélectionnés et prévision des données de pluviosité pré-mousson pour toutes les stations.
| Station | ARIMA Model | AIC | RMSE | Test of Randomness | % change for 2030 | |
| LBQ/P | Rank test Statistics | |||||
| Ab | (2,2,3) | 334.26 | 11.82 | 0.31 | 0.39 | –0.86 |
| Ah | (2,2,1) | 303.81 | 26.58 | 0.15 | 0.2 | –0.4 |
| Aj | (2,2,2) | 308.52 | 24.08 | 0.61 | 0.23 | 20.9 |
| Am | (1,0,4) | 126.02 | 33.33 | 0.12 | 0.54 | 13.21 |
| Bk | (1,2,1) | 358.46 | 57.83 | 0.22 | 0.25 | 31.13 |
| Jd | (2,2,1) | 348.93 | 95.27 | 0.45 | 0.68 | 25.66 |

Percentage change of rainfall for observed (1949–2009) and predicted (2010–2030) years for all stations.
Pourcentage de changement de pluviosité pour les années observées (1949–2009) et prévisionnelles (2010–2030) pour toutes les stations.
This part of India has extremely high temperatures, and the further convective nature of rainfall in MAM makes it more sensitive to local land use land cover changes. Hence detecting the long term change in mean values, as done in this study, gives a possible idea of changes in rainfall pattern in the study area.
5 Conclusion
Analysis of long-term time series (1949–2009) for western region stations using the non-parametric pre-whitened Mann Kendall test showed evident changes in rainfall pattern during the pre-monsoon season. Four stations (Amritsar, Bikaner, Jodhpur and New Delhi) in the north-western and western part of the country show increase in pre-monsoon rainfall of 10% or more; while at two stations (Ajmer and Bikaner) it was statistically significant. Analysis at a monthly level shows statistically significant increasing trend in May rainfall at six stations distributed over a wide expanse. Forecast results from ARIMA modelling show that (Ab), (Ah) have negative change due to rapid local change in land use. Further studies are needed to understand factors affecting pre-monsoon rainfall.
Acknowledgements
Authors extend sincere thanks to following people and agencies for the support: IMD, Helmut Lutkepohl and Markus Kratzig (for software JMulTi), Brockwell and Davis (for ITSM 2000 ARIMA model) and University Grants Commission (UGC) for the financial support.