

1 Introduction
The summer monsoon during the months of June to September (JJAS) is the major rainfall season for India. Hence, the prediction of Indian summer monsoon rainfall (ISMR) is always in high demand as its high variability has significant impact on economy of the country. However, the job of prediction of such erratic phenomenon is one of the multifaceted climatological problems because of the intrinsic intricacy of the physical processes associated with it. Considering the uncertainty associated with the said climate system, probabilistic forecast in monthly and seasonal scales has gained attention in recent years. Most of the statistical forecasting techniques available till dates – e.g. Thapliyal (1981), Gowariker et al. (1991), Sahai et al. (2003), Rajeevan et al. (2007) and Acharya et al. (2012a) – have concentrated only in generating a deterministic prediction without any measure of its inherent uncertainty. Deterministic prediction gives a specific value that is considered most likely to occur in the future. Due to the inability of such predictions to grab the variability to a large extent, they have mostly failed in the extreme years (Gadgil et al., 2005). As Indian economy is highly dependent on agriculture, there is greater need to represent uncertainties in seasonal predictions and to communicate these uncertainties to the agricultural agencies. As probabilistic predictions have the ability to quantify the uncertainty, it has more potential to decision makers than deterministic forecasts (Krzysztofowicz, 1983). Zwiers (1996) and Kharin and Zwiers (2002) have shown that the level of uncertainty of the climate system can be appropriately viewed in a quantitative way by a probability density function. In subsequent studies by Kumar et al. (2001) and Palmer et al. (2004), the probabilistic forecast has been established to be a better way to disseminate a seasonal forecast as it potentially represents the uncertainty of the prediction. In recent years, the probabilistic forecast based on general circulation model (GCM) has drawn considerable attention. Plethora of studies has considered GCM-based probabilistic approach for seasonal forecast. Examples in this direction include the works of Kharin and Zwiers (2003a), Palmer et al. (2005), Tippett et al. (2005, 2007), Rajagopalan et al. (2002), Robertson et al. (2004), Doblas-Reyes et al. (2000) and Min et al. (2009). In addition to the said studies, some of the operational centers (International Research Institute for Climate and Society (IRI), USA; The Asia–Pacific Economic Cooperation (APEC) Climate Center (APCC), Korea) routinely provide probabilistic forecast to produce seasonal forecasts (Barnston et al., 2010; Sohn et al., 2012). In the context of Indian summer monsoon rainfall (ISMR), only a few studies (Acharya et al., 2012b; Kar et al., 2011; Kulkarni et al., 2012) have raised the issues of making probabilistic forecast using GCMs. The studies mentioned above described the parametric way to calculate the probabilistic forecast along with its inherent uncertainty. However, no systematic study exists on nonparametric method for seasonal prediction of the Indian summer monsoon rainfall. The present work is deviated from the earlier studies in the sense that it concentrated only on the nonparametric approaches for predicting ISMR in detail.
The main purpose of the present study is to develop a probabilistic multi-model ensemble based prediction of ISMR using non-parametric ways. The novelty of the present study lies in the fact that it attempts:
- • to generate probabilistic prediction of ISMR from each of the GCM by non-parametric ways and compare them;
- • to apply different multi-model ensemble schemes for assigning weights to the probabilities obtained from each GCM;
- • to compare the performance of such different multi-model schemes for probabilistic prediction of ISMR.
The rest of the present manuscript is planned as follows: Section 2 describes the observed data and GCM's products used in the study. Methodology for probabilistic prediction and multi-model ensemble schemes for combining probabilities is described in Section 3. Section 4 presents the result and discussion part. Based on the result, summary and conclusion are discussed in Section 5.
2 Data
2.1 General Circulation Model (GCM) products
In the present study, outputs from seven general circulation models of different organizations like International Research Institute (IRI, USA), National Center for Environmental Prediction (NCEP, USA) and Japan Agency for Marine-Earth Science and Technology (JAMSTEC, Japan) have been used. Among those seven GCMs, two are only atmospheric models and the remaining five are atmospheric-ocean coupled models. For this study, we used lead-1 (initial conditions of May start) hindcast runs (1982–2008) of the models for summer monsoon seasonal rainfall (i.e. mean rainfall of June-July-August-September which is abbreviated as JJAS). The products of all the GCMs have been downloaded from IRI website (http://portal.iri.columbia.edu/portal/server.pt). A brief summary of each model including members, resolution and relevant citations is presented in Table 1. Detailed descriptions of these GCMs are presented in the works of Acharya et al. (2011), which also dealt with the deterministic skills of GCMs and their real-time skills in predicting the 2009 drought. This study showed that these GCMs have varying skills in simulating climatology and interannual variability of observed rainfall due to their inherent large bias. This study also pointed out that, in spite of good skill in producing sea surface temperature (SST), the GCMs are still unable to reproduce the observed teleconnection between SST and rainfall. It could be one of the reasons behind the inability of the GCM for accurate prediction of drought over India during monsoon 2009.
GCM outputs used in the study.
| Model | Resolution | AGCM | OGCM | Ensemble member | Reference |
| CFS | (T62) | GFS (2003 version) | MOM3 | 15 | Saha et al. (2006) |
| E4p5 (ca sst) | (T42) | ECHAM4p5 | Constructed Analog SST | 24 | Roeckner et al. (1996) |
| GML | (T42) | ECHAM4p5 | CFS-predicted SSTs prescribed over the tropical Pacific basin (semi-coupled) | 12 | Roeckner et al., 1996; Lee and De Witt, 2009 |
| JAM | (T106) | ECHAM4 | OPA 8.2 | 9 | Luo et al. (2005) |
| MOM3AC | (T42) | ECHAM4p5 | MOM3 (anomaly-coupled) | 24 | Roeckner et al., 1996; Pacanowski and Griffes, 1998 |
| MOM3DC | (T42) | ECHAM4p5 | MOM3 (direct-coupled) | 12 | Roeckner et al., 1996; Pacanowski and Griffes, 1998 |
| E4p5-CFS | (T42) | ECHAM4p5 | CFS-predicted SST | 24 | Roeckner et al., 1996 |
2.2 Observational reference
The high-resolution (1°×1° latitude-longitude) gridded rainfall data, based on 2140 rain gauge stations with minimum 90% data availability, prepared by the National Climate Centre of India Meteorological Department (IMD) have been used as observational reference for the present work. The station data have been interpolated to the specific grid points using objective analysis, where, in addition to a distance factor, a direction factor has also been introduced for defining the weights for interpolation. The detailed methodology for the preparation of such gridded data has been discussed by Rajeevan et al. (2006). Among these data there are 357 grid points (1°×1°) over the landmass of the country. The temporal resolution of this rainfall dataset is 1 day, i.e. this dataset is available for each day. For the present study, a dataset of seasonal mean (i.e., JJAS) has been created from the original daily data. This observed seasonal mean data is created for 1982–2008 constrained by the availability of the GCM products. As the resolution of these GCMs is very coarse compared to observations, all ensemble members of each individual GCM are bilinearly interpolated at observed data grid (1°×1° latitude-longitude).
3 Methodology
Probabilistic prediction is commonly formulated in terms of tercile-based categories such as below normal (BN), near-normal (NN) and above normal (AN). These equally likely, mutually exclusive and collectively exhaustive categories are constructed based on the observed rainfall climatology. The forecast probability of each category is estimated as portion of the cumulative probability of a forecast sample associated with this category based on tercile boundaries (Min et al., 2009). There are two ways of estimating the tercile-based categorical probabilities viz. parametric and non-parametric ways. In parametric approach, probabilities are estimated by the probability density function (pdf) of distribution in which observed rainfalls and those predicted by GCMs belong (Kulkarni et al., 2012). In common practice, the forecast distribution is assumed to be Gaussian for seasonal distribution. Nonparametric method estimates these tercile probabilities by counting method. In other words, tercile probabilities can be calculated by counting the ensemble members of a GCM falling in each category. The main advantage of such method is that it does not require any distribution (Tippett et al., 2007) for estimating the probabilities. It is already stated that there are only few studies (Acharya et al., 2012b; Kulkarni et al., 2012) which carried the parametric method (assuming Gaussian distribution) for probabilistic prediction of ISMR. However, the present study is the first attempt to predict ISMR by nonparametric approaches.
3.1 Calculation of tercile probabilities for individual GCMs
For nonparametric method, the tercile categories of observation can be determined by the percentiles of the observed climatology. Cases below the 33rd percentile are considered as below-normal category and cases falling above 67th percentile are regarded as above-normal category. However, cases in between 33rd and 67th percentiles are stated as near-normal category. As all the categories are equally likely, climatological probability of each of the tercile categories is coming 0.33. Tercile category of each individual GCM is calculated by aggregating all years and all ensemble members. If the GCMs are unbiased, the categories of observation and GCM coincided. Because of the model bias, these categories differ significantly in their contribution towards degrading the performance of forecast of GCMs (Rajagopalan et al., 2002). In practice, counting method is implemented for nonparametric estimate of the tercile probabilities of GCM. In this method, probability in each category can be calculated by the fraction of ensemble members in each category. In other words, the forecast probabilities of tercile category (P) for an individual GCM can be defined as below,
| (1) |
3.2 Probabilistic Multi-Model Ensemble (PMME) schemes for assigning weight to the tercile probabilities from individual GCM
Due to the presence of inherent biases, probabilistic prediction of each GCM cannot be consistent. Therefore, multi-model ensemble schemes can be considered for more skillful forecast. In this section, different multi-model ensemble (MME) schemes for combining all the individual GCMs’ probabilities are discussed. In general, the multi-model combination for probabilistic prediction can be done by pooling all the ensemble members from each GCM into a single sample with equal weight. However, this type of pooling method is only applicable if all the GCMs have the equal number of ensemble members. However, the ensemble size of the GCM does not remain same in hindcast or in forecast phase. Therefore, as a remedy, one can estimate the forecast probabilities of each GCM separately and subsequently combine those probabilities (Min et al., 2009). The main purpose of such MME technique is to assign weight to probabilities of individual GCMs in each of the tercile categories. The forecast probabilities from individual GCMs can be combined as follows:
| (2) |
3.2.1 PMME1
The simplest technique is to give equal weight to all the probabilities from individual GCMs. That means assigning weight function as wi = 1/N. In other sense, the probabilities computed from individual member models are being averaged. Kulkarni et al. (2012) used this method for combining the probabilities (by parametric method) from GCMs. This method is often used as benchmark to evaluate other techniques (Min et al., 2009; Stefanova and Krishnamurti, 2002). This method is referred to as PMME1 in the rest of the manuscript.
3.2.2 PMME2
In this technique, weight function of the MME is derived on the basis of ensemble members in each GCM. It is already stated that each of the GCMs has different ensemble members. Therefore, one can use ensemble members for estimating the weights (Min et al., 2009; Sohn et al., 2012). Min et al. (2009) described this method at length. After the estimation of the ratio between standard errors of GCMs and difference between GCM ensembles means, they concluded that the weight should be proportional to the square root of the individual GCM ensemble size. Therefore, weight function can be defined as where, Mi is the total number of ensemble members of ith GCM. In the remaining part of the manuscript this MME scheme is mentioned as PMME2.
3.2.3 PMME3
Another technique that we have adopted in the present work is the regression based weight function described by Stefanova and Krishnamurti (2002). In this method, the absolute value of regression coefficient between observed data and mean of all ensemble members of each GCM can be used as weight for combining the probabilities. The simple monotonic function can be considered as the weights proportional to some power of the regression coefficients. Hence, larger regression coefficients would be “better” than those with smaller regression coefficients and should therefore be assigned larger weights (Stefanova and Krishnamurti, 2002). The best choice for the power has been empirically estimated as 0.5 by Stefanova and Krishnamurti (2002). By this method, weight function can be determined as where, bi is the regression coefficient of the ith GCM. Now onwards, this method can be regarded as PMME3.
3.2.4 PMME4
Signal-to-noise ratio (SNR) of each GCM can also be used as weight function. Signal to noise ratio (SNR), which is commonly used for measuring the predictability of GCM can be defined as the ratio of external and internal components (Kang et al., 2004). In GCM, the ensemble mean of all the members is treated as the external component, whereas, the deviation of members from the ensemble mean is treated as the internal component. Practically SNR can be calculated as intra-ensemble:
SNR can be thought for giving weights to the probabilities obtained from the individual GCMs as it measures the individual GCM's predictability. GCM having higher SNR value represents more predictability. In this method, GCMs having higher SNR should be assigned more weights as compared to GCMs having less SNR (assuming weight function as a monotonic function). By this method, weight function can be determined as where, SNRi is the signal-to-noise ratio of the ith GCM. The reason behind taking the power as 0.5 is same as mentioned in PMME3. This technique will be termed as PMME4 in the rest of the study.
3.2.5 PMME5
Another technique for MME is to give weights to the GCMs on the basis of their biases. In other words, GCMs having less bias will be given more weighting than those having more bias. This method uses the inverses of the root mean square errors of the GCM forecasts in the training period as weighting factors (Casanova and Ahrens, 2009; Devineni and Sankarasubramanian, 2010). Weight function can be set as where, ri is the inverse of the root-mean square error of the ith GCM. Here also we take the power as 0.5 similar to other PMME methods. This technique will be termed as PMME5 in the rest of the study.
Since the present study deals with only 27 years data (1982–2008) of GCMs and observation, a leave one out method has been carried out for cross validation, while calculating the probabilities using all the above-mentioned probabilistic multi-model ensemble techniques, as recommended by the World Meteorological Organization (WMO) standardized verification system (WMO–SVS, 2002).
4 Result and discussion
4.1 Rank probability skill score (RPSS)
The hindcasts of seven GCMs have been used for the present study for the period 1982 to 2008. Tercile-probabilities of each individual GCM have been calculated using Eq. (1). For the skill assessment of each GCM's probabilistic prediction, rank probability skill score (RPSS) is used. The RPSS measures cumulative squared error between categorical (i.e., tercile category) forecast probabilities and the reference categorical probabilities (Weigel et al., 2007). In common practice, climatological probability (i.e. one-third for each of the tercile category) is used for generating reference forecast. For perfect prediction, the value of RPSS is equal to 1, whereas RPSS having 0 refers no improvement over climatological forecast and negative values of RPSS suggest that the forecast strategies are worse than the climatological strategy. There is no analytical formula or look up table for the statistical significance levels of the RPSS. However, some of the studies (Goddard and Dilley, 2005; Hamill, 1999; Kulkarni et al., 2012) have discussed sampling techniques for the statistical significance of RPSS. Kulkarni et al. (2012) have used Monte Carlo re-sampling for the statistical significance of RPSS in a seasonal prediction and they concluded that any prediction having positive RPSS is significantly skillful. The RPSS of the individual GCM is shown in Fig. 1, in which the regions having positive RPSS are shaded. It is seen that the GCMs have different skills in different regions of the country as none of them has uniform skill for all the regions. For instance, the CFS model rainfall has the best RPSS over northern and northwestern parts of India. MOM3-AC, MOM3-DC and JAM models have shown higher positive RPSS in some areas of central and southern parts of the country. However, the GML model has significant skill in some parts of eastern zone and E4p5 model is having a few skillful grid points in northern parts. Therefore, almost all the models do not have any consistent skill in terms of RPSS, except a few grid points randomly scattered over the country.
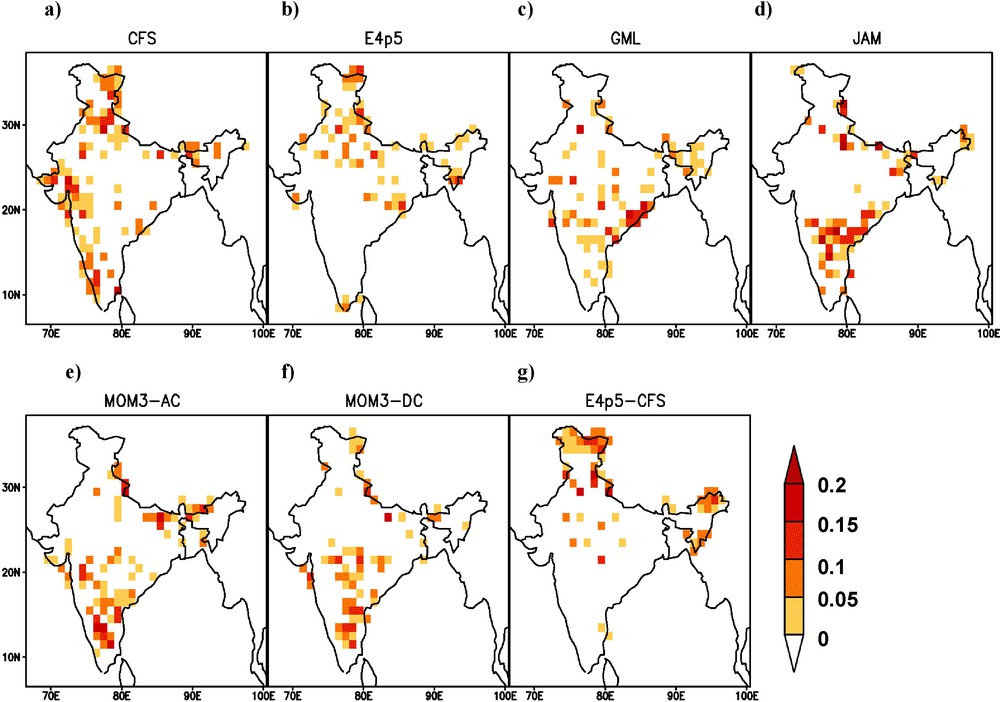
Rank probability skill score (RPSS) of individual GCM viz. a) CFS, b) E4p5, c) GML, d) JAM, e) MOM3-AC, f) MOM3-DC and g) E4p5-CFS during hindcast period (1982–2008) for seasonal mean rainfall of June–July–August–September (JJAS) with May start (lead-1). Areas with RPSS values > 0 have been shaded.
Recent studies show that the individual GCMs have poor performance of prediction of ISMR (Acharya et al., 2011, 2012c; Preethi et al., 2010; Singh et al., 2012). In this section, skills of five Probabilistic Multi-Model Ensemble (PMME) techniques, described in Section 3.2, have been examined. Fig. 2 shows the RPSS of each of the five techniques considered in this study. The RPSS of PMME1 (Fig. 2(a)) is showing more skill in some parts of central, northern and southern India. The PMME1 scheme is based on simple averaging of all probabilities from individual GCMs, i.e., giving equal weight to each. As a result, a good model gets the same weight as a model with low skill in this method. It may be noted that three out of seven models show more positive RPSS in some parts of central and southern regions of the country. This behavior is reflected in the skill of PMME1. The skill of PMME2 method, which is based on the ensemble member size in terms of RPSS, is shown in Fig. 2(b). The region having positive RPSS in PMME2 is same as that for PMME1. However, the skill is getting degraded, i.e. the RPSS is positive, but the magnitude is less than PMME1. RPSS of PMME3 (based on regression coefficient) and PMME4 (based on SNR) (Fig. 2(c) and (d)) shows almost the same skill as PMME1. However, the RPSS of PMME3 is enhancing in southern part of the country as compared to PMME1, while the skill of PMME4 is degrading in the same zone. The skill of PMME5, which is based on RMSE, is the lowest among all the methods. The number of grid points having positive RPSS is much lesser than other techniques. Therefore, it has been noticed from the RPSS that among all PMME techniques, PMME1 and PMME3 performed better.
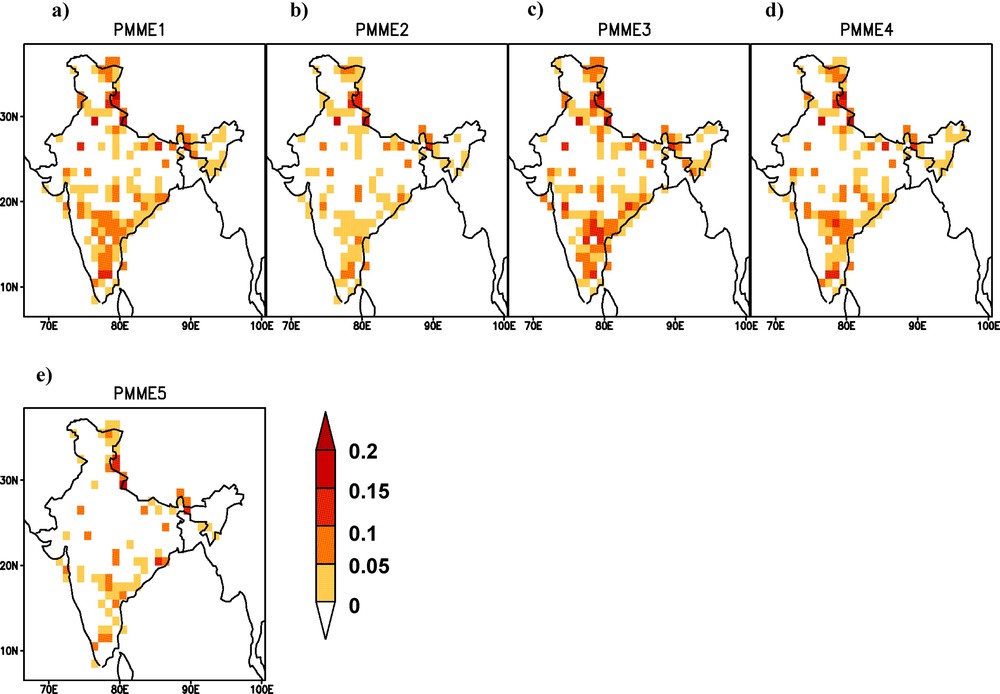
Rank probability skill score (RPSS) of five different probabilistic multi-model ensemble schemes (a to e) during hindcast period (1982–2008) for seasonal mean rainfall of June–July–August–September (JJAS) with May start (lead-1). Areas with RPSS values > 0 have been shaded.
Further, to quantify the above conclusion, the number of grids having positive RPSS was calculated for each method. Specifically, we calculated the number of grids greater than 0 to 0.2 for all the methods and the results are presented in Fig. 3. It is already discussed that all the probabilistic prediction schemes are calculated in each of 357 grids, which is the total number of grid points on the land mass of India. Fig. 3 depicts that the number of grid points having RPSS > 0 is little higher in PMME1 (141 points) than the PMME3 (138 points). Furthermore, PMME5 method has the lowest number of grids having positive RPSS (70 points). In the remaining positive category, (i.e. RPSS > 0.05, RPSS > 0.1, RPSS > 0.15 and RPSS > 0.2) it is found that PMME1 and PMME3 has more grid points than other methods. However, the number of grid points having positive RPSS is higher in PMME3 than in PMME1. Therefore, it can be concluded that the RPSS of PMME1 and PMME3 is better than other methods. To quantify the improvement of PMME3 over PMME1, the difference in RPSS of both the schemes (PMME3 minus PMME1) is also calculated and plotted in Fig. 4. It is seen that, more or less, skill is improved for most parts of the country in PMME3 method compared to PMME1.
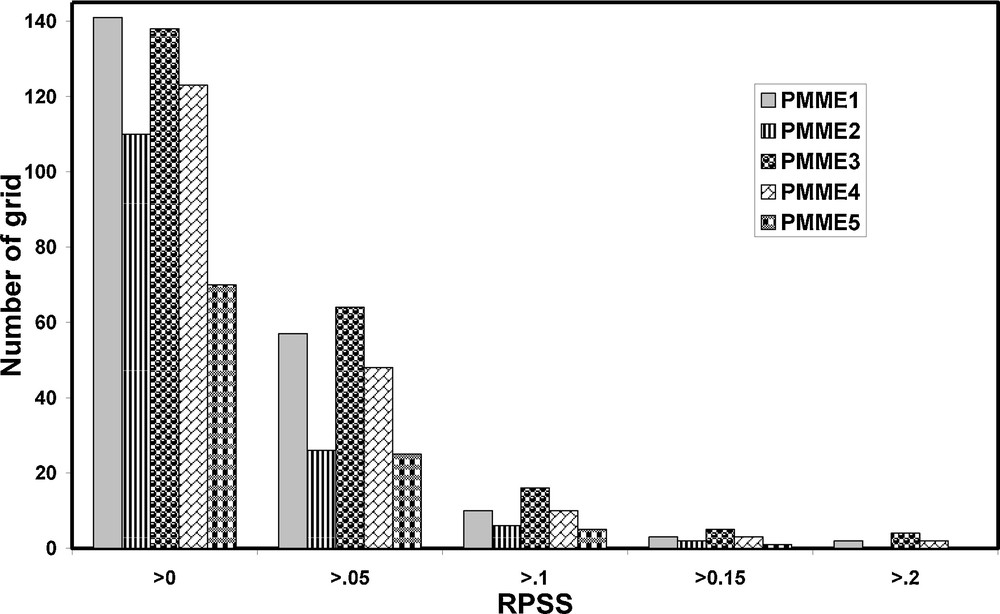
Number of grid points having rank probability skill score (RPSS) > 0 to 0.2 of five different probabilistic multi-model ensemble schemes during hindcast period (1982–2008) for seasonal mean rainfall of June–July–August–September (JJAS) with May start (lead-1).

Difference of RPSS between PMME3 and PMME1 (PMME3 minus PMME1) during hindcast period (1982–2008) for seasonal mean rainfall of June–July–August–September (JJAS) with May start (lead-1).
4.2 Relative operating characteristic (ROC) curve
The skill of all PMME techniques is also examined in terms of relative operating characteristic (ROC) curve (Mason, 1982). For a probabilistic system, the ROC curve describes the varying quality of the prediction system at different levels of confidence in the warning, i.e. the forecast probability which is helping to identify the optimum strategy in any specific application (Mason and Graham, 1999). In other words, ROC curves measure the ability of the forecasts to detect the occurrence and non-occurrence of a seasonal climate event, thus measure resolution (Min et al., 2009). The ROC is a measure of the quality of probability prediction, which compares the hit rate to the corresponding false-alarm rate (Kharin and Zwiers, 2003b; Mason and Graham, 1999). Both ratios (hit rate and false-alarm rate) can be calculated simply from the contingency table. Using standard definitions of hit (h), false alarm rate (f), miss (m) and correct rejection (cr) from a 2 × 2 contingency table (Table 2) for verification of a binary forecast system, both the ratios can be calculated as (Mason and Graham, 1999):
- • hit rate (HR) = h/(h + m);
- • false-alarm rate (FAR) = f/(f + cr).
The 2 × 2 contingency table for verification of a binary forecasting system.
| Forecast | |||
| Observation | Warning | No Warning | |
| Event | HIT (h) | MISS (m) | |
| Non-event | False Alarm (f) | CORRECT REJECTION (cr) |
For perfect forecast system, HR = 1 and FAR = 0. Hence, ROC curve can be estimated by changing the different thresholds (for example, 10%, 20%,……, 100%) and plotting the leading HR against FAR (Kharin and Zwiers, 2003b). In this system, there is skill only when the hit rate exceeds the false-alarm rate. Therefore, for a skilful forecast ROC will lie above the 45° line (measured counterclockwise from the origin) and the total area under the curve will be greater than 50%. For a perfect forecast system, ROC curve connects the points (0,0), (0,1) and (1,1) and for a no-skill forecast, ROC curve will coincide with the 45° line (Kharin and Zwiers, 2003b).
Aggregated ROC (pooled over 357 grid points) curves and Area Under Curve (AUC) for all the PMME techniques are shown in Fig. 5. The ROC curve and AUC are calculated for the 11 thresholds or critical points between 0% to 100%. It is found that for all the methods, the ROC curve for near-normal (NN) category is almost over “no-skill” line (45° lines from the origin) and its AUC is nearly 50% in every case (Fig. 5). Therefore, none of the techniques is able to discriminate strongly between events of occurrences and non-occurrences for the NN category. For all the critical probabilities or thresholds, the chances of hit and false-alarm are the same, i.e. it cannot distinguish between events of occurrences and non-occurrences precisely. It may be due to the fact that NN category is bounded by both the sides while AN and BN categories are unbounded at one side (Kharin and Zwiers, 2003b).
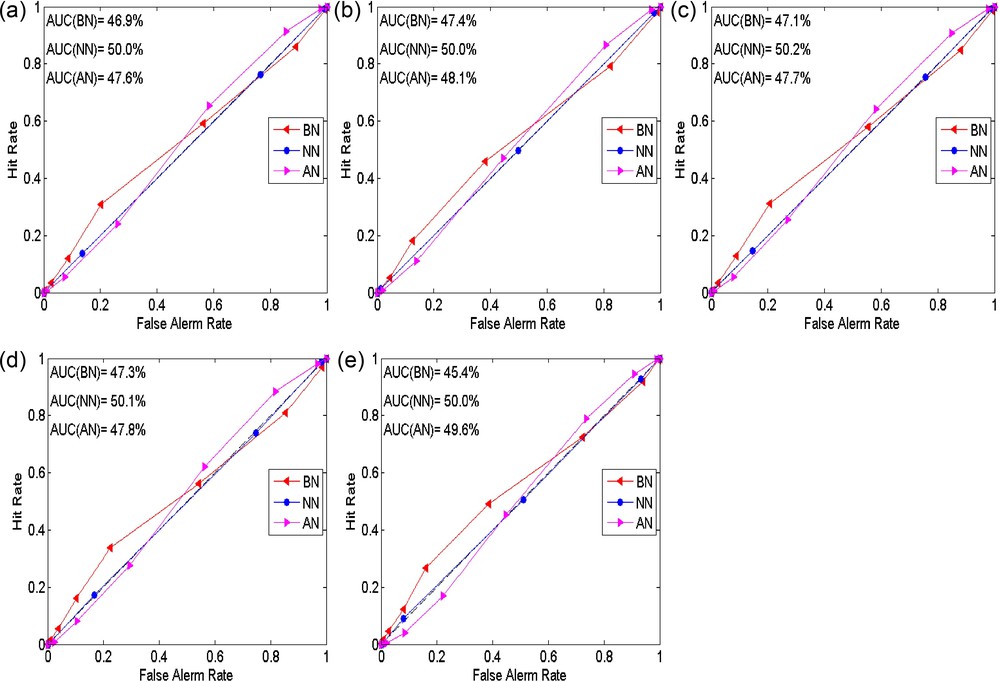
The aggregated ROC curves and area under curve (AUC) five different probabilistic multi-model ensemble schemes (a to e) during hindcast period (1982–2008) for seasonal mean rainfall of June–July–August–September (JJAS).
For the BN and AN categories, the ROC curves behave differently and almost opposite to each other for almost all the PMME techniques. It is noticed that, for the higher thresholds, the ROC curve is lying above the diagonal line (no skill) for the BN category. Conversely, ROC line is lying almost on the diagonal line for AN category. However, for lower critical thresholds values, the ROC curve of AN is lying above the diagonal line, whereas the ROC curve is almost on diagonal line for BN category. For this typical nature of ROC pertaining to the categories of AN and BN, the aggregate AUC is lesser than 50%. Therefore, in view of the above ROC curve analysis, it can be interpreted that the ROC is not getting influenced significantly by the type of weights assigned to the probabilities. It implies that the probability prediction by all the GCMs and PMME methods cannot discriminate between events of occurrences and non-occurrences.
5 Summary and concluding remarks
In the present study, it has been discussed why the prediction of Indian summer monsoon rainfall (ISMR) should be made in probabilistic manner and it has been established through a survey of literatures that the probabilistic approach should be adopted to deal with the intrinsic intricacy of the physical processes associated with the monsoon. In recent years, the probabilistic forecast based on GCMs has drawn considerable attention. The probabilistic forecast can be generated in parametric (assuming Gaussian distribution) as well as non-parametric (counting method) ways. The present study deals with the non-parametric approach that requires no assumption about the form of the forecast distribution. The main aim of the study is to document the present skill level of probabilistic prediction by non-parametric method and to make probabilistic multi-model ensemble to provide a useful benchmark for further improvement. The rainfall products of seven general circulation models (GCM) and high resolution observed data are used for the present study for the period of 1982–2008.
At the outset, probabilistic prediction from each of the GCMs has been generated by non-parametric methods for tercile categories (viz. below normal (BN), near-normal (NN) and above normal (AN)). The skill of those predictions is measured in terms of Rank Probability Skill Score (RPSS). Further five different types of multi-model ensemble schemes for combining probabilities from each GCM are also applied. These methods are different in assigning weights to the probabilities from each GCM. The simplest method is to give equal weight to all the probabilities from individual GCMs (PMME1). In another method, ensemble members have been used for estimation of the weights (PMME2). Whereas in third technique, the regression coefficient between individual ensemble mean of GCMs and observation is regarded as weight for the combination of probabilities (PMME3). In the remaining two methods, signal-to-noise ratio (SNR) of each individual GCM (PMME4) and inverses of the root mean square error coefficients between individual ensemble mean of GCMs and observation (PMME5) are used for determining the weights. The performance of such PMME schemes is assessed rigorously in terms of RPSS and ROC. In summary, the major outcomes of the study are presented below:
- • it has been found that, due to the presence of inherent biases, probabilistic prediction of individual GCM cannot be reliable and consistent in terms of RPSS;
- • the RPSS of these five methods are also examined. It is found that, RPSS of PMME1 and PMME3 is better than all other methods. The numbers of grids having positive RPSS have been calculated for each method for more quantification. It is noticed that PMME1 and PMME3 have more positive grid points as compared to other schemes while the later one has more positive grid points than others in all the categories. The improvement of skill in PMME3 over PMME1 is also found from the difference of RPSS among them;
- • furthermore, the performance of all probabilistic multi-model ensemble (PMME) techniques is also examined by relative operating characteristic (ROC) curve. It is found that, the probabilities in NN category for all the methods cannot distinguish between events of occurrences and non-occurrences strongly. The behavior of ROC has been found almost opposite to each other for BN and AN categories in more or less all the PMME techniques. In particular, the ROC curve of BN is lying above the diagonal line (“no-skill”). However, in the case of AN category, the ROC curve is almost coinciding with the diagonal line for higher critical/threshold values, and for lower critical/threshold values it is just vice versa. It can be concluded that the ROC is not getting influenced significantly by the type of assigning weights to the probabilities by all PMME techniques.
Therefore, in view of the above discussion, it can be concluded that the skill of the PMME techniques, especially PMME1 and PMME3, are better than the climatological probability as well as individual GCMs, but they may not be able to make strong discrimination between the events of occurrences and non-occurrences. However, the present study is insufficient by the length of the study period (1982–2008). In future, the present study may be extended by increasing the study period and considering some sophisticated PMME techniques as well as using a Bayesian approach for further enhancement of skill of probabilistic predictions for Indian summer monsoon rainfall.
Acknowledgments
The study was conducted as part of a research project entitled “Development and Application of Extended Range Weather Forecasting System for Climate Risk Management in Agriculture”, sponsored by the Department of Agriculture and Cooperation, Government of India. Gridded rain data have been obtained from India Meteorological Department. We gratefully acknowledge the IRI modeling and prediction group led by D. Dewitt for making six of their GCM-based seasonal forecasting systems available to this study, as well as the IRI Data Library group led by B. Blumenthal. Authors are gratefully acknowledging the National Centre for Environmental Prediction (NCEP) for providing the CFS hindcast data set and contributions of D. Lee, H. Liu, and M. Bell. Japan Agency for Marine–Earth Science and Technology (JAMSTEC); in particular, Jing-Jia Luo and Toshio Yamagata are duly acknowledged for providing their model's products used in this study. Authors would like to express heartfelt gratitude to Dr Surajit Chattopadhyay and Dr Kripan Ghosh who guided them in the various stages of this study. Sincere thanks to the entire reviewer for their expert comments, which enhanced the quality of the manuscript.