

1 Introduction
Due to their depositional conditions, deltaic aquifers are characterized by many complexities (Bardach, 1989; Ezzy et al., 2006; Holman, 2006; Sherif et al., 2012; Vouillamoz et al., 2007) such as:
- • spatial and granular heterogeneity – granulometric contrasts of deltaic systems can be very strong. Deltaic systems also have a high lateral and vertical variability (3D variability);
- • salinization of groundwater – the salinity can be trapped by fine-grained sediments (principally clay) and stays inside;
- • vulnerability to anthropogenic activities because of shallow water table and population density;
- • other atmospheric events, for example, warmer climate or evapotranspiration – accordingly, research and modeling of deltaic aquifers is complicated in many cases.
In order to develop a mathematical or a conceptual model of groundwater flow of a hydrogeological system, identification of structures is essential to establish geological and hydrodynamic limits. Geological and geophysical methods have been used over the last decade to estimate the geometric characteristics and internal features of aquifers (Guerin, 2005). Nevertheless, in deltaic systems, the recognition of paleostructures and groundwater flow becomes a difficult work because of spatial variability and salinity content.
Classic geological techniques, such as core sediment analysis, allow detailed description of the texture and origin of sediments. This type of technique is considered the most direct method for obtaining subsurface data (Goldman and Neubauer, 1994); however, sometimes, geological data is spatially limited. In contrast, geophysical measurements can provide a less expensive and effective way to fill the lack of knowledge between boreholes or Auger drillings (Boucher et al., 2009; Chalikakis et al., 2009; Maillet et al., 2005; Martínez et al., 2009; Vouillamoz et al., 2007). The integration between geological and geophysical surveys allows one to obtain more precise images of subsurface (Falgàs et al., 2011; Lyons et al., 2011).
Several works have used a combination of geophysical techniques to characterize the structure of different types of deposits (Falgàs et al., 2011; Pham et al., 2002; Sandberg et al., 2002; Skinner and Heinson, 2004). In particular, the combination of electromagnetic (EM) mapping, electrical survey (Electrical Resistivity Tomography [ERT], and electrical sounding [ES]) was used to this purpose (Al-Fares, 2011; Sirhan and Hamidi, 2012). However, only ERT is the most commonly used geophysical technique to characterize deltaic sequences or mainly salinity variations (Maillet et al., 2005; Martínez et al., 2009; Zarroca et al., 2011).
The Middle plain of the Rhone delta, in southeastern France (Fig. 1A), is a mixed environment with fluvial deposits forming elongate sand bodies with meanders pattern isolating freshwater to brackish water ponds (Boyer et al., 2005). The geological configuration of the Rhone delta is similar to that of other deltaic systems (Boyer et al., 2005; Falgàs et al., 2011; Iribar et al., 1997) such as: the Ebro delta, the Tordera delta, the Llobregat delta, the Tiber delta, the Nile delta and the Po delta. A large number of geological and hydrogeological studies have been carried out to understand the dynamic behavior of deltaic aquifers of the Rhone delta (Camargue, 1970; Godin, 1990; Heurteaux, 1969; L’Homer, 1975; Marinos, 1969; Pons et al., 1979). These studies provided the first general information (large-scale and low-resolution geological models) and noted the importance of the superficial aquifer of the Rhone delta. For a comprehensive hydrogeological/hydrodynamic study, a detailed and accurate structural model is needed.
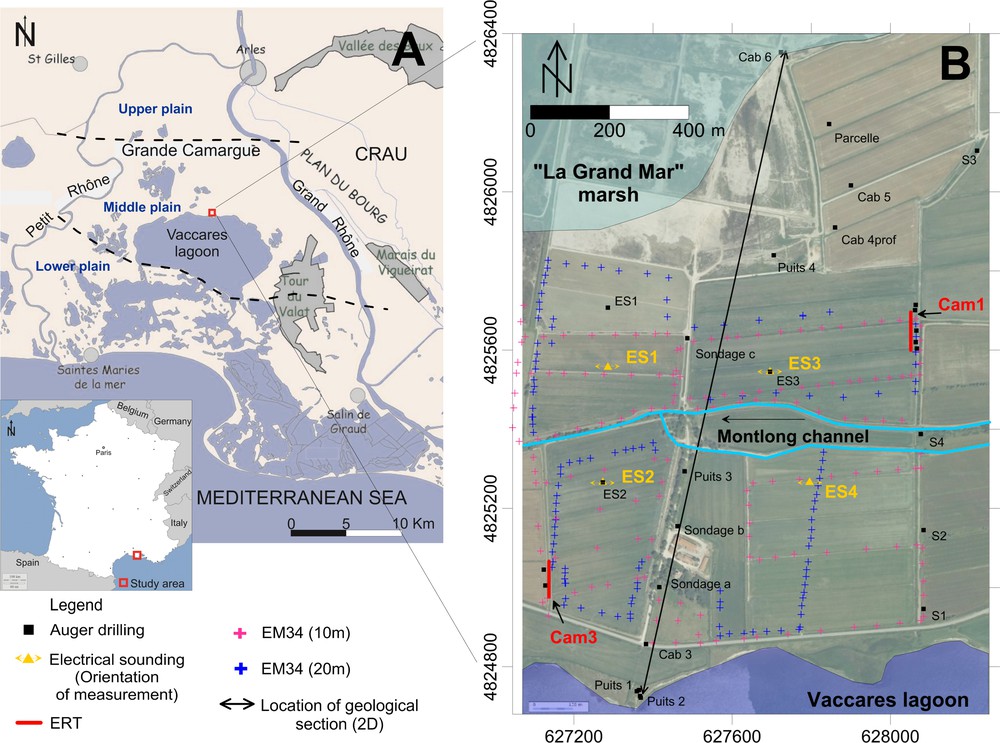
A. Location of the study area. B. Cabassole Mas. Positions of: Auger drillings, electrical soundings, EM34 measurement points, 2D geological section and boundary conditions. Color available online.
The study area is located in the northern part of the Vaccarès lagoon in the Cabassole Mas (Fig. 1). This area was chosen for three reasons:
- • it is located in the central part of the Rhone delta;
- • it represents the typical geomorphology of superficial structures of the Middle Camargue plain;
- • it intercepts functional units from the north to the south (Griolet, 1972): contact with the “Grand Mar” marsh and the Vaccarès lagoon, presence of lagoonal deposits (low elevation zones) and fluvial deposits (high-elevation zones). The Montlong channel flows across the study area. This channel is an ancient tributary of the Rhone River that construed the Saint-Ferréol paleochannel (Arnaud-Fassetta, 1998).
The aim of the study is to obtain an effective, easy-to-use and low-cost methodological approach to characterize a superficial deltaic aquifer through the contribution of Auger drillings and three geophysical methods (EM mapping, ERT and ES). The final purpose of this work is to build a structural model of this type of aquifer.
2 Geological and hydrogeological settings
The Rhone delta is located in the Gulf of Lion, southeast of France. It has an area of 1740 km2, approximately (Fig. 1A). The Grande Camargue (≈750 km2) has been formed by ancient channels of the Rhone River and by offshore bars, which constitute elongated topographic highs.
The delta plain was mainly formed during the Quaternary period, by a progradation of sedimentary bodies influenced by fluvial sedimentary flows (Boyer et al., 2005; Vella et al., 2005). Bouteyre and Toni (1972) recognize two morphological units in the Grande Camargue, according to geology:
- • the fluvio-lagoonal Camargue unit (from Arles to the offshore bar in south of the Vaccarès lagoon), composed by a fluvial covering, with riverbanks deposited over lagoonal salt formations;
- • the lagoonal-marine Camargue unit (south of the offshore bar), consisting of marine and lagoonal deposits covered by a limited fluvial layer.
The Middle Plain is a mixed environment with fluvial deposits forming elongate sand bodies (ancient riverbanks of the Rhone River) with meanders pattern isolating freshwater to brackish water ponds. The permeability of the layers is generally low (Marinos, 1969) and its distribution depends on geomorphology. Riverbanks of the Rhone channel present a good permeability, while marsh areas are quasi-impermeable ponds where water is retained as water of imbibition. Therefore, the water table is limited by the extension of silty-sandy deposits of ancient distributaries of the Rhone. The hydraulic head of the superficial aquifer is close to the ground surface.
Vertically, the Camargue is composed of two aquifers: a gravel deep aquifer and an unconsolidated superficial aquifer (comprised principally of sand and clay). These aquifers are separated by a layer of silt with peat levels, which represents an impermeable level (aquitard) between both of them. The impermeable level corresponds to the substratum of the local superficial aquifer.
3 Material and methods
3.1 Auger drillings
Twenty-nine Auger drillings were carried out between 2009 and 2012 (Fig. 1B) to provide detailed lithological description and groundwater information. A Hand Auger of 8 m of length and 10 cm of diameter was used. Auger drillings have a depth between 3 m and 8 m. This variability of the investigation depth was mainly due to the water-buried coarse-grained sand deposits which made vertical extension of Auger drillings impossible. Groundwater properties such as electrical conductivity (EC) and temperature were measured when it was possible.
3.2 Electromagnetic (EM) mapping
The EM measurements (Slingram technique) have been used to image the apparent electrical conductivity (σa) distribution in the subsurface. The basis of the Slingram technique is described in several publications (McNeill, 1980; Monteiro Santos, 2004; Parasnis, 1986; Triantafilis et al., 2003; Ward and Hohmann, 1988). Despite of the qualitative nature of the provided information, this technique is widely used for hydrogeological and environmental investigations (Evans et al., 2000; Nobes, 1996; Sirhan and Hamidi, 2012). Two EM campaigns have been carried out in the central part of the study area (Fig. 1B). The first campaign was made with a transmitter-receiver separation of 10 m in both vertical dipole (VD) and horizontal dipole (HD) configuration. The spacing between measurements was calculated in order to cover the total area. The second campaign was made with a coil separation of 20 m. The EM 34-3 equipment by ABEM was used.
3.3 Electrical resistivity methods
Electrical resistivity is one of the main properties adapted to hydrogeophysical studies (Guerin, 2005). The resistivity of rocks is affected by different factors (Matsui et al., 2000): porosity, pore fluid resistivity, water saturation, water content by volume and clay content.
3.3.1 Electrical sounding (ES)
ES is generally used to determine vertical variations of the electrical resistivity in hydrogeological investigations (Al-Fares, 2011; Vouillamoz et al., 2007). Four soundings were implemented in the central area of the site (Fig. 1B), close to the Montlong channel (named: ES1, ES2, ES3 and ES4), and according to the EM survey results. The Schlumberger array was used with a maximum spacing of 300 m between electrodes. The equipment “Geo-Instruments” developed by the CNRS (Garchy, France) was used. Inversion of the apparent resistivity (ρa) values into geo-electrical models was made with IPI2Win 3.0.1e version software.
3.3.2 Electrical resistivity tomography (ERT)
ERT is the most common method applied in Earth Sciences, especially in hydrogeology, due to its robustness and reliability (Al-Fares, 2011; Chalikakis, 2006; Pham et al., 2002). Two ERT sections were carried out in the study area (Fig. 1B), the first (Cam1) is located towards the northeastern zone and the other one (Cam3) is located towards the southwestern zone. Each section was 126 m long, with 64 electrodes and spaced out 2 m apart. Two arrays were implemented: Wenner–Schlumberger (WS) and Dipole–Dipole (DD); the WS array provides a good compromise between horizontal and vertical resolution, whereas the DD array has a greater investigation depth (Seaton and Burbey, 2002). For ERT acquisition, the ABEM Terrameter SAS 4000 was used (Dahlin, 2001). The apparent resistivity was interpreted with Res2Dinv software, 3.59.1154.44 version, using Robust Constraint. The iteration process was limited at three iterations because that was enough to provide a satisfactory Root Mean Square (RMS) error. Only the WS array is presented in this paper to simplify discussions.
4 Results and discussions
4.1 Local lithology
The subsurface in the study area is constituted only of sediments. In general, their minimum thickness is around 1 m and they have a large lateral extension (200–300 m). Fossils in the study area suggest a lagoonal, pond or alluvial origin. Five types of sediments have been identified. Lithological description was made using the facies described by G.E.P.P.A. triangle (Baize and Jabiol, 1995). The sedimentary environment has been determined in some cases using fossils and by comparison with the geological section of superficial formations (“ligne 18”, Mas de Cabassole) of the Camargue report (Camargue, 1970). The sedimentary sequence, in the textural order, consists of:
- • Al–La: silty clay, grey–yellow, to clayed silt, pale gray. Stain of iron oxide and vegetable remains are present. Peat layers and soil horizons can be observed into this facies, giving a black color to the sediment. This facies has, generally, 1–3 m of thickness. The presence of preserved fossils of gastropod type, like Planorbis and Radix limosa Linné, suggest a euryhaline and eurythermal lagoon as the environmental origin. Brackish environment with freshwater contributions. This facies has been recognized in almost all observation points.
- • La: clayed silt, dark grey. Observed in the base of Cab3 log (−6 m.a.s.l). A thin layer of marine shell remains (not differentiable) rests in the top of this facies.
- • Ls: sandy silt, brown in the first centimeters, and then it becomes grey. Its thickness varies between 0.5 m and 1.5 m. Fossil species are associated with continental–terrestrial and freshwater origins. It is sandier toward the central part of the study area. The sandy silt facies is interpreted as an overflow phase of the current Montlong channel.
- • Sl–S: silty sand (Sl) and fine-grained sand (S), pale grey. Identified in the lateral parts of the study area. Presence of micas (muscovite). Its thickness could not be recognized in most of cases. Sand is generally well-sorted. Three types of this facies were recognized. In the south of the experimental site, a fine S facies is identified under Al–La facies. It presents remains of lagoonal fauna. To the north, a layer of Sl facies is recognized. This facies contains non-differentiable fossils and clay balls of 1 to 2 mm of diameter. Clay balls represent an abrupt aggradation episode according to the description of the Camargue report (1970). Both units proceed from a lagoonal environment.
Also, in the north of the area, lens of well-sorted azoic fine-grained sand is present in Cab5 and Parcelle (Fig. 2). This facies could be associated with an aeolian environment.
- • SS: Coarse- and medium-grained sand, grey, well-sorted, micas (muscovite), sedimentary rocks remains and non-differentiable fossil remains are abundant. Flat remains of wood, of 3–7 cm, have been observed within the sediments. This facies was interpreted as the filling of a fluvial channel. It cuts the facies above. It has been identified in the central part of the study area (close to Montlong channel) as well as in the base of Cab6 and Cab7 logs, accompanied with pebbles. These deposits have an abrupt contact with the rest of sediments.
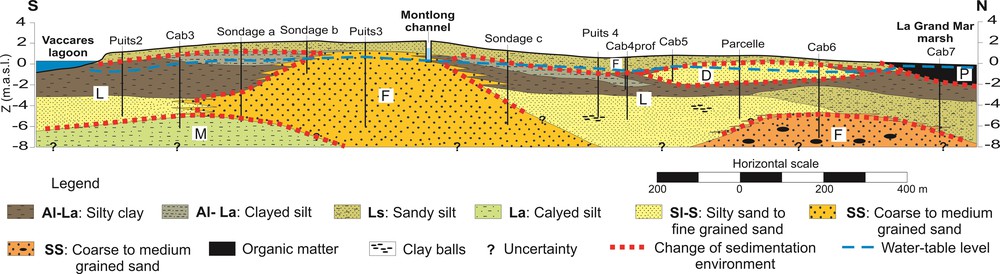
A north–south geological section with position of the Auger drillings and of their related investigation depths. According to the lithological description, sedimentary environments are recognized: F, fluvial, L, deposits of saltwater marsh, D, aeolian, P, paludal and M, marine (Fig. 1B for location).
A north–south reconstruction of the geometry of the deposits in the middle of the study area was attempted through the lithological description presented above (Fig. 2). The stratigraphic correlation is based upon textural characteristics and horizontality of layers. Bouteyre and Toni (1972) present the Middle Camargue as composed by a fluvial overlay with large riverbanks covering previous salty lagoonal formations. According to the textural characteristics and the fossils recognized, five types of sedimentary environment can be identified: marine (M), deposits of saltwater marsh (L), aeolian (D), fluvial (F), and paludal (P). This sedimentary sequence is progradational; it corresponds to the description of Boyer et al. (2005). In the same environmental sequence, the vertical contact between facies is not clear; it is probably due to energy changes. This happens principally with deposits of lagoonal origin. However, the contact between stratums of different depositional environments is neat. Fluvial deposits identified in the central part of the study area (close to Montlong channel) correspond to the Saint-Ferréol paleochannel. According to the description of the Auger drillings, the width of the paleochannel varies between 300 and 500 m, approximately.
4.1.1 Local hydrogeology
Two groundwater tables were recognized within the same superficial aquifer during the implementation of Auger drillings: a fine perched groundwater table in the first meters below the surface (limit between Ls and Al–La facies). The second appears in the sandy facies (Sl–S and SS). The aquifer presents two hydrogeological behaviors: unconfined behavior in the higher topographic areas (close to Montlong channel) and confined behavior in the lower parts, where the Al–Sa facies is present. In general, the aquifer follows the local topography; therefore, the water table is quasi-horizontal and its hydraulic gradient is low.
The mean EC of the aquifer for three observation points located within the experimental site (Fig. 1B) is exposed in Table 1. EC measurements were carried out every month between January and November 2011. These variations depend on both geomorphology and season. For instance, Puits3 point is located at the highest topographic point of the site. It is important to remind that the site's topography amplitude is around 2 m. Moreover, seasonally, groundwater ECs take their highest values at the beginning of the irrigation period (March–April). The lowest values are measured after the end of the irrigation period (September). In the period before and just after irrigation (from October to February), EC values are stable.
Groundwater EC variation (mean values over eleven months) in three observation points.
| Observation points | EC mean (mS/cm) |
| Cab3 | 1.51 ± 0.07 |
| Puits3 | 0.86 ± 0.06 |
| Cab4prof | 7.16 ± 5 |
In general, the EC seasonal variation is low in the elevated parts (Puits3 and Cab3), but is very high in the lowest areas (Cab4prof). Irrigation decreases EC values of the near-surface aquifer. A low groundwater flow conducts groundwater from the highest areas to the lowest ones. In the lowest parts, outflow is caused by evapotranspiration. So, the highest values of EC recorded during March and April are probably due to evapotranspiration and salt accumulated into the sediments. Based on this result, all geophysical measurements have been made in the period before and just after irrigation (from October to February).
4.2 Geophysical results
The local lithology section allowed us to observe an important lithological variability in the north–south direction. However, there was any information about the depth of the aquifer and the spatial distribution of layers in east-west direction. The sediments described previously are electrically conductive considering the expected theoretical values (Marescot, 2006). For that reason, when the term resistive or conductive is used in this paper, it is connected to the relative resistivity within the values acquired on this site.
4.2.1 Electromagnetic mapping
In the first geophysical campaign, EM34 mapping was carried out in the central part of the study area in order to overview the spatial variability of the near-surface features (Fig. 1B). A separation coil of 10 m was used for this campaign (VD-10 m). The EM34 mapping provided integrative information about σa. σa values have been analyzed using geostatistical methods to calculate both east–west and north–south directional variograms and correlograms (Fig. 3).

A. Directional variograms. B. Correlograms (values from EM mapping, VD-10 m) for both east–west and north–south directions.
Correlograms behavior is different in these two directions (Fig. 3A). The east–west correlogram presents a linear behavior and the correlation coefficient reaches the lag distance (a1) around 680 m; this indicates a strong correlation for two points separated by several hundred meters (600 m approx) along the east–west direction. A spatial continuity in the east–west direction is highlighted. In the east–west direction (Fig. 3B) the variance is not really attained.
Contrary to the east–west direction, the north–south correlogram (Fig. 3A) gets the “zero” value before a short distance (a2 = 160 m approximately). In accordance with the north–south correlogram, the north–south directional variogram (Fig. 3B) shows also a weaker lag distance and an anticorrelation for the great distances. It highlights a higher spatial variability of the subsurface structures in the north–south direction. The difference in the correlograms and variograms’ behavior between both directions and a value of coefficient q (q = a1/a2) greater than 4 attests to the anisotropy in the study area.
The geostatistical results served as a base to the second EM campaign, which was carried out with a larger investigation depth (20 m). Due to the observed spatial anisotropy of the subsurface features of the study area, it was considered to densify the measurements in the north–south direction, while the measurements in the east–west direction were more distant (Fig. 1B).
Both EM maps (VD-10 m and VD-20 m) show a spatial heterogeneity in the north–south direction (Fig. 4), while, in the east–west direction, an oriented structure was highlighted. Subsurface becomes more electrically conductive in the VD-20 m map. The resistive central structure of each map can be joined and a structure in form of ditch or drain is obtained (Fig. 4). This structure is similar to the form of a river bed and it has a width between 200 and 400 m approximately. This kind of structure in the central part of the study area agrees with the existence of the Saint-Ferréol paleochannel described in several publications (e.g., Arnaud-Fassetta, 1998; Camargue, 1970; L’Homer et al., 1981).
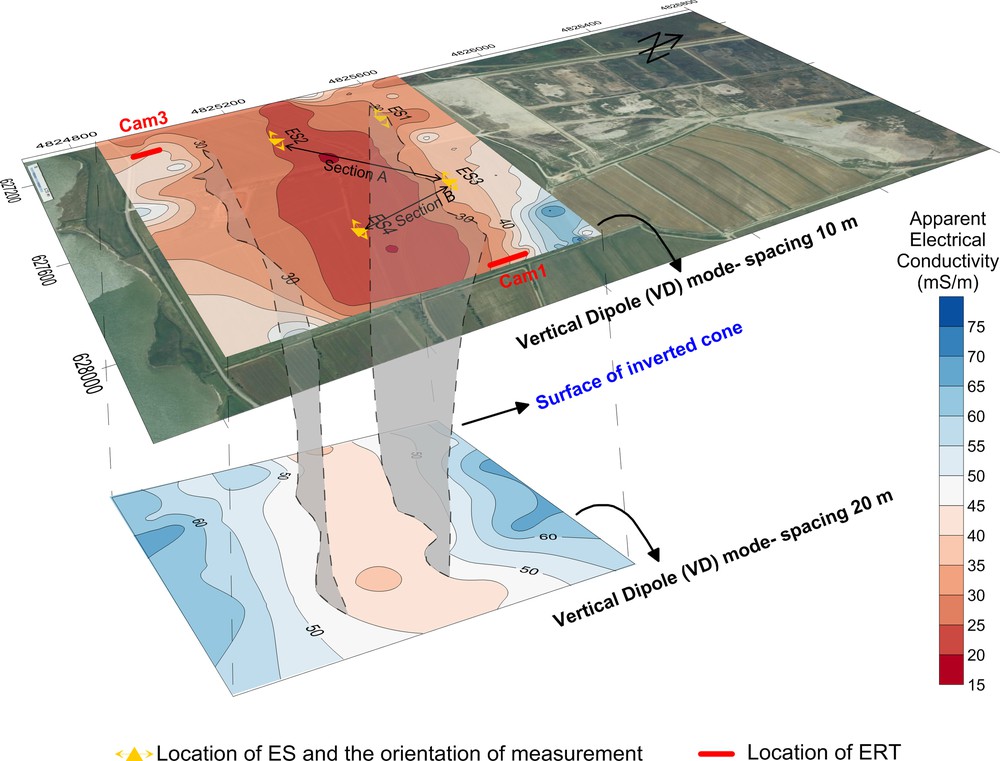
Overlap of EM maps regarding coils spacing (map VD-10 m above and map VD-20 m below). Location of the ERT, the ES and 2D section from ES correlation.
4.2.2 Electrical sounding
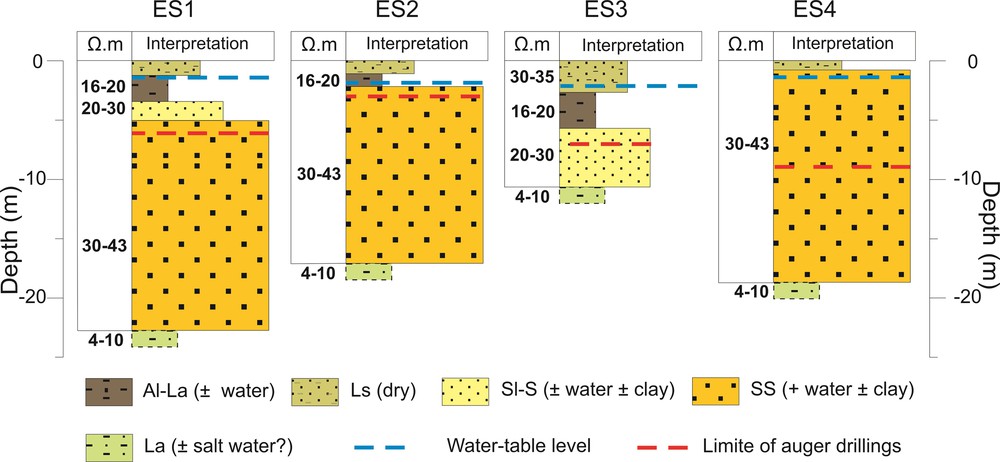
EM34 mapping highlighted the presence of the Saint-Ferréol paleochannel. However, this technique does not allow us to obtain the lower limit of the aquifer, i.e. the contact with the marine silty formation (Boyer et al., 2005). Considering EM34 results and structures’ orientation, the ES were deployed and concentrated in the central area (Fig. 4). The EC of groundwater in the central area is 700 μS/cm and the general depth of the water table is 1.5 m from the surface. Four Auger drillings were implemented close to ES. The lithological logs were used to calibrate and constraint the inversion and interpretation of the first meters (3–7 m). The water table's level was also taken into account during inversion. In general, the apparent resistivity (ρa) of the interpreted layers is very low, compared to the typical obtained values (e.g., sandy formations) and this is probably due to the presence of water. In addition, this range of ρa values was observed in other studies carried out in the Camargue plain (Cary, 2005; Maillet et al., 2005). For each lithological unit identified by Auger drillings, a ρa value was determined by the ES results. The ρa values of these lithological units are displayed in Table 2. The clayed silt facies’ (La) ρa value is not directly associated with a lack of access through Auger drilling.
Apparent resistivity of facies and water in the study area.
| Facies | Sediment | Resistivity (Ω m) | Water content |
| Al–La | Silly clay to clayed silt | 16–20 | Yes |
| Ls | Sandy silt | 31–35 | No |
| SI–S | Silty sand to fine-grained sand | 20–30 | Yes |
| SS | Coarse-grained sand | 30–43 | Yes |
Taking into account ρa values of local sedimentary facies, a geological interpretation of all electrical soundings is possible (Fig. 5). The attribution of ρa to facies allows us to identify an important thickness of the SS facies. In the same way, a very conductive layer (4–10 Ω·m) has been identified at the base of all ES. With this range of values, this layer can be associated with the presence of clayed silt of marine origin (La), considered in this paper as the substratum of the aquifer. A particular characteristic of the La facies is its depth variation: between 10 m (ES3) and 22.5 m (ES1). In ES2 and ES4 soundings, the top of this facies is present at a depth of 17 m.
Integration of ES and Auger drillings results. Color available online.
A reconstruction of the structure of the aquifer based on ES is shown in Fig. 6. The reconstruction was carried out through two 2D sections: section A and section B (Fig. 4). Section A includes ES2, ES1 and ES3, and is oriented from the southwest to the northeast. Section B includes ES4 and ES3, and is oriented from south to north. The structural correlation shown in Fig. 6 allowed the reconstruction of the Saint-Ferréol paleochannel structure and its connection with adjacent facies. Comparison between two sections highlights a slope of paleochannel from ES4 (southeast of the site) to ES1 (northwest of the site), agreeing with the direction of the paleoflow (Arnaud-Fassetta, 1998).
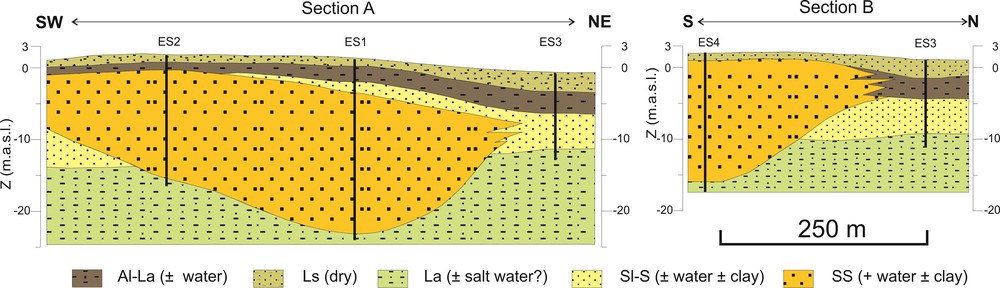
Structural correlation based on ES results. Color available online.
4.2.3 Electrical resistivity tomography
ERT was used to determine the degree of heterogeneity of the central riverbank. ERT survey was implemented in zones where EM34 survey showed a strong lateral variation of σa (Fig. 4). ERT section were named Cam1 (northeastern part of the site) and Cam3 (southwestern part of the site). The electrodes have been oriented in north–south direction throughout the zone where the EC gradient is important. Several Auger drillings, at depths between 2 m and 5 m, have been carried out along the ERT sections. The lithological interpretation was combined with ERT results to obtain a geological interpretation of the subsurface (Fig. 7).

Interpretation of ERT sections and superposition of the lithological correlation from the auger drillings. A. Cam1 section (iteration 3, error = 1.4%). B. Cam3 section (iteration 3, error 6%).
The obtained resistivity values vary from 5 to 40 Ω·m. Lithological interpretation coupled with resistivity values in ERT sections were crosschecked with the ρa values obtained for each facies in the ES results. In general, resistivity values from ERT are a bit lower than ES values; this is probably due to the inversion processes.
The Cam1 section presents a good correlation with lithological interpretation until a depth of 5 m (Fig. 6A). In the southern part of this section, the resistive part (≈24 Ω·m, in orange in the online version) can be interpreted as a part of a paleo-riverbank (Saint-Ferréol). The superjacent layer can be interpreted as a lateral variation between clay and silty sand formations. The resistivity of the recognized layers decreases progressively in depth and northward (red arrow). Auger drillings highlight an increase of the clay content as well as of the salinity toward the north. In this area, EC of groundwater is multiplied by six in summer because of evapotranspiration. The strong seasonal variations of the EC of groundwater to the lowest fields in the northern part of the study area suggest an impact from the evaporation phenomenon. This hypothesis, coupled with the fact the lateral groundwater flow is low, can explain the particular resistivity distribution in the Cam1 electrical section. The accumulation of salt can be the cause of this distribution.
An even better correlation between lithological interpretation and ERT results is revealed in Cam3 section (Fig. 6B). The layers recognized in the northern part of section were identified as a limit of the Saint-Ferréol paleochannel (SS facies). Moreover, the conductive layer in the base of the section (≈5 Ω·m) is interpreted as a La facies, likewise in ES results. While Ls facies were recognized near the surface, Al-La and Sl–S facies cannot be easily separated within the ERT section. Cam3 section presents also a progressive passage of resistivity (dotted line) between sandy (Sl–S) and silty (La) layers. This passage is thicker in the southern part of the section and it becomes more abrupt to the north. Its form is probably due to a salt-water intrusion that can be compared with freshwater/saltwater transition zones described in several publications (Cooper et al., 1964; Custodio, 2002). Cam3 section is close to the Vaccarès lagoon, where water EC is approximately 25 mS/cm. All this suggests a possible saltwater intrusion from the Vaccarès lagoon through Al–La and Sl–S facies in the first part of the section. However, this hypothesis does not allow us to reject any paleo-salinity in the silty layer due to its marine origin.
5 Integrated interpretation
To summarize geological and geophysical results obtained in this study, a conceptual sedimentary model of the geological system is suggested in Fig. 8. EM mapping allowed us to identify the presence of a central structure, probably linked to the Saint-Ferréol paleochannel. A geostatistical analysis of these results highlighted a lateral continuity of the subsurface structures in the east–west direction and a clear heterogeneity in the north–south direction. Therefore, characteristics of lithological units (Fig. 2) could be extrapolated to the east and west directions within the study area. The ES survey allows us to identify the substratum of the superficial aquifer. ERT detected a series of horizontal bodies, associated with their depositional environment.

Conceptual 3D model of the geometry of the superficial aquifer. Color available online.
All geophysical data have been collected after the irrigation period, when the EC of groundwater was stable. Thus, EC variations of subsurface are mostly linked to clay and/or water content lateral and vertical variability. The structural anisotropy of the layers is evident. This anisotropy affects directly their permeability and, consequently, the groundwater behavior.
The conceptual sedimentary model includes all recognized spatial variability of the near-surface features and it will be used for the development of a mathematical hydrodynamic model of the aquifer.
6 Conclusions
The characterization of hydrodynamic behavior of aquifers depends on a good definition of boundary conditions and of the heterogeneity degree. The lithological characterization of aquifer's functional units allows us to understand the hydrogeological conditions. In fact, the heterogeneity degree of functional units plays a fundamental role in groundwater flow path.
The integration of geophysical and geological techniques allowed us to identify the presence and lateral extension of the Saint-Ferréol paleochannel, the vertical contact between lagoonal–fluvial deposits and the marine clayed silt that separates the superficial aquifer from the deeper aquifer. Likewise, high north–south heterogeneity and east–west homogeneity were highlighted in the study area. The presence of clay in sandy deposits in the low areas implies changes in lateral permeability. That, together with the low hydraulic gradient, suggests a slow groundwater flow in the local system.
In this type of environment, the irrigation can bring variations in the groundwater's EC. These variations can affect the interpretation of geophysical results. A well-suited period for geophysical techniques implementation is when EC groundwater values are stable and not influenced by anthropic activities. Certainly all measurements need to be carried out within the same hydrological period or during periods presenting similar EC groundwater values.
In summary, an effective, easy-to-use and low-cost methodology combining geological/hydrogeological information from Auger drillings and the results obtained with three geophysical techniques (EM, ES and ERT) have being developed to characterize the structure of typical Mediterranean deltaic aquifers. The methodological approach can be summarized in the following way:
- • to carry out a few recognition campaigns through EM mapping (several investigation depths) to identify general structuring;
- • based on the EM results, to obtain local information through Auger drillings and ES in order to identify the geological units and to precise their electrical resistivity properties;
- • to perform ERT surveys, which are are necessary to obtain more accurate information in zones where strong lateral variations of electrical conductivity are identified.
Knowledge of the water table's level and of its EC properties is important for the final interpretation. This approach can be used to study other superficial deltaic aquifers in the Mediterranean.
Acknowledgment
We thank M. Philippe Brissot (the Cabassole Mas owner) for allowing us to use his estate to carry out these surveys. We also thank O. Bour and E. Carrillo for their review and very useful comments that helped us to improve this paper.