

1 Introduction
Brittany is mainly constituted by a Hercynian massif of granitic and metamorphic rocks. The North Armorican Shear Zone (NASZ) and the South Armorican Shear Zone (SASZ) are the main structures of the Armorican Massif (Fig. 1a). The most important, the SASZ, is a vertical 600-km-long structure (Bitri et al., 2003) that extends from the southwestern Armorican Massif to the northern Massif Central. South of the Armorican massif, Hercynian shear zones are also present in the Charente and in the margin up to Oleron Island (Fig. 1a). Thin Jurassic to Eocene sedimentary layers (Lefort, 1993) cover these regions. Near the coast, this sedimentary pile with a maximum thickness of 1 km does not totally hide the Hercynian structures, which can be observed in the field.
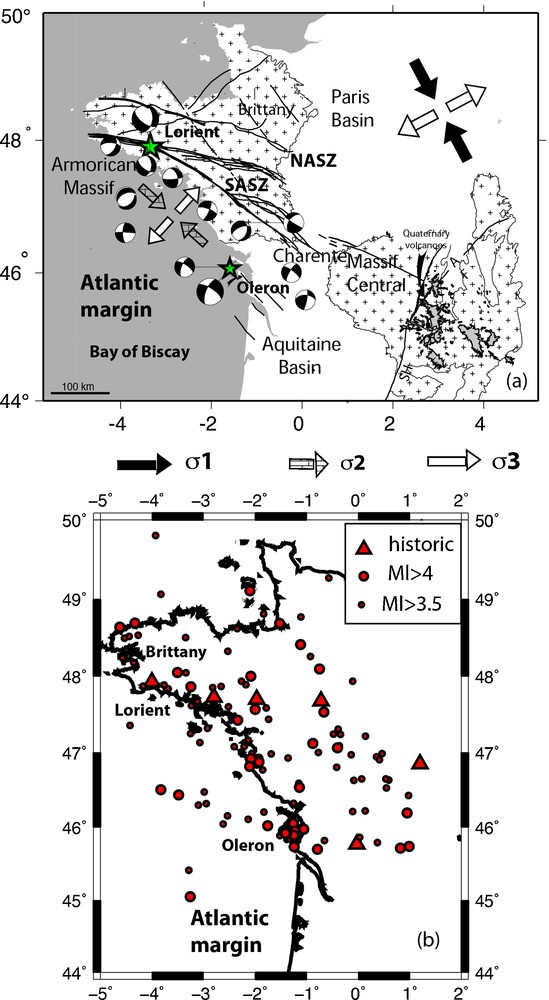
a: geodynamical and structural sketch of the study area. The focal solutions are from Nicolas et al. (1992) and Mazabraud et al. (2005a). The regional stress field is depicted; b: seismic activity in western France, along the Atlantic margin. Squares represent earthquakes along the past 1000 yr, reported in Bakun and Scotti (2006). Circles represent instrumental events of magnitude > 3.5, from the LDG/CEA catalogue.
Moderate earthquakes occasionally strike the Atlantic margin of western France, a region with a low level of instrumental seismicity. A ML = 5.7 seismic event, the Hennebont earthquake near the city of Lorient, occurred on 30 September 2002 (Fig. 1a). Several events were recorded near Oleron island (Fig. 1a): a seismic crisis in 1972, with the 7 September 1972 earthquake of local magnitude ML = 5.2, a crisis from March up to May 2005, with a ML = 4.6 main shock and another of ML = 4.2, as well as the most recent, the 28 September 2010 event of local magnitude ML = 4.5. Several other events of magnitude between 4 and 5 occurred on the Atlantic margin (Fig. 1b), from the western extremity of Brittany to the Bay of Biscay (Arroucau, 2006; Nicolas et al., 1990; Perrot et al., 2005) and throughout the area, several hundred small events are recorded every year. Fig. 1b shows that if microseismicity remains diffuse even after relocation (Arroucau, 2006), the main events globally follow the Hercynian faulting direction. However, the regional far-field stress is deforming at a very slow rate (about 0.3 mm/year according to Nocquet, 2012). Another intriguing feature is the local stress field that is globally extensive (Delouis et al., 1993; Golke and Coblentz, 1996; Mazabraud et al., 2005a; Perrot et al., 2005). According to these studies from focal mechanism inversions, Brittany is globally submitted to an extensive regime with a minimum stress axis σ3 orientated NE–SW (Fig. 1b). Further south, the 1972 Oleron island main shock had a strike-slip mechanism with an extensive component corresponding to a N303° fault plane along an Hercynian faulting direction (Mazabraud et al., 2005a), whereas the major part of its aftershocks and events of the margin (Fig. 1b) are characterized by normal faulting (Nicolas et al., 1990). Some arguments are presented in this paper to explain the regional extensive perturbation found in seismological studies dealing with this region with respect to the general strike-slip regime of western Europe, with a NW–SE compression (Golke and Coblentz, 1996; Nocquet, 2012).
The 2005 crisis, also located around the Oleron Island, is described hereafter. Characteristics and causes of seismicity of southern Brittany as well as the seismic swarms located near Oleron Island are then analyzed. Our aim is first to compare the behaviour of Oleron activity with that of the SASZ. We seek to understand why we observe both a reactivation of some localized part along old inherited faults in this stable intraplate region and an extensive regime, often associated with this reactivation. To confirm the mechanism of local strain localization, we model, through thermo-mechanical modelling, the deformation of the hypocentral area of the Hennebont earthquake using a 3D finite-element code.
2 The 2005 Oleron seismic crisis
Several events of magnitude around 4 occur sporadically in this region of very low background seismicity. The location of the ML = 5.7 earthquake suffers from a poor azimuthal network coverage and from the absence of nearby stations (see Table 1 for the location). More recently, the networks are denser and contain broadband stations as well as stations very close to the epicentral zone, favouring the study of more recent events, such as the ML = 4.2 event on 4th April 2005 and the ML = 4.6 event on 18th April 2005. On 28th September 2010, another event of local magnitude 4.5 was recorded in the same area. Records show that the 2005 events are located very close to each other and correspond to very similar waveforms, whereas the 2010 event is located closer to the continent and provided quite different waveforms. A total of 13 events of magnitude higher than 1.9 were located by the local Rénass network (Réseau national de surveillance sismologique) from 16th March 2005 to 8th May 2005.
Location and source parameters of the seismic events.
| Date | Time | Longitude (°E) | Latitude (°N) | Depth (km) | Magnitude Ml–Mw | Strike (°N) | Dip | Rake |
| 9/7/1972 | 22:26:56 | −1.26 | 46.05 | 10 | 5.2 | 303° | 70° | −27° |
| 9/30/2002 | 6:44:48 | −3.246 | 47.864 | 12 ± 2 | 5.7−4.27 | 117 ± 8° | 62 ± 4° | −133 ± 6° |
| 4/4/2005 | 17:03:54 | −1.361 | 45.929 | 9.56 ± 0.5 | 4.2 | |||
| 4/18/2005 | 6:42:49 | −1.397 | 45.943 | 11 ± 0.7 | 4.7−3.8 | 0 ± 5° | 60 ± 5° | −14 ± 5° |
| 9/28/2010 | 11:29:42 | −1.32 | 45.86 | 11 ± 5 | 4.5 | 318 ± 9° | 27 ± 8° | 103 ± 3° |
We relocated these events using the code HypoDD (Waldhauser and Ellsworth, 2000) and a regional velocity model deduced from Mazabraud et al. (2005a), depicted in Table 2. The maximum horizontal and vertical errors in the computed locations are 0.5 km and 0.7 km, respectively, thanks to the records of the OLEF station, installed in Oleron Island, almost directly above the seismic swarm (Fig. 2a). The epicentres are globally very close to each other and most of them aligned along the N120 Hercynian direction, parallel to the Seudre fault visible in the geological map (Fig. 2a and b). However, some of them seem aligned along a north–south direction, as depicted in Fig. 2b. The 2010 event, located a few kilometres away from the previous swarm is aligned with the main direction and probably belongs to the Hercynian fault. However, its location is less constrained (horizontal and vertical uncertainties respectively of 5 km and 5 km) due to the lack of recordings at station OLEF. Location parameters of the three main events are displayed in Table 1.
Velocity model used in this study.
| Regional model | General model | ||
| Layer thickness (km) | Vp (km/s) | Layer thickness (km) | Vp (km/s) |
| 1 | 4.0 | 0.6 | 3.3 |
| 4 | 5.8 | 1.4 | 4.5 |
| 5 | 5.93 | 3.0 | 5.5 |
| 10 | 6.11 | 25.0 | 6.5 |
| 10 | 6.5 | ||
| 5 | 6.9 | ||
| Mantle | 8.0 | Mantle | 8.1 |
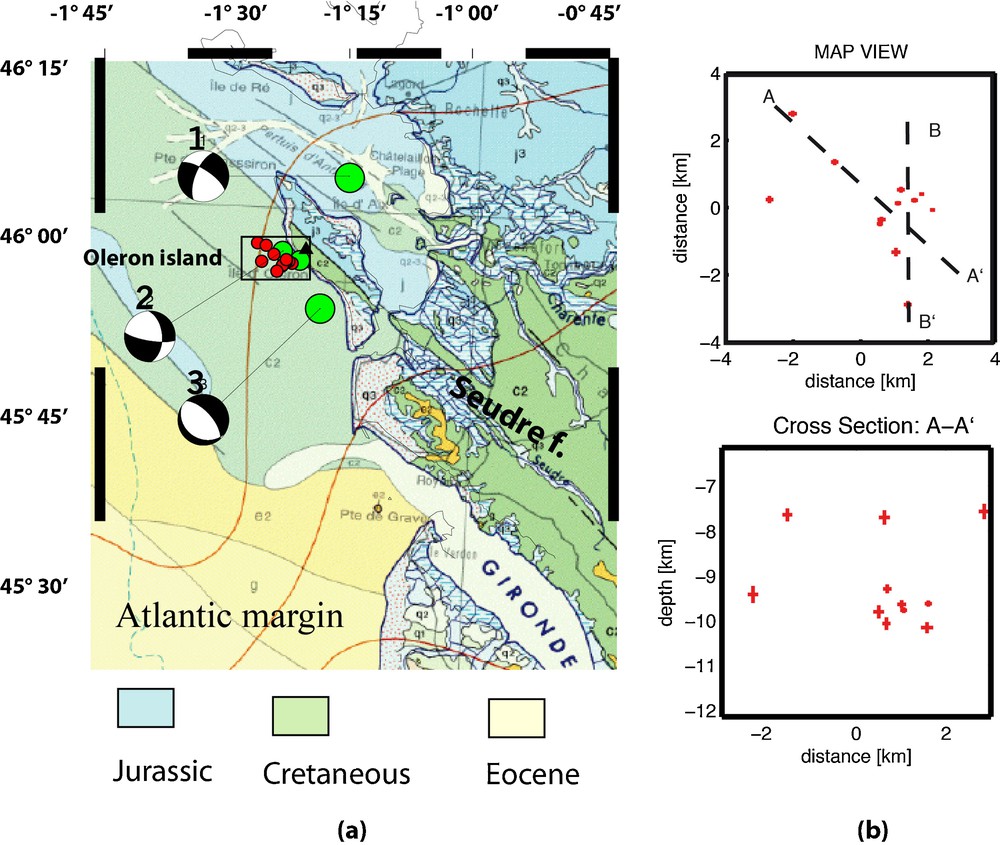
a: epicentre distribution of the 2005 Oleron sequence, superimposed on the geological map of the Charente region. The Oleron aftershocks swarm is indicated in red, the two events of magnitude higher than 4 in green. The focal solution of the 18 April 2005 event (2) is shown. The location of the 1972 event (1) as well as its focal solution is also shown, as well as those of the 28 September 2010 event (3). See Table 1 for references. The black triangle is the seismological station OLEF, located in the island, just close to the seismogenic zone; b: zoom of the aftershocks swarm, as located with the HypoDD code. Crosses, which are proportional to the errors, denote the location uncertainties. The N120-trending cross-section corresponds to the line A–A’. The line B–B’ corresponds to the direction of one nodal plane obtained in the source inversion of the main 18 April 2005 shock.
The source parameters of the 18th April 2005 shock are determined using seven three-component broadband or short-period stations of the French and Swiss networks (Fig. 3) and the FMNEAREG method (Focal Mechanism from Near source to Regional distance records, Delouis et al., 2008). It is a fast grid search for double-couple solutions (Delouis and Legrand, 1999), using a simple point source or a linear finite source model, depending on the event magnitude. It is based on the modelling of the complete displacement of the wave field. Here, due to the moderate size of the event, the source is represented by a single point source. The local source function is represented by isosceles triangles. The velocity records are integrated to the displacement and the band-pass is filtered in order to remove the low-frequency noise and avoid high frequencies that cannot be modelled with a simple velocity structure model. We adjusted the frequency range manually for each component individually. Filtering of the records varies with the instrument type and distance. The filtered displacement recordings are inverted to find the parameters of the focal mechanism using a two-step grid search. In the inversion procedure, the minima of the normalized RMS error between the observed data and the computed synthetics are searched, in a first step, using a coarse grid and, in a second step, with a fine grid around the previous minima. For each tested triplet (strike, dip, and initial rake) the rake and the amplitudes of the elementary triangular functions are inverted using a simulated annealing algorithm. Different tests were performed by changing the velocity model for the crust, among which the local crustal model used in the location procedure. The best results were obtained with a model that can be considered as an average broad-scale model (Table 2) and already used in studying some European earthquakes (Delouis et al., 2009). The best fit between the modelled and observed waveforms (Fig. 3) corresponds to a RMS of 0.321. The uncertainties of the deduced source parameters are estimated in studying a variation of 10% for this RMS around the best solution. We obtain a focal depth of 11 ± 1 km, a strike-slip mechanism with a normal component, strike = 0 ± 5°, dip = 60 ± 5° and rake = 14 ± 5° (Fig. 4a), a magnitude Mw of 3.7, whereas the local magnitude determined by the two national networks, Laboratoire de détection et géophysique (LDG, CEA) and Rénass, was much higher (respectively 4.7 and 4.6).
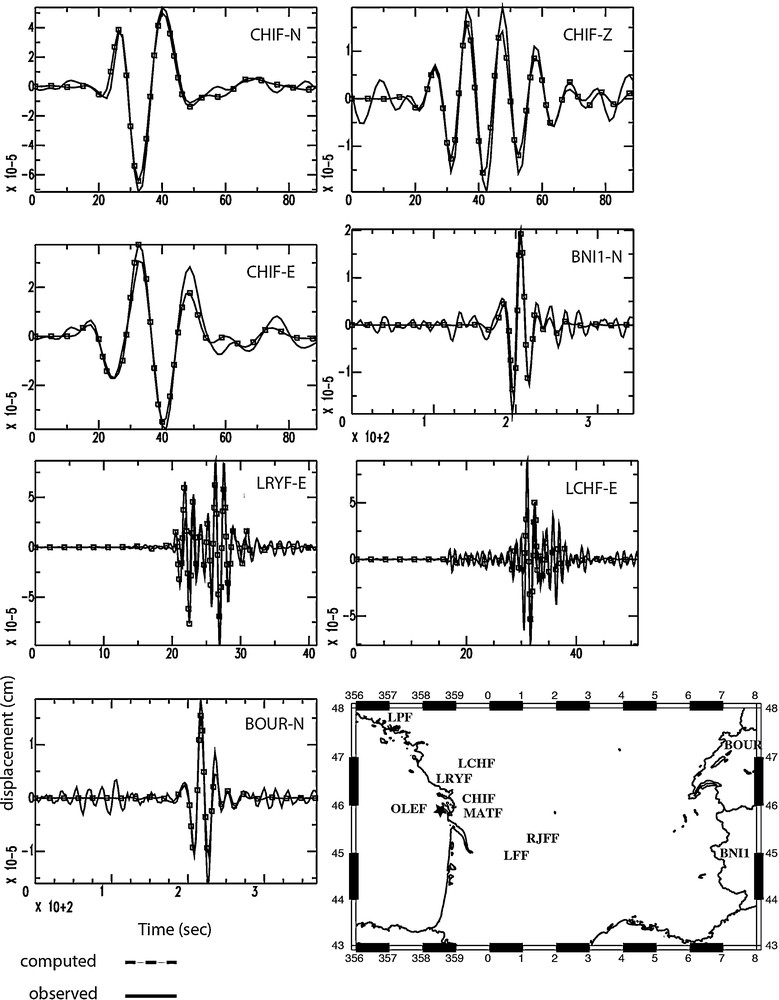
Source study of the 2005 main shock. Comparison between modelled and observed waveforms. The location of stations is reported in the map.
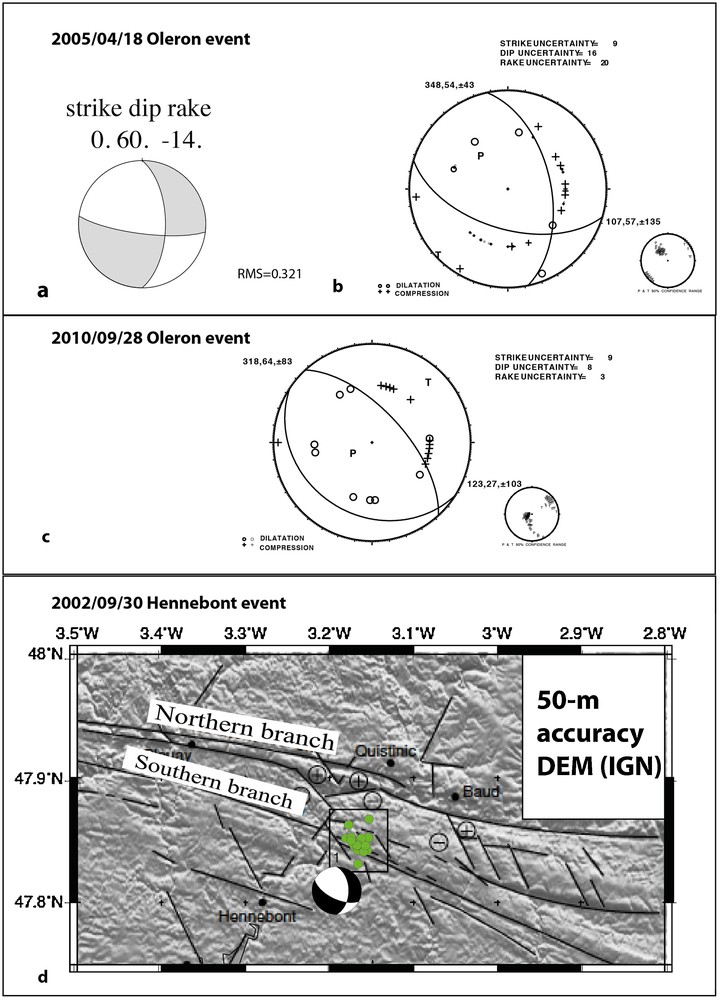
Focal mechanism for the 18 April 2005 event. a: inverted solution from waveform analysis, using the methodology of Delouis et al. (2008); b: solution obtained with the P polarities; c: focal mechanism obtained for the 28 September event, with the P polarities; d: focal mechanism of the 30 September 2002 Hennebont event. The distribution of the earthquake sequence, superimposed on the 50-m-accuracy DEM from IGN (Institut géographique national, France), illuminated in a N10 direction, and faults observed in the field, modified from Perrot et al. (2005) are reported.
We read also all readable P-wave polarities of all available stations of LDG and Rénass. We then inverted these P-waves first motions using the routine FPFIT (Reasenberg and Oppenheimer, 1985) and determined a very similar solution for the focal mechanism (Fig. 4b). Concerning the 28th October 2010 event, the signals are rather noisy, with low energy of the P-wave. It is not possible to invert the waveforms, and the focal solution deduced from readable P-wave polarities is less constrained, but suggests a normal solution with a N318 nodal plane, roughly in agreement with a Hercynian direction (Fig. 4c).
3 Comparison with the Hennebont seismic event
We show that the 2005 Oleron crisis is globally aligned along the Hercynian direction of the Sandre fault. Perrot et al. (2005) show that the Hennebont earthquake occurred near the intersection of two faults, the South Armorican Shear Zone (SASZ) and a secondary fault, oblique to the main structures. The aftershocks of this event were mainly located along this secondary fault, whereas the focal solution of the main event corresponds to a nodal plane in good agreement with the reactivation of the SASZ. In contrast, we present in this paper the well-constrained source parameters of the Oleron 18th April 2005 main event and show that they are not compatible with a nodal plane oriented along the direction of the Hercynian Sandre fault. We have to conclude that this event corresponds to a faulting direction that is not recognized on the geological map. We can observe in Fig. 2b that few aftershocks seem to be aligned along a north–south direction, corresponding to the orientation of a nodal plane, as deduced from the focal mechanism. Consequently, the Oleron crisis also occurred at the intersection of two directions of faulting: the main Hercynian direction, geologically known in the region, and a secondary one.
According to Perrot et al. (2005), the focal mechanism of the Hennebont earthquake is extensive, with a minor strike-slip component (Fig. 4d), whereas the aftershocks are characterized by extensive or strike-slip solutions with an extensive component. In this paper, we compute two new focal mechanisms: those of the 18th April 2005 and 28th September 2010 Oleron events. The first one is a strike-slip solution, whereas the second one is an extensive one. We also recall that the Ml = 5.2 7th September 1972 Oleron event was also characterized by a focal mechanism with an extensive component (Table 1 and Fig. 1). Consequently, the two regions are both characterized by the coexistence of strike slip or normal focal mechanisms.
Another similarity between the two areas is the dramatic discrepancy between the local magnitude computed from the amplitude of the Lg waves recorded in the national networks and the Mw value deduced from the two source studies (ML = 5.7 and Mw = 4.3 for the Hennebont event and ML = 4.7 and Mw = 3.8 for the Oleron event). The wave path in the Hercynian crust is characterized by a low attenuation coefficient, as obtained by Campillo et al. (1986), Drouet et al. (2008), and Bakun and Scotti (2006). Amplitude decreases more rapidly with distance in other regions, such as in southern France, the Alps and the Pyrenees (Bakun and Scotti, 2006). This discrepancy of the regional attenuation likely introduces a bias in the statistical computation of ML from the data of all available stations.
We are now seeking which geological or geodynamical features can favour the occurrence of these seismic sequences, with such characteristics.
The Bouguer anomaly data available for the region (Fig. 5a) shows a strong gravity contrast that is correlated with the Hercynian shear zones. Mazabraud et al., 2005b analysed these data through the computation of the Euler solutions obtained by inverting the Bouguer anomaly data. Euler deconvolution allows us to obtain the position of the source of the gravity anomaly in space (x, y, z) and the shape of the source responsible for the gravimetric signal. The location (especially at depth) of the Euler solutions gives valuable information for studying density contrasts within the crust. In the region under study, the Euler solutions are aligned along the Hercynian directions, even where no superficial fault is clearly present, such as in the Oleron and Charente regions. Moreover, these Euler solutions and the hypocenter of the Lorient and Oleron events are in the same range of depth (∼ 10 km), as shown by the cross-sections presented in Fig. 5b and c. Near Lorient, these Euler solutions seem related to the presence of plutons of Hercynian anatectic granite embedded in the weak ductile shear zone, in agreement with seismic results (Bitri et al., 2003). We thus deduce from this analysis that the location of the studied hypocenters corresponds to volumes of strong gravity heterogeneities in the crust. The distribution of the thermal flow in the region has also been compared with the seismicity pattern (Mazabraud et al., 2005b). Seismicity tends to locate in rather hot areas (between 70 and 90 mW/m2) along the SASZ, and more precisely at boundaries between hot and colder domains. Taking these observations into account, we infer that these seismogenic zones are related to rheological contrasts.
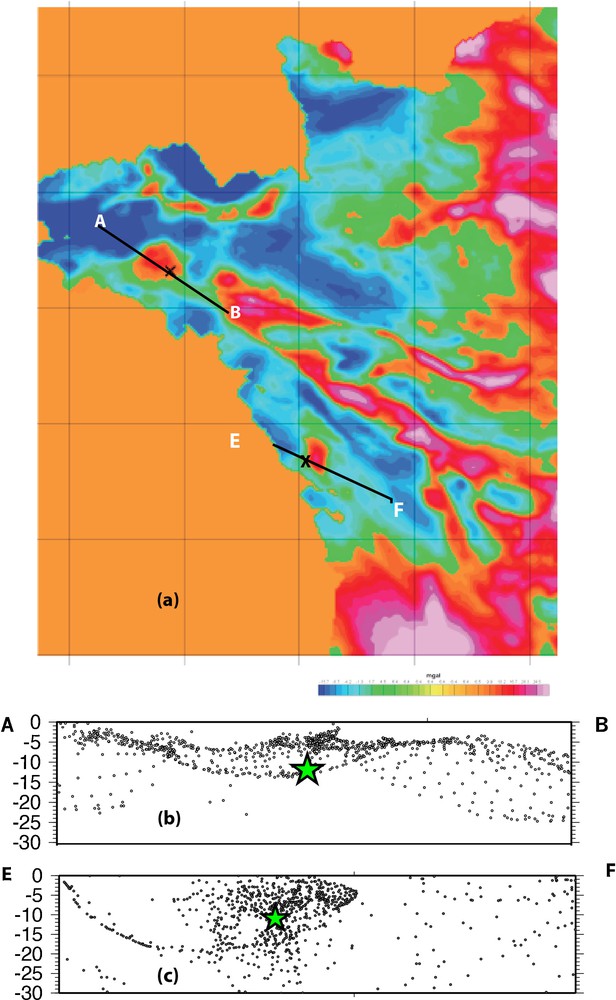
a: Bouguer anomaly map from BRGM (Ledru, 1997). These data were used in the computation of Euler solutions. The cross corresponds to the Lorient event location and the dark line to the direction of the cross-section; b: cross-section in the location of Euler solutions along SASZ. Each dark dot corresponds to one Euler solution. The biggest star corresponds to the location of the Lorient event; c: cross-section in the location of Euler solutions, near Oleron island. The biggest star corresponds to the location of the Oleron event.
4 Thermomechanical modelling
In order to test this hypothesis, we investigate by means of a three-dimensional thermo-mechanical finite-element model the structural and rheological features that can lead to a concentration of strain in localized parts of the SASZ, at the geological time scale. The localized zones where deformation intensity is maximal and temperature favourable are zones of weakness where creeping and also sporadic seismic ruptures can occur. We follow the methodology of Chery et al. (2001). In this model, the lithosphere is assumed to behave as an elastoplastic medium at low temperature and as a viscoelastic medium at high temperature. Elastoplasticity takes into account the qualitative change in the response of a material to deformation when stress is greater than a yield limit, i.e. the boundary between reversible and irreversible deformation.
After some geological time, we can assume that the mechanical system is at quasi-static equilibrium, corresponding to the balance between the internal and external forces (gravity and tractions imposed at the boundaries of the system). We can then study the evolution of the medium, particularly the total strain rate and the temperature pattern. If the model is in equilibrium and computation parameters reliable, whatever the velocity imposed as a boundary condition, the displacement field remains localized in the same areas.
We test a simple structure in 3D, consisting of 1 block, elongated over 200 km along the South Armorican shear zone, 100 km wide, and containing the upper and the lower crusts as well as the upper mantle down to 90-km depth. We introduce a strong density contrast between the lower and the upper crust to model the presence of plutons of Hercynian anatectic granite. The two fault zones, the vertical southern branch of the SASZ and the listric northern branch, are considered as low-cohesion, 1-km-wide domains (Fig. 6a). In order to model the transtensive stress field of the area, we impose on the lateral boundary of the model both a normal component of 0.1 mm·yr−1, describing the extensive effect described above, and a tangential velocity of 0.1 mm·yr−1. These velocities seem realistic, taking into account the geodetic results obtained for the region (Nocquet, 2012). We also impose the integrated hydrostatic pressure at the bottom of the model. As initial heat parameters, we impose a temperature of 1230 °C at the bottom of the upper mantle (at 90 km depth) and a temperature of 10 °C at surface. Thermal conductivity, specific heat and heat production are set according to the granitic nature of the crust and the measured data (Lucazeau and Vasseur, 1989). The computed initial heat distribution model provides a temperature of 350 °C near 15 km depth. This depth range is consistent with the regional seismogenic depths.
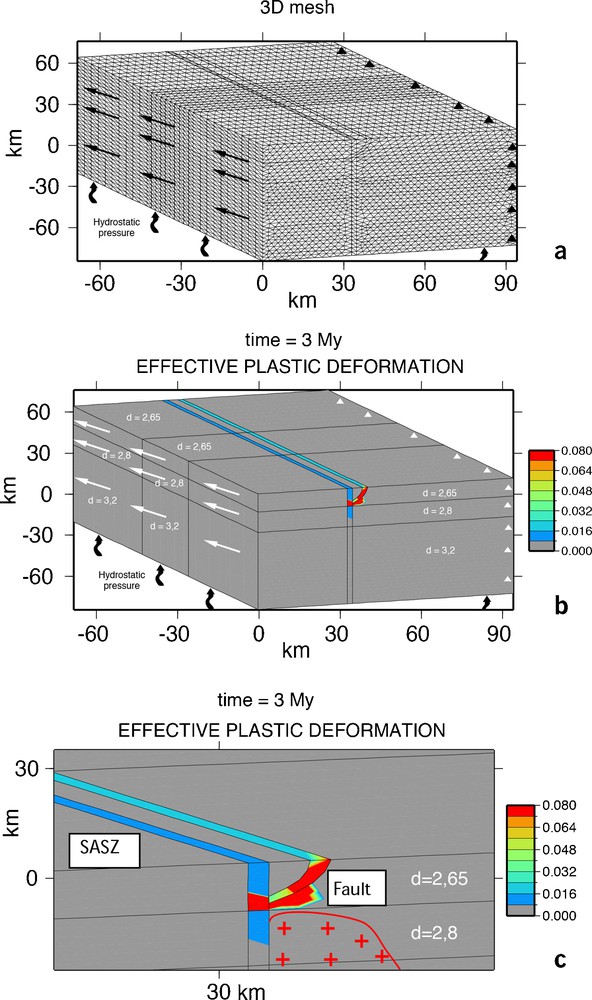
a: view of the 3D model mesh used in the modelling; b: white arrows indicate velocities and white triangles pinned faces. Effective plastic strain after 3 My; c: zoom on the SASZ at the location of the Lorient earthquake.
In the elastic domain, in order to take into account the increase of differential stress with pressure, we use a Drucker-Prager rheology model, defined by an internal friction angle, f, and a cohesion, c. A viscoelastic law (linear Maxwell model) is adopted to fit the strain-rate-dependent rheologies. The stress is a function of γ, the fluidity (inverse of the viscosity) that depends on the temperature T and the activation energy E, such that: , where γ0 is the multiplicative term that depends on the material.
In order to take into account the stress decay with temperature, we computed the values of parameters γ0 and E to obtain a viscosity of η = 1023·Pa·s−1 for the 350 °C isotherm (the basis of upper crust) and η = 1020·Pa·s−1 at the Moho (≈ 650 °C). We then used a 1-D strain rate–stress relation that is consistent with a power law for viscosity, at a strain rate of 10−22·s−1, in the viscous lower crust. See Table 3 and Vernant and Chéry (2006) for details.
Rheological parameters used in the modelling.
| Name | Upper crust | Lower crust | Upper mantle |
| Density (kg·m−3) | 2650 | 2800 | 3200 |
| Young modulus (Pa) | 2·1011 | 1·1011 | 5·1011 |
| Poisson ratio | 0.25 | 0.25 | 0.25 |
| Cohesion | 107 | 107 | 107 |
| Internal friction angle (°) | 20 | 20 | 20 |
| Non-linear fludity (Pa−1·s−1) | 0.85·10−14 | 0.85·10−14 | 0.48·10−18 |
| Power law exponent | 1.0 | 1.0 | 1.0 |
| Activation energy (KJ·mol−1) | 110·103 | 110·103 | 83·103 |
| Thermal conductivity (W·m−1·K−1) | 3.2 | 3.2 | 3.2 |
| Specific heat (J·kg−1·K−1) | 1070 | 1070 | 1070 |
| Heat production (W·m−3) | 2.9·10−6 | 2.9·10−6 | 1.0·10−6 |
We first verified the steady state of our starting model, taking only lithostatic conditions (without boundary velocities) as boundary conditions. After this verification, we computed the model with the boundary velocities. We have tested different numbers of elements (up to 225 000) in order to obtain an initial mesh that well describes the structure (Fig. 6a). We verified that the faulting zone is not subject to numerical artificial deformation. After 3 Ma of evolution, we can verify that the system is in quasi-static equilibrium. After this time, we found out that the deformation is concentrated in the crustal part of the model, on the northern fault and at the junction between the two faults (Fig. 6b). A zoom on the SASZ (Fig. 6c) shows that some important deformation is concentrated on the northern fault and at the junction between the two faults, but also occurs under the northern branch and propagates to the north between the fault junction and the vertical density contrast, at the boundary between the upper and lower crusts. This deformation pattern corresponds to the location of aftershocks of the Hennebont event that are aligned obliquely with respect to the two branches of SASZ. So, a simple model taking into account the main characteristics of Lorient region describes a localization of deformation that could favour at geological times the creation or reactivation of small faulting transverse to the main Hercynian faults. The stress amplification due to the cumulative strain rate in this zone can involve sporadic seismic ruptures for short times when the plasticity threshold is reached.
5 Discussion: Seismic activity and stress permutation due to local geological features
Western Europe is globally submitted to a strike-slip regime, with a NW–SE compression (Golke and Coblentz, 1996; Nocquet, 2012). Several possible sources can be invoked in order to explain the regional extensive perturbation found in seismological studies dealing with the French Atlantic margin (Delouis et al., 1993; Mazabraud et al., 2005a; Perrot et al., 2005). Intraplate extension is often related to vertical forces, which in this area may originate from buoyancy forces arising since the last deglaciation. Post-glacial rebound is a large-scale phenomenon and is weaker in western Europe than in North America, where it is not sufficient for perturbing the stress field (Grollimund and Zoback, 2001). Another cause invoked to explain this uplift is the lithospheric flexure of this region, due to the orogens of the Alps and the Pyrenees. However, these two buoyancy forces have large wavelength and small amplitudes (Nocquet, 2012). They could partly explain the general tilting of western Brittany deduced by Lenôtre et al. (1999) from a levelling study. However, these authors interpreted some results of their levelling profiles as an indication of localized phenomena such as fault activity or movement between blocks. In all cases studied here, local perturbations can likely be invoked to explain the switch between the principal stress axes σ1/σ2 deduced from focal mechanism and stress tensor inversions. Strike-slip and normal faulting are often associated in a wide variety of regions. They can reveal accommodation of deformation within pre-existing and heterogeneous structural patterns (see Bergerat and Plateaux, 2012, as the case study of Iceland). The western European stress field is characterized by a maximum horizontal compression (σHmax) orientated NW–SE (Nocquet, 2012). The SASZ is a weak ductile shear zone, also oriented NW–SE, with very probably anisotropy properties. Extensive deformation along conjugate structures is mechanically consistent. Hu and Angelier (2004), through 3D distinct element modelling, explored a variety of simulations to characterize and interpret stress permutation in brittle tectonics. They show that variations in rheology are sufficient to induce stress perturbations. Their experiments indicate that the major causes of stress permutations are the heterogeneities of the brittle medium (intact rock massifs between heavily faulted deformation zones) and the anisotropy of the mechanical properties that result from fracturing and faulting. The presence of plutons of granite embedded in the weak ductile shear zone (Bitri et al., 2003) represents the strong domain (Fig. 6b) corresponding to a high Young's modulus. This geological situation corresponds well to Hu and Angelier (2004)’s numerical experiment and explains the coexistence of strike-slip and extensive focal mechanisms in the same area. The high friction coefficient, as obtained for the Hennebont event (Perrot et al., 2005) from the study of the source parameters, can be explained by the presence of this rheological contrast.
6 Conclusion
In this paper, we present the source study of the ML = 4.7 18th April 2005 and of the ML = 4.5 28th September 2010 Oleron earthquakes that occurred on the French Atlantic margin. Our new results confirm that an extensive component can be superimposed to the general strike-slip stress field of the western European region. We suggest that local effects are likely prominent. In particular, the main event of our study area, the 30th September 2002 ML = 5.7 Hennebont event, is located at the area near the intersection of two fault zones where the heat flux flow is important. We deduced from the computation of Euler solutions that the local source of gravity anomaly is located at the depth of the hypocenter and corresponds to a strong density contrast at the brittle–ductile transition zone. Results of 3D thermomechanical finite element modelling are in agreement with the hypothesis of local stress and strain accumulation due to rheological contrasts along inherited faults. Studying Oleron crises underlines the similarity of seismological behaviours between the South Armorican zone and the Charente coast, submitted to the same stress regime, structurally very comparable and corresponding to gravity anomalies located at the same depth range as the hypocenters of seismic events. We therefore infer that the occurrence of seismic events of ML > 4 along the Hercynian faults from the Atlantic margin up to the north-western boundary of the Massif Central is due to the local reactivation of these old faults and of small secondary faults, favoured by stress concentration due to heterogeneities, as the presence of pluton and/or local high heat production in the crust. These variations in rheology can favour stress perturbations. The coexistence of strike-slip and normal faulting in the region reveals an accommodation of deformation within this heterogeneous structural pattern.
Acknowledgements
We are grateful to Thierry Camelbeeck, Jean Chery, and Michel Campillo for their constructive reviews, which have improved the manuscript. We thank Isabelle Manighetti and Yves Cansi for fruitful discussions. We are indebted to the RéNaSS and LDG/CEA teams, who managed earthquake monitoring. This work was partly supported by the SI-HEX project, with financial support from the MEEDDM French Ministry (Convention MEEDDM–CNRS 007147).