

1 Introduction
The Vis–NIR diffuse reflectance spectroscopy probes the sample dielectric properties in the 400-to-2400-nm wavelength domain, thus potentially involving both electronic and vibrational transitions together with light scattering processes (Clark, 1995). Applied to soil samples, the general shape of the spectra in the Vis–NIR region is affected by many sample characteristics such as clay content, organic matter, mineralogy, moisture level and surface roughness. Vis–NIR spectra show poorly-defined broad bands, with narrower vibrational overtones and combination bands (Miller, 2001) that make it difficult to identify an attribute of the soil of interest (Madeira et al., 1995).
However, this kind of spectroscopy appears to be a promising tool for geographic study and discrimination, uplift, and mapping of soils, as underlined in many studies (Demattê et al., 2004, 2012; Fiorio et al., 2010; Galvão and Vitorello, 1998; Galvão et al., 1997, 2001; Gomez et al., 2012; Loughlin, 1991; Palacios-Orueta and Ustin, 1998; Tangestane and Moore, 2000; Viscarra Rossel and Chen, 2011). In addition, Fiorio et al. (2010) observed that for soil discrimination, the dataset of spectra obtained in the laboratory was more accurate than the orbital set.
Over the last twenty years, Vis–NIR diffuse reflectance spectroscopy has been used in soil science for assessing physical characteristics (Viscarra Rossel et al., 2009), mineralogy (Vendrame et al., 2012; Viscarra Rossel et al., 2006b, 2009), chemical properties (Brown et al., 2006; He et al., 2007; Islam et al., 2003; Reeves and Smith, 2009; Viscarra Rossel et al., 2006a) and biological attributes (Barthès et al., 2010; Terhoeven-Urselmans et al., 2008; Velasquez et al., 2005). The advantages offered by this method include the absence of sample pretreatment, the reduced use of polluting chemical reagents and the possibility to analyze a large number of samples at a cost lower than that associated with traditional methods.
As a result of the development of the spectrophotometers and associated informatics tools, the influence of the sample characteristics is determined by chemiometric methods, i.e. multivariate statistical methods. This makes the spectral analysis results dependent on the assumptions of the mathematical analysis strategy, leaving the physical relationship between soil and spectra unclear and poorly assessed. Recent reports have pointed out that there is still no consensus on which is the best multivariate statistical method to use (Reeves III, 2010; Xiaobo et al., 2010). In 2010, Stenberg et al. suggested working towards a better understanding of the complex physical relationship between the soil and spectra, arguing for ongoing development of the spectroscopic method in soil science.
Concerning tropical soils, it is possible for the same soil to show different spectral responses and for different soils to show a similar spectral response (Demattê et al., 2004; Formaggio et al., 1996). These authors observed that the spectral response is not clearly associated so that soils can be grouped or discriminated and can differ from the groups established by a taxonomic system. They observed that the distinction of the soils based on their spectral responses can reveal a number of soil classes that differ from those produced by conventional analysis. In areas with complex transitions within different soils, discrimination by spectroscopy was also unsuccessful. Therefore, the uncertainties introduced by the soil discrimination method can compromise the quantitative and qualitative information to be used for mapping or classifying the soils based on the spectral response. Such uncertainties may prevent the use of the spectroscopic approach in agricultural (e.g. precision agriculture), environmental and ecological projects.
Facing these issues, Webster and Burrough (1974) proposed the first treatment of spectral data by discriminant analysis. Among the methods available for processing the data, principal component analysis (PCA) allows the reduction of original variables to orthogonal variables, according to the importance of overall data variation (Hair et al., 2005; Tabachnick and Fidell, 2007), dimensionality reduction (Galvão et al., 1997; Palacios-Orueta and Ustin, 1998; Smith et al., 1985) and, most importantly, the physical interpretation of spectra (Smith et al., 1985). The use of PCA in spectrum analysis can therefore make this process less dependent on conventional statistical methods (Reeves III, 2010; Smith et al., 1985).
The PCA method has been previously used for the analysis of spectroscopic data from highly variable pedological covers, as seen in studies carried out by Loughlin (1991), Galvão et al. (1997), Palacios-Orueta and Ustin (1998), Tangestane and Moore (2000) and Galvão et al. (2001). In contrast, there is no report of studies based on the physical analysis of spectra for a single taxonomic class of soil, which may allow a better understanding of the relationship between the spectral response and soil discriminations.
In this context, the objective of the present study was to evaluate the efficiency of Vis–NIR spectroscopy in the analysis of a single taxonomic class of soil, and to determine which wavelengths allow soil differentiation on a local scale. The approach adopted analyzes existing correlations between the spectral response of soils and PCA treatment of the data. The study was carried out on Latosols (Ferralsols of the Brazilian taxonomy) from the Brazilian Central Plateau, mainly characterized by subtle mineralogical variations (Macedo and Bryant, 1987; Reatto et al., 2008).
2 Materials and methods
2.1 Areas of study, soil sampling and analysis
The investigated areas were on a commercial farm located in the Brazilian Central Plateau, state of Goiás (15°C22′S and 47°C27′O). Area 1 consisted of a 375-ha field with elevations between 1029 and 1102 m and area 2 consisted of a 320 ha field with elevations between 944 and 1056 m. The soils are developed on meta-sedimentary rock made up of argillites. According to the Brazilian soil classification system (Santos et al., 2006), the pedological cover of plot 1 is made up of dystrophic Red Latosol and acric Red–Yellow Latosol. The cover of plot 2 is made up of dystroferric Red Latosol, acric Red–Yellow Latosol and distrofic Red–Yellow Latosol.
Eighty-eight samples taken from 11 soil profiles were used for the study. The profiles were collected from the top, middle and foot of the slope and distributed into four toposequences (two in each plot) (Table S1). For the characterization of the soils, samples were collected in triplicate from eight depths (0.00–0.05, 0.05–0.10, 0.125–0.175, 0.225–0.275, 0.325–0.375, 0.725–0.775, 0.875–0.925, and 1.075–1.125 m), giving 88 samples in the data set. In the 0.80–1.00 m layer, clay content ranged from 295 to 878 g kg−1, fine sand from 20 to 433 g kg−1, iron oxide from 40 to 125 g kg−1, aluminum oxide from 140 to 275 g kg−1, and organic matter from 3.4 to 9.7 g kg−1 (Table S1).
Analysis was carried out as described in Claessen (1997). Particle size distribution was determined using the pipette method, via mechanical and chemical dispersion through slow agitation over 16 hours with NaOH 1N. Organic matter contents were determined through wet oxidation by treatment with a mixture of potassium dichromate and sulfuric acid, and contents of silica (SiO2), iron (Fe2O3), aluminum (Al2O3) and titanium (TiO2) were determined using sulfuric acid digestion (after dissolution in H2SO4 1:1).
The silica and aluminum extracted by acid digestion were used to calculate kaolinite (Ct) and gibbsite (Gb) contents (Reatto et al., 2008; Vendrame et al., 2012) based on the assumption that there was no isomorphous substitution in these minerals (Resende et al., 1987). The calculation of goethite (Gt) and hematite (Hm) was based on aluminum substitution rates of 33% and 16% (Fritsch et al., 2005; Schwertmann and Taylor, 1989).
2.2 Collection of spectra
To measure the reflectance of the samples, 5 g of each soil sample was sieved through a 2 mm aperture sieve and packed into a cup with a 0.05 m diameter quartz lens. The samples were previously dried at 40 °C over 24 h and maintained in desiccators until the time of collection of the spectra to standardize their water content. Reflectance was determined at 2 nm intervals in the Vis–NIR region between 400 and 2500 nm, using a FOSS-XDS spectrometer, resulting in a data matrix with 88 rows and 1050 columns for each sample.
The 2 nm reflectance interval was increased to 10 nm (matrix of 88 rows and 208 columns), with the aim of removing some of the uncertainties in wavelength precision. This procedure had been previously adopted by Velasquez et al. (2005), Brunet et al. (2008) and Ertlen et al. (2010). To better represent the correlations with the components of the soil, reflectance R was transformed into an absorbance value using the equation A = [log10(1/R)].
The variability of the spectra was evaluated by repeating measurements 30 times on one soil sample selected randomly. To carry out each new scan, the ring cup was removed from the equipment and a new sample prepared for the next replicate. The reflectance amplitude of these readings was 0.008 to 0.01 nm (95% probability). Therefore, variations larger than 0.01 nm between spectra of different soil profiles were considered to be due to the sample and for there to be no residual effect due to the equipment. Each spectrum sample represented an average of 32 readings. The average spectrum from three repetitions for each layer of the soil profiles was obtained with WinISI II v1.50 software (Foss NIRSystems/Tecator Infrasoft International, LLC, Silver Spring, MD, USA).
In soils containing both kaolinite and gibbsite it is difficult to observe the presence of one mineral without interference by the other, mainly due to the proximity of the characteristic peaks for these two minerals in the region between 2200 and 2300 nm. The maximum point of reflectance situated between these wavelengths was therefore chosen as a reference in order to calculate the absorption intensity of kaolinite IK (IK = Rmax – R2205) and gibbsite IGb (IGb = Rmax – R2265), where Rmax is the maximum reflectance between 2205 and 2265 nm, R2205 is the reflectance at 2205 nm, and R2265 is the reflectance at 2265 nm (Madeira et al., 1995). The ratio between the absorption intensities of these minerals was also calculated using the equation ICt/(ICt–IGb).
2.3 Statistical analysis
Principal component analysis (PCA) was used for the analysis of the soil sample spectra. The correlation matrix of the reflectance values from all spectra provided the eigenvalues related to the principal components. The correspondence between the soil spectra and the soil layers was analyzed by plotting the principal component scores. Confirmation of similarity between the spectra was evaluated through direct comparison of the principal wavelengths obtained through PCA. The spectra for the 0.80–1.00 m layer of the profiles were compared using the Tukey test with a probability of 1%. The layers of each profile were interlinked using a continuous line to facilitate visualization of the figures. In this phase of the study, the spectral collection of each one of the three soil samples collected was considered as a repetition of the layer, as, e.g., in Viscarra Rossel et al. (2009). The relationships between the PCA, wavelengths and soil components were analyzed using Pearson's linear correlation analysis (P < 0.01).
3 Results
3.1 Characterization of the spectra
The spectra of the soil profiles studied show five regions with distinct absorption characteristics (Fig. 1), two in the visible light region (Vis) at 400–550 nm and 700–850 nm and three in the near-infrared region (NIR) at 1350–1450, 1850–2000 and 2120–2200 nm. The region of highest reflection is between at 2200–2300 nm.
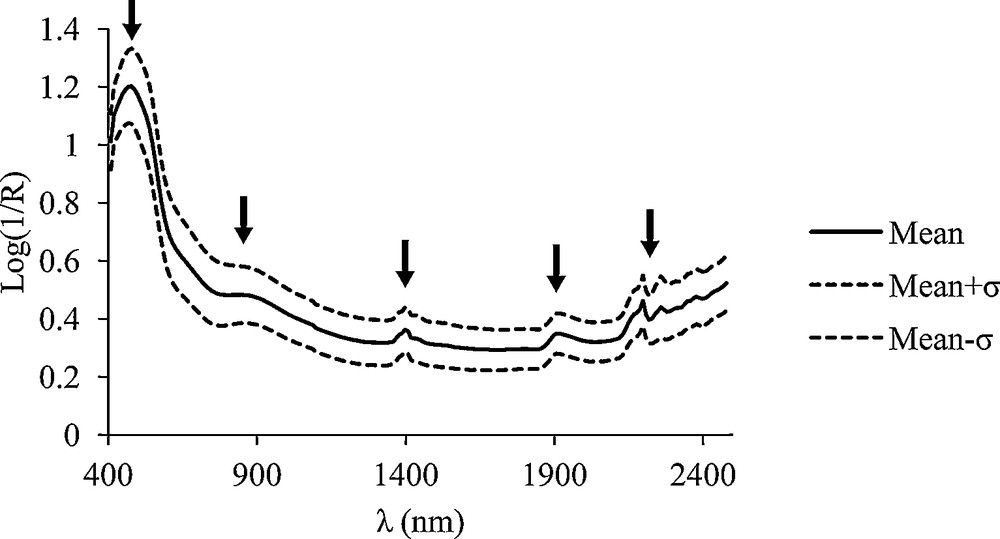
Soils samples spectral mean absorbance and standard deviation from 400 to 2500 nm (0.00–0.05, 0.05–0.10, 0.125–0.175, 0.225–0.275, 0.325–0.375, 0.725–0.775, 0.875–0.925, 1.075–1.125-m layers, n = 88).
3.2 PCA
Fig. 2 shows the eigenvalues of the first two principal components as a function of wavelength. Together they account for 97.4% of the total variance of the data, the first component (CP1) accounting for 89%. Eigenvalue 1 (A1) exhibited similar negative weighting factors at all wavelengths and indicated a direct relationship between the reflectance coefficient (albedo) and the first component (CP1) of the PCA (Fig. 2). Eigenvalue 2 (A2) showed a large absorption peak in the Vis region at 600–750 nm, two well-defined peaks in the NIR region at 1460 and 1900 nm, and one reflection peak at 2240 nm.
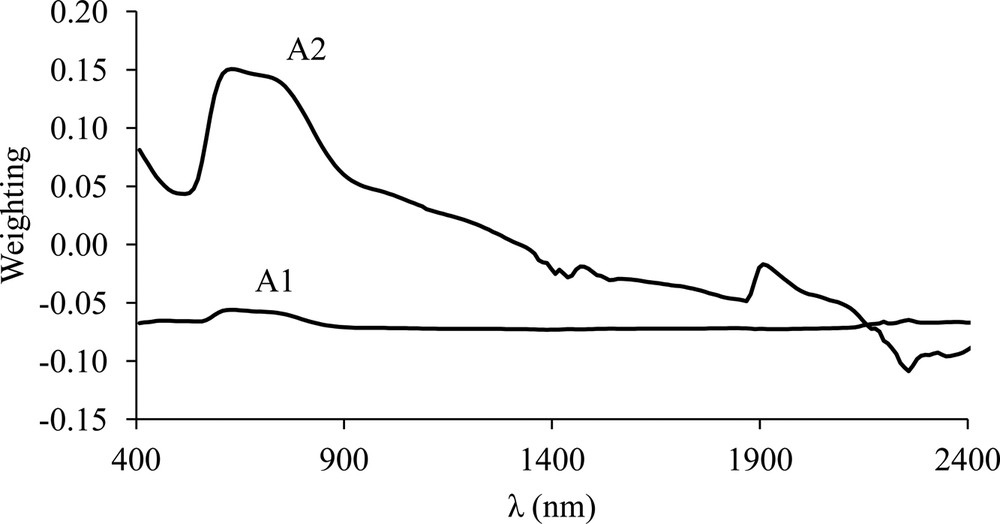
PCA eigenvalues for the first (A1) and second (A2) component derived from the 88 samples of the 11 profiles.
The first two PCA components were plotted against the samples from each plot separately (Fig. 3a and b). The shorter distances between the points, representing the soil layers, indicate greater similarity between the spectra. For plot 2 (Fig. 3b), the albedo (PC1) increased with depth, independently of the soil; for plot 1 this effect was less pronounced (Fig. 3a). In the soil profiles, the samples from the surface showed a drop in the scores along CP2 (Fig. 3a and b) compared to the samples from subsurface layers.

Plot of the first (CP1) and second (CP2) principal component coordinates of the 11 soil profiles. SH: surface horizon; DH: diagnostic horizon, 0.8–1.0 m.
3.3 PCA versus soil properties
CP1 did not show a satisfactory correlation with soil properties (particle size distribution, oxides, mineralogy in general, organic matter or MO/Fe2O3 ratio) (Table S2). However, it did show a positive correlation with the absorption intensity of kaolinite (0.92, P < 0.01) and gibbsite (0.90, P < 0.01), calculated according to the method used by Madeira et al. (1995). The second PCA component was correlated to the MO/Fe2O3 ratio.
The MO/Fe2O3 ratio, and titanium and silica oxide contents showed the highest correlation coefficients with wavelengths of 700 and 2200 nm, represented by CP2 (Figs. 2, 4 and 5). Aluminum oxide showed a higher correlation coefficient at a wavelength of 2238 nm (Fig. 4). This result demonstrates that these regions of the spectrum, represented by the two first PCA components, accounted for 97.5% of the variability of the original data and have the potential to discriminate the soils from these plots.
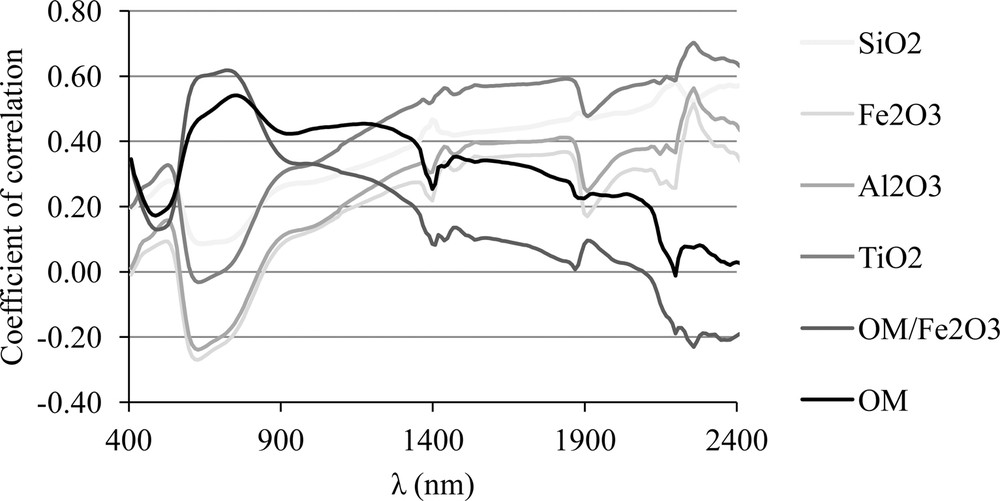
Correlation coefficients between total element contents (g kg−1) and OM/Fe203 mass ratio with the wavelengths from 400 to 2400 nm (n = 89).
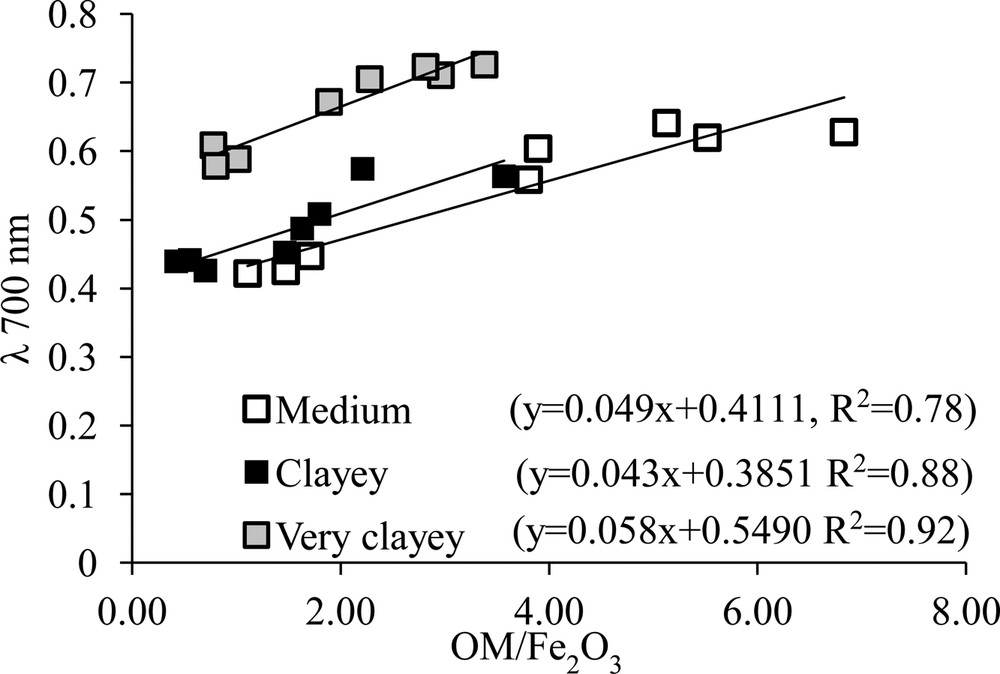
Correlation between absorbance values at 700 nm and the ratio OM/Fe2O3 for the soil profiles samples L1 (clayey), L6 (medium clayey) and L8 (clayey).
The absorption intensities of kaolinite and gibbsite relationships with soil properties (Table S3) were evaluated; a negative correlation (−0.60, P < 0.01) is obtained between the contents of kaolinite and this mineral's absorption intensity. A direct relationship was not observed between contents of gibbsite and its absorption intensity, however, which was negatively affected by clay and aluminum oxide values.
3.4 Discrimination between the soils
Tables S4 and S5 enable a comparison between the spectra at the 700, 2205 and 2265 nm wavelengths. Even though CP2 showed a significant correlation with the MO/Fe2O3 ratio and silica and aluminum oxides, it did not satisfactorily discriminate the different spectral behaviors of the soil profiles, since the same soils showed different spectra and different classes of soil showed similar spectra. Therefore, the L1 and L5 soil profiles showed similar spectra at wavelengths of 700, 2205 and 2265 nm and differed from the other profiles, corresponding to the Acric Red–Yellow Latosol and Dystrophic Red Latosol, respectively (Tables S4 and S5). Red Latosol profiles L5 and L11 presented significantly different spectral behavior for the same wavelengths (Tables S4 and S5). Among the Acric Red–Yellow Latosol profiles for plot 2, the spectra between 2205 and 2265 nm for the L9 profile were similar to the spectra for profiles L6 and L8 and different than those of L7.
4 Discussion
4.1 Pedological environment
The soils studied (Table S1) correspond to the family of Latosols, one of the most common soils occurring in Brazil, and represent 49% of the soils found in the Brazilian Central Plateau (Adámoli et al., 1985). They have a medium to very clayey texture, within the granulometric variability found in the Latosols of the Brazilian Cerrado (Balbino et al., 2002a). Iron levels are lower than those observed by Reatto et al. (2009) in a regional toposequence in the Central Plateau, but are between 50 and 250 g kg−1, characteristic of Brazilian Latosols (Melfi et al., 1979).
4.2 Characterization of spectra
In the Vis spectrum, the 400–550 nm interval is a key for the characterization of soil spectra (Huete and Escadafal, 1991; Palacios-Orueta and Ustin, 1998), allowing differentiation between soils through the levels of iron and organic matter present (Fig. 1). Iron oxides are responsible for an absorption band in this region due to Fe3+ and Fe3+ > O2– charge transfer absorption bands within this wavelength interval (Hunt et al., 1971). The amplitude between 400 and 550 nm occurs because the variations in absorption peaks are proportional to the level of substitution of aluminum for iron in the structure of iron oxides (Liu et al., 2011), and in this study we consider just hematite and goethite, the main iron oxides found in these soils (Ferreira et al., 1999; Fritsch et al., 2005, 2011; Gomes et al., 2004; Reatto et al., 2008).
Small absorption peaks close to 750 nm are associated with quartz structures (Hunt, 1977; Viscarra Rossel et al., 2006b) and, as we mentioned, quartz is the predominant mineral in the sand fraction of the Latosol (Gomes et al., 2004). Therefore, these peaks may represent the variability of sand of the soils studied.
Narrow absorption features close to 1400 nm represented the first overtone of the OH stretching modes associated with water or hydrous minerals (Clark et al., 1990; Viscarra Rossel et al., 2011). Therefore, this may represent the different water contents of the samples, even though we previously standardized their water content, or the kaolinite, due to the first overtone of OH bonds present in this mineral (Hunt, 1977).
Narrow absorption features close to 2200 nm correspond to a combination band involving OH stretching modes and may be due to gibbsite and/or kaolinite (Madeira et al., 1995). Using Vis–NIR spectroscopy, it is difficult to observe a direct relation between the wavelength and the absorption of these minerals, since they present characteristic peaks that are very close to one another (Madeira et al., 1995).
A lot of information was obtained from the spectra, and this approach using component analysis aims to synthesize the relationships between this information and the variability of the soils.
4.3 PCA
PCA allowed for the observation of six points of absorption or reflection, the four points at 700, 1400, 1900 and 2200 nm representing over 95% of the variability in the soils. Using these wavelengths it was observed, through the explanation of the variation of the data, that CP1 represented the main differences between the soil profiles and CP2 represented the more subtle differences. Fig. 3a and b show the capacity of the first two principal components of PCA to discriminate between different soils and regionalizing profiles with similar spectra, as also observed by Galvão et al. (1997, 2001), Tangestane and Moore (2000) and Chang et al. (2001).
The increase in albedo (CP1) with increasing depth is less pronounced in plot 1 due to the homogeneity of its very clayey texture. The organic matter on the surface and the clay fraction in the subsurface contents, with high levels of iron oxides, resulted in a low and homogeneous reflectance for the profiles from this plot, mainly for the L1 and L5 profiles. This increase is more pronounced for plot 2 because the Latosols of this plot have lower contents of clay compared to plot 1, with the exception of L11, and consequently, higher contents of sand, mainly from the fine fraction characterized by quartz (Gomes et al., 2004). Quartz is a transparent mineral that promotes higher reflectance of the samples. Soils with higher levels of sand tend to present higher albedos (Palacios-Orueta and Ustin, 1998) Therefore, the albedos of the profiles from plot 2 increase as the depth increases, due to the combination of a reduction in organic matter levels and the abundant presence of quartz. This result can be observed in Fig. 5, where the soil with a medium clayey texture presented a higher absorbance (Δ = 0.38) at 700 nm, when compared to soils with a clayey texture (Δ = 0.15) and very clayey texture (Δ = 0.16).
The decrease in scores (PC2) with increasing depth signifies that the surface samples have higher absorption at short wavelengths and lower absorption at shorter wavelengths than samples from deeper levels from the same profile (Fig. 5).
4.4 PCA and properties of the soil
In this study, observations were carried out in similar pedogical context, made up mainly of Latosols of different classes and subclasses, in two homogenous plateaus that determine soil local hydric functioning, and under these conditions, wavelengths of 700 nm and between 2200 and 2300 nm were important in the discrimination of these soils.
One explanation for the absence of a correlation between the properties of the soil and the spectra from 1400 to 1900 nm could be that the absorption of these wavelengths by the samples may be strongly influenced by water content. Absorption at 1400 nm is related to the first overtone of the OH stretch vibration of the hydroxyl group in water or in any hydrous phase. The difference between these causes a slight displacement of the peak, which can be very difficult to distinguish in the soil spectra. The 1900 nm wavelength is a combination band involving the stretching and bending modes of the H2O molecule and is thus specific of molecular water (Clark et al., 1990). Therefore, Galvão et al. (2001) excluded these two wavelengths in their study of the reflectance of tropical soils.
Silica and kaolinite contents presented the highest correlation coefficients with CP1. These correlations were not satisfactory, probably because the wavelength interval between 2200–2300 nm is situated between the absorption peaks characteristic of kaolinite and gibbsite. Madeira et al. (1995) observed the overlapping of peaks for these minerals, which made their identification more difficult. After calculating the absorption intensities of kaolinite and gibbsite (Table S2), the coefficients increased considerably and demonstrated that the absorption intensity of these minerals directly or indirectly influenced the overall reflectance of the soil samples.
4.5 Discrimination between the soils
The 700 nm peak characterized the ratio between levels of iron oxide and organic matter, and the 2200–2300 nm interval characterized the absorption intensities of kaolinite and gibbsite. Both were capable of portraying the spatial variability of the different latosols.
However, the similarity in the spectra of different classes of these latosols (profiles L1 and L5), as well as the difference in the spectra of similar latosols (profiles L5 and L11), showed that discrimination between soils in the Vis–NIR region is not just affected by mineral contents, but also by their chemical composition. This is influenced by the position of the soil profile on the slope, since topographical irregularities on the surface determine the hydrology along the toposequence and promote qualitative variability of minerals on a local scale (Macedo and Bryant, 1987; Reatto et al., 2008).
Figueiredo et al. (2006) characterized the iron oxides found in horizon B of three profiles using Mossbauer spectroscopy, and in doing so observed that contents of aluminum in goethite are associated with topographical position, and that the mid-slope profile presented higher contents of aluminum in goethite than profiles from the top and foot of the slope. Camargo et al. (2008) observed that the shape of the terrain also influences crystallographic characteristics of goethite and hematite. Fritsch et al. (2005) by combining Mössbauer spectroscopy, UV-Vis spectroscopy and X-ray diffraction also observed hematite dissolution and formation of Al-rich goethite in the upper levels of latosol profiles from the Amazon basin. These crystallographic characteristics may directly influence the spectral response of the soil, mainly in the visible spectrum, since the absorption characteristics of iron depend on its crystallinity and the isomorphous substitution of aluminum in goethite (Demattê et al., 2003, Madeira, unpublished data). If we consider the ratio MO/Fe and similarity between L1 and L5 at 700 nm, it appears that this ratio provides a better discrimination between soils than the organic matter and iron contents considered separately. This ratio integrated the fluctuations of these constituents at the soil profile scale and their expression on the reflectance features.
Two factors may explain the inverse relationship between the levels of kaolinite present and its absorption intensity (ICt), and also the absence of a relationship between gibbsite contents and its absorption intensity (IGb, Table S3). These two factors are the crystalline order and particle shape of these minerals and the microstructures in which they are involved. Areas receiving higher volumes of water have a higher degree of hydrolysis (Reatto et al., 2008; Tardy, 1993), which can lead to the formation of variously ordered kaolinites with unique absorption and scattering characteristics (White and Roth, 1986).
Spectra are influenced not only by the water content of the sample, but also by the size, shape and roughness of the microaggregate (Guimaraes Santos et al., 2011; Reeves III, 2010; Viscarra Rossel et al., 2009). Latosols can present up to 4 types of microaggregate structure per sample, according to Volland-Tuduri et al. (2005). These structures present significant variations in porosity and size (Balbino et al., 2002b). These microorganizations are in part controlled by soil fauna activities that promote fluctuation in soil porosity (Brossard et al., 2012). The incident energy penetrates ∼2 mm deep into the sample. The external roughness (organization of aggregates and microaggregates) and the internal roughness (porosity associated with mineral combinations in microaggregates) thus have a significant influence on the diffuse reflectance process. Gibbsite peaks interfere with the peaks of the kaolinite, making the determination of both of these components difficult (Madeira et al., 1995; Volland-Tuduri et al., 2005). Therefore, the organization of these minerals inside the microaggregate may partly explain the different spectra produced for just one soil sample. Chang et al. (2001) report how the size and format of an aggregate influences the spectrum it produces, mainly as a function of differing absorption and scattering characteristics. In addition, Wu et al. (2009) observed that the presence of other components and the organization of the principal minerals in the microaggregates caused strong modifications to the spectra of just one single soil sample containing particles of different sizes. It is also worth emphasizing that microaggregates can contain different proportions of quartz (Balbino et al., 2002a, 2002b). This mineral is transparent and causes a higher diffraction of light, allowing it to be deflected towards other features or reflected away from the sample (Clark, 1995). The difference in albedo between the Red Latosols can therefore be partly explained in terms of the proportion of quartz in the microaggregates. At the soil surface, organic matter has low aromaticity and low levels of oxidation and humification (Dick et al., 2005), impeding the formation of crystalline iron (Dixon and Weed, 1989). In deeper soil layers, there is an increase in the proportion of aromatic and phenolic carbon as well as crystalline iron oxides, increasing absorbance at long wavelengths for these layers.
The results presented indicate the need for a more detailed analysis of the relationship between microaggregate structure and sample reflectance when 2 mm sieved samples are analyzed. The capacity of diffuse reflectance Vis–NIR spectroscopy to differentiate between different layers of soil profiles (scores along PC2) and the levels of organic matter and iron oxide present (Galvão et al., 1997) can be explained through the various interactions between these components.
5 Conclusions
Spectral analysis combined with PCA, in particular the first two components, showed that 700 nm and 2200–2300 wavelengths were of interest in discriminating latosols. It was observed that a given class of soil could present different or similar spectral results. It was stressed that the main soil features affecting the spectra were the ratio of organic matter to iron oxides, characterized by a wavelength of 700 nm, and the intensity of absorption of kaolinite and gibbsite observed at 2200–2300 nm. Both were capable of portraying the spatial variability of the different latosols. This method allows the variability of these soils to be integrated based on both the mineral contents and their composition. In addition, we propose that this should be combined with a characterization of microstructural features in order to understand the behavior of spectral responses for these approaches in soil science.
Acknowledgements
We would like to thank CAPES for the overseas sandwich year study grant awarded to the principal author. This research forms part of this author's doctorate thesis.