

1 Introduction
In the absence of direct sampling, the study of Earth's interior is largely based on indirect approaches. The comparison between seismic observations and minerals properties at extreme conditions of pressure and temperature is arguably one of the most successful ways. The accurate determination of physical properties (density, sound speed, etc.) is a longstanding problem in the mineral physics community. At first, Earth's differentiation models argued that iron should be the main constituent of the Earth's core, as the direct consequence of the comparison between chondrites compositions and bulk silicate Earth. This notion was confirmed on the basis of the good match between shock measurements performed on Fe and the seismological profiles of the Earth's core. However, the addition of elements lighter than iron is required to account for the density difference between pure Fe and seismic models. For the liquid outer core, the classically estimated amount is about 10 wt% (Birch, 1964).
The list of potential light elements in the Earth's outer core includes S, Si, O, C, and H (Poirier, 1994). Here we focus on the potential role of S, Si, and O. High volatilities of H and C make them unlikely to incorporate the core at the early stages of the Earth's differentiation. Metal-silicate partitioning experiments under high pressure agree on carbon content in the Earth's core lower than 1 wt% (Dasgupta et al., 2013; Zhang and Yin, 2012). Higher C content in the Earth's core would require unrealistic C contents in the Earth's mantle. Concerning hydrogen, the Earth's internal composition is strongly depleted in volatile elements (McDonough, 2003). It is therefore difficult to introduce large amount of hydrogen in the Earth's core, as the main part of the volatile elements present in the Earth were gained during a late veneer, when the Earth's core was already completely formed (Albarède, 2009). Altogether, taking into account the facts that (i) S is the major light element in planetesimal cores (Chabot, 2004), and (ii) core material has certainly been equilibrated with molten silicates at the bottom of a magma ocean (Siebert et al., 2012), it seems appropriate to consider Si, O and S as the major potential light elements of the Earth's core.
Temperature profile in the Earth's core is controlled by the melting curve of iron alloys under high pressure. Accurate determination of the temperature jump across the Core-Mantle Boundary is required to constrain the heat flow from the core, with strong implications for the geodynamo (Lay et al., 2008) Furthermore, thermochemical flows in the liquid outer core are sustained by the slow crystallization of the inner core. The different forces driving this flow are therefore strongly related with the composition and the partitioning of light elements during inner core crystallization (Aubert et al., 2008). Finally, Earth's core composition is strongly related with its scenario of differentiation and its building blocks (Corgne et al., 2009; Siebert et al., 2013). Determination of light element content from a geophysical point of view should help to understand the geochemical context of Earth's formation.
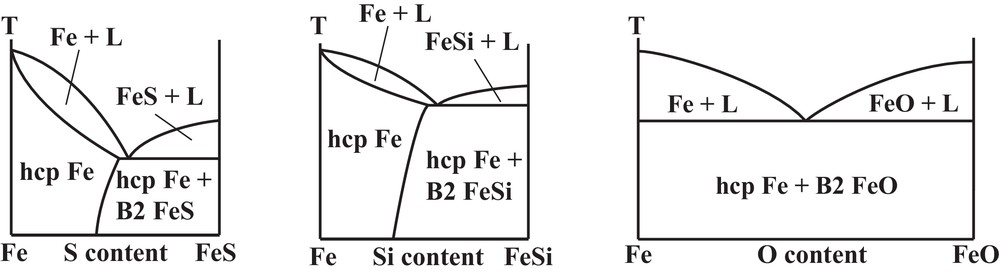
Properties of Fe–X (X = S, Si or O) systems differ very much upon the nature of the light element, as known from ambient pressure metallurgy (Fig. 1; Kubaschewski, 1982). The Fe–FeS system exhibits a simple eutectic system, with strong incompatibility of S in solid Fe, and no intermediate compounds between Fe and FeS. Concerning the Fe–FeSi system, the solubility of Si reaches 10 wt% in bcc Fe (A2 structure). Finally, the Fe–FeO phase diagram presents a large immiscible gap between a metallic Fe-rich liquid and an ionic FeO-rich liquid. However, these phase diagrams drastically evolve at high pressure, especially at the P–T conditions of the inner core boundary (ICB), as the direct consequence of the significant modifications in the physical properties of all solid and liquid phases.
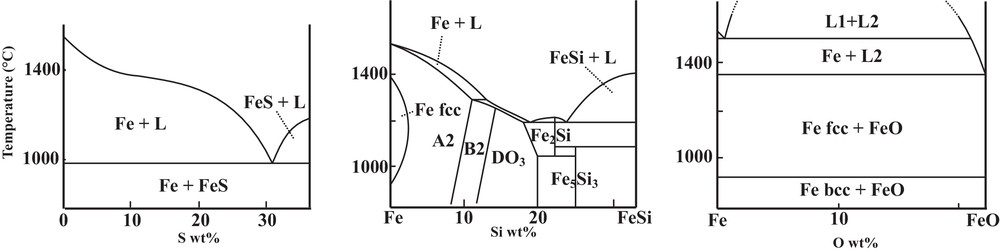
Phase diagrams at ambient pressure on the Fe-rich side of Fe–S, Fe–Si, and Fe–O systems (Kubaschewski, 1982; Meco and Napolitano, 2005).
Different characteristics of phase diagrams control ICB properties (Fig. 2). Defining accurately the different phase diagrams of iron alloys under high pressure thus provides important constraints on the Earth's core composition based on mineral physics arguments. In particular, the temperature at the ICB is directly related to the melting curve of the Fe–X alloys, specifically to the liquidus temperature at 330 GPa, which represents the anchoring point for temperature profiles in the outer and inner core (Fig. 2a). This liquidus temperature is primarily controlled by the melting temperature depression (ΔT = Tm–T, where Tm is the melting temperature of pure iron) associated with the addition of light elements in pure Fe. Furthermore, the density jump between the liquid outer core and the solid inner core is largely due to the compositional difference (ΔX) between solid and liquid Fe alloys in equilibrium with each other at the ICB. Indeed, the volume change in pure Fe at melting cannot account alone for the density difference between inner and outer core Δρ = 0.6–0.9 g·cm−3 obtained by seismology (Cao and Romanowicz, 2004). Therefore, partitioning of light elements between solid and liquid Fe under Earth's inner core conditions largely controls the density jump at the ICB. Finally, the crystallographic structure of the inner core is controlled by the structural effects of the light elements alloyed to solid iron. Seismic observations of the Earth's solid inner core reported peculiar properties, such as elastic anisotropy (Irving and Deuss, 2011), radial (Krasnoshchekov et al., 2005; Wookey and Helffrich, 2008) or hemispherical heterogeneities (Niu and Wen, 2001), whose origin is not fully understood yet. Amongst the proposed explanations, we can mention the speculated presence of fluid inclusions (Singh et al., 2000) and the existence of a convective translation (Alboussière et al., 2010). In all cases, the accurate knowledge on the crystallographic structure of solid iron and iron alloys under Earth's inner core P–T conditions is a necessary requirement for the geodynamic models.
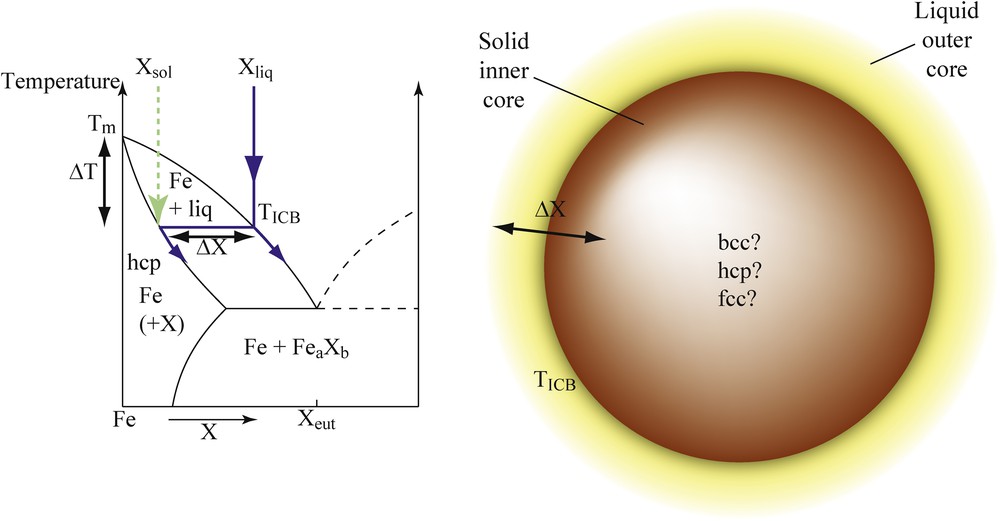
(Color online.) Schematic phase diagram of a hypothetic binary Fe–X system. The parameters having major implications for the properties of the Earth's inner–outer core boundary are the melting temperature depression compared to pure Fe (ΔT), the compositional difference between solid and liquid phases in equilibrium with each other (ΔX), and the crystallographic structure of the solid phase.
2 Melting temperature depression
Determination of melting temperature at high pressure has been a controversial topic for a long time. The appearance of a diffuse signal as a melting criterion (Fig. 3) has been originally proposed to measure the degree of partial melting in iron alloys in experiments performed using large-volume apparatuses (Andrault et al., 2006, 2009). The use of in situ X-ray diffraction has been a major improvement in laser-heated diamond anvil cell (LH-DAC) experimentation as well, as it provides a direct way to assess if the changes in laser absorption by the sample (plateau or changes in the slope of temperature vs. laser power curves) are caused by sample melting or are rather related to other phenomena such as recrystallization (Anzellini et al., 2013) or chemical reaction with the pressure medium or the diamonds (Dewaele et al., 2010). Consensus arises for melting curves for which different methods brought similar results. Concerning melting of pure Fe (Fe is the 0 wt% light element reference for all Fe–X systems), determination by ab initio calculations (Alfè, 2009; Alfè et al., 2002b), shock experiments (Brown and McQueen, 1986; Nguyen and Holmes, 2004) and LH-DAC experiments (Anzellini et al., 2013) are relatively in good agreement, but some other recent studies argue for lower melting temperatures (Jackson et al., 2013). Further efforts are still necessary to clarify inconsistencies amongst these studies and to finally reach a general agreement on the melting curve of pure Fe end-member.
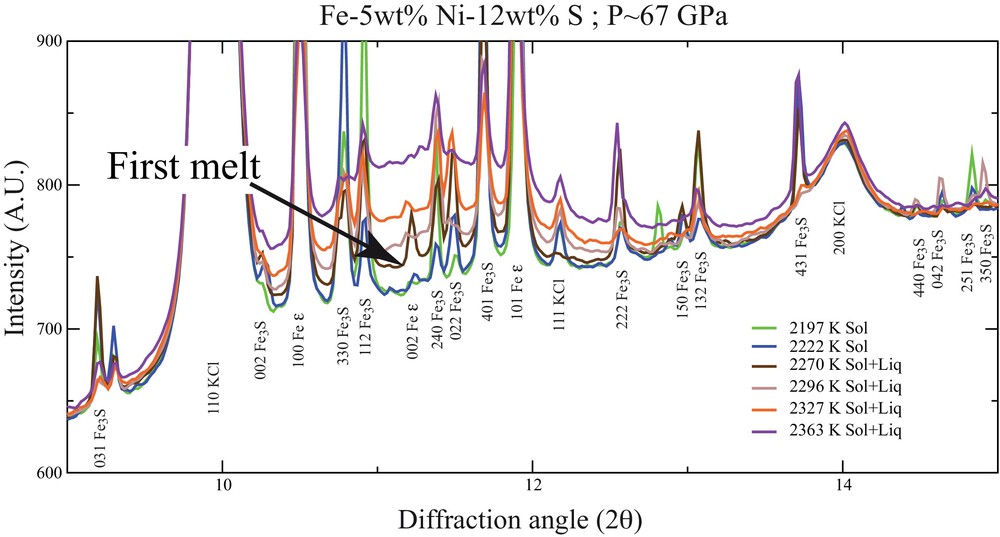
(Color online.) Diffraction patterns recorded at increasing temperatures for a pressure of 67 GPa (λ = 0.3738 Å). The sample of Fe-5 wt%Ni-12 wt% S composition was heated using a laser-heated diamond anvil cell on the high pressure beamline ID27, ESRF (Morard et al., 2011). Appearance of diffuse scattering is a clear signature of the eutectic melting.
In the case of melting curves of iron alloys, as today, the agreement is within ∼150 K for Fe–S (Campbell et al., 2007; Chudinovskikh and Boehler, 2007; Kamada et al., 2010, 2012; Morard et al., 2008, 2011; Stewart et al., 2007) and Fe–Si alloys (Asanuma et al., 2010; Fischer et al., 2012, 2013; Morard et al., 2011) (Fig. 4).

(Color online.) Melting curves of pure Fe (Anzellini et al., 2013) and different iron alloys (Fischer et al., 2012; Morard et al., 2011, 2014b; Seagle et al., 2008) as from linear interpolations of experimental data over the pressure range of individual measurements. Once the chemical compositions of the liquids are known, and assuming a linear dependence of the melting temperature depression with the light elements content up to the eutectic point (Seagle et al., 2008; Kamada et al., 2012), one can estimate the effect of each light element on the Fe melting curve. Values indicated here represent an indication for degrees of the eutectic temperature reduction. The eutectic temperature at CMB pressure is indicated in brackets. Masquer
(Color online.) Melting curves of pure Fe (Anzellini et al., 2013) and different iron alloys (Fischer et al., 2012; Morard et al., 2011, 2014b; Seagle et al., 2008) as from linear interpolations of experimental data over the pressure ... Lire la suite
In the Fe–Si system, measurements based on the change of laser absorption by the sample upon melting (Asanuma et al., 2010) are in really good agreement with different studies using in situ X-rays and based on the appearance of diffuse scattering from the melt (Morard et al., 2011; Fischer et al., 2012). On the contrary, the shape of the phase diagram is still debated. An eutectic behavior with an eutectic point at low Si content (5–10 wt% Si) has been suggested after LH–DAC experiments at 50 GPa (Fischer et al., 2013), in apparent contradiction with multi-anvil experiments performed at 21 GPa (Kuwayama and Hirose, 2004), but this could be potentially explained by a shift of the eutectic point as observed in Fe–FeS or Fe–FeO systems. The monotonic decrease in Fe–Si alloys melting point up to 18 wt% Si reported by another work (Morard et al., 2011) seems as well incompatible with an eutectic liquid with a Si content lower than 10 wt% Si, but the error bar of LH–DAC experiments are such not to allow a firm conclusion on the eutectic behavior in the Fe–FeSi system. Additional experiments are needed to solve this issue.
For the Fe–S system, the melting depression observed at ambient pressure (550 K; Kubaschewski, 1982) strongly increases with increasing pressure up to 14 GPa (around 1200 K (Andrault et al., 2009; Fei et al., 1997; Li et al., 2001), in relation to the appearance of a new intermediate compound Fe3S2 (Fei et al., 1997). Above 14 GPa, the eutectic melting temperature starts rising (Campbell et al., 2007; Chudinovskikh and Boehler, 2007; Morard et al., 2007, 2008; Stewart et al., 2007) with a parallel and strong decrease of S in the liquid eutectic composition, so that the effective result is a larger depression of melting temperature with S inclusion at high pressure. The melting curve proposed by previous work (Kamada et al., 2012; Morard et al., 2011) is overall confirmed by a new value for the Fe–FeS eutectic temperature recently obtained using the experimental protocol detailed in (Morard et al., 2011) (Fig. 4). The sample was solid at 156 (± 10) GPa and 2950 (± 150) K and liquid at 159 (± 10) GPa and 3150 (± 150) K.
In the Fe–FeO system, as the O content in the eutectic liquid is very low under ambient pressure (0.1 wt% O), the eutectic melting temperature is close to the melting point of pure Fe (Fig. 4). But the immiscibility gap observed at ambient conditions (Fig. 1) – and still largely present at 21 GPa (Tsuno et al., 2007) – shrinks with increasing pressure and evolves toward a eutectic-type diagram at 50 GPa (Seagle et al., 2008). Then, as the eutectic O content increases (Seagle et al., 2008), the melting temperature depression is also increasing up to 50 GPa and then seems to stabilize (Fig. 4). However, as the O content in the eutectic liquid continues to increase after 50 GPa (Seagle et al., 2008), the melting depression due to O addition might be smaller as pressure increases.
Still, in spite of these achievements, the pressure range investigated remains limited compared to the 330 GPa at the ICB. Extrapolations to the ICB could be performed using Simon's (Simon and Glatzel, 1929) or Kraut-Kennedy (Kraut and Kennedy, 1966) laws, but the large pressure gap entails large uncertainties. Thus, we prefer to perform our analysis of the role of light elements at 135 GPa, the pressure of the core-mantle boundary. At this pressure, the melting temperature of pure Fe is reported at 4200 K (Anzellini et al., 2013), while the onset of melting is reported at 3050 K, 3650 K and 3750 K in the Fe-FeS (Kamada et al., 2012), Fe–FeO (Morard et al., 2014b), and Fe–Si (Fischer et al., 2012) systems, respectively.
The eutectic compositions at CMB pressure are also required to constrain how each light element affects the melting properties of pure Fe. In some cases, chemical analysis of recovered samples could be performed, as done for the 12 wt% S eutectic composition in the Fe–FeS system at 123 GPa (Kamada et al., 2012). Determining in situ the mineralogical contents and the nature of the phase equilibria can also help constraining the eutectic liquid composition, as was done for the 12 wt% O in the Fe–FeO system (Seagle et al., 2008). Then, for each binary system, linear interpolation between pure Fe and the eutectic liquid can be used to estimate the melting temperature depression in K per wt% of light element: 30 K/% wt Si; 50 K/wt% O; 100 K/wt% S (Fig. 4). These values represent an indication for degrees of the eutectic temperature reduction, approximating the liquidus curve following a linear dependence on the light element content. We note that the impact of the light elements could be different when combined in ternary or quaternary systems. Recently, eutectic melting in the Fe–O–S system was reported at temperatures very close to those of the Fe–FeS eutectic melting (Terasaki et al., 2011). Nevertheless, complete data sets and accurate thermodynamic modeling are very much needed to refine such estimates and ultimately to accurately constrain the melting properties in multi-components Fe–X systems.
3 Shapes of solidus and liquidus curves under Earth's core conditions: implication for partitioning of light elements between solid and liquid
Partitioning of light elements between solid and liquid Fe is a key factor to constrain the Earth's core composition. Indeed, a significant partitioning of the light element in favor of the liquid phase is required during inner core crystallization, so to account for the observed density jump at the ICB. Pioneering ab initio calculations suggested that S and Si have partition coefficients close to 1, while that of O is close to 0, so that oxygen was considered as the main contributor to the density jump at ICB, and the outer core physical properties were modeled after calculations for oxygen rich Fe alloys (Alfè et al., 2002a). A valuable strategy to experimentally constrain the partition coefficients is the analysis of the pressure evolution of Fe–X phase diagrams.
Amongst the light elements, Si is the most soluble in solid Fe at ambient pressure. This, in principle, does not preclude a significant solid–liquid partitioning, simply because the energy cost of the Si insertion in solid Fe can be higher than that for the liquid. As a first approach, we can compare the high solubility in the Fe–Si system with the case of an ideal solution. Using the value of entropy of melting (ΔS) obtained by ab initio study of pure Fe (Luo et al., 2011), and in the approximation of an ideal solution (Lemarchand et al., 1999), the Fe partitioning can be calculated as a function of the melting temperature depression ΔT = Tm–T as follow:
| (1) |
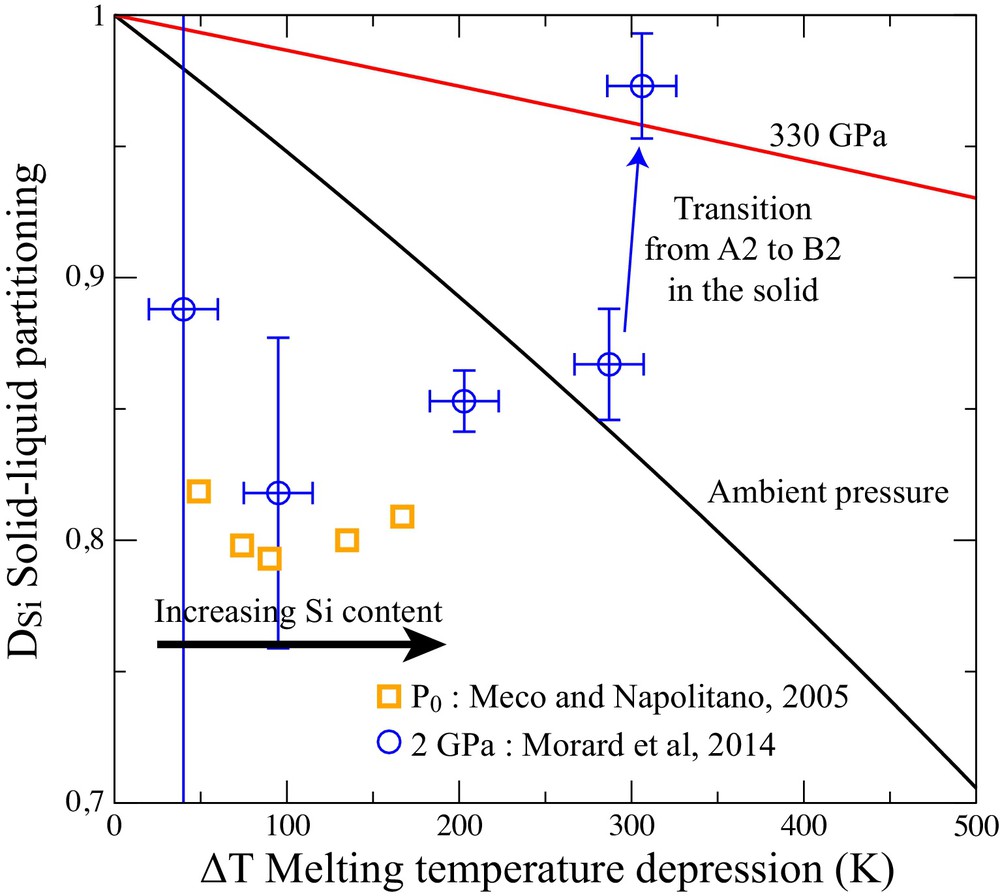
(Color online.) Partitioning of Si between solid and liquid (DSi) at ambient pressure (Meco and Napolitano, 2005) and at 2 GPa (Morard et al., 2014a). The experimental data are compared with an ideal solid solution model (equation 1(1)).
In the Fe–FeS system, the phase diagram changes more drastically with pressure. Compounds with intermediate compositions between Fe and FeS appear with increasing pressure; first Fe3S2 at 15 GPa (Fei et al., 1997), which then decomposes into Fe3S + Fe at 21 GPa (Fei et al., 2000). Appearance of the Fe3S2 phase is correlated with a minimum of the eutectic melting temperature around 15 GPa (Andrault et al., 2009). The phase diagram thus appears quite complex with different intermediate compounds. At even higher pressures, however, Fe3S has been recently observed to decompose into Fe + FeS, with the consequent disappearance of intermediate compounds between Fe and FeS (Ozawa et al., 2013). Furthermore, recent measurements show that the S content in the eutectic composition and the maximum solubility of S in solid Fe (Kamada et al., 2010, 2012) progressively approach with increasing pressure (Fig. 6). Such evolution might thus strongly simplify the Fe–FeS phase diagram under the Earth's inner core conditions (Fig. 6), with a possible solid solution behavior on the Fe-rich side of the phase diagram.
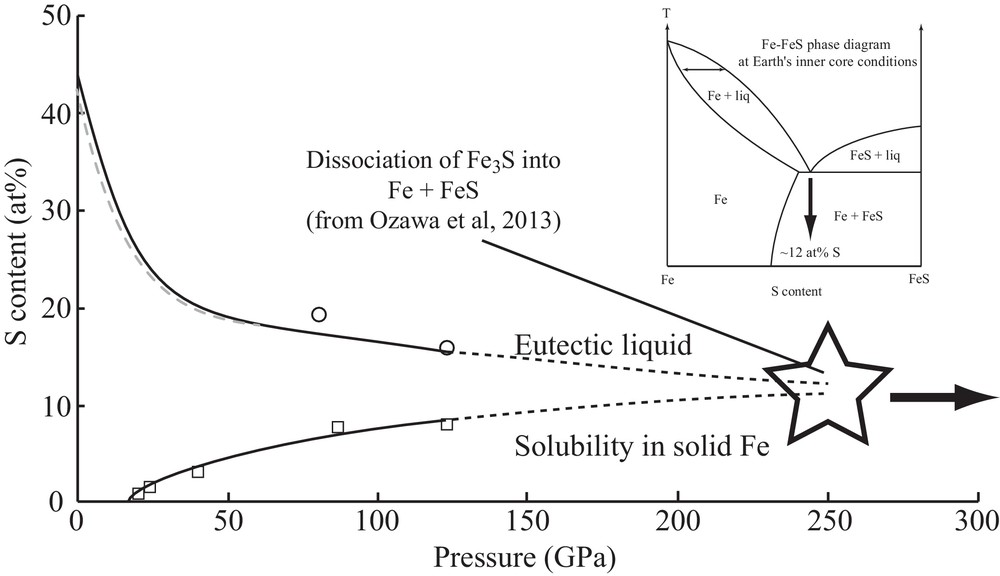
Evolution with pressure of the S solubility in solid Fe, and S-content of the eutectic liquid composition. The blue broken line is a fit (Rivoldini et al., 2011) of eutectic sulfur content up to 60 GPa (Chen et al., 2008; Chudinovskikh and Boehler, 2007; Fei et al., 2002; Li et al., 2001; Morard et al., 2008; Stewart et al., 2007). The open circles represent values of the S eutectic liquid content from (Kamada et al., 2010, 2012). The open squares represent maximal value of S content solubilize in solid Fe as a function of pressure (Kamada et al., 2010, 2012; Li et al., 2001). The star indicates the pressure of Fe3S decomposition into Fe + FeS (Ozawa et al., 2013). In the inset, the possible Fe–FeS phase diagram at the Earth's ICB. Masquer
Evolution with pressure of the S solubility in solid Fe, and S-content of the eutectic liquid composition. The blue broken line is a fit (Rivoldini et al., 2011) of eutectic sulfur content up to 60 GPa (Chen et al., ... Lire la suite
In the Fe–FeO system, the O-solubility in solid Fe remains negligible, even at a pressure of 197 GPa, as indicated by the absence of chemical reaction between solid Fe and FeO at subsolidus temperature conditions (Ozawa et al., 2009). The O-solubility in solid Fe could still potentially increase upon further pressure increase to the 330 GPa of the ICB, or with increasing temperature above the Fe–FeO eutectic melting temperature. Nonetheless, it is likely that the O-solubility remains quite low.
To get further insight into the partitioning properties of iron alloys under the Earth's core conditions, we performed simulations of the liquid structure of Fe–X (X = Si, S, O) mixtures under low-pressure conditions (5 GPa and 2500 K) and under ICB conditions (330 GPa and 6000 K) (Fig. 7). The strategy is to try to constrain macroscopic properties such as the solubility of the light elements based on the knowledge of the structural properties of the liquid phase. The ab initio simulations were performed using the ABINIT code in a similar way as in Bouchet et al. (2013). We used supercells of liquid Fe from our previous work (128 atoms) and replaced 23 Fe atoms by 23 X atoms. The simulations were first performed in the NPT (constant number of atoms, pressure and temperature) ensemble to reach the desired pressure and then in the NVT (constant number of atoms, volume and temperature) ensemble in order to avoid any fluctuations of cell parameters. Once the box of simulated atoms is equilibrated, partial radial distributions for Fe–Fe bonds, Fe–X and X–X bonds were calculated (Fig. 7). Overall, our results are in agreement with previous work performed in the Earth's core conditions for silicon–oxygen–iron mixtures (Pozzo et al., 2013) and Fe–S (Alfè and Gillan, 1998). Si is incorporated in the solid and in the liquid state in substitution to Fe atoms, whereas S and possibly O are incorporated as interstitial impurities under ambient pressure (Lejček et al., 2007). This seems to be still the case for the Fe–Si system under the Earth's core conditions, as Fe–Si and Si–Si bond lengths are very close to Fe–Fe distances (Fig. 7). Even at core conditions, oxygen has the strongest effect on Fe–X bonds with the distance between neighboring iron and oxygen atoms considerably shorter than the iron–iron and oxygen–oxygen distances. This could explain its strong partitioning in favor of the liquid phase with respect to solid Fe. The effect of sulfur on Fe–X bonds is similar at low and high pressure, but S–S bonds are clearly different with a large distance compared to Fe–Fe and Fe–S distances. This indicates a strong S–S repulsion.
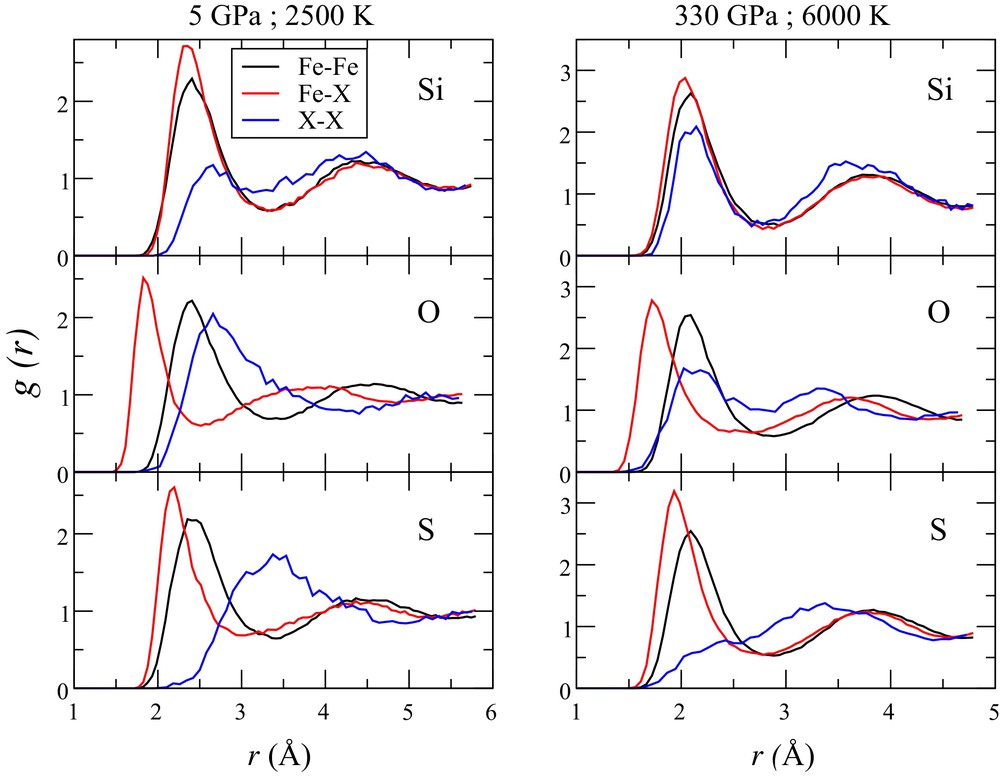
(Color online.) Partial radial distribution for different Fe alloys at 5 GPa and 2500 K (left) and 330 GPa and 6000 K (the Earth's ICB P–T conditions [right]) by ab initio simulations. For each light element (X = Si, O or S), the curves correspond to the Fe–Fe, Fe–X, and X–X atomic distance in the liquid Fe–X alloy.
Difference between Fe–Fe and Fe–X bond distances (Δr) is a good indicator of how much the liquid structure is disturbed by light element alloying. From Fig. 7 we can see that, under the Earth's core conditions, Δr (oxygen) > Δr (sulfur) > Δr (silicon). Even if it is difficult to define how S might partition based on solely this data set, we qualitatively expect an effect intermediate between O and Si.
Taking in account the above-described different partitioning behavior of Si, S and O between liquid and solid, one can try to deduce how they could potentially contribute to the density jump observed at the ICB. The density difference at the interphase between outer core and inner core is usually reported to be 600 kg/m3 (Dziewonski and Anderson, 1981), but could be as high as 900 kg/m3 (Cao and Romanowicz, 2004). It corresponds to a density contrast (Δρ/ρ = (ρs–ρl)/ρs) between 4.7% to 7.1%, assuming an inner core density of ρs = 12,764 kg/m3 (Dziewonski and Anderson, 1981). Freezing of pure iron is expected to account only for ∼2%, a mean value between the estimation of 1.7% (Alfè et al., 2002a) and 2.4% (Luo et al., 2011). As argued in previous paragraph, the role of O, and potentially that of S, could be major, as they can be abundant in the outer core and largely incompatible with the solid Fe found in the inner core. Si could also play a minor role, for a density contrast up to 1%, as from the shape of the Fe–FeSi phase diagram (Morard et al., 2014a) (Fig. 5). Even in the hypothesis that the Fe–S phase diagram might adopt a solid solution behavior under ICB conditions (Fig. 6), the difference between solidus and liquidus could still be large enough, in view of the simulated liquid structural properties (Fig. 7), so to significantly contribute to ICB density contrast. In conclusion, oxygen most likely is the major contributor to the observed density jump, but S and Si should not be neglected. If we assume the highest reported density contrast (900 kg/m3—7.1%), oxygen might be required, whereas S and Si alone, with minor oxygen amount, could explain the lowest contrast (600 kg/m3—4.7%). At the present stage, these statements remain qualitative and density measurements of solid and liquid iron alloys under core conditions (Morard et al., 2013) will help to quantitatively estimate how the different light elements contribute to the density jump at the ICB.
4 Crystallographic structure of pure Fe and iron alloys under the Earth's inner core P–T conditions
A large amount of literature on pure Fe is dedicated to the determination of its crystallographic structure as a function of pressure and temperature. Different stable or metastable structures have been identified by in situ X-ray diffraction [orthorhombic (Andrault et al., 1997), double layer hcp, bcc (Dubrovinsky et al., 2007)]. All the time, the various authors claimed the relevance of the founded phase for the Earth's inner core, even when the required P–T extrapolations were large. In parallel, ab initio calculations have also proposed the stability of various structure under Earth's inner core conditions [bcc (Belonoshko et al., 2003; Vočadlo et al., 2003), fcc (Mikhaylushkin et al., 2007) or hcp (Modak et al., 2007)]. However, the predictive power of ab initio calculations is quite limited, because the differences in the free energy of the various Fe polymorphs are very close to each other (Bouchet et al., 2013). Only quite recently, the structure of pure Fe was experimentally probed up to the P–T conditions of the Earth's inner core, using LH–DAC and in situ X-ray diffraction (Tateno et al., 2010). Under these conditions, hcp-Fe was found to be the stable structure. This result disagrees with the proposition based on ab initio calculations that the bcc structure could be stabilized at high temperature under Earth's core pressure (Vočadlo et al., 2003). More in general, the domain where the bcc structure becomes mechanically stable increases with increasing pressure, especially at the P–T conditions expected for the core of Super-Earths (Bouchet et al., 2013) (Fig. 8). In any case, the free energy of hcp and bcc phases remains very close under ICB P–T conditions (Vočadlo et al., 2008), and the fact that the bcc structure becomes stable under high temperatures does not necessarily mean that the bcc structure is the most stable structure under high pressures and high temperatures. Accurately probing the bcc stability field in the pure Fe phase diagram is a forthcoming challenge for the study of exoplanets’ cores, for which dynamic compression by high-energy lasers will play a major role.
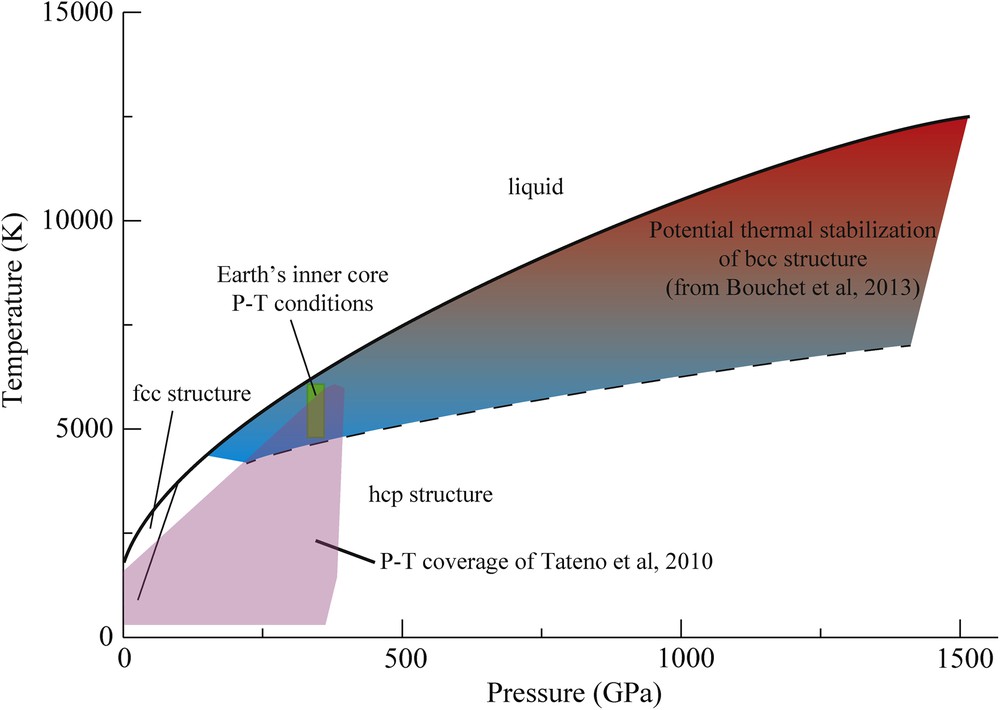
(Color online.) Phase diagram of pure Fe up to 1500 GPa and 15000 K, which correspond to the likely conditions in the Super-Earth's cores (Anzellini et al., 2013; Bouchet et al., 2013). The shaded area indicates the P–T domain over which the thermal stabilization of the bcc structure is expected (Bouchet et al., 2013). We note the higher bcc stability with increasing temperature. P–T conditions of the Earth's inner core (330–365 GPa; 4500–6000 K) are located just on the edge of this zone. Masquer
(Color online.) Phase diagram of pure Fe up to 1500 GPa and 15000 K, which correspond to the likely conditions in the Super-Earth's cores (Anzellini et al., 2013; Bouchet et al., 2013). The shaded area indicates the P–T domain ... Lire la suite
Addition of Si or S to pure Fe could eventually stabilize the bcc structure under the Earth's P–T conditions (Belonoshko et al., 2009; Cote et al., 2008). An experiment reported evidence for bcc-structured Fe–Ni alloy at 225 GPa and 3400 K (Dubrovinsky et al., 2007). However, other experiments performed on Fe–Ni, Fe–Ni–S and Fe–Ni–Si alloys in similar P–T conditions did not reproduce this phase transformation (Sakai et al., 2011, 2012), and pointed to the stability of the hcp phase. The hcp structure provides as well the most simple explanation to other seismological observations of the Earth's inner core, such as its seismic anisotropy, which requires a crystal fabric with a largely anisotropic crystalline structure (Lincot, 2013).
An interesting point worth to be stressed is that all the FeX end-members (FeS, FeSi, and FeO) adopt the same simple structure, the CsCl-like structure (Fischer et al., 2013; Kuwayama et al., 2009; Ozawa et al., 2011; Sata et al., 2008), and that no intermediate compound seems to be present at very high pressures in the binary systems (Fe–FeX). As the properties of binary liquid mixtures are related to the properties of their end-members and to the non-ideality of the solution (Helffrich, 2012), the structural similarity between the different end-members argues for liquid-alike properties.
5 Conclusion
Binary phase diagrams of iron alloyed with light elements such as S, Si or O under ICB conditions are of crucial importance to constrain the composition of the Earth's core and its physical properties. Several issues related to light elements alloying have been here reviewed: the depression of the melting point of pure Fe, solid–liquid partitioning, and crystallographic structure. Based on the recent literature, we can propose potential binary phase diagrams at 330 GPa (Fig. 9). It is likely that Fe–FeSi and Fe–FeS systems could adopt a solid solution behavior on the Fe-rich side of the phase diagram, with disappearance of intermediate compounds such Fe3S. On the contrary, the Fe–FeO phase diagram should behave as a simple eutectic system, without solubility of O in solid Fe.
Proposed phase diagrams for Fe–FeO, Fe–FeSi and Fe–FeS binary systems at 330 GPa, pressure of the ICB.
Acknowledgments
This review paper follows a presentation given during the Inner core anisotropy workshop, October 2013, in Grenoble. The authors would like to thank the organizers, S. Merkel and P. Cardin, for the invitation. The authors would like to thank the two reviewers, Hidenori Terasaki and Rebecca Fischer. Also, the author would like to thank the ID27 beamline staff (M. Mezouar, G. Garbarino, and S. Bauchau) for their help during the LH-DAC experiments. This work was supported by Agence Nationale de la Recherche (ANR) grant No. 2010-JCJC-604-01 and the PlanetLab program of the L’ Agence Nationale de la Recherche (ANR) grant No. ANR-12-BS04-0015-04.