

1 Introduction
Pollutant lead has largely pervaded urban and forested areas owing mostly to its dispersal into the atmosphere from the use of leaded gasoline since the mid-1920s (e.g., Dorr et al., 1990; Friedland et al., 1992; Janssens and Dams, 1975; Négrel et al., 2015; Nriagu, 1990; Nriagu and Pacyna, 1988; Stille et al., 2011, 2012; Von Storch et al., 2003), resulting in a contamination of the whole population (NRC, 1993; Patterson, 1980; Patterson et al., 1991; Smith and Flegal, 1995). This environmental pollution has been monitored in blood where lead concentrations (PbB) have raised until 100 to 1000 times more than the natural uncontaminated levels (Flegal and Smith, 1992; Patterson, 1980; Patterson et al., 1991). Given the short residence time of lead in the blood (less than a month, e.g., Gulson et al., 1994; Rabinowitz et al., 1973, 1976), one would expect PbB to closely mimic lead intake. The phasing out of leaded gasoline (1970s and 1980s in the US and western Europe, respectively) has been closely matched by a decrease in PbB (Annest et al., 1983; Bono et al., 1995; Brody et al., 1994; Ducoffre et al., 1990; Manton, 1985; Schwartz and Pitcher, 1989; Strömberg et al., 1995, 2008, 2014; Thomas et al., 1999; Wietlisbach et al., 1995; Wang et al., 1997), suggesting airborne lead to be a significant source for lead intake. However, this atmospheric contribution was found highly variable in pioneering studies from the 1970s (7 ± 3% to 41 ± 3%) (Colombo et al., 1988; Manton, 1977) when gasoline lead content reached its climax (Nriagu, 1990). Because lead in the blood and the atmosphere have similar residence times, one would expect both reservoirs to mimic the same patterns with time, unless there is another significant lead intake in humans. The extent to which changes in PbB could be related to the fall of lead content in the air could also be assessed using stable lead isotopes and their transient imprints.
Lead has four stable isotopes (masses = 204, 206, 207, and 208), the last three being end-members of the radiogenic U–Th decay chains (Doe, 1970). Because of variations in the initial U–Th content of mineral reservoirs, and the different decay rates of U–Th parent isotopes, crustal material and lead ores display specific lead isotopic ratios. This property has allowed to distinguishing between natural and pollutant Pb sources as well as various industrial and automotive lead sources in blood (Chaudhary-Webb et al., 1998; Glorennec et al., 2010; Gulson, 2008; Gulson et al., 2006; Keinonen, 1992; Kurkjian and Flegal, 2003; Manton, 1973, 1977; Rabinowitz, 1987; Rabinowitz and Wetherill, 1972; Soto-Jimenez and Flegal, 2011; Tsuji et al., 2008; Yaffe et al., 1983). While thousands of PbB values have been determined within the past 40 years, only a few hundreds of lead isotope imprints have been measured from less than 30 published articles. The relative scarceness of lead isotope investigations in the blood as compared to PbB is attributable to analytical difficulties (i.e. the need for chromatographic extraction in dedicated clean laboratories and the use of mass spectrometers, equipped with multi-collection faraday-cups and thermal-ionized or plasma emissions). A review of investigations concerning the use of stable lead isotopes in humans can be found in Gulson (2008).
After the phasing out of leaded gasoline, Gulson et al. (1996) suggested that PbB isotopic imprints for low PbB levels (< 5 μg/dL) could be altered by environmental exposures that were previously hampered by the overwhelming petrol lead intake. More recently, Gulson et al. (2006) suggested that lead from diet intake might have become the main source of PbB. Manton et al. (2005) came to the same conclusion but could not distinguish between household dust and diet sources to explain PbB. Nowadays, while lead in diet is generally of no threat anymore (Bolger et al., 1996; Egan et al., 2002; Manton et al., 2005), some specific diets could constitute significant lead sources (Manton et al., 2005; Ndung’u et al., 2011; Ranking et al., 2005; Rosman et al., 1998; Scelfo and Flegal, 2000). Partial bone mineral resorption may also favour the release of lead from bone tissues to blood depending on gender, age and environmental constraints owing to normal calcium homeostasis, pregnancy, osteoporosis, and could contribute to 10–70% of PbB (e.g., Chamberlain et al., 1978; Gulson, 2008; Gulson and Gillings, 1997; Gulson et al., 1995, 1996; Hernandez-Avila et al., 1998; Keller and Doherty, 1980; Manton, 1985; Manton et al., 2003; Rabinowitz, 1991; Rabinowitz et al., 1973, 1974, 1976; Silbergeld and Watson, 1993; Silbergeld et al., 1988, 1993; Smith et al., 1996; Thompson et al., 1985).
The significant decline of airborne lead sources has raised specific questions regarding:
- (i) the contribution of atmospheric lead (PbA) to PbB in urban areas;
- (ii) the declining trends of airborne lead and PbB in countries where the phasing out of leaded gasoline was initiated at least 15 to 20 years ago;
- (iii) the relative increase of exogenous non-atmospheric and endogenous lead contribution to PbB.
In order to investigate these issues and the relationship between PbA and PbB levels, we have reviewed mean annual PbA values and the corresponding PbB ones for the past 30 to 40 years in countries where tetraethyl lead has been banned from gasoline for at least 15 to 20 years. To supplement this database, we measured PbB and isotopic imprints in 1976–1978 and 2008–2009 in northwestern Europe (Brussels, Vielsalm and Dunkirk, Fig. 1) where urban monitoring stations could provide mean annual PbA since the late 1970s. The area of concern (in France and Belgium) is among the region that exhibits the highest atmospheric particulate matter (PM10 and PM2.5) concentrations in Europe (CAFE, 2005; EMEP, 2011). Thus, for people living in these regions, and especially in urban areas, the ambient air potentially could remain a possible pathway for PbB. The review of combined PbB and isotopic imprints over decades during which lead was banned from gasoline might provide insights into major changes in human lead impregnation.
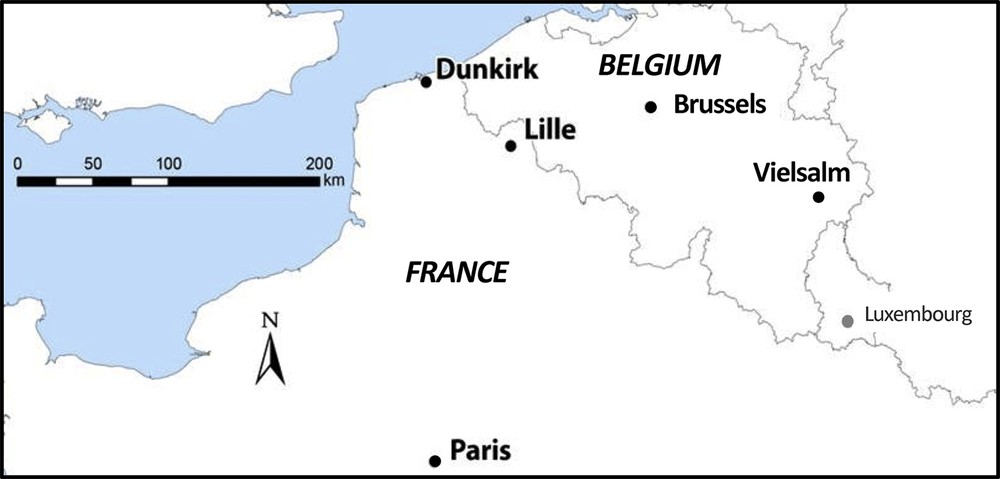
(Color online.) Cities (in bold) where PbA were reviewed and PbB were measured.
2 Material and methods
2.1 Atmospheric and blood reviews
Annual mean PbA values were compiled (Fig. 2) from Lille (ATMO Nord-Pas-de-Calais network), the closest available monitoring station to Dunkirk where blood samples were taken as part of this study, and from Brussels (Bruxelles Environnement–IBGE network). Because mean PbA values were not available prior to the early 1980s in Lille, monitoring stations from Paris (AIRPARIF network) were also reported (Fig. 2). Only urban data were shown to minimize the local variability of PbA due to the dispersion of the pollutants (e.g., Cloquet et al., 2015).
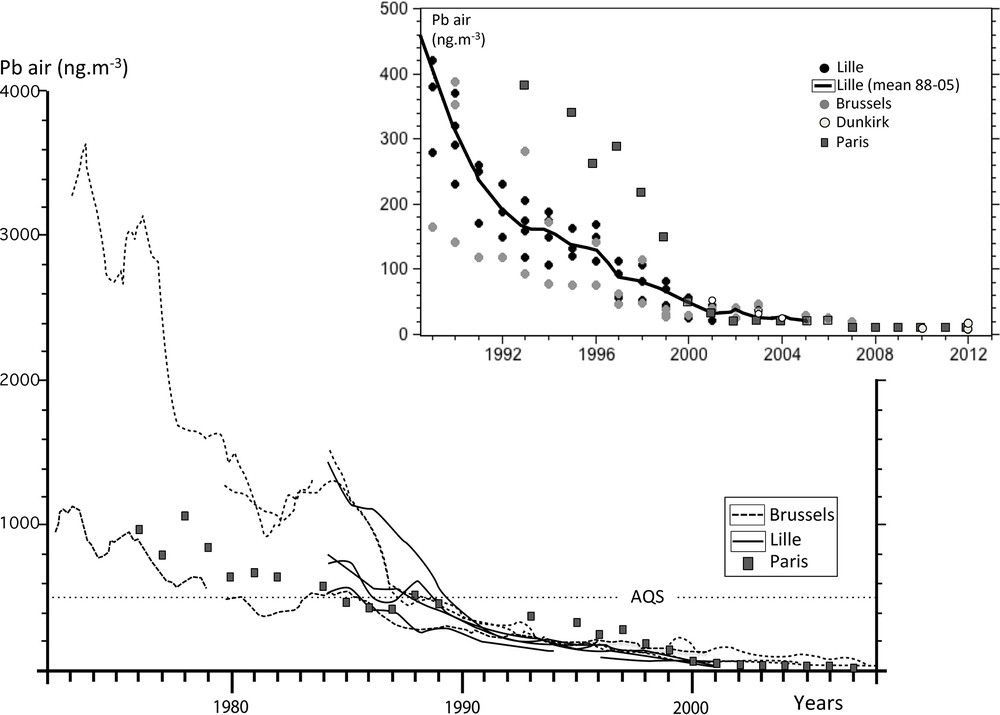
Review of the transient evolution of PbA in Belgium and northern France since the mid-1970s. Inset: a detailed evolution of recent PbA. AQS stands for Atmospheric Quality Standard (see explanation in the text).
Annual mean PbB were chosen from studies conducted in countries where lead had been banned from gasoline for at least 15–20 years (see references in Canfield et al., 2003; Dietrich et al., 1993; Ernhart et al., 1989; Lanphear et al., 2000; Martin et al., 2006; Oulhote et al., 2011; Schroijen et al., 2008; Smolders et al., 2010; Soldin et al., 2003; Tera et al., 1985; Thomas et al., 1999; Tong et al., 1998; Wasserman, 1997; Wietlisbach et al., 1995; Yaffe et al., 1983). Data were gathered regionally from North America, Australasia, northern and western Europe. PbB values determined as part of this study were shown along with this transient compilation (Fig. 3). PbB in children less than 6 months old were not considered (to avoid a contamination by inherited Pb from their in utero life, which would have concealed the environmentally acquired signature).
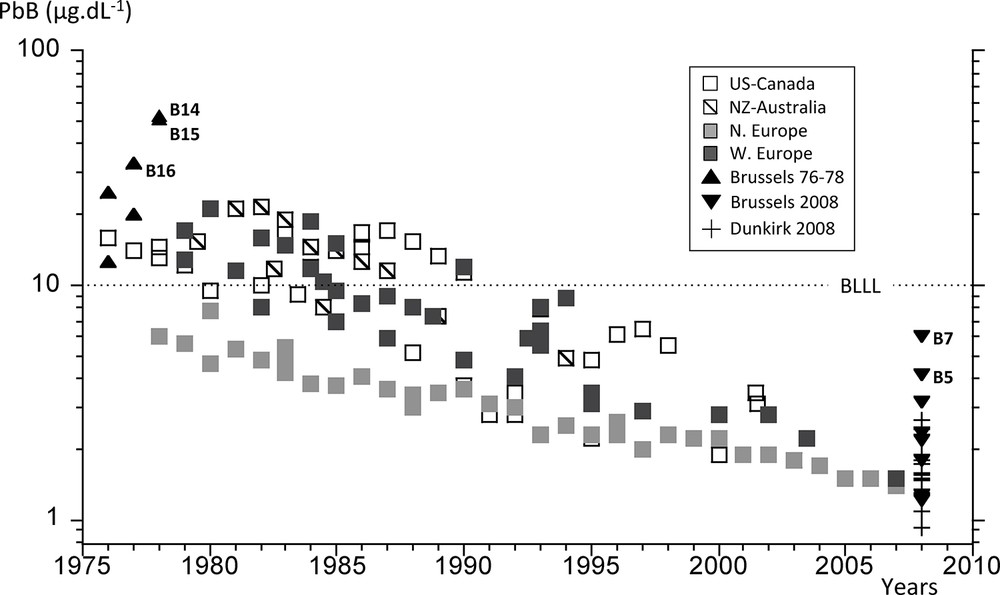
Review of the transient evolution of PbB since the mid-1970s in countries where leaded gasoline was banned. BLLL stands for Blood Lead Level Limit (see explanation in text). Data from this study are shown with filled triangles and crosses.
2.2 Blood analyses
Belgian and French inhabitants (n = 29) were chosen from urban (Brussels, Hoboken-Overpelt, Dunkirk) and rural (Vielsalm) areas in 1976–1978 and 2008–2009 in order to collect blood samples for lead analyses (Table 1). None of the subjects was known as exposed to lead. The individuals declared that they had not travelled during a one-year period before sampling and the adult females had never been pregnant (pregnancy being a cause of specific bone-lead release). The parents of the children who participated in the study were duly informed of the purpose of this work and gave their consent.
Characteristics of the blood collection, PbB, and corresponding lead isotope ratios in Belgium (1976–1978, 2008–2009) and France (2008–2009).
| Sample ref. | Sampling date | Gender | Age (yrs) | PbB (μg·dl-1) | 206Pb/204Pb | 2sd | 206Pb/207Pb | 2sd. | 208Pb/206Pb | 2sd. |
| B9a | June 4th 1976 | M | 36 | 11 | 17.913 | 0.019 | 1.1486 | 0.0005 | 2.1152 | 0.0006 |
| B9b | Aug 4th 1977 | M | 37 | ND | 17.885 | 0.013 | 1.1483 | 0.0004 | 2.1122 | 0.0004 |
| B10 | Nov 29th 1976 | M | 33 | 25 | 17.860 | 0.036 | 1.1471 | 0.0005 | 2.1142 | 0.0010 |
| B11 | Aug 11th 1977 | M | 28 | 20 | 17.938 | 0.015 | 1.1502 | 0.0008 | 2.1149 | 0.0005 |
| B12 | Aug 4th 1977 | M | 28 | ND | 17.894 | 0.022 | 1.1456 | 0.0008 | 2.1154 | 0.0006 |
| B13 | Sept 2nd 1977 | F | 24 | ND | 17.959 | 0.022 | 1.1497 | 0.0005 | 2.1169 | 0.0006 |
| B14 | May 8th 1978 | M | 11 | 51 | 18.161 | 0.026 | 1.1640 | 0.0005 | 2.0941 | 0.0007 |
| B15 | May 8th 1978 | M | 8 | 49 | 18.123 | 0.044 | 1.1629 | 0.0013 | 2.1003 | 0.0014 |
| B16 | Sept 19th 1977 | M | 35 | 33 | 18.137 | 0.044 | 1.1618 | 0.0013 | 2.0986 | 0.0008 |
| B17 | Sept 19th 1977 | M | 36 | ND | 17.936 | 0.085 | 1.1474 | 0.0032 | 2.1089 | 0.0032 |
| B18 | Aug 22nd 1977 | M | 60 | ND | 17.853 | 0.023 | 1.1468 | 0.0009 | 2.1131 | 0.0009 |
| B1 | Aug 9th 2008 | F | 42 | 1.22 | 18.171 | 0.010 | 1.1636 | 0.0001 | 2.0961 | 0.0002 |
| B2 | Aug 9th 2008 | F | 7 | 2.36 | 17.836 | 0.006 | 1.1429 | 0.0001 | 2.1163 | 0.0001 |
| B3 | Aug 9th 2008 | F | 56 | 4.13 | 17.966 | 0.005 | 1.1521 | 0.0001 | 2.1091 | 0.0002 |
| B4 | Sept 2nd 2008 | F | 52 | 2.18 | 17.966 | 0.009 | 1.1517 | 0.0001 | 2.1088 | 0.0002 |
| B5 | Sept 2nd 2008 | M | 55 | 3.18 | 18.078 | 0.006 | 1.1581 | 0.0001 | 2.1027 | 0.0002 |
| B6 | Sept 2nd 2008 | F | 61 | 1.78 | 18.130 | 0.009 | 1.1611 | 0.0001 | 2.0989 | 0.0001 |
| B7 | Sept 2nd 2008 | F | 34 | 6.01 | 18.146 | 0.008 | 1.1618 | 0.0001 | 2.0967 | 0.0002 |
| B8a | Sept 2nd 2008 | M | 60 | 1.20 | 18.083 | 0.007 | 1.1585 | 0.0001 | 2.1014 | 0.0002 |
| B8b | Aug 9th 2008 | M | 60 | 1.27 | 18.096 | 0.006 | 1.1591 | 0.0001 | 2.1005 | 0.0004 |
| F1 | Oct 18th 2008 | F | 5 | 1.58 | 18.164 | 0.014 | 1.1629 | 0.0002 | 2.0956 | 0.0002 |
| F2 | Dec 6th 2008 | M | 36 | 1.74 | 18.080 | 0.009 | 1.1577 | 0.0001 | 2.1041 | 0.0002 |
| F3 | Dec 6th 2008 | M | 8 | 1.46 | 18.145 | 0.009 | 1.1618 | 0.0001 | 2.0962 | 0.0002 |
| F4 | Nov 18th 2008 | F | 38 | 2.65 | 18.183 | 0.010 | 1.1636 | 0.0002 | 2.0983 | 0.0004 |
| F5 | Nov 18th 2008 | M | 35 | 1.51 | 18.070 | 0.008 | 1.1574 | 0.0002 | 2.1038 | 0.0002 |
| F6 | Nov 18th 2008 | M | 49 | 1.88 | 18.037 | 0.035 | 1.1570 | 0.0002 | 2.1021 | 0.0002 |
| F7 | Nov 25th 2008 | F | 21 | 1.55 | 18.133 | 0.007 | 1.1608 | 0.0001 | 2.1029 | 0.0001 |
| F8 | Nov 25th 2008 | M | 24 | 2.43 | 18.120 | 0.008 | 1.1603 | 0.0001 | 2.1041 | 0.0002 |
| F9 | Nov 26th 2008 | F | 17 | 1.08 | 18.161 | 0.006 | 1.1626 | 0.0001 | 2.0972 | 0.0004 |
| F10a | Nov 26th 2008 | M | 49 | 1.90 | 18.033 | 0.017 | 1.1561 | 0.0001 | 2.1030 | 0.0002 |
| F10b | Jan 10th 2009 | M | 49 | 1.80 | 18.063 | 0.009 | 1.1571 | 0.0001 | 2.1022 | 0.0002 |
| F11 | Jan 10th 2009 | F | 4 | 0.93 | 18.229 | 0.022 | 1.1665 | 0.0001 | 2.0925 | 0.0002 |
Venous whole blood samples (2.5 to 10 mL) were drawn into low Pb Vacutainers™ tubes containing heparin or EDTA as an anticoagulant. The samples were stored at –80 °C until analysis. Distilled concentrated acids (HNO3, HCl, HClO4 Merck™ Suprapur© grade) were added to blood aliquots and heated several hours on a hot plate to ensure organic matter oxidation. After evaporation, all samples were purified on an anionic resin (AG1-X8) using HBr 0.5 N and HCl 6 N (Manhès et al., 1978). For the 1976–1978 samples, lead concentrations and isotope ratios (Table 1) were measured through thermal ionization mass spectrometry on Thomson TSN 2065 and Varian MAT TH5 mass spectrometers at the Geochemistry and Cosmochemistry Laboratory (Institut de physique du globe, Paris) and at the Belgian Centre for Geochronology (Université libre de Bruxelles), respectively. Lead concentrations and isotope ratios of the 2008–2009 samples (Table 1) were analyzed by Multi Collector-Inductively Coupled Plasma Mass Spectrometry (MC-ICPMS, Micromass IsoProbe) at Geotop (Université du Québec à Montréal, Canada). Calibration and mass fractionation were corrected with concurrent analyses of thallium and the SRM981 NIST standard. The standard deviation of the 206Pb/207Pb and 208Pb/206Pb ratios was less than 0.02%. Total blanks, including chemistry and Vacutainers™ tubes (100–200 pg), accounted for less than 2% of the total analyzed lead for each blood sample. Metabolic effects that could affect analysis reproducibility were tested on a short (F10 and B8 were sampled twice within two months) and long (B9a and B9b were sampled a year apart in 1977 and 1978) time scale. Results presented in Table 1 showed no significant effect on isotopic ratios (less than 0.1%), and 5% differences for PbB, within the expected uncertainty of the analytical procedures. The accuracy of isotopic dilution analyses was controlled with a NIST standard of caprine blood (SRM955®) at level 2 (13.70 ± 0.14 μg/dL) and 4 (45.47 ± 0.45 μg/dL). Our results (13.95 ± 0.08 μg/dL and 45.53 ± 0.27 μg/dL for levels 2 and 4, respectively) were within 2% of the certified SRM955 values. Assuming these calibrations and blank contribution, PbB uncertainties were less than 5%.
3 Results and discussion
3.1 Review of atmospheric lead concentrations in urban air
We have examined the temporal transient evolution of lead concentrations in aerosols (PbA) from urban districts in northern France and Belgium (Fig. 2), as near as possible to the area of blood collection in 1976–1978 and 2008–2009 (i.e. Dunkirk, the Greater Brussels and Vielsalm). We chose to report annual means from several monitored stations in the Greater Brussels (Bruxelles Environnement–IBGE, 2009; Thiessen et al., 1986) and in Lille (Anquez, 2008; Caron et al., 2003; Thomas et al., 1993), the closest monitored site to Dunkirk where atmospheric data were available for recent years only (Alleman et al., 2010; ATMO, 2010; Ledoux et al., 2009; Mbengue et al., 2014). Because Lille sites were not operational before 1984, we also reported mean lead concentrations from monitored sites located in Paris (AIRPARIF, 2013; Person et al., 1993). As already seen in various countries (i.e. Thomas et al., 1999), lead content in urban aerosols from northwestern Europe has unmistakably declined for the past 40 years. PbA from one central site in Brussels was at its highest in the 1970s, reaching 3000 ng/m3 in 1976 (Fig. 2). Concentrations sharply decreased at this station to reach 1700 ng/m3 in 1978. In comparison, Paris PbA were between 800 and 1100 ng/m3 for the same period. These were close to PbA measured in another Brussels urban site (600 to 900 ng/m3) in 1976–1978 (Fig. 2). It should be noted that PbA generally remained above 500 ng/m3, the European standard annual mean PbA (AQS for Atmospheric Quality Standard in Fig. 2) that should not be exceeded, until the early 1990s. PbA in recent years showed annual concentrations as low as 10 ng/m3 (see inset in Fig. 2) at all locations. Using a significant correlation (R2 > 0.7) between mean lead concentrations in gasoline and air in the late 1970s and early 1980s, Thomas et al. (1999) inferred a geometric mean PbA of 250 ng/m3 in cities with zero gasoline lead. The difference by a factor of 10 to 20 between our reviews of measured PbA in the present-day lead-free gasoline urban atmosphere and Thomas et al.’s estimate may be caused by a decline of industrial lead emissions. To reach the actual PbA of 10 ng/m3, this industrial decline should have reached 96% since the 1980s. Based on the European Environment Agency report (EEA, 2012) and Pacyna and Pacyna (2001) data on pollutant lead emissions in Europe, we calculated that industrial lead discharge (from non-ferrous metallurgy and iron-steel production) in the atmosphere had decreased by 94% since 1975 (from 27229 to 1600 tons). Thomas et al. (1999) could not take into account this decrease that explains the further decline of PbA in urban atmosphere. This multimedia source of pollutant lead was already emphasized by Harrison and Whelan (2000) when discussing Thomas et al. (1999) assumptions. On the basis of our review, PbA have decreased by a factor 100–300 in 30 years, between the 1970s and 2000s in northwestern Europe. How does this decline compare to that of PbB?
3.2 Review of lead content in blood
As seen previously, the phasing out of leaded gasoline has often been designated as the main cause for the reduction of PbB. Because the decline of industrial lead emissions also played a significant role in the diminution of PbA, it is necessary to investigate the role of both industrial and automotive lead emission decline on the diminution of PbB owing to the longer time elapsed since the initiating of the phasing out of leaded gasoline, particularly in North America and Europe. Annual mean PbB from lead-free gasoline countries were reported in Fig. 3. First of all it should be noted that one must wait the early 1990s to discern the mean PbB below 10 μg/dL, the standard Blood Lead Level Limit (BLLL in Fig. 3) for lead poisoning, first established by the Center for Decease Control and Prevention in 1991 and then the European Community in 1993. While it is considered as an upper limit for safe PbB, it is more than 500 times larger than 0.016 μg/dL, the uncontaminated PbB value estimated by Flegal and Smith (1992, 1995), Patterson et al. (1991) and Smith and Flegal (1992). Nowadays, PbB as low as 1 μg/dL are considered poisonous, particularly for children, due to adverse irreversible neurodevelopmental effects (Canfield et al., 2003; Ernhart et al., 1989; Grandjean, 2010; Jusko et al., 2008; Lanphear et al., 2000, 2005; Mendelsohn et al., 1998; Needleman and Landrigan, 2004; Tong et al., 1998). In our compilation, PbB significantly declined from 10–20 μg/dL in the late 1970s to 1.5–3.5 μg/dL in the years 2000s, a decrease by 3 to 6 times (Fig. 3) as expected from previous results during the phasing out of leaded gasoline (i.e. Thomas et al., 1999). While single snapshot analyses are not expected to be similar to annual means, most of our PbB reasonably fitted the overall PbB transient pattern, with the exception of a few measurements (B14, B15, B16 and B5, B7) that shall be discussed on the basis of lead isotope systematics. When compared to PbA decline (100 to 300), we observed that the amount of lead in blood had decreased by 20 to 100 times less than that in the air during the past 30 years. This discrepancy suggests that another lead intake besides PbA was responsible for keeping contemporary PbB at least 100 times higher than “non-contaminated” levels. If the same rate of decline as that of PbA was applied to PbB, then the blood lead content would be below 0.2 μg/dL (and as low as 0.03 μg/dL), only 2 to 10 times more than the pristine PbB value of 0.016 μg/dL. The remaining lead intake to the general population could possibly be diet lead, of which the origin is difficult to determine (Flegal et al., 1990; Gulson et al., 2006; Manton et al., 2005). The remobilization of petrol lead accumulated in near-road surface soils might also contribute to PbB, even years after lead was removed from the gasoline (Cloquet et al., 2015; Kurkjian and Flegal, 2003), although one would expect this latter source to lessen the PbA decreasing trend. The discrepancy between PbB and PbA decline rates and the singularity of some of the single PbB values that we measured in 1976–1978 and 2008–2009 might be further investigated using lead isotope ratios in the blood (PbB-IR).
3.3 Lead isotope systematics
3.3.1 PbB and isotopic imprints in 1976–1978
The PbB ratios and the corresponding 206Pb/207Pb ones (PbB-IR) measured for the 1976–1978 period in the Greater Brussels and Vielsalm population are presented in Table 1. PbB ranges from 11 to 51 μg/dL with three PbB values (B14, B15, B16) that exceed the mean annual range from North America, the only available continuous record at that time (Fig. 3). PbB data were scarce in Europe during the 1970s and generally varied between 17 and 30 μg/dL (Boudène et al., 1974; Colombo et al., 1988; Ducoffre et al., 1990). Considering these results, we could reasonably assume that B14, B15 and, to a lesser extent, B16 reflected a higher than usual Pb impregnation.
The mean PbB-IR of Brussels blood samples (= 1.148 ± 0.002) was significantly different from that of Hoboken, B14 and B15 (= 1.1640 and 1.1629, respectively) and Vielsalm, B16 (= 1.1618) (P < 0.0001 Student t-test). The two remaining Vielsalm samples (B17, B18) were similar to the mean Brussels 206Pb/207Pb imprint (P > 0.2, Student t-test). These PbB-IR values could be compared to source signatures representative of airborne lead from Belgium in the late 1970s (i.e. automotive lead in the Brussels area, lead refinery at Hoboken-Overpelt, and natural lead from a deep uncontaminated peat bog, De Vleeschouwer et al., 2007) in a 206Pb/207Pb vs. 208Pb/206Pb plot (Fig. 4). Blood isotopic imprints were distributed between the anthropic and natural end-members, with most of them (all of the Brussels and two Vielsalm samples with a mean 206Pb/207Pb = 1.148 ± 0.002, Table 2) being close to the automotive source signature (mean 206Pb/207Pb = 1.129 ± 0.007, Table 2) (Fig. 4). Meanwhile both isotopic fields remained significantly different (P < 0.0001, Student t-test) owing to the intake of other more radiogenic (i.e. higher 206Pb/207Pb ratios) contaminant lead from diet and/or industrial sources. The three elevated PbB with peculiar PbB-IR (Table 1) were clearly detached from the automotive source, and were closer to the isotopic imprint of the Hoboken lead smelter (mean 206Pb/207Pb = 1.181 ± 0.003, Table 2). At the time, B14 and B15 were schoolgirls aged 11 and 8 who lived in the vicinity of this smelter. B16 lived in a remote area, far from Hoboken, at Vielsalm, and therefore could not be directly affected by this smelter. Further analyses showed elevated lead content in Vielsalm tap water (140 ppb, 14 times higher than the actual safe baseline of 10 ppb) due to lead pipes and acidic water that prevented the deposition of calcium carbonate minerals on the lead's surface, and therefore promoted lead leaching from the pipe into the water. Both isotopic imprints of Vielsalm tap water and B16 were consistent (Fig. 4) and strongly suggested that water was the specific source for lead intake in this case. It should be noted that a rain sample collected in Vielsalm in November 1975 displayed a 206Pb/207Pb ratio of 1.1326, which was not significantly different from our mean automotive imprint (206Pb/207Pb = 1.129 ± 0.007, Table 2) (P = 0.2, Student t-test).
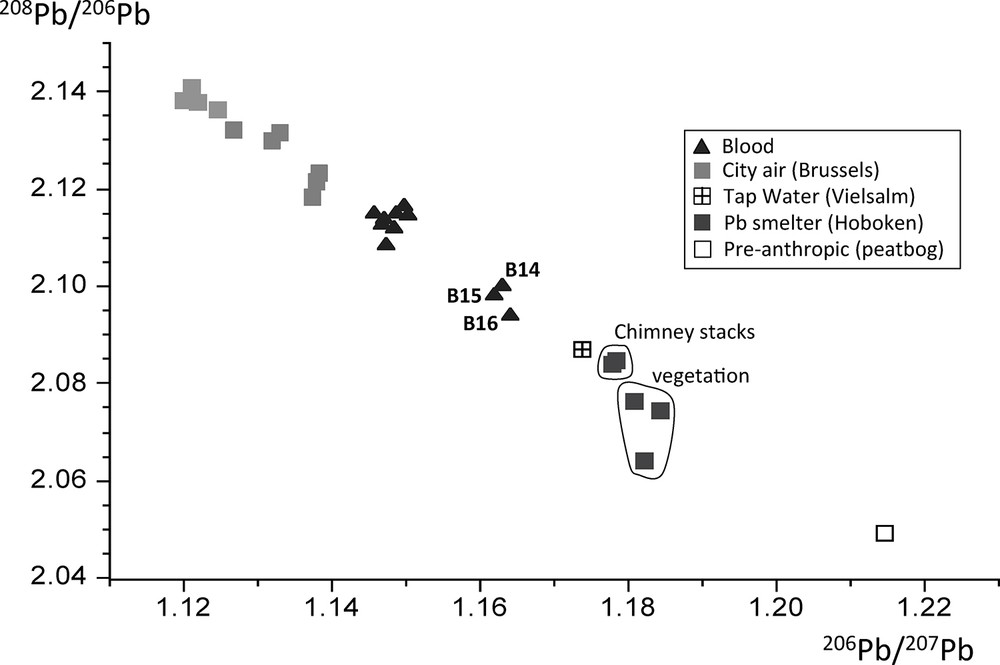
Three lead isotope plots with blood imprints (this study) and corresponding airborne sources in Belgium in the mid-1970s (from Table 2).
Lead isotope ratios from atmospheric pollutant lead sources in Belgium (1974–1977).
| Sample reference | Sampling date | Location | Type | 206Pb/204Pb | 2sd. | 206Pb/207Pb | 2sd. | 208Pb/206Pb | 2sd. |
| BR-AE1 | May 1974 | Brussels, Schuman tunnel | Aerosol | 17.568 | 0.003 | 1.1270 | 0.0001 | 2.1320 | 0.0002 |
| BR-AE2 | June 1974 | Brussels, Schuman tunnel | Aerosol | 17.621 | 0.002 | 1.1330 | 0.0001 | 2.1220 | 0.0002 |
| BR-AE3 | Nov 1974 | Brussels, Schuman tunnel | Aerosol | 17.720 | 0.004 | 1.1380 | 0.0001 | 2.1180 | 0.0002 |
| BR-AE4 | Dec 1974 | Brussels, Rogier tunnel | Aerosol | 17.765 | 0.004 | 1.1380 | 0.0001 | 2.1230 | 0.0002 |
| BR-AE5 | May 1976 | Brussels downtown | Aerosol | 17.429 | 0.015 | 1.1219 | 0.0008 | 2.1376 | 0.0009 |
| BR-AE6 | Oct 1976 | Brussels downtown | Aerosol | 17.506 | 0.020 | 1.1246 | 0.0009 | 2.1362 | 0.0009 |
| BR-AE7 | Aug 1977 | Brussels downtown | Aerosol | 17.486 | 0.015 | 1.1210 | 0.0010 | 2.1407 | 0.0009 |
| BR-VE1 | Nov 1974 | Brussels-Namur highway | Herbs | 17.756 | 0.032 | 1.1381 | 0.0009 | 2.1212 | 0.0010 |
| BR-VE2 | April 1974 | Brussels-Namur highway | Herbs | 17.662 | 0.030 | 1.1327 | 0.0008 | 2.1304 | 0.0009 |
| BR-VE3 | Sept 1977 | Brussels downtown | Herbs | 17.417 | 0.044 | 1.1199 | 0.0011 | 2.1382 | 0.0010 |
| HO-AE1 | June 1974 | Hoboken lead smelter | Dust | 18.424 | 0.003 | 1.1779 | 0.0001 | 2.0841 | 0.0002 |
| HO-AE2 | June 1974 | Hoboken lead smelter | Dust | 18.444 | 0.006 | 1.1784 | 0.0001 | 2.0849 | 0.0002 |
| HO-VE1 | Jan 1974 | Hoboken lead smelter | Herbs | 18.523 | 0.032 | 1.1821 | 0.0009 | 2.0642 | 0.0010 |
| HO-VE2 | Jan 1974 | Hoboken lead smelter | Herbs | 18.448 | 0.028 | 1.1808 | 0.0008 | 2.0764 | 0.0009 |
| HO-VE3 | Jan 1974 | Hoboken lead smelter | Herbs | 18.582 | 0.030 | 1.1843 | 0.0010 | 2.0744 | 0.0011 |
3.3.2 PbB and isotopic imprints in 2008–2009
Mean PbB from France and Belgium in 2008–2009 (1.17 ± 0.49 and 2.59 ± 1.61 μg/dL) were not significantly different (P = 0.15, Student t-test). Even if our database is limited, the overall (France and Belgium) mean PbB in 2008–2009 (2.09 ± 1.17 μg/dL) fell within the range of Smolders et al.’s (2010) mean values of 2.87 μg/dL and 1.82–3.69 μg/dL measured in France (more than 3000 data) and Belgium (more than 1500 data), respectively. Our results were also consistent with PbB (= 2.2 μg/dL) obtained by Schroijen et al. (2008) from 1600 adolescents in northern Belgium (2003–2004). The recent mean Belgium PbB was 5–10 times lower than that measured in 1976–1978, in good agreement with the 3–6 decline rate determined from the mean reviewed PbB (Fig. 3). In spite of this decline, the mean 2008–2009 PbB remained 179 times higher than the estimated natural PbB (0.016 μg/dL). One of the recent Belgium PbB (B7 = 6.01 μg/dL) was significantly more elevated than the mean reviewed PbB, generally comprised between 1.5 and 3.5 μg/dL (Fig. 3, Table 1). Meanwhile, B7 PbB-IR (1.1618) did not significantly diverge from the mean PbB-IR measured in Belgian subjects (1.157 ± 0.006) during the same period (Table 1) (P = 0.04, Student t-test). This similarity was even more pronounced (P > 0.05) if we excluded B2 that displayed a PbB-IR value (1.1429, Table 1) that was significantly different from the mean Belgian blood isotopic imprint (P = 0.0002, student t-test). Further investigations would be needed to investigate the causes of the elevated PbB values and of the peculiar isotopic imprint of B7 and B2, respectively. These two samples were not considered when studying relationships between recent PbB and PbB-IR in France and Belgium.
The mean 2008–2009 PbB-IR values in France and Belgium were almost perfectly similar (206Pb/207Pb = 1.160 ± 0.003 and 1.159 ± 0.004, respectively). These imprints were within the range of recent PbB-IR measured from 125 children in France (1.15–1.17) (Oulhote et al., 2011). They were significantly more radiogenic (P < 0.0001, Student t-test) than the mean Belgium 1976–1978 PbB-IR values (1.148 ± 0.002). This was expected from the decline of the less radiogenic lead emission from automotive exhaust. Indeed, lead isotopic imprints from northwestern France cities (Amiens, Calais, Douai, Lille, Paris, and Wimereux) reveal a significant radiogenic trend since the 1980s (Fig. 5b) with 206Pb/207Pb ratios that shifted from 1.10–1.11 in 1982–1983 to 1.14–1.16 in 2004 (Bollhöfer and Rosman, 2001; Deboudt et al., 1999; Flament et al., 2002; Franssens et al., 2004; Monna et al., 1997; Véron et al., 1999; Widory, 2006; Widory et al., 2004). Recent PbB-IR values that we have measured in France and Belgium (1.160 and 1.159, respectively) are within the upper range of the urban isotopic imprint (Fig. 5). Nowadays, both atmospheric sources are at their lowest measured levels in urban atmosphere, and yet the isotopic imprints suggested that it might significantly influence PbB. Here, we could not conclude, based solely on isotopes, on the relative contribution of diet versus atmospheric lead intake to explain today's PbB, although a clear trend between PbB-IR in 1976–1978 and 2008–2009 could be evidenced, likely owing to changes in lead source intake.
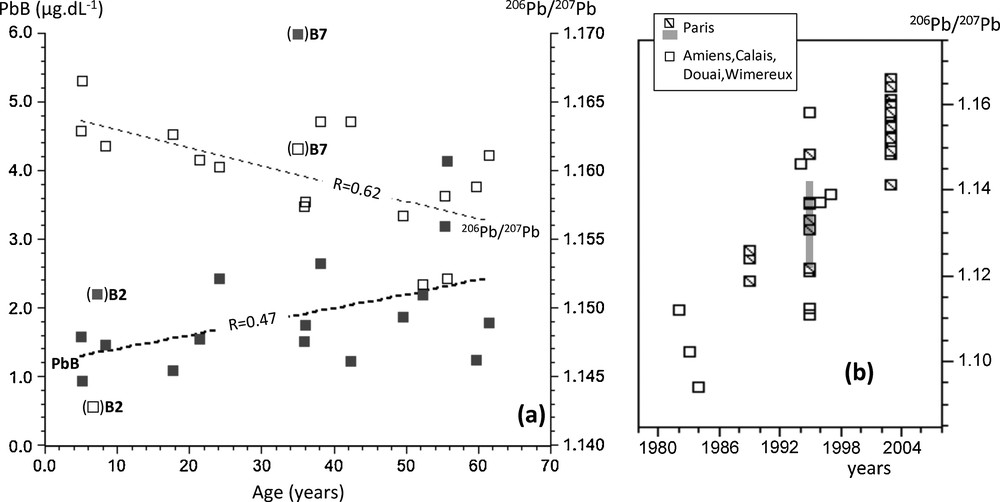
a: changes of PbB (close squares) and corresponding 206Pb/207Pb ratios (open squares) in the blood with the age of the subjects at the time of sampling (France and Belgium, 2008–2009). Bracketed samples are not taken into account to determine the correlation coefficients (see explanation in the text); b: lead isotopic trend with time in urban air from northwestern French cities (see references in the text). The gray band shows the range of 206Pb/207Pb ratios reported by Bollhöfer and Rosman (2001) for the aerosols collected in Paris.
Our recent PbB and the corresponding PbB-IR data were well distributed and correlated with the age of the subjects (correlation coefficients of 0.47 and 0.62 for PbB and PbB-IRn, respectively) when excluding samples B2 and B7 (Fig. 5a). Considering a first-order linear fit [PbB = 1.196 + 0.020·(age)], we calculated a mean PbB increase from 1.2 μg/dL to 2.4 μg/dL between age 0 and 60. The variability of measured PbB also clearly increased with age (after 50, PbB varied from 1.3 to 4.1 μg/dL, Table 1). Because of the lead residence time of one month in the blood, we would have expected all blood samples collected within the same area and during the same period to exhibit similar PbB-IR, besides specific contamination. PbB increase also was associated with a significant shift of isotopic imprints (Fig. 5a) with calculated PbB-IR values that decreased from 1.164 to 1.156 between age 0 and 60, with a first-order linear fit [PbB-IR = 1.164–0.0001·(age)]. This isotopic divergence with age would be consistent with the release of older less radiogenic atmospheric lead (Fig. 5b) stored in bone tissues that are known to continuously contribute to PbB, especially during childhood as part of the regulation of calcium influx and for elderlies due to lead release from bone resorption. These correlations likely arose from the mixture of the release of endogenous lead along with contemporary exogenous lead intake. Because of the overwhelming exogenous intake in the 1970s–1980s, the endogenous contribution could only be clearly identified in child-bearing women and newborns due to the extra mobilization of lead from maternal skeleton and its partial transplacental transfer during pregnancy and lactation (Gulson, 2008; Gulson et al., 1995, 1999, 2004; Keller and Doherty, 1980; Manton, 1985; Manton et al., 2003; Silbergeld et al., 1988). We assume that with the contemporary unprecedented atmospheric lead decline in urban atmosphere, and a better control of dietary lead intake, the contribution of the skeleton to PbB might become a dominant source, most particularly for pregnant women, children and elderlies owing to higher lead absorption rates, rapid bones turnover, and osteoporosis.
4 Conclusions
Our review of lead content in blood and air confirmed the general declining trend in both reservoirs. We showed that today's PbA as low as 10 ng/m3 resulted from the combined phasing out of leaded gasoline and industrial lead emissions, as the outcome of government policy changes. We demonstrated that PbA have declined 20 to 100 times more than PbB, suggesting that the present-day atmospheric lead was not the main source of lead exposure anymore. Lead isotope analyses corroborated these findings but did not allow us to calculate the relative contribution of diet versus atmospheric lead intake because of the lack of end-members isotope signatures and the unknown transient character of the too numerous sources of dietary lead. A recent isotopic survey in blood from northern France and Belgium suggested that endogenous lead release from bone tissues might significantly contribute to PbB, and could partly explain why PbB have not declined as much as atmospheric lead contents in the past 30 years. Today, this secondary pollutant lead input would also explain the complexity of lead isotope systematics to discriminate exogenous lead sources in the blood. The phasing out of lead from gasoline and industrial exhausts provided a unique opportunity to identify pollutant lead impregnation in humans from endogenous sources. In view of these results, we believe that urgent investigation is needed to further explore the continuous release of secondary pollutant lead from bone mineral resorption and its role for lead exposure in humans.
Acknowledgments
This work was funded by the “Communauté urbaine de Dunkerque”, the “Région Nord-Pas-de-Calais”, the French “Ministère de l’Enseignement supérieur et de la Recherche”, the CNRS and the European Fund for Regional Development (FEDER) as part of the “Institut de recherche en environnement industriel” (IRENI) network. We thank Laurent Alleman and Esperanza Perdrix for their contribution to the compilation of recent atmospheric lead concentrations from Dunkirk. We are grateful to Niels Véron for his help with drafting figures. This work is dedicated to Jean Carignan and to his devotion to the use of geochemical tracers in multidisciplinary approaches.