

1 Introduction
The chemical weathering of rocks involves consumption of CO2, a greenhouse gas with a strong influence on climate. Among rocks exposed to weathering, basalt plays a major role in the carbon cycle as it is more easily weathered than other crystalline silicate rocks, whether at ocean-island scale (Louvat and Allègre, 1997), at high latitudes (Gislason et al., 1996), or in large tropical basaltic provinces like the Deccan Trap (Das et al., 2005; Taylor and Lasaga, 1999). This means that basalt weathering acts as a major atmospheric CO2 sink (Dessert et al., 2003). In the wider framework of the study of erosion mechanisms, the soils and sediments of the Loire Basin have been studied over a decade, using geochemical tools and isotope tracing (Négrel, 1997; Négrel and Grosbois, 1999; Négrel and Petelet-Giraud, 2012; Négrel and Roy, 2002; Négrel et al., 2000).
The present study investigated the lead isotopes in soil and sediment for constraining the life cycle of a catchment, covering erosion processes and products, and anthropogenic activities. For this, we investigated the Allanche river drainage basin in the Massif Central (France), flowing over the recent lava flows of the Cantal volcano as part of the Loire Basin, which offers opportunities for selected geochemical studies since it drains a single type of volcanic rock in a virtually unpolluted catchment, with only few agricultural activity increasing downstream (Négrel and Deschamps, 1996). Soil and sediment are derived exclusively from basalt weathering, and their chemistry, coupled to isotope tracing, should shed light on the behavior of chemical species during weathering from parental bedrock.
Lead isotopes are commonly used in environmental studies of catchments, lakes and urban areas (e.g., Bird et al., 2010; Emmanuel and Erel, 2002; Graney et al., 1995; Petit et al., 2015), and of erosion processes (Allègre et al., 1996; Hemming and McLennan, 2001; Millot et al., 2004), soils and tree rings (Reimann et al., 2012; Schucknecht et al., 2011; Stille et al., 2012). Isotopic investigation on the weathering products generally offer important information on the chemical reactions taking place during such processes, as studies on the Pb isotope systematics of granitic rock weathering demonstrate (Erel et al., 1994; Harlavan et al., 1998; Peng et al., 2014). Our data present evidence for processes and mechanisms that can be beneficial to other large-scale continental weathering studies, but they also have a wider-ranging value in ascertaining the use of isotope systematics and in interpreting isotope studies in a large volcanic province for deciphering natural and anthropogenic influences.
2 General features of the catchment and sampling strategy
The Allanche drains part of the Massif Central (Fig. 1a), one of the largest volcanic areas in France, whose volcanic forms include Strombolian cones aligned along fissures (Chaîne des Puys), extensive basaltic plateaus (Aubrac and Devès), and two large central volcanoes (Cantal and Mont Dore). The Allanche river is 29 km long and the catchment area is 160 km2 (Fig. 1a and b). From its origin in the Cézallier area to its mouth in the Allagnon river (a tributary of the Allier river, itself a tributary of the Loire river), the Allanche flows through the lava plateau between the Cantal and Cézallier volcanoes (De Goër De Hervé and Tempier, 1988). The main phase of volcanic activity within the Massif Central took place during the Late Miocene to Pliocene (Nehlig et al., 2001), dominated by eruptions from the Cantal (11–2.5 Ma) and Mont Dore (4–0.3 Ma), and by youngest volcanic activity occurring in the Vivarais (12,000 yr BP) and the Chaîne des Puys (4000 yr BP). The Allanche catchment is underlain by alkaline basalt from three volcanic cycles: the Infracantalian period from 8 to 5.4 Ma (Late Miocene); the Supracantalian period from 5.4 to 3 Ma (Pliocene) and from 240,000 to 6000 yr BP. The rocks in this catchment comprise feldspathic basalt (SiO2 content close to 46–49% and less than 5% of Na2O + K2O) and basanite (SiO2 content of 41–45%, low Na2O + K2O < 5%) (De Goër De Hervé and Tempier, 1988; Granet et al., 1995). The annual precipitation is around 1000 mm·yr−1 (De Goër De Hervé and Tempier, 1988). The basalt bedrock is overlain by a variable thickness of weathering-derived soils. Human activity is mostly cereal and cattle farming, marked by the use of amendments with fertilizers (De Goër De Hervé and Tempier, 1988).
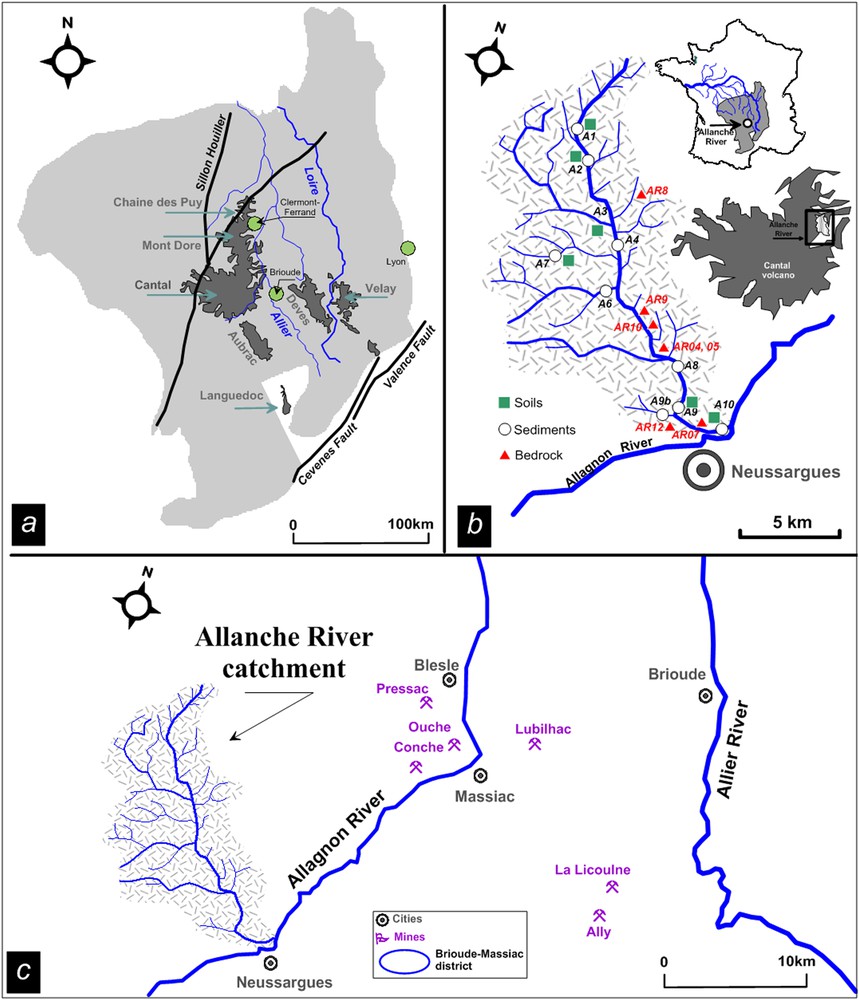
(Color online.) Location map of the Massif Central region (a) with the location of the main volcanoes areas (Chaîne des Puys, Cantal, Aubrac, Deves and Velay) and (b) detailed map of the Allanche catchment and the different sampling points. Map showing the location of mines in the Brioude–Massiac district (c) in the Massif Central (Pressac, Ouche, Conche, La Licoulne and Ally) and the location of processing plants (Blesle and Massiac).
Fig. 1b shows the Allanche catchment configuration and the sediment/soil and fresh bedrock sampling points. Riverbed sediments were collected with plastic spatulas and stored in polypropylene boxes. Samples from the top 25 centimeters of soil were collected near the river-water sampling points in the surrounding fields and stored in sealed plastic bags. The soil and sediment samples were prepared according to the description given in Négrel and Deschamps (1996) including oven-dried, homogenized, quartered and dry-sieved through a 165 μm nylon mesh, without a dispersion agent to avoid contamination and modification of the samples prior to analysis. Such a cut-off level was used for extracting fresh coarse organic matter (wood, etc.) and to remove particle-size biases caused by large sand grains (de Groot et al., 1982).
3 Results
Lead isotope results obtained for 11 streambed sediments and 8 soils are given in Table 1 and Pb, expressed in μg·g−1 (data from Négrel and Deschamps, 1996). According to this study, K2O contents fluctuate the most, whereas SiO2 fluctuates the least in soils and sediments. For trace elements, the larger variation is observed for Pb and the smaller one for Zn and Zr. The 206Pb/204Pb ratios in bedrock have a mean value of 19.13 ± 0.24 (n = 7; Négrel et al., 2015), whereas in sediment, the range is larger with 206Pb/204Pb ratios between 18.26 and 19.42 and a mean value of around 18.69 ± 0.39 (n = 11). In soil, the range is less, with 206Pb/204Pb ratios between 18.49 and 18.74 and a mean value of around 18.59 ± 0.09 (n = 6). There is no evidence of relationship between the lead isotope ratios in bedrock, soils and sediments (206Pb/204Pb, 207Pb/204Pb, 208Pb/204Pb) and the lead content (not shown).
Lead isotope data from sediment and soil for the Allanche catchment expressed as 206Pb/204Pb, 207Pb/204Pb and 208Pb/204Pb ratios (this study). The powdered sample was subjected to standard dissolution procedures into a Teflon container with hot HCl, HNO3, HF and HClO4. The chemical separation of Pb was done with an ion-exchange column (blanks < 100 pg). Pb isotopes were determined with a Thermo-Finnigan MC-ICPMS Neptune with the NIST981 reference material (Négrel and Petelet-Giraud, 2012). Values for 204Pb were corrected for interference of the 204Hg contribution using 202Hg. The measured ratios were normalized with 205Tl/203Tl for correcting mass fractionation (exponential law) and the external precision (2σ) is 0.1% for 206Pb/204Pb, 207Pb/204Pb and 208Pb/204Pb (Négrel et al., 2010). Data for major elements (SiO2, K2O) presented as oxides expressed in weight percentages; trace elements Pb, Zn and Zr expressed in μg·g−1 (all data are from Négrel and Deschamps, 1996). Samples were analyzed for major-oxide and trace elements by X-ray fluorescence energy-dispersive spectrometry and major and trace element contents in this study are from Négrel and Deschamps (1996). Lead isotope data from bedrock are from Négrel et al. (2015).
| Name | 206Pb/204Pb | 207Pb/204Pb | 208Pb/204Pb | Pb | SiO2 | K2O | Zn | Zr |
| Sediments | Ref. 1 | Ref. 1 | Ref. 1 | Ref. 1 | Ref. 1 | |||
| A2 | 19.42 | 15.67 | 40.21 | 27 | 43.73 | 1.15 | 127 | 348 |
| A6 | 19.42 | 15.68 | 40.22 | 34 | 42.17 | 0.49 | 128 | 274 |
| A9b | 18.27 | 15.61 | 38.23 | 19 | 42.57 | 0.49 | 116 | 296 |
| A1–2 | 18.64 | 15.63 | 38.65 | 19 | 40.11 | 0.7 | 147 | 313 |
| A2–2 | 18.77 | 15.64 | 38.97 | 35 | 40.3 | 0.92 | 130 | 362 |
| A4–2 | 18.66 | 15.65 | 38.89 | 48 | 41.75 | 0.78 | 157 | 335 |
| A7–2 | 18.52 | 15.63 | 38.51 | 26 | 38.68 | 0.65 | 163 | 282 |
| A8–3 | 18.26 | 15.63 | 38.32 | 49 | 38.22 | 1.05 | 144 | 323 |
| A10–3/1 | 18.50 | 15.62 | 38.51 | 38 | 37.8 | 0.96 | 150 | 327 |
| A10-3/2 | 18.45 | 15.63 | 38.51 | 56 | 46.2 | 1.36 | 161 | 327 |
| Mean | 18.69 | 15.64 | 38.90 | 35.1 | 41.2 | 0.9 | 142.3 | 319.7 |
| Standard deviation | 0.39 | 0.02 | 0.69 | 12.1 | 2.5 | 0.3 | 15.4 | 27.0 |
| Variation | – | – | – | 35% | 6% | 32% | 11% | 8% |
| Soils | ||||||||
| A1–2 | 18.57 | 15.62 | 38.57 | 21 | 32.59 | 0.55 | 121 | 313 |
| A2–2 | 18.74 | 15.64 | 38.84 | 27 | 38.43 | 0.87 | 114 | 396 |
| A3–2 | 18.53 | 15.63 | 38.54 | 19 | 36.24 | 0.44 | 160 | 366 |
| A7–2 | 18.52 | 15.64 | 38.59 | 19 | 34.01 | 0.65 | 165 | 270 |
| A9–2 | 18.49 | 15.63 | 38.50 | 32 | 42.18 | 1.00 | 150 | 317 |
| A10–2 | 18.69 | 15.65 | 38.76 | 33 | 48.98 | 1.32 | 129 | 361 |
| Mean | 18.59 | 15.64 | 38.63 | 25.2 | 38.7 | 0.8 | 139.8 | 337.2 |
| Standard deviation | 0.09 | 0.01 | 0.12 | 5.8 | 5.5 | 0.3 | 19.5 | 41.6 |
| Variation | – | – | – | 23% | 14% | 37% | 14% | 12% |
4 Discussion
4.1 Impact of weathering on element concentrations: bedrock normalization
While SiO2 and K2O contents in Allanche bedrock agree with the range of basanite and feldspathic basalt (De Goër De Hervé and Tempier, 1988; Nehlig et al., 2001), sediments and soils show a depletion in both SiO2 and K2O as weathering processes alter the primary phases of the bedrock, the lowest contents being observed in soil samples (Négrel and Deschamps, 1996). One way to understand the chemical compositions of riverbed sediment and soil developed over the same parent rocks is by normalizing each chemical species X by the average value of the same species in the parent rock (Cullers et al., 1988; Dennen and Anderson, 1962). Some of the chemical elements found in suspended particulate matter, riverbed sediments and soil, like Zr, Ti or Th, can be considered as non-reactive species in the weathering process (Cullers et al., 1988). Zirconium displays mostly insoluble behavior in hydrosystems and, in sediments, is largely concentrated in detrital minerals (Aiuppa et al., 2000). In order to evaluate the extent of chemical mobility during bedrock weathering, the percentage change relative to Zr (Nesbitt, 1979) was applied to lead following Eq. (1):
| (1) |
The mean values of Pb and Zr for the bedrock are respectively 35 and 309 μg·g−1. Results of the percentage change for Pb are expressed vs. the SiO2 content on Fig. 2. Depletion reaches −46% in sediments and −54% in soil. In soil, the depletion is consistently negative, except for sample A10-3/2, with a positive value of over 20%. In sediment, the samples from the headwaters of the main river and from its tributaries have negative values, and the depletion is less marked for the rest of the samples collected downstream along the Allanche River with the percentage changes being positive. This Pb-enrichment, with values between 40 and 80%, might correspond to an external Pb source.
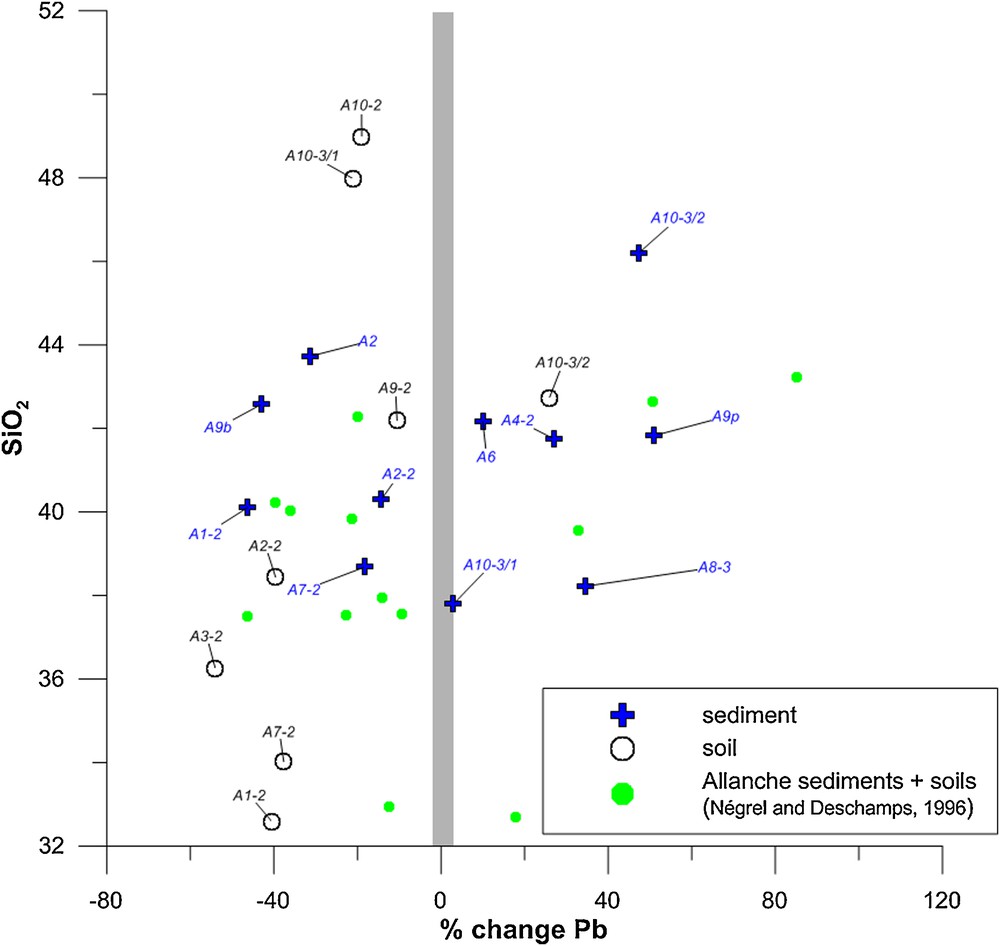
(Color online.) Percentage changes relative to Zr for lead according to Eq. (1) vs. the SiO2 content in Allanche soil and sediment. Data corresponding to sediment and soil in the Allanche catchment for which no lead isotope data were analyzed are referred to in this graph as “Allanche sediments + soils (Négrel and Deschamps, 1996)”.
4.2 Weathering processes and element mobility
Fig. 3 illustrates the relationships between the 1000Pb/Zr vs. K/Zr ratios for bedrock, river sediment and soil. This graph combines element ratios used when studying weathering profiles or weathering suites of materials rather than contents alone, with the approach using an immobile element (Zr) as the reference. We used also K, based on its solubility and its presence in one of the two phases in basalt (feldspar phenocrysts or in the ground mass). We postulated that K is mobile during weathering as the percentage changes relative to Zr for K according to Eq. (1) ranged between 26 and 79% in sediment and between −30 and −60% in soil.
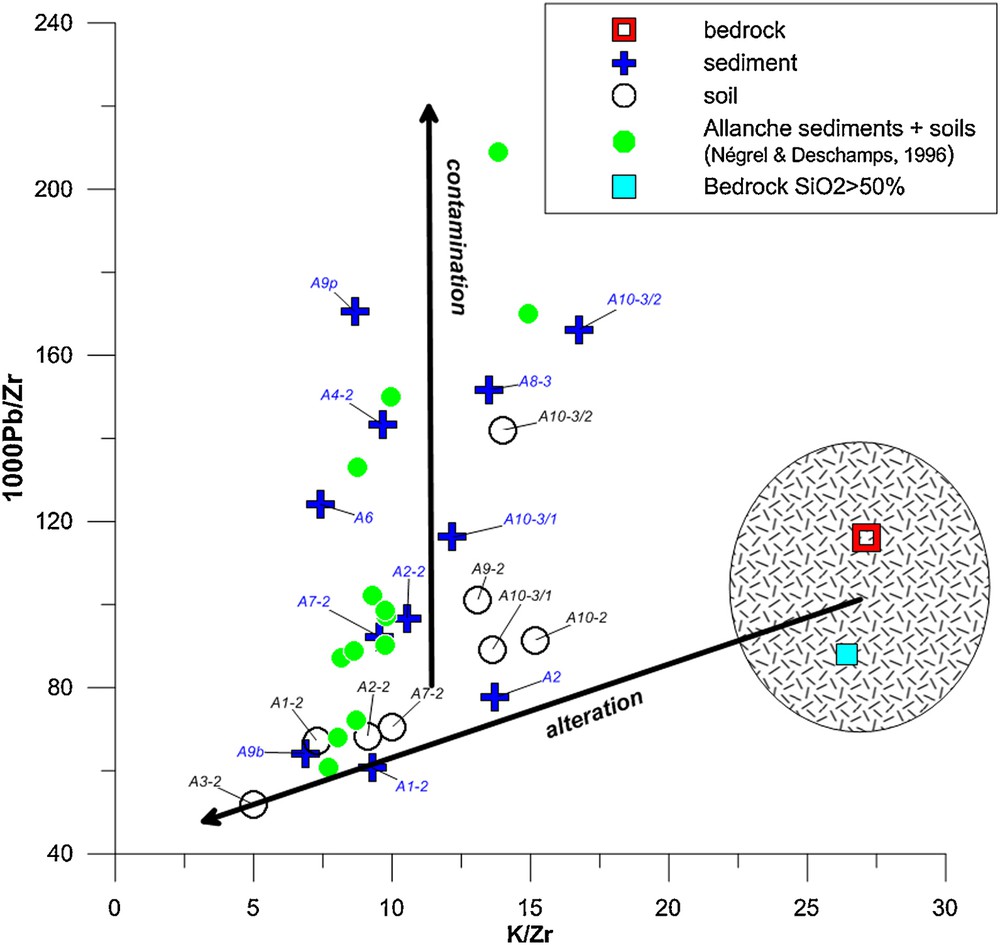
(Color online.) Relationships between the 1000Pb/K vs. Zr/K ratios in Allanche bedrock, soil and sediment. Data for the bedrock with SIO2 > 50% correspond to erratic blocs in the upstream part of the Allanche catchment (Négrel and Deschamps, 1996). Data referred to as “Allanche sediments + soils (Négrel and Deschamps, 1996)”correspond to sediment and soil data in the Allanche catchment in which no lead isotope data were analyzed.
Bedrock constitutes an extreme set of ratios and the two relationships defined between the 1000Pb/Zr and K/Zr ratios can be interpreted in two different ways. First, the linear relationship with a large variation in K/Zr ratios and a lower one for 1000Pb/Zr ratios may reflect the evolution between two extreme end-members, one being fresh basalt (the unaltered end-member) and the other clay and altered phases, whereby the position of each sample along these linear relationships reflects its degree of weathering (Négrel and Deschamps, 1996). However, the deviation of the data points from this alteration line must be related to lead enrichment in sediments and soil. This agrees well with the calculation of the percentage changes showing lead enrichment for some samples (Fig. 2). As for lake sediments where lead enrichment was detected (Renberg et al., 1994), atmospheric deposition was suspected to be the major contributor. This will be explored below through lead isotope fingerprinting.
4.3 Variation along the course of the river
The lead content, the 206Pb/204Pb ratios, the 1000Pb/Zr ratios and the Zn content (Fig. 4a–d) in bedrock, soil and sediment are reported versus the distance from the river source. Lead content (Fig. 4a), is depleted compared to bedrock in sample A1 collected 6 km downstream from the river source, reflecting the effect of weathering processes. Therefore, two types of behavior can exist, with the lead content in soil and sediment:
- • having a similar range to that of bedrock;
- • having a clearly higher range than that of bedrock.
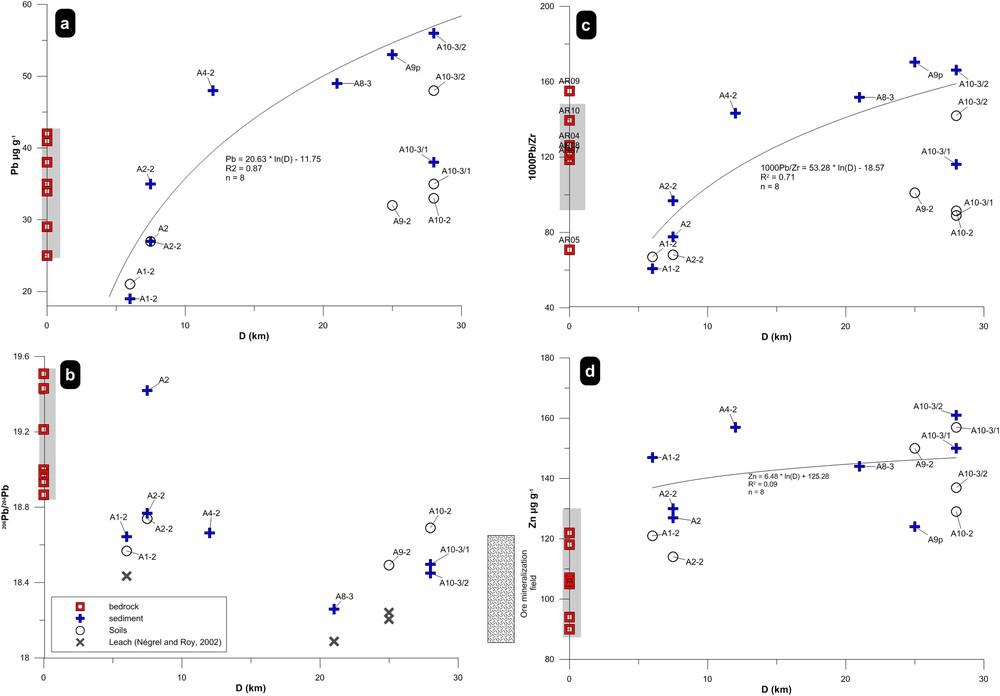
(Color online.) Plot of Pb content (μg·g−1), 1000Pb/Zr, 206Pb/204Pb ratios and Zn content in Allanche bedrock, soil and sediment versus the distance along the Allanche River (0 is upstream). The mineralization field is indicated in the graph for the 206Pb/204Pb ratio (Marcoux, 1986; Marcoux and Brill, 1986).
The first sample with a lead content higher than that of bedrock was A4, 12 km downstream from the source, and increasing lead contents were found in samples A8, 9 and 10. Regarding the evolution of lead content in the mainstream sediment, a log-relationship better fits with an equation Pb = 20.63 × ln (D)–11.75 (R2 = 0.87, n = 8). A similar plot for the 206Pb/204Pb ratios vs. distance is given on Fig. 4b. Except one sample (A2, 7.5 km downstream from the source) with a 206Pb/204Pb ratio in agreement with those of the bedrock (as well as for Pb concentration), all other soil and sediment samples had 206Pb/204Pb ratios clearly lower than those of bedrock. As for the lead content, the plot of the 1000Pb/Zr ratios versus the distance from the river source (Fig. 4c), reflecting again the role of weathering processes with values lower than bedrock ones in sample A1–A2 and then increasing downstream. Regarding the evolution of this ratio in the mainstream sediment, a log-relationship better fits with an equation 1000Pb/Zr 1000Pb/Zr = 53.28 × ln (D)–18.57 (R2 = 0.71, n = 8) that reflects lead addition. A plot displaying the Zn content vs. the distance is given on Fig. 4d. The zinc content is enriched compared to bedrock in all sediment samples. There is no correlation between the Zn content and the distance, as illustrated by the R2 value ∼ 0.09 for a log-relationship. Coupling the downstream increase of lead content in sediment with the lowering of lead isotope ratios may help constraining the additional end-members represented by the anthropogenic input, as illustrated in the graph. However, the multiplicity of anthropogenic sources (gasoline, industry) with low lead isotope ratios precludes any further interpretation of this graph.
Fig. 6c is a plot of the 1000Pb/Zr ratios vs. the distance and will be explored further.
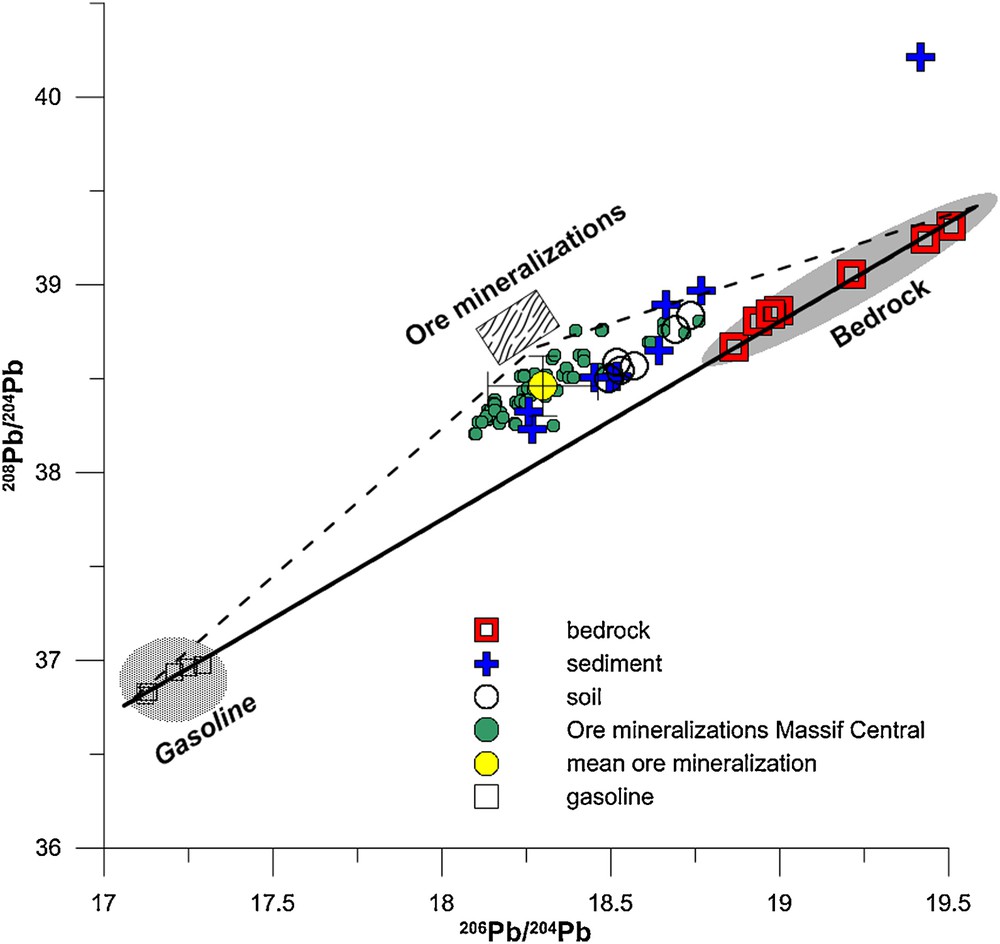
(Color online.) Plot of the 208Pb/204Pb vs. 206Pb/204Pb ratios in Allanche bedrock, soil and sediment. Two possible anthropogenic end-members are indicated in the graph: gasoline (Monna et al., 1997; Roy, 1996) and ore mineralization (Marcoux, 1986; Marcoux and Brill, 1986). Note the mean value with standard deviation for mineralization.
4.4 Sediment transfer dynamics
The relative importance of sediment sources in catchment for fluvial sediment supply depends on whether these sources are connected with the channel. Large catchments have more opportunities than smaller catchments for sediment storage, because of floodplains that act as a buffer between hillslope sediment sources and the river, and as storage areas for sediment deposited by overbank flow, thereby reducing the volume of sediment reaching the catchment outlet (Bouchez et al., 2012). Because small catchments generally have non-existent floodplains, hillslope sources have a greater connectivity with the river and overbank, and are therefore more susceptible to erosion and less capable of sediment storage. The rate of sediment delivery from catchment to river depends on the rate of sediment production in the catchment and on the level of connectivity between sediment source and channel (Owens et al., 2005). There are several mechanisms of sediment production in upland areas; generally, cultivated areas are most sensitive to erosion. High grazing intensity has been shown to initiate soil erosion and to exacerbate existing soil erosion; pasture next to a channel thus may significantly increase sediment input into the river (Owens et al., 2005).
Erosion processes and sediment transfer in the catchment can be represented by a box model (Fig. 5) with inputs and outputs that can be summarized by the mass balance equation:
| (2) |
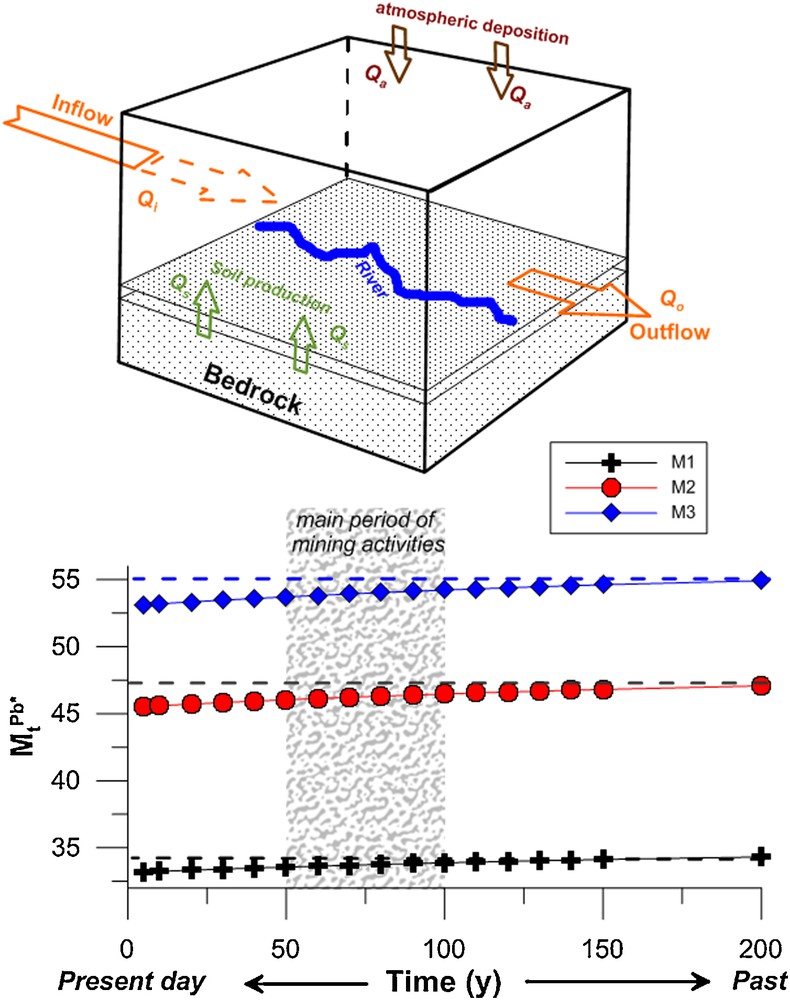
(Color online.) Box model for the Allanche River catchment. Qs is the production of hillslopes due to bedrock weathering, Qa is the anthropogenic input through atmospheric deposition, Qi the inflow from upstream, and Qo the outflow.
Qs is the production of soil on hillslopes due to bedrock weathering, and anthropogenic input through atmospheric deposition (Qa). The inflow from upstream (Qi) is counterbalanced by outflow (Qo) plus Qs and Qa. This equation can be solved assuming as the amount of an element X at time t in the box model, X being Pb in this study.
Then it comes:
| (3) |
If a steady state is reached (i.e. input being counterbalanced by output), the residence time τ of X is and can be solved. Here, we postulate that Qs is constant over recent time as less land-use changes have occurred, nor climatic or physical changes (runoff, temperature…, Cerdan et al., 2010), Qa cannot be considered as constant and a steady state is thus not fully reached. In this case, the dynamic box model must be considered (Boyer et al., 2005). We therefore assume that the initial amount M at t = 0 is M0 and the initial mass balance equation is:
| (4) |
The next stage of this dynamic box model follows an increase of M0 to a new value M1, which is equal to [Qi + Qs + Qa]1 and thus leads to:
| (5) |
This equation is solved according to:
| (6) |
We have considered the residence time τ of the sediments in the catchment as being of about the order of the century, as demonstrated by Gautier et al. (2009) in mountainous rivers.
In the model, t = 0 is the present day and Qa is considered as inactive, whereas only Qs produces lead in the sediment through bedrock weathering (Cerdan et al., 2012). The content M0 then corresponds to the most depleted sample (A1, Pb = 19 μg·g−1), with the highest percentage change compared to Zr (e.g., −46%, Fig. 4), and represents the most weathered stage. We will consider hereafter three cases for the lead amount Mt (at time t) varying from the present period up to 200 years in the past, which corresponds to the time when the atmospheric deposition of lead (Qa) was active neither through gasoline nor from mining activities. Within this time frame, we cover twice the admitted residence time of the sediment in the catchment (Gautier et al., 2009). The three cases are chosen along the course of the river and according to the evolution of the content vs. the distance (Fig. 4). The first case M1 is represented by sample A2 (Pb = 35 μg·g−1), the second case M2 by the samples A4 and A8 (Pb = 48–49 μg·g−1) and the last case M3 by sample A10 (Pb = 56 μg·g−1). The variations with time of the lead content MtPb* for the three cases M1, M2 and M3 are calculated using Eq. (6) with M0 being around 19 μg·g−1. The variation of MtPb* demonstrates first that the lead content observed in samples A2, A4–A8, and A10 was yet obtained at t = 200 yr ago, suggesting that Qs allows the lead content to increases along the course of the river. The MtPb* remains constant during the mining period, between 1830 and 1930 and after that during the gasoline lead influence. Similar results were obtained in an experimental site by Semlali et al. (2004) and in selected sites in Switzerland (Hansmann and Köppel, 2000).
4.5 Lead isotope systematics in sediment and soil: sources and mixing processes
Determining the source of Pb in soil and sediment requires knowledge of the different possible Pb reservoirs. Because there is no relationship between lead isotopes and the lead content in soils and sediment, more than two end-members must be suspected. In addition to the nature of the bedrock and its weathering, the other inputs may be of natural or anthropogenic origin, but originating outside the catchment. Among these inputs, that from tetraethyl lead when it was extensively used as an additive to gasoline is probably one of the main sources of anthropogenic lead. The Pb isotope composition of gas additives depends on the source of the Pb ore used. In France, Roy (1996) and Monna et al. (1997) reported the range of lead isotope composition in gasoline as 17.12–17.29 for 206Pb/204Pb and 36.81–36.97 for 208Pb/204Pb. In the 208Pb/204Pb vs. 206Pb/204Pb plot (Fig. 6), the positions of Pb isotopic compositions of bedrock and those of the gasoline end-member define the two extreme end-members regarding the lead cycling in soils and sediments (i.e. lead originating from gasoline inputs and lead originating from bedrock weathering). When comparing the lead isotopes in soil and sediment with this relationship, all samples plot with a shift towards lower 206Pb/204Pb ratios. This implies the existence of a third end-member with characteristics that help explaining the shift in the Pb isotope composition. This high lead isotope cannot be due to the application of fertilizers, themselves with a variable lead isotope composition (206Pb/204Pb > 19.21 and 208Pb/204Pb > 33.30; Roy and Négrel, 2001). Hence, the other lead input must be related to natural input, like the impact of granite weathering near the catchment or the presence of ore mineralization (Nehlig et al., 2001). Both may affect the catchment via atmospheric circulation and the transfer of dust to the Allanche catchment.
Even though the lead isotope analyses of the granite population in the Massif Central, made on acid-leached feldspars, plagioclases and whole rocks (Downes et al., 1997; Michard-Vitrac et al., 1981), yielded 206Pb/204Pb, 207Pb/204Pb and 208Pb/204Pb isotope ratios in agreement with the high lead isotope composition in sediment and soil (respectively 18.07–18.45, 15.59–15.72, and 38.15–38.60), two arguments refute this origin for lead. First, the amount of dust needed to shift the lead isotope signature would be too large compared to the lead content in both granite and basalt (Négrel and Roy, 2002). The second argument is based on the Sr isotope ratios in bedrock and soil/sediment in the catchment (Négrel et al., 2013), which does not support such input in view of the values in soil and sediment developed on granite (Négrel, 1999, 2006). Thus, the influence of wind-blown dust from mining and mineral-processing activities remains a major probable source of lead (Carignan et al., 2002; Guéguen et al., 2012) as they are rich in lead. The role of the different lead sources is detailed below.
4.6 Link between atmospheric deposition and lead isotopic systematics in sediment and soil
Input of lead from mining activities can thus be considered as an important source of lead in soil and sediment of the Allanche catchment. In the Massif Central, the small (600 km2) Brioude–Massiac mining district (Marcoux and Brill, 1986) is known primarily for its Sb mineralization, in veins with Sn–W, W–Au, Sb–quartz, and Pb–Zn barite or fluorite, which chronologically belong to the Late Hercynian and Early Jurassic periods. France was the world's largest producer of antimony between 1890 and 1910 thanks to extraction in the Massif Central (Massiac) and the Mayenne region (Laval), with a total production of 120,000 tons, of which the Brioude–Massiac district provided one-third (Fig. 1c). In 1870, a smelter was established at Blesle (some 20 km northeast of the Allanche catchment), supplied mainly by mining in Conche and Ouche. The better days lasted sixty years, but economic development stopped during the crisis of the 1930s, the Ouche mine closing in 1932. Activity resumed in 1945, lasted until 1953 and continued sporadically until 1971. In all, the Ouche deposit has produced some 9000 tons of antimony (1830–1970) of the 40,000 tons produced by the whole district.
In addition to the smelter locations near the Allanche catchment, dominant winds blow from two main directions (Négrel and Roy, 1998). The first is westerly and mainly of marine origin from the Atlantic Ocean and crosses part of the Aquitaine basin. The second is northerly, being both marine (North Atlantic and North Sea) and continental (Great Britain); this crosses the smelter area and thus can have moved dust during the time of mining and ore processing. According to the studies of mineralization in the Massif Central, the Pb isotope ratios resulting from mining activity (206Pb/204Pb, 207Pb/204Pb and 208Pb/204Pb) varied between 18.10–18.47, 15.62–15.66, and 38.20–38.76, respectively, i.e. in the same range as that found in granites from the Massif Central (Marcoux, 1986; Marcoux and Brill, 1986). These data, with mean values of around 206Pb/204Pb = 18.299 ± 0.162 and 208Pb/204Pb = 38.461 ± 0.160 are plotted on Fig. 6 and perfectly agree with the soil and sediment data, partly reflecting the origin of lead from ore mineralization (along the dashed lines). Using the variation in lead content and lead isotopes in sediment vs. the distance (Fig. 4) and the mixing diagram between 208Pb/204Pb and 206Pb/204Pb ratios, the existence of three end-members, i.e. bedrock and two atmospheric components—the influence of mining activities and the deposition of lead from gasoline—, is required to explain the variation in the soil and sediment of the Allanche catchment, as not at all samples align along the bedrock-mining end-member. Fig. 7 shows the relationship between 206Pb/204Pb vs. 1/Pb ratios, the latter shown as a broken axis for easier viewing. The mixture of two or more components can be modeled with this type of standard diagram (Bird et al., 2010; Hansmann and Köppel, 2000; Négrel et al., 2010). With the Pb isotope ratio and 1/Pb coordinates, the mixing curve of two components with different isotope ratios and lead contents results in a straight line. In the case of a multi-end-member mixture, several linear mixing curves can be calculated, meaning that such diagrams require the characterization of end-members as Pb sources. In such a representation, the isotope systematics of two-component mixtures [Eq. (7)] described in detail by Bird (2011) can be expressed as follows:
| (7) |
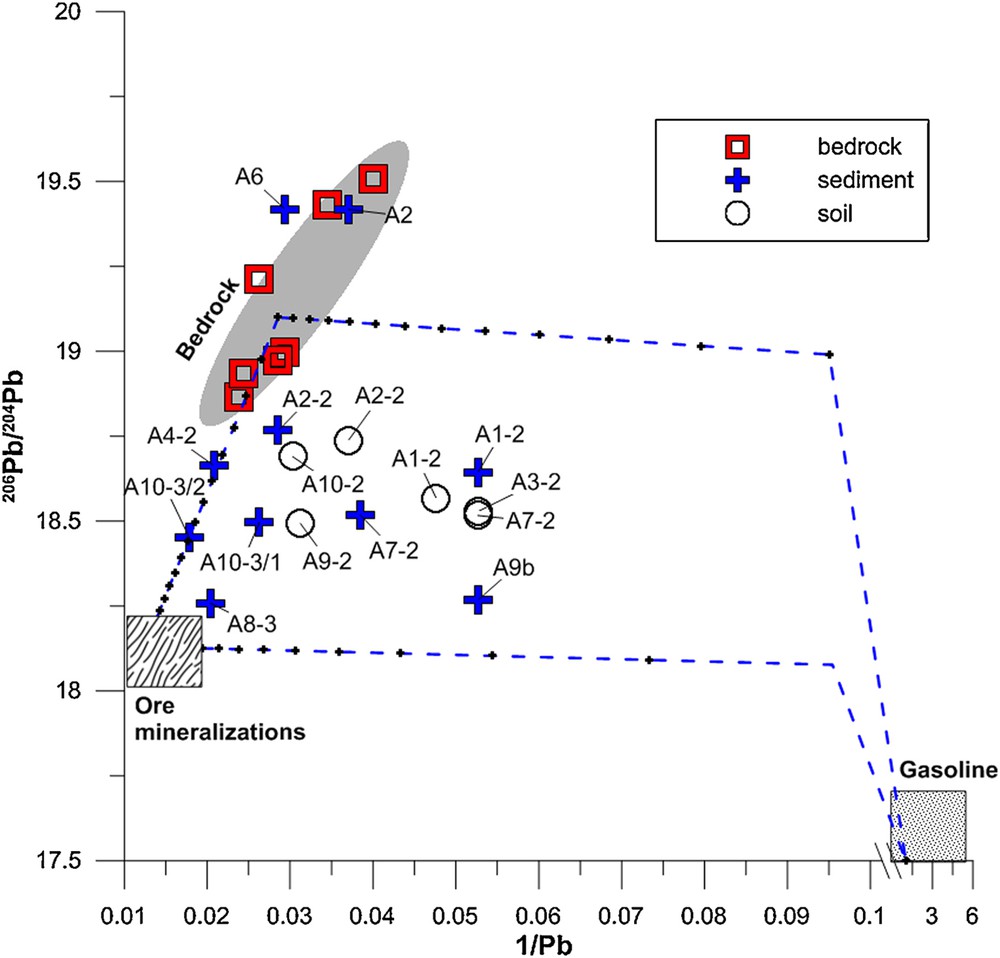
(Color online.) Plot of 206Pb/204Pb vs. the reverse of the lead content (1/μg·g−1) in Allanche bedrock, soil, and sediment. The regression line and grayed area corresponding to 95% confidence are indicated for the bedrock samples, as described in Négrel et al. (submitted). The mineralization and gasoline fields are indicated (see text). The two-component mixing lines, according to Eq. 7 between the mean bedrock, the ore mineralization and gasoline end-members are indicated.
In that frame, on Fig. 7 the samples A2 and A6 plot in the bedrock field, A4-2 and A10-3/2 plot along the mixing line between the bedrock and mining and processing end-members, reflecting that lead is only derived from these two end-members. The rest of the sediment samples display an additional influence of lead from gasoline input, but A8-3 and A9b plot more closely to the mixing line between the mining and processing and gasoline input end-members, while A1-2 and A2-2 plot more closely to the bedrock–gasoline input end-members mixing line. All soil samples show an influence of the three end-members.
5 Conclusions
We present lead isotopic ratios together with major and trace elements in the bedrock–soil–sediment continuum of a small monolithologic basalt catchment (Allanche, 160 km2) in the French Massif Central to investigate weathering processes. Major and trace elements (e.g., Zr, K) show a classic evolution trend from unaltered bedrock to clay and altered phases, but Zn and Pb show a distinct evolution trend beyond that of a typical weathering process and show a clear enrichment in soil and sediment, attributed to anthropogenic input. We applied a box model to simulate the lead evolution in the sediments issued from soil production on the hillslopes due to bedrock weathering and from anthropogenic input through atmospheric deposition. This model helps constraining the dynamics of sediment transfer. The MtPb* (i.e. the amount of Pb at time t in the box model) remains constant during the mining period and after that during the gasoline lead influence corroborating the steady state in the catchment. The metal contamination in soil and sediment was further investigated with chemical and lead isotope profiles throughout the catchment. Lead enrichment in soil and sediment up to the outlet of the Allanche is accompanied by lead isotopic signatures lower than those of bedrock, implying another external lead source. Two distinct lead sources were highlighted, both transported as aerosols into the basin:
- • mining and mineral-processing of ores in the Massif Central;
- • deposition of lead-rich particles resulting from gasoline combustion, the latter influence being still visible through tetraethyl lead additives.
This study illustrates the lead source fingerprinting in a small monolithologic catchment. This methodological approach, coupling major and trace elements with lead isotopes, can be beneficial to larger-scale continental weathering studies, including the fingerprinting of trace metals and their transport and dynamics at basin scale, which are required steps when investigating the influence of metal contamination on ecosystems.
Acknowledgements
This work was financially supported by the BRGM Research Division programs. It benefited from the collaboration of the BRGM Isotope laboratories, M. Robert is thanked for her help. We are grateful to Dr. H.M. Kluijver for proofreading and editing the English text.