

1 Introduction
Loss of arable land is a major environmental risk that causes more than $44 billion in damages each year (Pimentel et al., 1995). Unravelling the interacting roles of climate and human activities on soil erosion requires information about complex process-response mechanisms that take place over spatio-temporal scales that are considerably larger than the duration and extent of existing sediment flux monitoring (Syvitski et al., 2005). Dated sediment records that document Late Holocene siltation of both continental (Dearing and Jones, 2003) and marine environments (Poirier et al., 2011) at a worldwide scale offer the opportunity to override this lack of data. In many cases, siltation was interpreted as a consequence of increased rates of soil erosion on the associated catchments attributed to land-use/land-cover changes such as deforestation or mining. Most often, however, interpretation was solely based on the synchronicity of events and was rarely supported by direct evidence of climate and/or human-mediated changes in past soil erosion rates. Modelling systems provide an alternative to correlate more convincingly sediment records with quantified estimates in soil erosion rates within historical times (Boyle et al., 2011).
The aim of this study is to implement a spatially-resolved soil erosion model on a 10 000 km2 western European catchment. The model is supplied with realistic scenarios of land-cover and climate conditions in order to (1) identify the respective influence of these two forcing factors on soil erosion rates, (2) reconstruct the centennial to decadal variability in soil erosion since the 16th century, (3) estimate rates of sediment supply at catchment outlet, and (4) compare predicted results with sedimentological changes observed in the related estuarine bay. Although sophisticated process-based soil erosion models exist (e.g., Mitas and Mitášová, 1998), they require high-resolution input data that restrict their use to small catchments and short time periods, far below the spatio-temporal scales involved here. Instead, it was chosen to use the simple Revised Universal Soil Loss Equation model that predicts long-term average annual soil loss under specified land-cover and climate conditions (RUSLE, Renard et al., 1997). RUSLE is based on a set of semi-empirical equations and is better suited for the application to large areas. It was successfully tested over a wide variety of environments for which a considerable amount of literature exists, can be easily implemented with GIS softwares (e.g. Yang et al., 2003), and does not require heavy computing power.
2 Study area
2.1 Historical changes in estuarine sedimentation
The Pertuis Charentais area, which is located in western France, is a system of drowned incised valleys and shallow estuarine bays (Chaumillon et al., 2008). Holocene sediment fill of the area was investigated with very high resolution seismic surveys (>3100 km in total) ground-truthed by 14C-dated sediment cores (99 cores, 44 dates obtained on mollusc shells), with particular emphasis on the tide-dominated Marennes-Oléron Bay (Allard et al., 2010; Billeaud et al., 2005; Chaumillon and Weber, 2006; Chaumillon et al., 2004; Poirier et al., 2011, Fig. 1a). The Holocene sediment fill of the bay and of surrounding areas is capped by a silt drape (820 km2 large, 1 to 1.5 m thick; unit UT4.2, Fig. 1a,b) that lies unconformably on older sand deposits and yielded several consistent 14C ages younger than 1000 AD. Similar fine-grained deposits settled within historical times have been described at a regional scale in estuaries and inner shelf of the bay of Biscay (Lesueur et al., 1996; Menier et al., 2010). Striking similarities between these silt drapes regarding lithology, sediment sources and timing of deposition strongly support the influence of large scale allogenic factors, rather than fortuitously synchronous decrease in estuarine tidal energy.
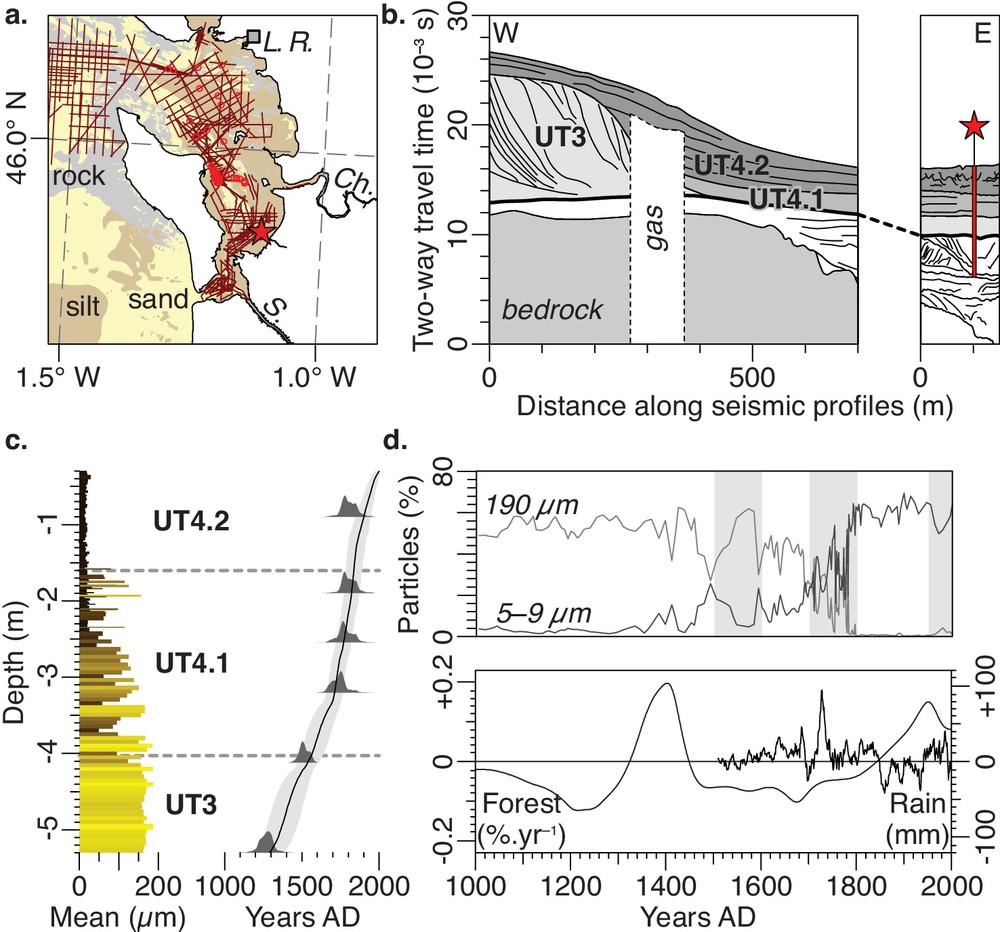
a. (Color online.) Map of the Marennes-Oléron bay, including simplified surface sediment facies (data provided by SHOM, France), seismic profiles (dark red lines), sediment cores (red open circles), and location of reference M7UC01 sedimentary record (red star). L. R.: La Rochelle city, Ch.: Charente and S.: Seudre rivers. b. Excerpts of interpreted seismic profiles representative of the Late Holocene sediment fill of the Marennes-Oléron bay from west to east. c. Simplified M7UC01 core log showing mean grain size and 14C Bayesian age model. d. Above: contribution of sediment particles in M7UC01 core. Below: forest dynamics (negative values indicate deforestation) and winter rainfall deviation to mean. Grey-shaded areas indicate the time extent of modelled scenarios. Adapted from Poirier et al. (2011).
The M7UC01 core, which serves as a basis for this study, supports this hypothesis. It was recovered on the eastern Marennes-Oléron bay tidal flat (Fig. 1a,b), and provided the most continuous and one of the less disturbed sedimentary record recovered in the Pertuis Charentais so far (Poirier et al., 2011). Sedimentological and chronological data were correlatable with those obtained in other parts of the bay (Allard et al., 2010; Billeaud et al., 2005; Chaumillon et al., 2004) through seismic profiles (Fig. 1b). An accurate 14C Bayesian age model was developed to perform depth-to-time conversion of high-resolution grain-size data, which evidence a fining-upward sequence (Fig. 1c). The onset of silt sedimentation in the 16th century was contemporaneous with a period of forest clearance starting from ca. 1450. Siltation aggravated in the late 18th century soon after a short-lived increase in winter precipitation on the associated catchments (Fig. 1d). It was hypothesised that greater rainfall intensified water erosion of soils previously affected by deforestation (Poirier et al., 2011).
2.2 Sediment sources
Four main sources of fine-grained sediments could have contributed to silting up the Pertuis charentais, including (1) small coastal rivers flowing directly into the area, the largest being the Charente river (Fig. 2), (2) the Gironde estuary that is located 35 km southwards (Fig. 2, Dabrin et al., 2014; Parra et al., 1998), (3) Mesozoic marls and limestones outcropping along the coast, and (4) coastal marsh clay minerals (Parra et al., 1998). According to Dabrin et al. (2014), annual SPM inputs to the Marennes-Oléron bay are in the order of 430 000 to 520 000 t·a−1, 84% of which are provided by the Gironde estuary. This contribution may vary depending on local hydrodynamic conditions. Preliminary Sr–Nd isotopic analyses were carried out on post-1800 silt layer recovered in M7UC01 core to identify sediment sources. Although these unpublished data should be considered with care (n = 12), they suggest a locally significant contribution of the Charente river on sedimentation of the eastern Marennes-Oléron bay tidal flat. Indeed, the flat is under the influence of the river turbid plume.

(Color online.) Map of Charente catchment, including hill-shaded Digital Elevation Model, stream network (bold line is Charente river), toponyms included in the text, and location of gauge stations (see section 3.3 for details).
For a proper comparison between model output and in situ sedimentological data, it was therefore chosen to model soil erosion exclusively on the Charente catchment (Fig. 2). It is among the smallest in France, with a total area of 9891 km2. The catchment is roughly diamond-shaped, 170 km from west to east and 115 km from north to south. Altitude ranges from 0 to more than 490 m, 75% of the catchment being below 250 m. The average slope is 4.1 ± 3.9%, and only 0.5% of the catchment has slopes greater than 20%, beyond the range of applicability for RUSLE.
3 Materials and methods
RUSLE was spatially resolved to predict current and past rates of soil erosion by water on the Charente catchment under realistic climate and land-cover scenarios. All geospatial data were cropped, converted and/or resampled to a series of raster layers with same extent and cell resolution of 25 m. Raster layers were projected in Lambert93 geodetic system (EPSG code 2154).
Sediment load (t·a−1) at the catchment outlet was computed as
| (1) |
Ai is the mean annual gross soil erosion by water (t·ha−1·a−1) predicted by RUSLE as
| (2) |
SDR is the average Sediment Delivery Ratio (Walling, 1983), which accounts for catchment efficiency to export eroded material towards streams (see section 3.3 for details),
and ar is the cell area, here 25 × 25 m = 0.0625 ha.
3.1 Revised universal soil loss equation
The components of equation (2) are briefly presented here (see Renard et al., 1997 for details). R describes the removal effect of raindrop impacts on the soil surface, expressed in MJ·mm·ha−1·h−1·a−1. Renard and Freimund (1994) regression equations suited for yearly rainfall data were applied (see section 3.2 for data sources).
| (3a) |
| (3b) |
K describes the sensitivity of a soil to erosion depending on its properties, expressed in t·h·MJ−1·mm−1. K was extracted from 500-m cell resolution K factor dataset interpolated from European Soil DataBase (Panagos et al., 2014). The protective effect of surface stone cover (stoniness) was taken into account.
L and S are dimensionless factors that account for sediment gravity flows resulting from topography. L and S were calculated from a 25-m cell resolution Digital Elevation Model smoothed with a local 125×125 m mean filter (BDALTI, Institut géographique national, IGN, France), based on the equations described by McCool et al. (1987, 1989) as
| (4) |
| (5a) |
| (5b) |
where λ is the cumulative slope length (m),
a is the rill to inter-rill erosion ratio,
f = sin θ / [0.0896 × (3 × (sin θ)0.8 + 0.56)],
and θ is the slope (rad).
Given the scarcity of rills on crop fields identified on high-resolution aerial photographs (IGN), it was assumed that 90% of soil loss was related to interrill erosion, i.e. a was set to 0.1.
C is a dimensionless factor that accounts for effects of vegetation cover and soil-disturbing processes. Six land-cover categories were defined, each being attributed a value according to the literature (Table 1). P is a dimensionless factor that accounts for agricultural practices such as contour or strip cropping. Values could not be determined from current nor historical data. P was thus set to 1, which corresponds to straight-row crop farming, i.e. the most common form of agriculture on present-day Charente catchment.
Land-cover categories and associated C-factor values.
| Land cover category | CLC2000 categories | C-factor value | Comments |
| Crop land | 211, 221, 222, 242, 243 | 0.26 | Assuming a 3-year cereal rotation (Gabriels et al., 2003) comparable to French crop farming since the Middle Ages (Leturcq, 2004) |
| Pasture | 231 | 0.013 | Assuming 80% cover of grazed grass-like plants with no canopy (Anonymous, 2002) |
| Forest | 311, 312, 313, 321, 324 | 0.003 | Assuming moderate tree density with 40–70% canopy cover and 75–85% soil litter (Anonymous, 2002) |
| Urban | 111–142 | 0 | |
| Wetland | 411–423 | 0 | |
| Water | 511–523 | 0 |
3.2 Scenarios
Current and past rates of Charente river sediment supply were predicted from the coupled RUSLE–SDR equation 1. The K, L, and S factors were considered time-invariant since 1500 in order to focus on centennial to decadal variability arising from climate and land-cover changes (i.e. R and C factors). Sediment supply was modelled annually in three time intervals representative of sedimentological conditions in Marennes-Oléron bay (Fig. 1d). Intervals include the second half of 20th century for validation and comparison with existing data (silt-dominated bay), the 18th century (mixed sand-silt sedimentation), and the 16th century (sand-dominated bay).
3.2.1 Climate (R factor)
Paleoclimate data required to compute past R-factor maps were extracted from a dataset of spatially-resolved seasonal rainfall reconstructions on continental Europe (1500–2000 period, 30 arc-minutes cell resolution, Pauling et al., 2006). Annual rainfall values were calculated to fit equation (3.1).
3.2.2 Land cover (C factor)
C-factor maps were built from a combination of data. “Water” and “Wetland” land cover categories were extracted from Corine Land Cover 2000 dataset (CLC2000, Steenmans et al., 2002) and kept constant across scenarios. In the absence of historical knowledge on the dynamics of pasture areas on the Charente catchment, the “Pasture” category was also kept as of CLC2000 as a conservative approach. “Forest” and “Urban” categories varied in time:
- • “Forest” category: the 20th-century forest cover was extracted from CLC2000 dataset. The 18th-century cover was extracted from Vallauri et al. (2012) dataset, which consists in geo-referenced contours of forests represented on Cassini historical maps (1747–1790). The 16th-century cover was created from the previous layer, resized to match forest surface estimates of Mather et al. (1999) using a buffer method;
- • “urban” category: 20th-century urban cores were extracted from CLC2000 dataset. Urban areas represented 405.3 km2, in which ca. 586 000 people lived in 2000, i.e. 1% of total French population (INSEE, 2014). This ratio and the corresponding average population density of 1445.8 inhabitants per square kilometer of urban area were supposed constant across scenarios. 18th and 16th centuries urban cores were resized in order to reproduce the decrease in population living on the catchment. French national demographic data were compiled from Dupâquier (1995) time series (estimated Charente population of 265 000 in 1770 and of 152 000 in 1550). The buffer distance was the square root of features area in order to shrink large cities in priority.
3.3 Sediment Delivery Ratio
The Sediment Delivery Ratio was estimated by comparing the monitored SPM concentration with predicted gross soil erosion on associated up-stream sub-catchments. The SPM concentration was monitored since 1976 in 217 water-quality gauge stations. Stations located in man-made waterways or within the Charente estuary turbidity maximum were discarded. Up-stream sub-catchments associated with the remaining 185 stations (Fig. 2) were delineated from 25-m cell resolution Digital Elevation Model. The Sediment Delivery Ratio was calculated as
| (6) |
where SPMj is SPM concentration at the jth gauge station (mg·l−1).
MFj is water flow at the jth gauge station (m3·s−1). The water flow was monitored in 40 stations only (Fig. 2). Data could not be reliably used, as most stations were located kilometres down- or upstream from SPM-gauging stations and yielded highly irregular time series. As an alternative, MFj was estimated from Mandal and Cunnane (2009) equation as
| (7) |
rj is average annual rainfall on the jth up-stream catchment (mm), extracted from WorldClim climate dataset (average rainfall 1950–2000, 30 arc-seconds cell resolution, Hijmans et al., 2005),
and a, b and c are constant variables. A non-linear regression was carried out to adjust a, b and c constant values to the average annual water flow recorded in the 40 water flow gauge stations (in the range from 0.2 to 49.7 m3·s−1). The regression gave a = 0.0229, b = 0.1394 and c = 1.5030. The predicted flow showed a good agreement with the measured one (R2 = 0.89 and p = 0).
α is an appropriate conversion factor to (t·a−1),
and Aj is total annual gross soil water erosion on the jth up-stream sub-catchment (t·a−1). Aj was predicted with equation (2) using the 20th-century C-factor and R-factor maps derived from WorldClim dataset.
A single Sediment Delivery Ratio representative of the whole Charente catchment was extrapolated from SDR values calculated for the 185 sub-catchments. Values were first tentatively correlated with a set of explanatory variables, according to known relationships (e.g., catchment area, Williams and Berndt, 1977). None of these correlations proved satisfactory with R2 values not greater than 0.30, and thus could not serve as a basis for extrapolation. As an alternative, 10 000 bootstrap iterations were run for each gauge station to better constrain the uncertainty in predicted Sediment Delivery Ratio. SPMj values were randomly sampled from available data. SPM was monitored in gauge stations at an irregular sub-seasonal rate, which results in an underestimation of the annual sediment load by 85% at most (Coynel et al., 2004). A correction was therefore applied. The MFj values were randomly generated (normal distribution with predicted flow and standard error of prediction).
4 Results
4.1 Input variables
Soil erodibility K and topography L and S factors were considered time-invariant since 1500. K is 0.026 ± 0.005 t·h·MJ−1·mm−1 on average, ranging between 0.007 and 0.048 t·h·MJ−1·mm−1 (Fig. 3a). The distribution across the catchment is relatively homogeneous. Combined L and S factors are 0.43 on average (1-σ range: 0.15–1.22), values greater than 2 accounting for less than 3% of the catchment (Fig. 3b). Globally, terrains located across the left bank of the Charente river have larger LS values, especially on Massif Central foothills.
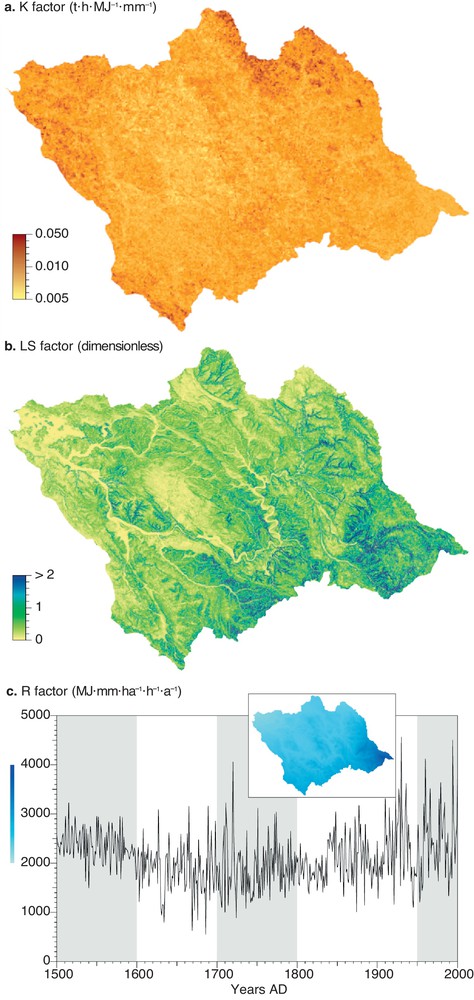
(Color online.) a. Map of the soil erodibility K factor. b. Map of combined slope length L and steepness S factors. c. Evolution of the R factor computed from Pauling et al. (2006) dataset, averaged over the catchment. The range of standard deviation is smaller than the line width. The grey-shaded areas indicate the time extent of modelled scenarios. The inset shows a map of the R factor computed from WorldClim dataset.
Rainfall erosivity R and land cover C factors varied through time. Compared to the 20th-century situation, the R value computed from Pauling et al. (2006) dataset, Fig 3c, Table 2) was significantly lower in the 18th century by about 21% (two-sample one-sided Student's t test, t = –4.464 and p = 0), while the R factor in the 16th century was similar (t = –0.419 and p >0.05). Inversely, the C factor averaged at the catchment scale was higher in the 18th century (0.219 ± 0.093, Table 2), compared to the 16th (0.187 ± 0.115) and 20th centuries (0.184 ± 0.117). Most changes in the C factor across scenarios are related to variations in the forest cover (Fig. 4). The present-day forest represents 17.4% of total Charente catchment area, compared to 6.0% in ca. 1770 (Cassini's historical maps) and 22.3% in ca. 1550. The deforestation of the 18th century was particularly significant to the east: on terrains higher than 100 m, the forest cover was 3.9 times smaller than in 2000. It was highly fragmented, with 93% of forest patches smaller than 1 km2, although a few forest cores larger than 10 km2 persisted to the north and to the east. The distribution of the forest cover in the 16th century is comparable to that of the 20th century, hence explaining the similar average C-factor values.
Average R- and C-factor values of scenarios.
| Scenario | Land cover (%) | C factor | R factor (MJ·mm·ha−1·h−1·a−1) | |||||
| Wetland | Water | Pasture | Urban | Forest | Crop land | |||
| 16th century | 0.1 | 0.2 | 8.6 | 1.1 | 22.3 | 67.7 | 0.187 ± 0.115 | 2362.9 ± 199.5 |
| 18th century | 0.1 | 0.2 | 8.6 | 1.9 | 6.0 | 83.2 | 0.219 ± 0.093 | 1906.1 ± 151.8 |
| 20th century | 0.1 | 0.2 | 8.6 | 4.1 | 17.4 | 69.6 | 0.184 ± 0.117 | 2405.9 ± 233.0 |
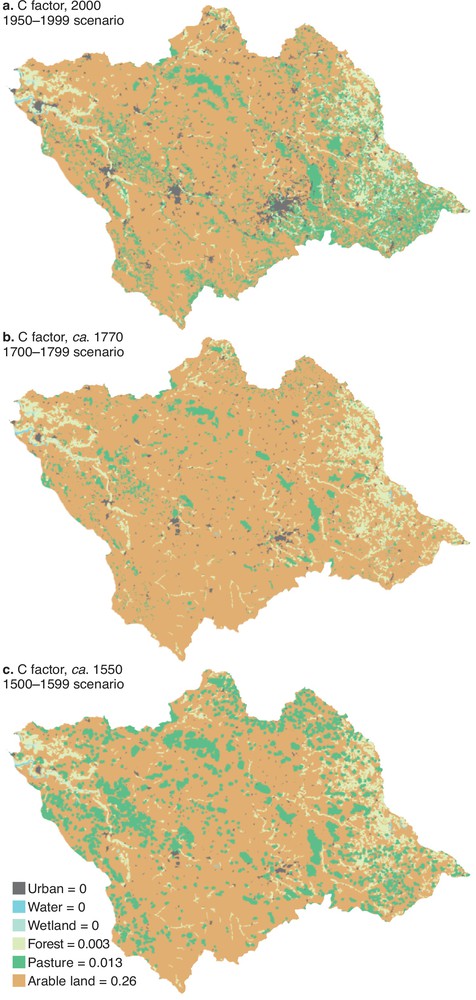
(Color online.) Maps of the crop management C factor for each modelled scenario.
The 185 gauge stations retained for estimating the Sediment Delivery Ratio were associated with up-stream catchments ranging between 3.2 and 7413.5 km2, 80% of which being smaller than 500 km2. Based on 1.85×10⁶ bootstrap samples, the predicted Sediment Delivery Ratio was log-normally distributed, with a mean of 0.591% (1-σ range: 0.231–1.515). The distribution of values across the catchment was homogeneous.
4.2 Model output
There is little difference in spatial patterns of soil erosion rates across the three scenarios. Globally, erosion greater than 20 t·ha−1·a−1 prevails to the south, where high LS values (Fig. 3c) are combined to extensive crop lands with a high C value. Erosion is lower than 1 t·ha−1·a−1 on pasture land and forests (e.g., 0.255 ± 0.217 t·ha−1·a−1). Changes over time were most significant to the east, on terrains higher than 100 m, where the contribution of high LS values of the Massif Central foothills was mitigated by large fluctuations in forest cover, with a low C value.
Based on the R factor computed from WorldClim dataset and estimation of Sediment Delivery Ratio, the predicted sediment load for the 20th century land cover scenario is 32 141.5 t·a−1 (1-σ range 12 541.3–82 374.0). The sediment load predicted with the rainfall dataset of Pauling et al. (2006) is 16.9% lower, owing to the much coarser cell resolution and because R values are themselves lower by about 8% (one-sample two-sided Student's t test, t = –2.20 and p = 0.03). For the consistency of results, a correction was therefore applied. The predicted sediment load of the Charente river did not change drastically over the modelled period (Fig. 5). Values slightly decrease through time, from 36 932.9 ± 5045.6 t·a−1 on average (16th century) to 34 939.3 ± 10 204.2 t·a−1 (18th century), and then to 32 141.5 ± 9381.7 t·a−1 (20th century). The difference is significant only between the 16th and 20th centuries (one-sided t = 3.38, p = 0).
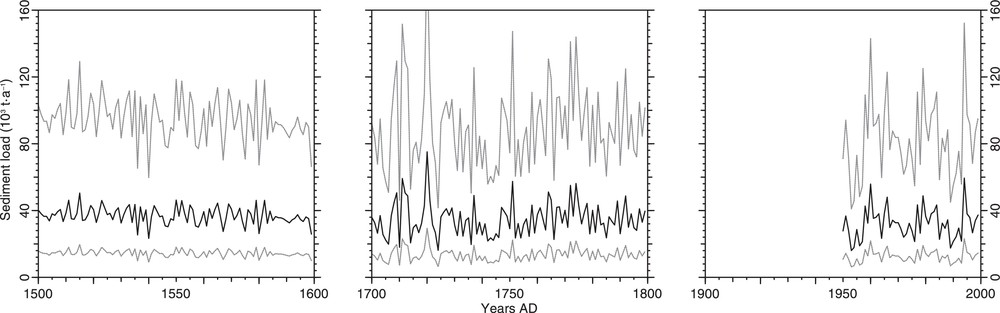
Evolution of the modeled Charente river sediment load from 1500 to 2000. The solid black line is the mean value and the dotted grey lines delineate the 1σ interval.
Modelled sediment load time series for the 18th century shows a correlation with high-frequency silt-sand alternations evidenced in the sedimentary record (Fig. 6). Curve matching was performed by Dynamic Time Warping (DTW) algorithm with the Rabiner–Juang VI-d step pattern and a 3-year moving window (implementation in dtw package, open-source software R, Giorgino, 2009). The match is significant from about 1700 to 1750 and corresponds in the core to the top of stratigraphic unit UT4.1 (Fig. 1b,c), where grain size variability is the greatest. Sediment load minima are linked to silt-poor (i.e. sand-rich) layers, and maxima to silt-rich layers. The inferred average sedimentation rate from 1700 to 1750 is 13.4 mm·a−1.
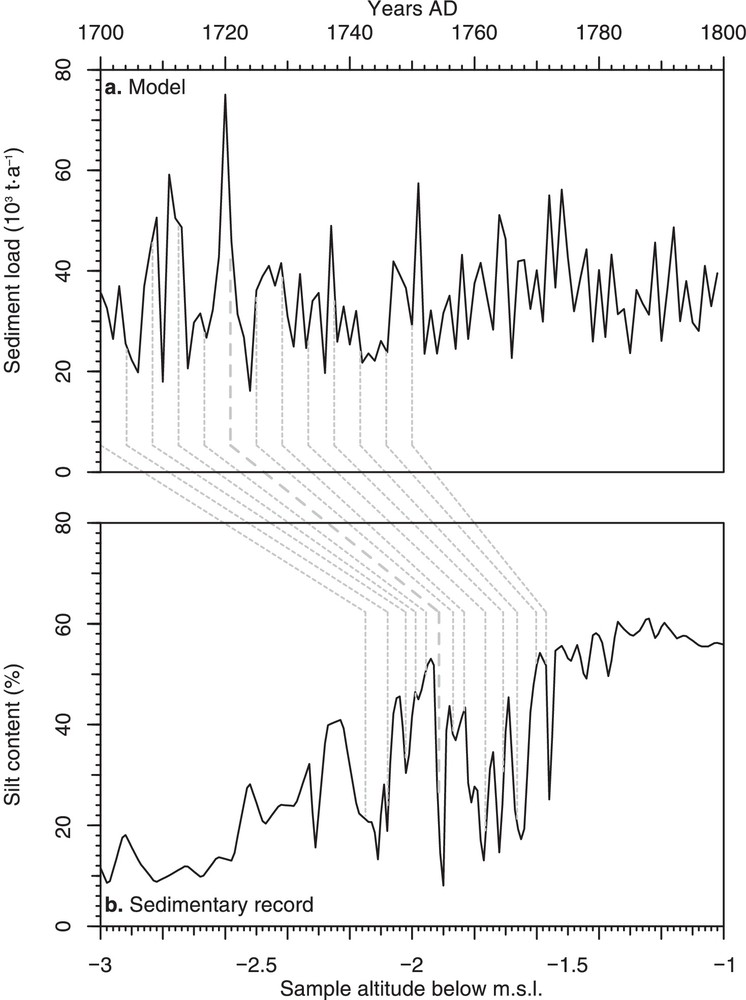
Correlation between (a) the modelled Charente river sediment load in the 18th century and (b) the silt content in the sediment record. The x-axis corresponds to the grain-size sample altitude relative to the mean sea level (m).
5 Discussion
5.1 Model uncertainties and performance
Although equations have been carefully parameterised with the literature, some uncertainties in the correct estimation of soil erosion rates by RUSLE remain. Combined together, LS and C factors account for 94.8% of the total variance in soil erosion predicted with 20th century land cover and WorldClim climate dataset. Sources of error in LS and C estimation include (1) rill to inter-rill soil erosion ratio a (equation 4), which was arbitrarily set without calibration, and (2) the choice of C-factor values (Table 1). However, average predicted rates of soil erosion for the 20th century (2.16 t·ha−1·a−1, 1-σ range 0.31–11.58) are comparable to those predicted on similar temperate catchments with gentle slopes and moderate rainfall (e.g., Van Rompaey et al., 2001).
The predicted Sediment Delivery Ratio for the Charente catchment is extremely low (<1.5%), but is close to the range of the prediction of Walling (1983) based on a log-linear relationship with the catchment area that gives a SDR around 2 %. On passive margin catchments with subdued topography, low drainage density and small sediment source areas, disconnected landscapes hamper the conveyance of sediments towards catchment outlet (Fryirs et al., 2007), hence explaining the low SDR values obtained here.
The coupled RUSLE–SDR model predicts a present-day Charente sediment load of ca. 32 000 t·a−1. Taking the 1-σ error margin into account, our value is in the range of previously published estimates, which vary by more than one order of magnitude from 17 000 to 380 000 t·a−1 (Table 3). It is slightly underestimated, probably as a consequence of the combined use of coarse, irregular SPM monitoring (Coynel et al., 2004) with prediction of annual average water flow that omits hydrological extremes. Despite all these approximations, the results are globally relevant and validate the methodology of the study, especially regarding the parameterisation of equations. We emphasise that the correct prediction of present-day Charente sediment load is not an artefact related to the use of river SPM concentration data in SDR calculation (see section 3.3). SPM data were obtained mostly on small tributaries (80% of sub-catchments smaller than 500 km2) representative of local river conditions, and not of the global Charente catchment.
Estimates of the present-day Charente river sediment load.
| Sediment load (103 t·a−1) | References | Comments |
| 17 | Probst (1983) in Jouanneau et al. (1999) | Unknown method |
| 32.1 (1-σ range 12.5–82.4) | This study | |
| 41 | Gonzalez et al. (1991) | SPM monitoring at unknown location, 1971–1981 |
| 50 | Jouanneau et al. (1999) | SPM monitoring at unknown location, 1974–1984 |
| 50–100 | Tockner et al. (2009) | Estimate |
| 100 | Tesson (1973) | Estimate |
| 200 | Milliman and Farnsworth (2013) | Estimate |
| 380 | Moatar et al. (2006) | SPM monitoring at Taillebourg, 1999–2002 |
5.2 Centennial variability in sediment supply
By analogy with the abundant literature documenting reservoir siltation within historical times, Poirier et al. (2011) have hypothesised that the increased deposition of fine-grained sediments observed in the Pertuis charentais area could be a consequence of post-15th-century forest clearance (Mather et al., 1999). Indeed, land-use/land-cover changes act as the primary controlling factor on soil erosion rates relatively to climate changes (Ward et al., 2009). The aggravated siltation in the 18th century was attributed to a short-lived increase in winter rainfall on soils affected by deforestation (Poirier et al., 2011). Yet, modelled rates of Charente river sediment supply are remarkably stable in time. The catchment was 2.9 times more deforested in the 18th century compared to present-day conditions, but rainfall were 26.2% less erosive on average, resulting in a difference in sediment supply not greater than 8.7%. Despite increased inter-annual variability (Fig. 3c), slightly drier climate compensated for forest cover loss.
There is a clear mismatch between the nearly stable evolution of predicted Charente river sediment load and the increase in silt content recorded in M7UC01 core (Fig. 1d), which is at first sight counter-intuitive. The suitability of Pauling et al. (2006) paleoprecipitation dataset could be questioned. In data-poor regions, few alternatives to gridded climate data exist, but spatio-temporal biases could undermine the confidence in results obtained from the misuse of such reconstructions (Fortin and Gajewski, 2012). The application of these rainfall data to RUSLE should be restricted to periods and areas for which good to excellent reconstructive skills are reported, such as the 18–20th-century winters over the British Isles, the Iberian Peninsula, France, and Germany (Pauling et al., 2006). In our case, Pauling et al. (2006) data are in accordance with more recent proxy records of extreme precipitation events (Wilhelm et al., 2012, and references therein) reporting much decreased flood frequency and intensity in the French Alps and Pyrenees during the 18th century. Similar predicted sediment load values are obtained when the coupled RUSLE–SDR model is supplied with the more reliable winter rainfall only, which does not question the validity of our results.
The relevance of stratigraphical and sedimentological data could also be questioned. We stress that M7UC01 core does not record local changes in sedimentation, but provides instead a robust record of fluvial sediment supply since the last few centuries, given the analogies with other regional deposits (see section 2.1). It is unlikely that siltation of the Marennes-Oléron bay is a consequence of post-depositional reworking of older fine-grained sediment layers. Late Holocene sediment fill buried under the silt drape is dominated by fine to coarse sand deposits (Allard et al., 2010; Billeaud et al., 2005; Chaumillon and Weber, 2006; Chaumillon et al., 2004; Poirier et al., 2011). The bay is a sheltered, tide-dominated environment with a positive sediment budget, where waves coming from north to west directions are strongly attenuated and diffracted (Allard et al., 2010, and references therein). Contradicting fine-grained sediment fluxes induced by tidal and wave currents compensate each other on annual timescales (Bassoullet et al., 2000).
The poor contribution of the Charente river to fine-grained sediment inputs in Marennes-Oléron bay is more likely to explain the discrepancy between model output and core data. On the eastern Marennes-Oléron bay tidal flat, the silt layer deposited since 1800 is about 1.3 m thick and covers about 25 km2 (Fig 1b,c). Assuming a bulk density of 1.3 t·m−3 (unpublished gamma-density data) implies an average silt deposition of ca. 213 000 t·a−1. Based on our results, the Charente river would therefore account for only about 15% of the total silt deposition, and no more than 39%. This estimate is fully consistent with Dabrin et al. (2014), who have shown that 16% of total SPM inputs to the bay were provided by the Charente river and 84% by the Gironde estuary on average. Together, these data prove that our estimate of Charente sediment load, although in the low range compared to previously published values (Table 3), is quantitatively correct because it is in agreement with silt layer thickness and deposition rate (Fig 1c Poirier et al., 2011). Results also strengthen the view that the Charente and other small coastal rivers are minor contributors to the historical siltation of the Pertuis charentais area.
Although rainfall erosivity shows a much similar 18th century drying trend on the Gironde catchments (correlation of time series, R2 = 0.79, p = 0, Pauling et al., 2006), deforestation was more intense compared to the case of Charente (4.4 times less forest than now, Vallauri et al., 2012). Applying soil erosion models to the Gironde catchment would therefore help to determine whether catchment-scale differences in forest cover dynamics can explain the observed sedimentological trends, and if the stability of Charente river sediment supply since 1500 is anomalous or not. Further work is required however to reduce computation cost, as the Gironde catchment is more than 8 times larger than the Charente one. In addition, steeper slopes on the Pyrenean foothills lie beyond the range of applicability of LS equations (4) and (3.1), which should be adapted.
5.3 Sub-decadal variability in 18th-century sediment supply
Modelled sediment load from 1700 to 1750 was correlated with silt content in the sedimentary record (Fig. 6). This correlation could be evidenced only on heterolithic (i.e. mixed sand and silt) sediment layers of the 18th century. Such millimetre- to centimetre-thick sand-silt alternations deposited in estuarine environments are typically considered as an imprint of tidal currents (e.g., Tessier, 1993). They can be also produced by wave currents, although this is unlikely on the tide-dominated eastern Marennes-Oléron bay intertidal flat. Given that modelled sediment load is correlated to rainfall erosivity R factor and thus to precipitation rates, we conclude that high-frequency climate variability exerts a significant control on inter-annual sedimentation of river-influenced coastal environments. To our knowledge, this topic is original and should be explored further.
Results also indicate that the comparison between core data and model output can also provide independent chronological markers that would complement age-models usually based on 14C and other radiogenic dating techniques. The average sedimentation rate inferred from DTW curve matching (about 13 mm·a−1 from 1700 to 1750) is consistent with values previously obtained and indicates a 4-fold increase in sediment accumulation compared to present-day rates (Poirier et al., 2011).
6 Conclusion
Despite approximations, our coupled RUSLE–SDR model correctly predicts current rates of the Charente river sediment supply to the Marennes-Oléron bay. The model was supplied with realistic scenarios of land cover and rainfall, but gave surprising results compared to the reference sediment record. The bay is a complex area fed with multiple sources of fine-grained sediments, and further work is therefore needed to determine how the contribution of these sources has evolved in historical times. An interesting correlation between model output and sub-decadal silt-sand alternations was evidenced, suggesting that high-frequency climate variability is a significant forcing factor on sedimentation patterns in river-influenced coastal environments.
Acknowledgments
We thank the invited editors Philippe Joseph, Vanessa Teles, and Pierre Weill for giving us the opportunity to submit this work. We are indebted to Dr. John Boyle (University of Liverpool) and Mr. Andrew Swales (NIWA) for their meticulous review and inspiring comments, which have greatly helped us in the revision process. Unpublished Sr–Nd isotopic analyses were carried out by Sidonie Révillon (SEDISOR). Geospatial data owned by the Institut géographique national (IGN) have been used according to the “Enseignement et Recherche” license attributed to C. Poirier's host institution.