

1 Introduction
Carbon Science spreads over numerous fields including Earth Sciences and Astronomy as well as the material sciences and industrial products. It is traditionally connected to fossil fuels, i.e. coal and oil, and their derived industrial carbon materials, i.e. coke and graphite, generated by various pyrolysis-based processes. Such geomaterials are involved in a large part of the heavy industry ranging from iron and steel making, to electrometallurgy, etc. Moreover, during the past few years, very promising nanomaterials emerged such as carbon nanotubes, graphene, etc. Such carbon materials are at the core of human activities, yet they are responsible for large CO2 emission and severe pollutions in polyaromatic hydrocarbons, soot nanoparticles, etc. Conversely some of the carbon materials, i.e. active chars, are specifically prepared to remediate such pollutions. Carbon materials are thus at the crossroad of problems linked to resources, energy, and environment. A naturalist makes use of the original fossil fuel for a better understanding of the origin and history of the Earth and the solar system; moreover, he is today expected to extrapolate his knowledge to work on energy resources questions such as fossil fuels (conventional or not) and to contribute to resolving environment questions such as decontamination of irradiated nuclear graphite waste. The originality of our approach is to combine in a single material science strategy both categories of natural and anthropogenic carbons usually studied separately, by using a common approach based on their specific multi-scale organization. The nanostructure, i.e. their organization at the nanometer scale, is usually the pertinent scale for establishing a double correlation between the nature of their precursors and the formation conditions in Nature or in the laboratory on the one hand, and their global properties on the other one. In order to reveal the message carried by carbons, and to understand and forecast their properties, one must visualize the multi-scale organizations of natural and anthropogenic carbons and, if possible, to quantify them.
According to their formation conditions, carbons show very variable organization states (Delhaes, 2009). Thermodynamically stable crystalline forms such as graphite, which is stable at high temperature and low pressure (whereas diamond is stable at high pressure), are well-known, but strictly amorphous carbon forms exist as well. These crystalline and amorphous forms are often the only ones to be considered by researchers who are not specialists of Carbon Sciences. There is however a huge variety of chemically pure and more or less disordered carbons, characterized by various multi-scale organizations. Carbon Science researchers call them “microtextured” carbons, or, to adopt the up-to-date term, “nanostructured” carbons. Each of these organizations is an indicator of the formation conditions (such as precursor nature, temperature, pressure, irradiations, etc.) in the laboratory and in the industry, but also in Nature. A better understanding of the mechanisms responsible for the occurrence of the carbon multi-scale organizations is also a compulsory step when preparing materials with predetermined properties (such as optical properties, chemical reactivity, adsorption, mechanical and transport properties, etc.).
The classical diffraction techniques, giving only averaged structural information such as elemental cell and crystallite size, are often not adapted to the study of carbons, which are usually disordered. In contrast, only High-Resolution Transmission Electron Microscopy (HRTEM) is able to image directly the nanostructure and distinguish various disordered carbons. Moreover Raman microspectrometry has emerged as a technique of choice in the early 1980s to access quantitative results. Raman microspectrometry is now more and more systematically used to characterize natural or industrial carbons, but, up to now, these studies are mostly devoted to the most graphitized carbons.
Reminders on the multi-scale organization of carbons will be first recalled, especially on the notion of nanostructure. Then, the original and extremely fruitful coupling of HRTEM mode imaging and structural characterization by Raman microspectrometry will be presented. This will be illustrated by two examples at the interface between the fields of energy resources and environment, that are directly concerned by the “Bernard and Odile Tissot” Grand Prix awarded by the French Academy of Sciences in 2014. The first two examples consist in:
- • an original 14C decontamination process of irradiated nuclear graphite waste, based on a selective carboxy-gasification;
- • a contribution to the study of non-conventional sources of hydrocarbons such as oil and gas shales where it will be demonstrated that hydrocarbons are trapped in the organic nanoporosity.
Disordered carbon multi-scale organization will be used for a somewhat unexpected application: the study of fire marks in prehistoric caves. In this third example, a novel paleothermometer based on the Raman microspectrometry of wood chars is specifically proposed.
2 Some background in Carbon Sciences; notion of nanostructure
Carbon materials can be either crystalline (graphite or diamond), or amorphous or disordered, depending on their conditions of formation in Nature, in the laboratory or in the factory. By definition, crystals feature a three-periodic order. As an example, graphite results from the stacking of polyaromatic planes now known as “graphene” layers according to an A-B sequence (Fig. 1a), which is responsible for its hexagonal structure. In contrast, amorphous carbons do not exhibit any order, even at a local scale and the distribution of carbon atoms is completely random. However, most real carbons are neither crystallized, nor amorphous, but show a multi-scale organization. Their structure at the atomic scale corresponds to a turbostratic, i.e. biperiodic stacking of a few nanometer-sized layers (Fig. 1b). The stacks constitute the Basic Structural Units (BSU) of such carbons (Oberlin, 1989). Their dimensions usually give evidence of the highest treatment temperature (HTT) reached during their preparation. We call here “nanostructure” the mutual orientation in space of the BSU; this neologism corresponds to the term “microtexture” previously used by the Oberlin school. Different nanostructures can be generated according to the formation conditions. For instance the BSU in chars are locally oriented in parallel and form orientation domains, the extent of which depends on the chemical composition of the precursor, and especially of its oxygen/hydrogen atomic ratio (Oberlin, 1989). The random three-dimensional distribution of such domains is responsible for a porous nanostructure previously called “crumpled sheet” (Oberlin et al., 1980) shown in Fig. 1c. Such a nanostructure is characteristic of wood-based chars, but also of blast furnace cokes. The pore wall extent corresponds to the domain dimension ranging from a few nanometers for wood-based chars, up to a few micrometers for blast furnace cokes. Numerous other nanostructures can be obtained according to the conditions of industrial carbon material production. For instance, the fibrous nanostructure corresponds to domains which are preferentially parallel to the carbon fiber axis. An example of concentric nanostructure is the onion-like organization of soot, as proposed by Heidenreich et al., 1968 is shown in Fig. 1d.
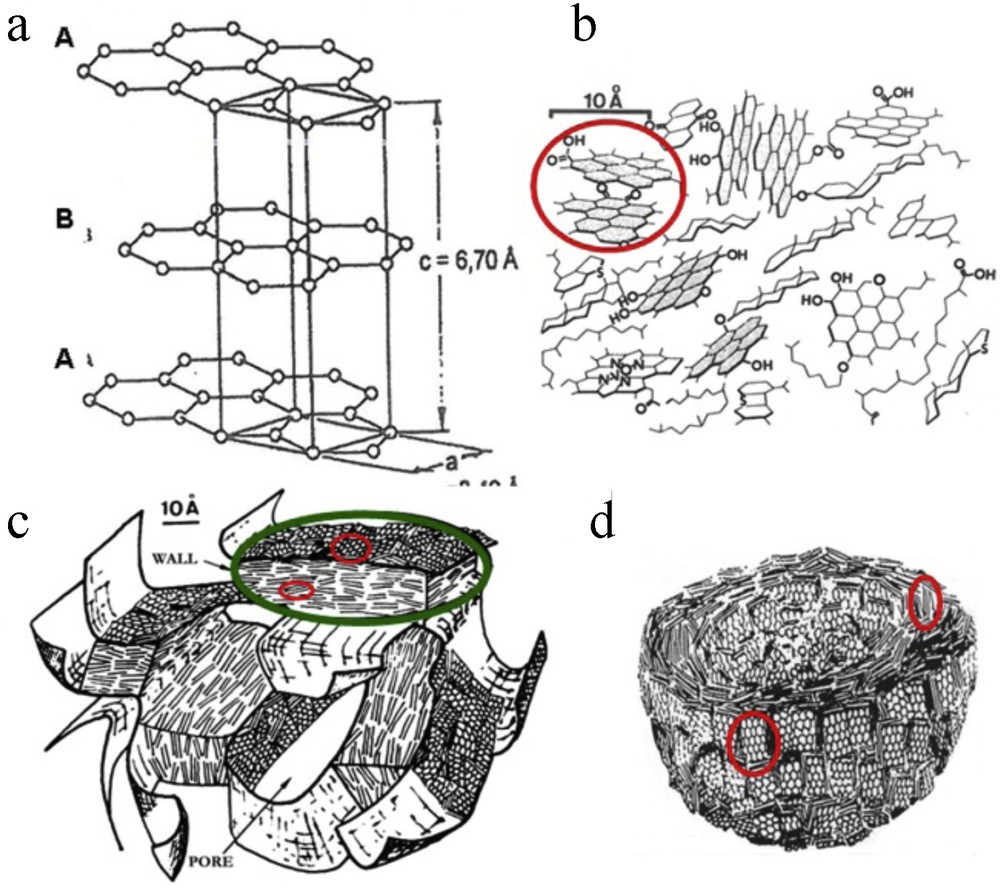
(Color online.) a: hexagonal graphite structure; b–d: three examples of disordered “nanostructured” carbons: all of them are made of Basic Structural Units (some of them are encircled in red); b: immature type II kerogen; c: “crumpled sheet” nanostructure (diagrams b and c from Oberlin et al., 1980); one domain is encircled in green; d: the onion-like nanostructure of soot (Heidenreich et al., 1968). Illustrations CRG Rouzaud et al. (JPEG, 75 mm width).
We should keep in mind that diffraction techniques, i.e. X-ray, electron or neutron diffractions, as well as Raman spectroscopy, only give information on structure and allow the description of an averaged BSU. In contrast, TEM is the only tool giving access to the carbon multi-scale organization and especially nanostructure. With the so-called high-resolution mode of TEM (HRTEM), it is possible to image directly the aromatic, i.e. graphene, layer profile and, therefore, to access the nanostructure. Illustrations are presented in Figs. 3, 5 and 6, respectively, corresponding to virgin and neutron irradiated nuclear graphite (Fig. 3a and b respectively), mature kerogen (Fig. 5a), anthropogenic fire byproducts such as wood-chars (Fig. 6a and b, and Fig. 8b), soot and tars (Fig. 8c and d). The pioneer TEM work of A. Oberlin's school has led to a better understanding of the multi-scale organization of carbon materials. It allows connecting the latter to the precursor nature and formation conditions of carbon materials, and to properties such as chemical reactivity, mechanical and optical properties, etc. (Oberlin, 1989; Rouzaud and Oberlin, 1989). Recently, our team applied this fruitful approach to different categories of disordered carbons involved in energy and/or environment problems such as irradiated nuclear graphite waste (Pageot, 2014; Pageot et al., 2014; Rouzaud et al., 2011), gas shale kerogens (Romero-Sarmiento et al., 2014), and wood-based fire traces (Rouzaud et al., 2014).
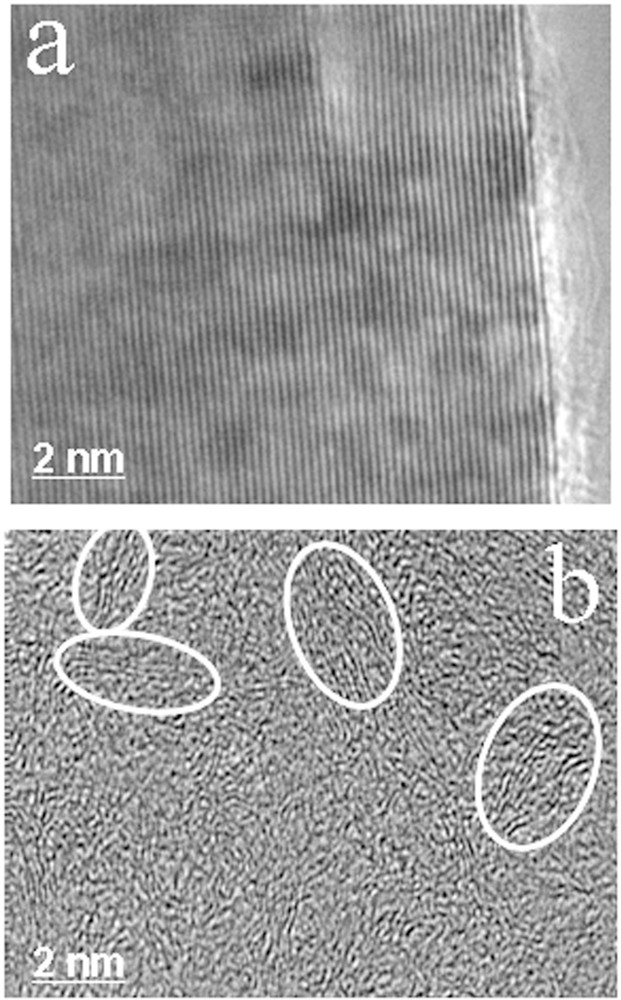
HRTEM images of nuclear graphite: a: virgin graphite characterized by long and perfectly stacked layers responsible for a lamellar nanostructure; b: nanoporous nanostructure locally observed in the most damaged areas of a very irradiated graphite; some disordered nanometer-size domains are circled.
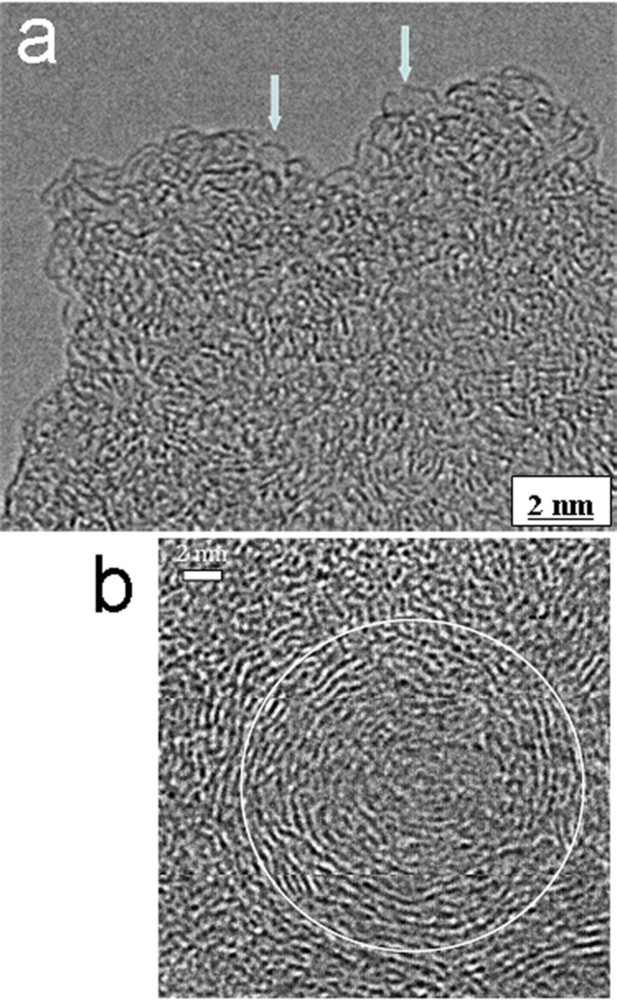
HRTEM images of: a: a nanoporous nanostructure within an oil mature kerogen sample; some individual nanopores are imaged (arrows); b: a gas mature sample showing carbon nanoparticles with a concentric nanostructure.
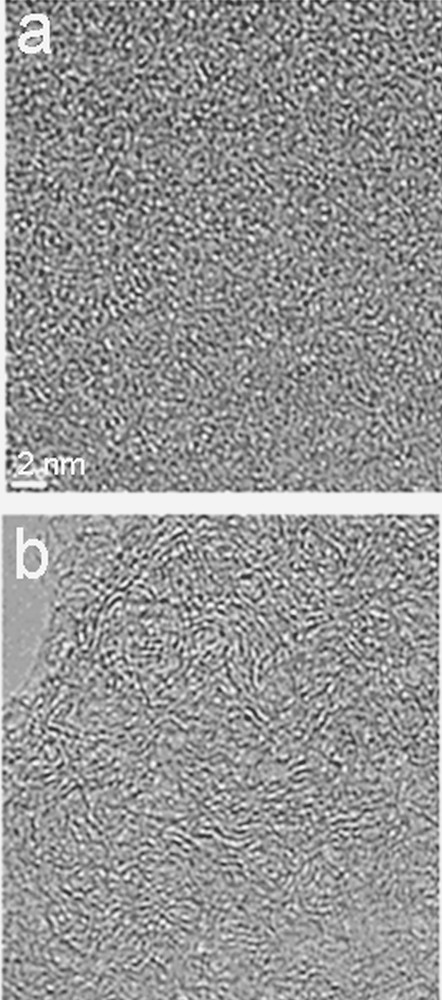
HRTEM image of pine-based chars obtained at 500 °C (a) and 800 °C (b), respectively.
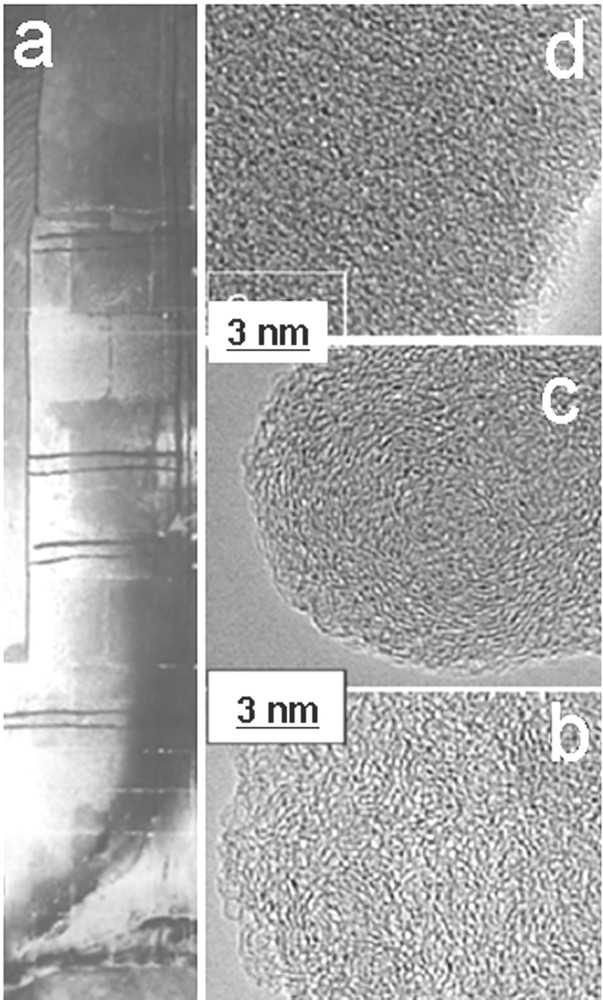
(Color online.) Study of fire traces obtained after an experimental fire in the Lugasson cave (France); a: image of the cave wall after firing; b–d: HRTEM images of a nanoporous wood char heated at about 800 °C, of soot (onion-like nanostructure) and quasi-amorphous tar, respectively.
Raman microspectroscopy is become a very promising tool for Carbon Sciences. This vibrational spectroscopy is sensitive not only to crystal structures, but also to molecular structures of disordered carbons. The Raman signals of graphite crystal result from lattice vibrations and are very sensitive to the degree of structural disorder. The first-order spectrum of a single crystal of perfect graphite shows a single band at 1581 cm−1. Such a band corresponds to the E2g mode (Tuinstra and Koenig, 1970) and is usually called “G band”. Disordered carbons systematically show a broad band at about 1350 cm−1 (Tuinstra and Koenig, 1970). The origin of such a band remains highly debated, but is attributed to different types of defects, and is thus named the “D band”. The D band decreases with graphitization during heat-treatment, and disappears only if the precursor is graphitizable (Bény and Rouzaud, 1985; Bernard et al., 2010). We will explain below that the first step corresponds to a carbonization, whereas only the second one is an actual graphitization process, i.e. a crystal growth. The crystal diameter (La) is inversely proportional to the ID/IG intensity ratio (Bernard et al., 2010; Ferrari and Robertson, 2000; Tuinstra and Koenig, 1970). Raman microspectrometry has become a very relevant tool in geology to follow natural graphitization during regional metamorphism under the combined effects of temperature and pressure. The ID/IG surface ratio or R2 ratio provides an especially relevant geothermometer dedicated to studies of regional metamorphism (Beyssac et al., 2002). The D band is very broad and can be decomposed in several “sub-bands” in the case of most disordered natural or anthropogenic carbons. We chose in our work a decomposition into 5 bands, i.e. one G band and 4 D bands, following the procedure proposed by Sadezky et al. in 2005. Such spectrum decomposition is presented in Fig. 2a. The most intense defect band is the D1 band maximum at ∼ 1350 cm−1 correlated with the graphene layer extent. Using such band decomposition, Lahfid et al., 2010 were able to extend their investigation of lower natural thermal alteration down to metagenesis (however, without reaching the catagenesis step where hydrocarbons are formed).
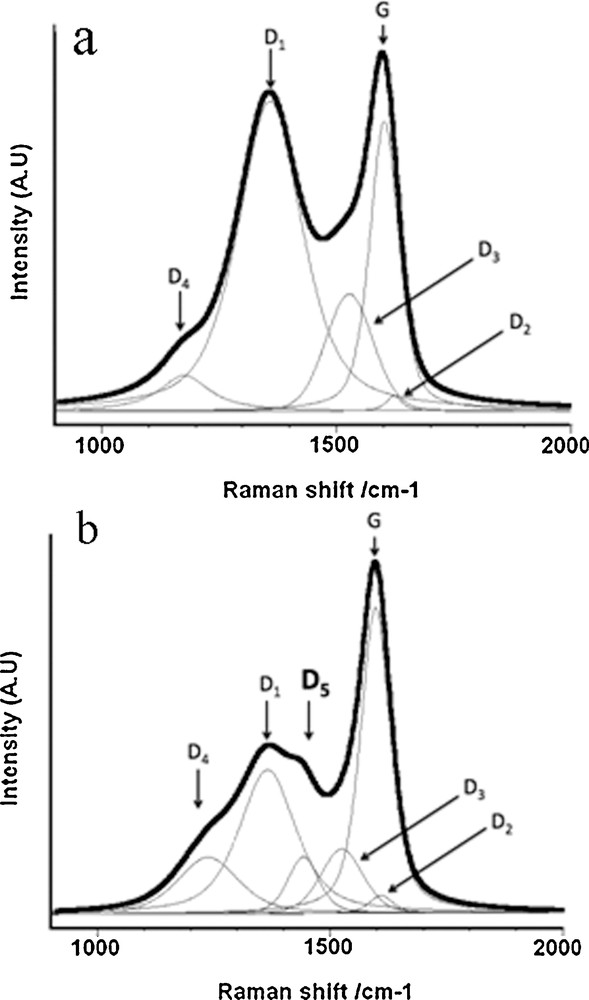
Raman spectra of disordered carbons: wood-based char obtained at (a) 1100 °C; (b) 500 °C, very similar to the spectrum of a gas shale at the beginning of the catagenesis step. Spectrum a was decomposed into five bands, following the procedure proposed by Sadezky et al., 2005, whereas an additional sixth band (D5) is obviously required for spectrum b.
We systematically coupled Raman microspectrometry with HRTEM in the present work, to obtain averaged structural data and nanostructure imaging, respectively. The Raman study was performed with a Renishaw Invia microspectrometer, using an Ar+ laser (λ = 514.5 nm). HRTEM imaging was obtained with a Jeol 2011 TEM working at 200 kV and with a point resolution better than 0.3 nm.
3 Decontamination of irradiated nuclear graphite waste
The first generation of nuclear reactors, developed in France in the 1950s and 1960s, involved natural uranium as the fuel, graphite as the moderator and CO2 as the coolant. It was called “UNGG” for Uranium naturel–Graphite–Gaz. The last UNGG reactors were shut down in the early 1990s. Their dismantling will generate in France 23,000 tons of irradiated graphite versus 250,000 tons worldwide. To evaluate different scenarios for the storage of such waste, it was necessary to understand:
- • what are the damages recorded by graphite during neutron irradiation;
- • where could the major radionuclides, i.e. 14C, 36Cl, etc., also created by neutron irradiation, be concentrated and;
- • how could the main contributor of waste activity, i.e. about 1 ppm 14C, be eliminated.
Our HRTEM study shows that neutron irradiation is not only responsible for structural damages as shown by Simmons as early as 1965, but also for an unknown drastic nanostructural modification, as illustrated in Fig. 3. The extent of graphene layers in the most damaged areas, i.e. those submitted to the strongest neutron fluences and the lowest operating temperatures, strongly decreased from about 0.1 μm in the virgin nuclear graphite (Fig. 3a) down to 1 nm in the most damaged areas of the most irradiated graphite samples (Fig. 3b). In addition, the pristine lamellar nanostructure of virgin graphite was replaced by a nanoporous nanostructure (Pageot, 2014; Pageot et al., 2014). The latter results in the random disorientation of very small domains a few nanometers in size made of nanometer-sized BSU (Fig. 3b). This shows that the multi-scale organization of the virgin graphite was completely destroyed and appears very different from the classical models where the graphite structure was preserved as a whole, despite the occurrence of local defects. Such a multi-scale organization of the most irradiated graphite is quite similar to the one that is characteristic of blast furnace cokes. Therefore, its reactivity is expected to be completely different from that of the lamellar virgin graphite. Moreover, the radionuclide synthesis being also the result of neutron irradiation, 14C must be preferentially concentrated in these most disordered areas (Pageot, 2014; Pageot et al., 2014). Irradiated nuclear graphite waste is thus a heterogeneous material where much damaged areas that are probably 14C enriched, and less damaged ones coexist, in principle almost free of radionuclide.
The reactivity of blast furnace cokes, i.e. their ability to be gasified by an oxidizing gas such as water steam or carbon dioxide, depends on their nanostructure and especially on the extent of their orientation domains (Rouzaud et al., 1991). Therefore, we propose to preferentially gasify the most disordered parts of the nuclear waste graphite, hence eliminating the major part of 14C concentrated in these areas, without gasifying the whole waste, which is 14C poor. We chose CO2 as an oxidant gas, giving off only CO from the single reaction C + CO2 = 2 CO. This allows avoiding the formation of hydrogen and methane, which are also formed by steam-gasification. 14C is then extracted as 14CO. The principle of this original way of decontaminating nuclear graphite waste 14C was presented for the first time in July 2011 at the World Carbon Conference (Rouzaud et al., 2011). The process relevance was demonstrated by Justin Pageot's PhD thesis (Pageot, 2014). In order to obtain that result, carboxy-gasification experiments were first carried out on non-radioactive analogues, i.e. milled graphite, to determine the gasification temperature range. Thereafter preferential elimination of the most disordered fractions was quantified by combining the HRTEM and Raman microspectroscopy techniques on the very same micrometric particles previously deposited on a lacey TEM grid (Pageot et al., 2014). And last, the decontamination of genuine irradiated nuclear graphite waste coming from two UNGG reactors, i.e. Saint-Laurent-des-Eaux and Marcoule, France, was studied in 2014 on a dedicated device of the CEA (Commissariat à l’énergie atomique, i.e. the French agency for atomic energy) at Cadarache, France. The first results are extremely promising, since 14C is preferentially eliminated (Pageot, 2014; Pageot et al., 2014). For instance, a quarter of the 14C is eliminated by gasification at 1000 °C of a strongly radioactive sample with a [14C]0 = 70,000 Bq.g−1 coming from Saint-Laurent-des-Eaux waste, with a global waste burn-off of only 8% after 6 h, and up to 70% after 24 h with a global burn-off of 41%.
These new observations allow a complete re-examination of waste management and a novel concept for an alternative storage option. The complete de-contamination of the irradiated graphite nuclear waste seems obviously an objective that cannot be attained, since the ultimate 14C atoms are probably included within polyaromatic rings. Such a 14C fraction is thus extremely stable and therefore does not present any practical risk of dissemination in the environment. In contrast, 14C grafted on the graphene layer edges or weakly trapped as interstitial atoms between graphene layers is obviously the most mobile. A simple carbo-gasification pretreatment will probably eliminate completely any labile 14C and avoid dangerous migration during ulterior storage. Residual 14C in the polyaromatic structures is very stable up to at least 1000 °C, a temperature that is inconceivable in the conditions of underground storage, even at a 500-m burial depth. Experiments are in progress, which show it is possible to catalytically disproportionate the 14CO by-product into very stable and insoluble carbons.
4 Study of the carbonization process - contribution to shale gas characterization
The heat treatment of an organic precursor can be divided into two steps, each one corresponding to a different process:
- • carbonization, which is mainly a chemical process allowing formation of a pure sp2 carbon material, after elimination of heteroatoms such as water, carbon dioxide and (first liquid, then gaseous) hydrocarbons. There is no crystal growth during carbonization;
- • graphitization, which is essentially a physical process, corresponding to crystalline growth within pure carbon, made possible by heat-treatments at very high temperatures, e.g., 3000 °C in industrial processes.
However, when high pressures, e.g., a few Gpa, are exerted in Nature or in presses, the graphitization temperature can be lowered down to 1000 °C (Beyssac et al., 2003; Bustin et al., 1995; Oberlin, 1989). Note that the formation of natural graphite during metamorphism requires also pressures higher than a few GPa (Beyssac et al., 2002; Wopenka and Pasteris, 1993), whereas graphite in carbonaceous meteorites usually results from a completely different mechanism where iron acts as a catalyst starting at 900 °C (Charon et al., 2014).
Unfortunately, carbonization and graphitization are frequently confused, even by some carbon specialists, leading to questionable interpretations, whether in Material or Earth Sciences. We used Raman microspectrometry in our recent work performed on series of natural chars, including terrestrial, extra-terrestrial and anthropogenic chars, in order to easily distinguish carbonization from graphitization (Charon et al., 2014), as shown in Fig. 4. During the carbonization process, the full width at half maximum of the D1 band at 1350 cm−1 (FWHM-D1) decreases, whereas the ID1/IG surface ratio increases. In contrast, during graphitization, FWHM-D1 and ID1/IG simultaneously decrease. Moreover, the Raman spectra of almost all the chars, whatever their natural or anthropogenic origins, are gathered in a rather narrow band that we called the “carbonization band”.
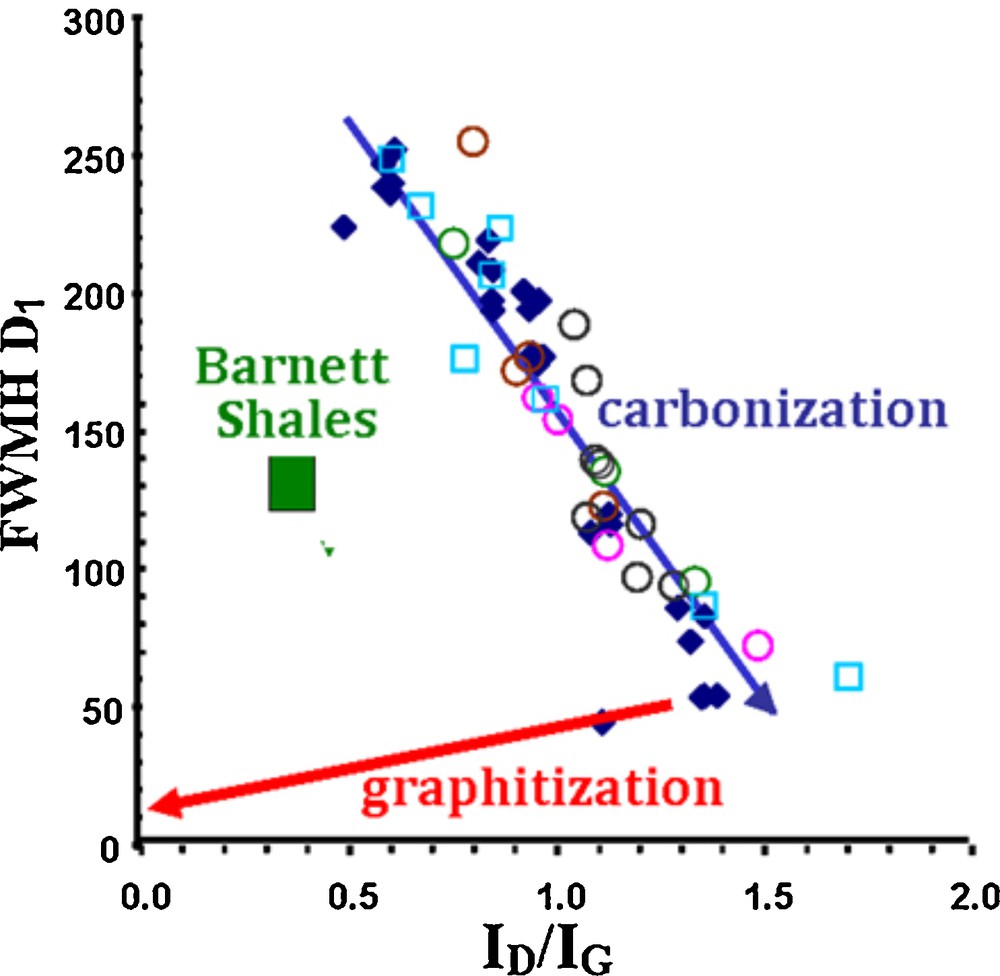
(Color online.) Raman study: FWHM-D vs ID1/IG plot allowing one to discriminate the carbonization and the graphitization paths. The Barnett shale samples (green square) are clearly below the carbonization line.
It is now widely accepted that the thermal cracking of organic matter (called kerogens) leading to the formation of hydrocarbons, i.e. oil and gas, results from complex physicochemical processes occurring during organic matter carbonization in sediments (Durand, 1980; Vandenbroucke and Largeau, 2007). HRTEM images show that all such kerogens are made up of the nanometric BSU described above (Fig. 1b) and forming different nanostructures according to their thermal alteration. These are kept random by different cross-links (such as oxygenated chemical functions, aliphatic chains grafted on the BSU edges, etc.) in an immature kerogen, i.e. before oil formation (see Fig. 1b, corresponding to a type-II kerogen of marine origin). On the other hand, small aromatics or naphteno-aromatics remain trapped between the BSU (Oberlin et al., 1980, revisited by Vandenbroucke and Largeau, 2007). Increased burial is responsible for thermal cracking. The bonds between the BSU and the grafted chemical groups are broken during the catagenesis step: water and CO2 are first released. The BSU are now free in a dispersive medium inside which they can reorient locally to form orientation domains. Kerogen is now considered as mature. Cracking of such a medium allows hydrocarbons to be released, first as liquids (this is the “oil window”). The resulting disappearance of the dispersive medium prevents BSU mobility and domains are frozen, with a size depending on the nature of the precursor (Oberlin et al., 1980). Only gaseous hydrocarbons are released with increasing thermal alteration during the following metagenesis step, without noticeable consequences on the orientation domain size. The natural chars thus obtained are characterized by a porous nanostructure (Fig. 1c). Such overmature kerogens tend to be pure carbons, but obviously are very far from graphite. True graphite will form only during regional metamorphism, i.e. under the combined effect of temperature and pressure, and will not form during metagenesis when pressure is negligible.
Organic-rich source rock usually trapped in clays or silts is sufficiently porous and permeable in a conventional hydrocarbon field to allow migration of the hydrocarbons released during the catagenesis and their later possible trapping inside a reservoir, which is usually sandstone. By contrast, such a migration cannot occur in the most impermeable source rocks such as shales. Hydrocarbons remain trapped in the source rock itself, for instance as bitumens. Cracking of bitumens during metagenesis generates the subsequent co-production of gases and pyrobitumen (Bernard et al., 2012b). The latter is probably responsible for an additional decrease of the global rock permeability. However, a strongly debated question remains about the exact location of hydrocarbons in the source rock: they are either trapped in the mineral matrix or in the organic matter. Recent studies indicate the presence of organic pores within gas shale deposits, but the published images show the smallest pores are only submicrometric (Bernard et al., 2012a, 2012b; Loucks et al., 2012). Our work focalizes on the crucial point of direct imaging of pores at the nanometric scale, which is obviously one clue to evaluate the efficiency of recovering modes. Our present contribution combines characterization by Raman microspectroscopy and HRTEM, which are still unconventional methods for such studies. A series of gas shales was sampled (Barnett Shales, Texas). Detailed geochemical studies of kerogens isolated after dissolution of the mineral matter by HCl-HF have been published (Bernard et al., 2012a; Romero-Sarmiento et al., 2013).
As expected, the HRTEM images and the Raman spectra of the organic matter of the samples are characteristic of carbons belonging to the beginning of the carbonization range. Band D is very large and obviously composite. However, all the Barnett shale samples show a remarkable additional band at 1450 cm−1, which clearly emerges from the defect broad band (Fig. 2b). We named this additional band “D5”, which is not detectable in the usual natural or anthropogenic chars and is characteristic of oil and gas shale samples. The presence of such an additional D5 band plays on the decomposition of the broad defect D band and is responsible for an apparent narrowing of the D1 band. The Barnett shales were thus clearly generated below the “carbonization line” presented above (see Fig. 4). A re-examination of various chars using a very low laser illumination (< 0.2 mW) to avoid thermal degradation shows that the Raman spectra of other chars also exhibit a D5 band, e.g., a few specific anthropogenic ones (such as the anthracene-based semi-coke or low-temperature chars, Fig. 2b), and natural ones (such as coking coals). All these carbonaceous matters, and especially coking coals, are known to contain heavy hydrocarbons in their network, which can only be extracted with an organic solvent (Rouzaud, 1990). Therefore, we assign the new D5 band to hydrocarbons trapped in the kerogen itself and not in the mineral matrix of the source rock (Romero-Sarmiento et al., 2014). Raman microspectrometry thus appears to be a very useful tool for the characterization of unconventional hydrocarbon resources: it is a very simple, quick and sensitive technique to detect hydrocarbons trapped in shale deposits.
HRTEM provides us with a direct imaging of nanometer-sized pores in oil mature kerogen samples, and thanks to direct observations up to the atomic scale, it allows us to identify real nanopores (Romero-Sarmiento et al., 2014). Nanopore diameter is smaller than 1 nm (see the arrows in Fig. 5a). Hydrocarbons are very effectively trapped in such small pores of the organic network. Moreover, nanoparticles characterized by a concentric nanostructure (Fig. 5b) are detected in the most mature kerogens of this series, i.e. in mature gas sample, which are known to contain pyrobitumens. Some particles (Fig. 8c) exhibit the onion-like nanostructure (Fig. 1d) characteristic of soot, i.e. carbon nanoparticles resulting from the thermal decomposition of hydrocarbons, and were attributed to pyrobitumen. Our HRTEM observations strengthen the hypothesis of an in situ carbonization of hydrocarbons trapped in the organic porosity and the lack of a noticeable migration. They also allow a better understanding of the usual low efficiency of hydraulic fracturing. Even if the fracturing method could decrease the rock fragment size down to a micrometric scale, the nanopores opened at the grain surface actually represent only a few percent of the total amount of nanopores in the grain volume. That explains why the great majority of the hydrocarbons firmly trapped in such nanopores cannot be released, and also why the quick production drop systematically observed after only a few months production (Vially et al., 2013). Alternative solutions, such as extraction by supercritical fluids could be tested, as suggested by the molecular simulations studies of Botan et al. (2013).
5 Study of pine carbonization. Application to the characterization of fire marks in prehistoric caves
Our final aim was to characterize fire marks, i.e. wood chars and black deposits, on the walls of the Chauvet–Pont d’Arc (France) Paleolithic cave, exhibiting the world's oldest parietal works (36,000 years BP), and belonging to the UNESCO World Heritage list. Our original approach combining HRTEM and Raman was applied to two series of reference chars:
- • a series of laboratory chars obtained by pyrolysis between 500 and 1300 °C, with a 6-h residence time, of pine wood (Pinus sylvestris), a species recognized as having exclusively been used in the Chauvet cave by prehistoric man;
- • wood chars and black deposits sampled in experimental fires realized in the instrumented cave of Lugasson (France) to duplicate the firing conditions in an underground environment (see Fig. 8a).
The structural and nanostructural evolution of the pine-based chars were first analyzed by HRTEM. Starting at 500 °C, 0.5 nm long and usually single graphene layers can be imaged (Fig. 6a). At 800 °C (Fig. 6b), the layers slightly increase in diameter and stacks are formed (2 or 3 layers per stack) to give 1–2-nm sized BSU forming small orientation domains (< 5 nm in size), the disorientation of which is responsible for their “crumpled sheet” nanoporous nanostructure.
Raman microspectrometry clearly shows the structural evolution by a subsequent increase of the D band intensity when temperature increases (Fig. 7a), whereas the defect band is known to decrease during graphitization. The HD/HG height ratio allows the most relevant quantification of the evolution, because it eliminates the often debatable and poorly reproducible spectrum decomposition (Deldicque et al., 2015). A single monotonous curve is therefore obtained by plotting HD/HG height ratio in the 500–1300 °C range (Fig. 7b). We proposed to use such a curve as a Raman paleothermometer to easily determine the highest treatment temperature, with an accuracy of about ± 20 °C. Moreover, we showed that the paleothermometer still works with chars derived from straw or other high plants such as poplar (Deldicque et al., 2015).
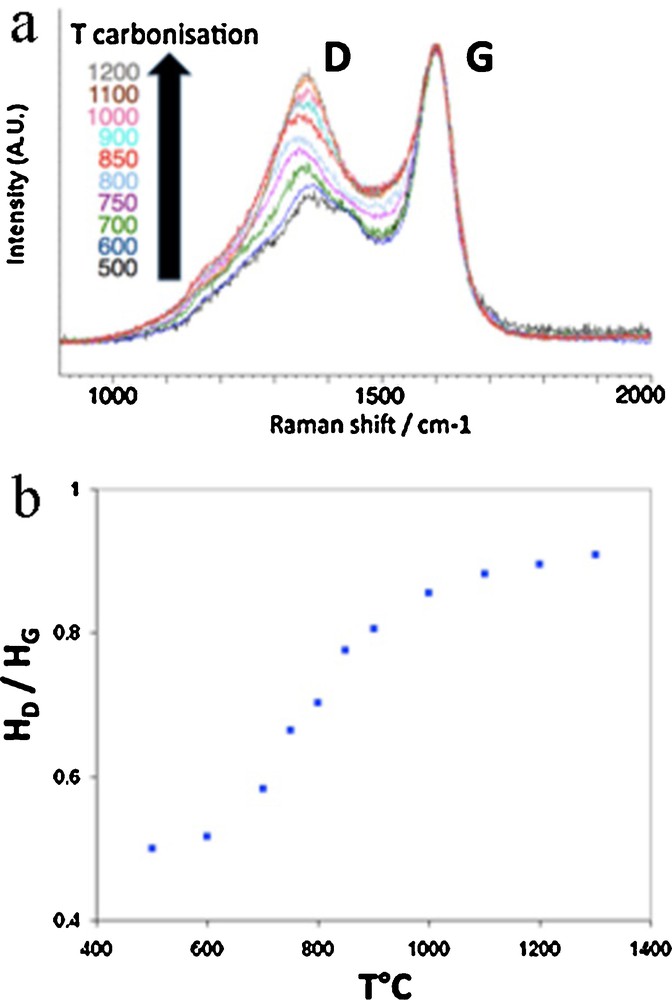
(Color online.) Raman microspectrometry performed on a series of pine-based chars: a: evolution of the Raman spectra obtained from 500 to 1300 °C; b: HD/HG vs temperature of carbonization; this plot is usable as a paleothermometer.
We tested the thermometer on wood chars resulting from experimental fires lit at the Lugasson cave. The highest temperature inferred from our Raman thermometer is 800 ± 50 °C. The latter fits with the temperatures recorded by thermocouples placed inside the fireplace (Fig. 8a).
Our thermometry results appear to be a valuable tool for various applications in archeology. For instance, the method allows a quick and easy determination of the highest temperatures reached in fireplaces cooled tens or hundreds of thousand years ago. Such a temperature measurement is a major progress for a better understanding of the subsequent thermal and mechanical degradation of the cave walls. The latter seems systematic on the Chauvet cave walls, especially where parietal engravings were carved by Paleolithic humans (Ferrier et al., 2014). It is now a major argument to evaluate whether such a wall preparation was intentional or not. Another application of the new Raman thermometer in archeometry is currently implemented on historical and prehistorical ceramics (Deldicque et al., 2015; Rouzaud et al., 2014). Our paleothermometer should help specifying the evolutions of firing methods among various cultures.
Other carbonaceous traces sampled in the Lugasson experimental fire were also identified by HRTEM, as shown in Fig. 8. As expected, wood chars from fire places show the same nanoporous nanostructure as the one described for the pine-based chars generated at 800 °C (Fig. 8b). In contrast, the black deposits on the wall in contact with the fireplace are nanostructurally completely different. Their onion-like nanostructure (Fig. 8c) is characteristic of soot and these carbon nanoparticles obviously result from thermal decomposition of hydrocarbons released during wood carbonization. Farther from the fireplace, soot is no more observed and black deposits are made up of tars, i.e. heavy hydrocarbons, condensed on the colder wall. The tars (Fig. 8d) show a quasi-amorphous structure and no graphene layers were detected by HRTEM.
The nanostructural characterization, combined with this novel Raman-based paleothermometer dedicated to the carbonization processes appears to be an original way to study fire marks left by humans in caves. Such studies could be extended to the characterization of the pigments used for parietal paintings. Note that sampling for HRTEM studies can be restricted to a few microparticles, whereas the development of a portable Raman spectrometer would allow operating the method in situ without any sampling or any physical contact with the very precious traces.
6 Conclusion
Whether natural or anthropogenic, the multi-scale organization is a paramount characteristic of carbons. All of them are made up of BSU, usually nanometric in size. Their nanostructure, i.e. the organization in the nm–μm range, results from mutual orientation of the BSU. It is an extremely sensitive way to determine their formation conditions and a key for a better understanding of these materials. Only HRTEM allows a direct imaging of the nanostructures, whereas Raman microspectroscopy gives more quantitative structural data.
Our coupled HRTEM and Raman approach appears to be especially efficient when studying carbonization phenomena occurring in Nature or implemented by Humans. It provides useful observations of the little studied disordered carbons in the form of pertinent structural and nanostructural data. It also allows revisiting carbons involved in problems associating energy and environment.
Nanostructure is a clue for proposing a relevant decontamination process of irradiated nuclear graphite by governing the reactivity toward gasification of disordered carbons. We show that carboxy-gasification pre-treatment of waste generated by the first generation of French nuclear reactors (called UNGG) induces the release of 14C, which is the major radionuclide of the waste, and especially its labile form. Alternative management scenarios can be now considered on the new experimental bases, such as reversible surface storage, which is less costly and probably safer than the underground geological storage of raw waste still containing possibly labile 14C.
Concerning oil and gas shales, our work shows that Raman microspectrometry is a simple, quick and powerful technique for detecting hydrocarbons trapped within the organic network. We show that they are responsible for a band at about 1450 cm−1, not previously described and that we named “D5”. Our HRTEM observations indicate that mature kerogen is made up of nanometer-sized pores, within which hydrocarbons could be firmly trapped. The data allow a better understanding of the great difficulties in releasing hydrocarbons from such a source rock, even through use of hydraulic fracturing techniques.
The same nanostructural approach combining Raman-HRTEM techniques has unexpected applications in archeology. The various fire markings, such as wood chars, soot, and tars, left by Humans in prehistoric caves can be now characterized on submicrometric particles sampled at different locations. Our new Raman-based paleothermometer, recording the structural improvement of high plant carbonization, appears to be a promising tool for Archaeometry. Other exciting applications can be considered, such as the acquisition of pertinent data on carbons systematically included in ceramics. They will be useful to better understand the knowhow of various cultures.
Acknowledgements
The present work owes a lot to Agnès Oberlin, who implemented an original approach for studying carbons with TEM. Our studies benefited from fruitful discussions with Bruce Velde (ENS, Paris), Sylvain Bernard (MNHN, Paris), Rolland Pellenq (MIT, USA), Maria Fernanda Romero-Sarmiento (IFPEN, Paris), Vincent Courtillot (IPG, Paris), Marc Chaussidon (IPG, Paris), and of the scientific and financial support of ANDRA, the French governmental agency for the management of nuclear waste. Editor-in-Chief Vincent Courtillot and the authors thank José Honnorez (LHyGeS, Strasbourg) for the improvement of the English translation of the original manuscript in French.