Plan
Comptes Rendus

External Geophysics, Climate (Aeronomy and Meteorology)
Tracking pollutants from space: Eight years of IASI satellite observation
Comptes Rendus. Géoscience, Volume 347 (2015) no. 3, pp. 134-144.

Résumé

The IASI mission flying onboard the MetOp satellites has been providing global observations of the air composition twice a day since 2007. From the atmospheric spectra recorded by the instruments in the thermal infrared spectral range, concentrations of a series of trace gases can be monitored, enhanced levels of pollution can be detected, and particle types can be determined to some extent. This paper recalls the historical context for the IASI remote sensor, reviews its capability to observe some key species for global and regional pollution monitoring, and reports on information services that benefit from the mission.

Métadonnées
Reçu le :
Accepté le :
Publié le :
DOI : 10.1016/j.crte.2015.06.001
Mots clés : Satellite, Pollution, Remote sensing, IASI
Cathy Clerbaux 1, 2 ; Juliette Hadji-Lazaro 1 ; Solène Turquety 1 ; Maya George 1 ; Anne Boynard 1 ; Matthieu Pommier 1 ; Sarah Safieddine 1 ; Pierre-François Coheur 2 ; Daniel Hurtmans 2 ; Lieven Clarisse 2 ; Martin Van Damme 2

1 LATMOS-IPSL, Sorbonne universités, UPMC université Paris 06, université Versailles St-Quentin, CNRS/INSU, 4, place Jussieu, 75005 Paris, France
2 Spectroscopie de l’atmosphère, Service de Chimie Quantique et Photophysique, Université libre de Bruxelles (ULB), 50, avenue Franklin-Delano-Roosevelt, 1050 Bruxelles, Belgium
@article{CRGEOS_2015__347_3_134_0,
     author = {Cathy Clerbaux and Juliette Hadji-Lazaro and Sol\`ene Turquety and Maya George and Anne Boynard and Matthieu Pommier and Sarah Safieddine and Pierre-Fran\c{c}ois Coheur and Daniel Hurtmans and Lieven Clarisse and Martin Van Damme},
     title = {Tracking pollutants from space: {Eight} years of {IASI} satellite observation},
     journal = {Comptes Rendus. G\'eoscience},
     pages = {134--144},
     publisher = {Elsevier},
     volume = {347},
     number = {3},
     year = {2015},
     doi = {10.1016/j.crte.2015.06.001},
     language = {en},
}
TY  - JOUR
AU  - Cathy Clerbaux
AU  - Juliette Hadji-Lazaro
AU  - Solène Turquety
AU  - Maya George
AU  - Anne Boynard
AU  - Matthieu Pommier
AU  - Sarah Safieddine
AU  - Pierre-François Coheur
AU  - Daniel Hurtmans
AU  - Lieven Clarisse
AU  - Martin Van Damme
TI  - Tracking pollutants from space: Eight years of IASI satellite observation
JO  - Comptes Rendus. Géoscience
PY  - 2015
SP  - 134
EP  - 144
VL  - 347
IS  - 3
PB  - Elsevier
DO  - 10.1016/j.crte.2015.06.001
LA  - en
ID  - CRGEOS_2015__347_3_134_0
ER  - 
%0 Journal Article
%A Cathy Clerbaux
%A Juliette Hadji-Lazaro
%A Solène Turquety
%A Maya George
%A Anne Boynard
%A Matthieu Pommier
%A Sarah Safieddine
%A Pierre-François Coheur
%A Daniel Hurtmans
%A Lieven Clarisse
%A Martin Van Damme
%T Tracking pollutants from space: Eight years of IASI satellite observation
%J Comptes Rendus. Géoscience
%D 2015
%P 134-144
%V 347
%N 3
%I Elsevier
%R 10.1016/j.crte.2015.06.001
%G en
%F CRGEOS_2015__347_3_134_0
Cathy Clerbaux; Juliette Hadji-Lazaro; Solène Turquety; Maya George; Anne Boynard; Matthieu Pommier; Sarah Safieddine; Pierre-François Coheur; Daniel Hurtmans; Lieven Clarisse; Martin Van Damme. Tracking pollutants from space: Eight years of IASI satellite observation. Comptes Rendus. Géoscience, Volume 347 (2015) no. 3, pp. 134-144. doi : 10.1016/j.crte.2015.06.001. https://comptes-rendus.academie-sciences.fr/geoscience/articles/10.1016/j.crte.2015.06.001/

Version originale du texte intégral

1 Introduction

The World Health Organization (WHO) recently reported that around 4 million people die each year as a result of outdoor air pollution exposure (WHO, 2014). Spaceborne remote sensing instruments probing the troposphere are now able to follow pollution patterns at global, regional and local scales. Rapid changes in air composition can be measured, and episodic events such as large fires, volcanic plumes or pollution peaks over urban areas can be tracked. The IASI mission is now recognized as a key element to monitor and forecast pollution from space.

Back in the late 1980s, French scientists2 proposed the concept of a satellite mission based on a hyperspectral infrared sensor with the aim to remotely sound the troposphere and provide information required for both operational weather forecasting and atmospheric chemistry monitoring (CNES, 1989). The measurement device would exploit the thermal infrared radiation emitted by the Earth's surface, and record the radiance signal altered when passing through the atmosphere and interacting with infrared absorbing molecules. From the measured atmospheric spectra, vertical profiles or total columns could be derived for temperature, water vapor, ozone, and for some other gases playing an important role for climate or atmospheric chemistry. The high spectral resolution would allow disentangling the individual spectral lines, which are specific to each infrared absorbing constituent. Information on coarse particles would also be available to some extent, using their broadband absorption in the atmospheric window.

In the 1990s, the “Centre national d’études spatiales” (CNES) designed the Infrared Atmospheric Sounding Interferometer (IASI; Cayla, 1993), and the Eumetsat agency selected it to be part of the space segment of its Eumetsat Polar System program. Three instruments based on a Fourier Transform Spectrometer were built by the Thales industry to be embarked on the polar orbiting MetOp suite of satellites (Blumstein et al., 2004). MetOp-A was launched at the end of 2006 and is still in operation, followed by MetOp-B launched at the end of 2012. The last flight model will fly on MetOp-C, now scheduled for launch at the end of 2018.

This paper highlights some of IASI's accomplishments after 8 years of operational observations, in particular for the study of reactive gases playing important roles in atmospheric chemistry, pollution buildup and transport.

2 The IASI sounding mission

The IASI instrument measures the upwelling radiances in the thermal infrared spectral range extending from 645 to 2760 cm−1 (3.6 to 15.5 μm), with high radiometric quality, with 0.5 cm−1 spectral resolution, apodized. Apodizing functions are used in Fourier transform spectroscopy to reduce the magnitude of the sidelobes in the instrumental line shape, which are a direct result of the finite maximum optical path difference in the measured interferogram. Each observation represents 8460 radiance channels, from which information on the surface properties and the atmospheric composition and variables can be derived using ad hoc retrieval algorithms (Clerbaux et al., 2009; Hilton et al., 2012). A representative atmospheric spectrum is plotted on Fig. 1, with the absorption features associated with the ro-vibrational spectroscopic lines of the main absorbers identified. A total of 120 views are collected over a swath of ∼ 2200 km using a stare-and-stay mode of 30 arrays of 4 individual elliptical pixels, each of which is 12 km diameter at nadir (increasing at the larger viewing angles). The MetOp satellites are flying at about 817 km on a polar sun synchronous orbit, with around 14 orbits per day, MetOp-A and MetOp-B being half an orbit apart (see Fig. 2, upper panel). The local overpass time for the morning and evening orbits is around 9:30 (see Fig. 2, bottom panel). More than 1.2 million spectra per day are collected by each IASI instrument, from which a significant part is affected by the presence of clouds in the field of view and therefore discarded for the atmospheric composition retrievals. Every orbit batch of data is made available by the Eumetsat dissemination system, so that a near real time processing of the data is possible.

Fig. 1

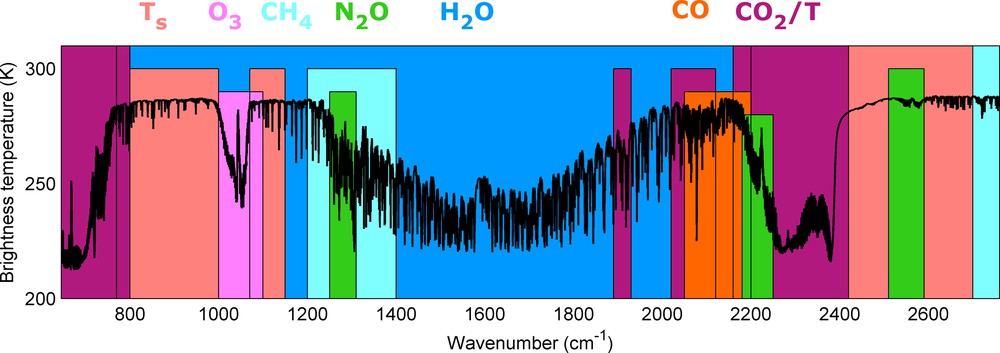
(Color online.) Infrared Atmospheric Sounding Interferometer (IASI) atmospheric spectrum (in brightness temperature units) with the location of the absorption features for the main absorbing species. Temperature profiles are retrieved using the CO2 absorption bands, whereas surface temperature (Ts) and aerosols can be observed in the atmospheric windows (plotted in peach color).

Fig. 2

(Color online.) Top, A: MetOp-A and MetOp-B tandem operation on a polar orbit. A full Earth coverage is ensured each morning and each evening, with more frequent overpasses at higher latitudes. Orbits were plotted using the Ixion software (Capderou, 2005). Bottom, B: local time for the morning overpass (IASI-A) for one day of observation (July 1, 2011). Note that the missing data within the orbit swath correspond to cloud-contaminated data that are filtered out before the trace gas retrieval processing.

3 Observing reactive gases from space

Aside from water vapor (H2O) and the long-lived climate gases [carbon dioxide (CO2), methane (CH4), nitrous oxide (N2O)] providing the main absorptions features observable in this spectral range (see Fig. 1) and not discussed hereafter, it was foreseen that atmospheric abundances could be obtained for some reactive species such as carbon monoxide (CO), ozone (O3) and nitric acid (HNO3) (IASI Science Plan, 1998). Before the launch of the mission, trace gas retrieval tools were developed by our group, using simulated radiance data obtained from radiative transfer calculations along with atmospheric chemistry model simulations (Clerbaux et al., 1998; Hadji-Lazaro et al., 1999, Turquety et al., 2004). Luckily, a somewhat similar thermal infrared nadir looking sounder – the Interferometric Monitor for Greenhouse Gases (IMG) – launched in 1996 onboard the Japanese ADEOS platforms (Kobayashi et al., 1999), provided a few weeks of real data before the platform stopped operating due to a failure of its solar panels. Using this dataset, the processing tools to derive atmospheric concentrations from atmospheric spectra could be tested and improved (Barret et al., 2005; Clerbaux et al., 1999, 2001, 2002, 2003; Coheur et al., 2003, 2005; Hadji-Lazaro et al., 2001; Herbin et al., 2007; Turquety et al., 2002; Wespes et al., 2007).

After a long wait, the first IASI was finally launched on MetOp-A in October 2006. Daily maps are now routinely generated for O3 (Boynard et al., 2009), CO (George et al., 2009) and HNO3 (Wespes et al., 2009). The data are processed in operational mode, “on the fly”, using a dedicated algorithm optimized to process hundreds thousands of data per day (Hurtmans et al., 2012). Fig. 3 presents averages maps for CO and ozone, along with their associated standard deviation. It can be seen that strong regional variability occurs, with larger abundances generally found in the Northern Hemisphere (with a maximum above China), as well as over Equatorial Africa. The standard deviation indicates where the maximum variability lies. A more complete analysis of seasonal maps will be provided in Section 3.1 for CO, and 3.2 for O3.

Fig. 3

(Color online.) Daytime composite images for seven years (2008–2014) of IASI measurements. High values are in red. Upper panels: CO total columns in 1018 molecules/cm2 units (left) and the associated standard deviation (right). Bottom panels: O3 [0–6] km column and variability in Dobson Unit (DU), representative of tropospheric ozone concentration. Note that a grey mask has been put over desert regions for the ozone plots, because of emissivity issues in this spectral region.

Not long after the launch of the mission, it turned out that much more species were measurable than anticipated, owing to the low radiometric noise combined with the exceptional horizontal coverage. We discovered that a series of short lived gases and the less stable isotopic forms of water vapor could be detected, with absorption signatures sometimes just above the instrumental noise levels (Clarisse et al., 2011a; Coheur et al., 2009; Walker et al., 2011). Scientific studies using this wealth of data now include:

Table 1 provides a summary list of all molecules and particles that have been observed so far in the IASI spectra. Some species can be measured everywhere, some are only observed over selected places and time periods. For the stronger absorbers (CO, O3 and HNO3) coarse vertical profiles can be derived by converting the radiances to concentration products. This takes place in an optimal estimation framework, with diagnostic information to estimate the sensitivity of the observation at different altitudes and provide associated errors (Hurtmans et al., 2012). For weak absorbers only total column contents can be derived. Of particular interest among this observable list is ammonia (NH3), a major pollutant and a precursor of particles formation that was never thought to be observable from space before the launch of IASI. Section 3.3 will provide more information on the “discovery” of this molecule. It is worth noting that thermal infrared remote sensors have generally low capability to sound down to the surface, unless there is a significant difference between the temperature at ground level and just above (hereafter called ‘thermal contrast’).

Table 1

Reactive gases and particles (in italic) observed with the IASI mission, along with the information services that use IASI data.

Scientific goal Measured species Information services
Atmospheric composition
 Ozone hole (stratosphere) Ozone (O3)
Nitric acid (HNO3)
ESA Climate change Initiative for assessing the fate of atmospheric ozone and better understand its link with anthropogenic activities: CCI-O3, http://www.esa-ozone-cci.org/
 Pollutants (troposphere) Carbon monoxide (CO)
Ammonia (NH3)
Ozone (O3)
Nitric acid (HNO3)
Sulfur dioxide (SO2)
Ammonium sulfate
CO forecast provided by the pre-operational Copernicus Atmosphere Service (MACC project): https://www.gmes-atmosphere.eu/
Volcanic events
 Volcanic plumes Sulfur dioxide (SO2)
Hydrogen sulfide (H2S)
Sulfuric acid (H2SO4)
Ash
SO2 and ash maps provided to civil aviation through volcanic alerts: http://sacs.aeronomie.be/
Biomass
 Biomass burning CO, O3, HCN, methanol (CH3OH), formic acid (HCOOH), ethane (C2H4), acetylene (C2H2), hydrogen cyanide (HCN) and PAN (C2H3O5N)
 Biogenic activity Methanol, formic acid
Atmospheric circulation and thermodynamics
 Gravity waves T (CO2)
 Evaporation/condensation HDO/H2O
 Dust transport Dust (AOD) ESA Climate change Initiative for producing global aerosol ECV products: aerosol_cci, http://www.esa-aerosol-cci.org/

Finally, both the availability of the data in near real time and the long-term plans for the mission have triggered the integration of the data into operational applications, to feed information services such as (also see Table 1):

The following section illustrates the IASI observation capabilities and downstream applications for the atmospheric sciences for three important pollutants: carbon monoxide, ozone and ammonia.

3.1 Carbon monoxide measurements

CO is a combustion-related pollutant that is mainly emitted by motor vehicle traffic, heating/cooking systems, industrial activities, and biomass burning. With a lifetime of a few weeks, it can be transported over long distances. It is an excellent tracer of pollution, indicative of anthropogenic emissions, biomass burning and atmospheric circulation patterns. It is also a key atmospheric species as it regulates the oxidizing capacity of the troposphere through its destruction cycle involving the hydroxyl radical (OH), and as it is an ozone and carbon dioxide precursor.

From the numerous IASI observations, CO maps can be derived each morning and each evening, both over land and sea. When averaging over longer time periods, observational gaps due to the presence of clouds disappear. Fig. 3 shows the CO global distribution averaged over the period [2008–2014]. It can be seen that background concentrations are higher in the Northern Hemisphere as most of the pollution is associated with urban activity, with persistent elevated levels above China transported by wind towards the west coasts of USA. In the Tropics and Southern Hemisphere, most of the CO is emitted where biomass burning linked to agricultural practices occurs. From the standard deviation maps, we see that the annual variability is mostly associated with the larges fires observed in Africa, South America, Indonesia, and Indochina that vary in intensity from year-to-year.

Fig. 4 illustrates both the seasonal variability and the vertical sensitivity for the CO maps derived from IASI observations. Sunlight triggers OH production and so the chemical destruction of CO is more efficient during the summer months in the Northern Hemisphere, leading to lower concentrations in October than in April. Conversely, as the chemistry is less active during the winter months when insolation decreases, CO accumulates and concentrations peak in early spring. Fire activity in the Tropics follows the seasonal shift in the Inter-Tropical Convergence Zone, moving from South Western Africa in April to South Central Africa in October. Due to long-range transport, high CO concentrations are also observed over the Northern Pacific and Atlantic oceans. The altitude of peak sensitivity for the bottom layer of retrieved CO ranges between around 2 to around 10 km, as can be seen on Fig. 4 (right plots), with most of the information coming from the mid troposphere. This implies that the instrument is mostly sensitive to uplifted and horizontally transported CO, whereas it can miss local pollution events if these are confined near the ground. Interestingly, as pollution peaks are often associated with a temperature inversion in the atmospheric boundary layer (and hence significant thermal contrast), detection at surface level is possible in these cases (see e.g. Boynard et al., 2014).

Fig. 4

(Color online.) Daytime composite images for CO as measured by IASI in April (upper plots) and October 2013 (bottom plots). The left plots represent CO as retrieved near the surface in parties per billion volume units (ppbv), the right plots provide an indication of the altitude where most of the instrument sensitivity originates from.

CO emission inventories still present large uncertainties. These emissions can be constrained by data assimilation (Inness et al., 2013) and source inversion methods (Fortems-Cheiney et al., 2009), and IASI's excellent horizontal coverage proved to be very valuable in that regard.

3.2 Tropospheric ozone measurements

Breathing ozone can cause a variety of health problems. The sources of O3 in the troposphere are either downward transport from the stratosphere or local chemical production within the troposphere. In urban areas, ozone is formed through sunlight-initiated oxidation of volatile organic compounds (VOCs) in the presence of nitrogen oxides (NOx) and CO. Urban population is often exposed to O3 levels exceeding WHO air quality guideline values. Although in Europe emissions of the main ozone precursors have significantly decreased over the past two decades, the levels of ozone have not levelled-off and ozone-related peaks are often encountered in summer.

Since most of the O3 resides in the stratosphere, the remote observation of tropospheric ozone with IASI remains tricky as absorption/emission contributions from both the stratospheric and tropospheric ozone are mixed in the spectra. Fig. 3 (bottom) illustrates the ozone observations averaged during the [2008–2014] period, integrated between the surface and 6 km altitude. In the Northern Hemisphere, the ozone budget can be explained by stratospheric intrusions (mostly at high latitudes), combined with local production over polluted continental areas and transport of O3 and its precursors (mostly at mid-latitudes). The O3 minimum over the tropical Pacific is due to the photochemical destruction by UV light and no source of ozone precursors. Tropical Atlantic O3 distribution between Central Africa and South America is governed by biomass burning and the subsequent transport of O3 and its precursors across the Atlantic. Moreover, and in particular over the South Atlantic, lighting (as a source of NOx) is shown to account for 30% of the O3 burden (Sauvage et al., 2007). The year-to-year variability is mostly driven by meteorological conditions.

Fig. 5 illustrates the ozone seasonal distributions for two representative months: January and August 2013. In general, the tropospheric O3 observed in mid and high latitudes of the Northern Hemisphere are always larger than those in the Southern Hemisphere. At high latitudes in January elevated values are due to the integration of stratospheric air into the [0–6] km column as the tropopause height is low at this time of the year, and stratospheric intrusions are also bringing ozone-rich air from above. Note that the same effect is not recorded in austral winter/spring due to the ozone depletion in the Southern Hemisphere and to the Brewer-Dobson circulation that transports more O3 to the Arctic. In August, high values are measured in the mid-latitudes of the Northern Hemisphere due to the increase in photochemical activity, in particular over East Asia, and eastern/southern Europe. Important summertime O3 maxima are detected every year in the Mediterranean region (Doche et al., 2014; Safieddine et al., 2014). The tropospheric O3 product from IASI is mainly representative of O3 in the mid to upper troposphere (see Fig. 5, right plots), with some seasonal variability. This allows the study of the transport processes in these atmospheric levels using the wind patterns. Like CO, an increased sensitivity near the ground is only possible when there is a significant thermal contrast.

Fig. 5

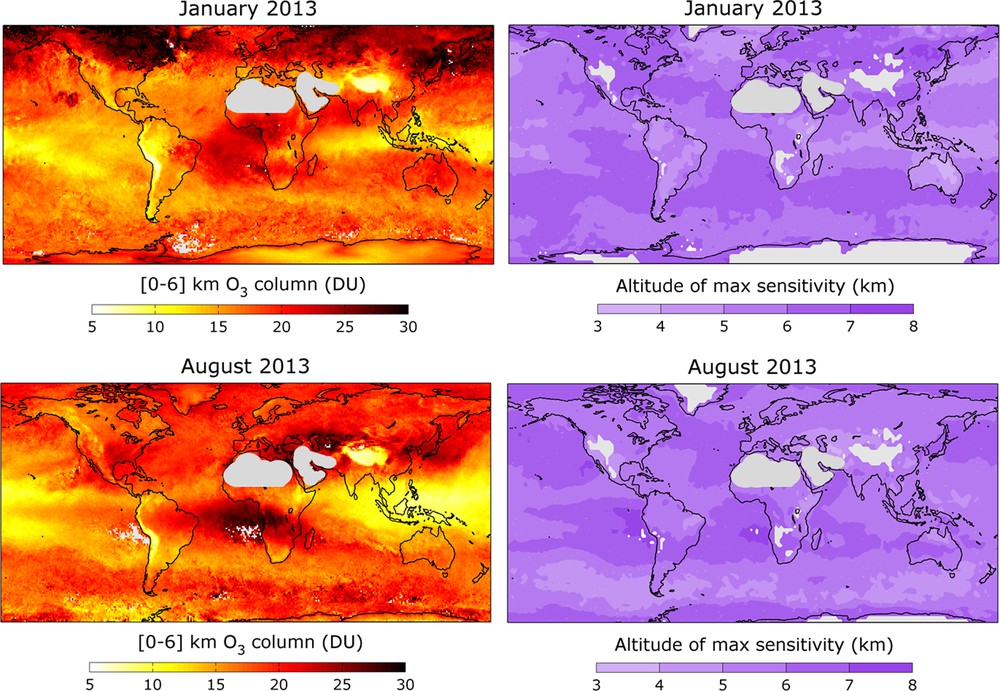
(Color online.) Daytime composite images for tropospheric ozone as measured by IASI in January (upper plots) and August 2013 (bottom plots). The left plots represent ozone partial columns integrated between 0 and 6 km in Dobson Units, the right plots provide an indication of the altitude where most of the instrument sensitivity originates from. Note that a grey mask has been put over desert regions, because emissivity issues affect the observation.

3.3 Ammonia measurements

Ammonia is a pollutant that contributes to the formation of airborne particles harmful to human health, as well as other environmental effects such as acidification of terrestrial ecosystems and loss of biodiversity. It comes from many sources (including fires), but the bulk is a result of livestock and agricultural activities through the use of nitrogen fertilizer. As emissions are strongly influenced by temperature, a concern for the future is that ammonia loading increases with hotter climate. There are still large uncertainties in the magnitude of its emissions as there is very little data available on the global scale. The measurement is difficult, local data are scarce and limited, as the gas has a short atmospheric lifetime, of a few hours to a few days.

The first detection of ammonia by IASI came about nearly by accident. It occurred when studying the composition of the plumes following the large fires that devastated thousands of square kilometers in Greece during August 2007 (Coheur et al., 2009). Interestingly, this compound is optically active in the atmospheric windows which extents from ∼ 800 to ∼ 1200 cm-1 (see Fig. 1) where no other gases absorb, and owing to the very good radiometric performances of IASI, the detection was shown to be possible. By averaging over longer time periods to increase the signal over the background noise, emission hotspots could be identified at middle and low latitudes across the globe (Clarisse et al., 2009). A major effort to develop specific processing tools adapted to weak absorbers was undertaken, leading to systematic day and night observations of ammonia. Fig. 6 illustrates the evolution of the retrieval tools in three steps: the first global map was based on the use of the brightness temperature difference between one NH3-sensitive channel along with two window channels free from absorption (see Fig. 6, upper left plot), by accumulating data over several months to compensate for weak signal. The map revealed sources that had been previously unknown, and it showed high ammonia-concentration regions in South Asia (mainly in northern India), Europe, and California. In a next step, the retrieval method was improved by extending the spectral range used, and a similar method to the one developed for CO and ozone retrievals, based on optimal interpolation, was adapted for NH3 retrievals (Clarisse et al., 2010b). Although it provided better results for large emission sources (see Fig. 6, upper right plot), the daily detection of weaker sources was still difficult. More recently, an improved method for the processing of IASI radiance to derive NH3 columns was developed (see Fig. 6, bottom plots). It exploits the hyperspectral character of the instrument by using an extended spectral range where NH3 is absorbing. It uses look-up tables built from forward radiative transfer model simulations (Van Damme et al., 2014a) to derive NH3 column abundances during daytime and nighttime, over land and over sea, without large computational resources. The retrieval also includes error characterization of the retrieved columns, a quantity directly linked to thermal contrast.

Fig. 6

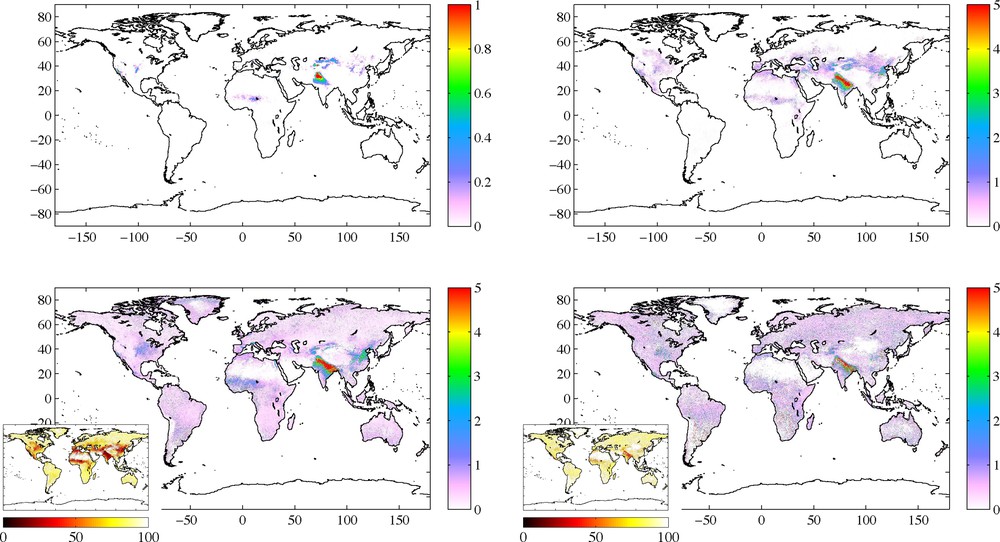
(Color online.) Composite images for NH3 as measured by IASI in June 2009. It shows the evolution of the retrieval methods developed to estimate NH3 total column (×1016 molecules/cm2) from the IASI radiance observations. Upper plot, left: using the early stage brightness temperature difference method (Clarisse et al., 2009); upper plot, right: using an adapted optimal estimation method (Clarisse et al., 2010b); bottom plots, left and right: using the hyperspectral range index method (Van Damme et al., 2014a) for daytime and nighttime observations, along with the corresponding error distributions (%, horizontal color bar).

4 Discussion and future directions

Air quality has become a major concern, and as a result, an important area of research has emerged during the last decade to quantify the emissions of pollutants, to model the chemical and physical transformation leading to the production of secondary pollutants, and to study the transport pathways for the spread of pollution. Remote sensing observation from satellite is increasingly viewed as a means to measure pollution, to monitor atmospheric changes and to control the implementation of environmental policies.

The thermal infrared IASI mission has provided an uninterrupted record of atmospheric spectra since 2007, from which several key atmospheric species can be monitored. As the mission was designed to last for at least 15 years, with one IASI still to be launched, it will provide long and consistent time series. This paper illustrates the findings of the IASI mission for three key pollutants, and discusses the advantages and drawbacks of thermal infrared observation from space. The main advantage of IASI is its global coverage capability, with day and night observation, and its ability to sound remote regions (either not covered by air quality networks or located in countries where the information is not distributed). In contrast to in situ measurements, satellite observation is less accurate, averaged over larger areas determined by the instrument spatial resolution, and also integrated over altitude. For O3 and CO, it was shown that most of the information comes from the mid to upper troposphere, whereas ammonia measurements are representative of surface emissions due to its short lifetime combined with spectroscopic absorption in an optically transparent window. A critical parameter for IASI observation is thermal contrast, which determines the sensitivity of the observation close to the ground. As payload of an operational weather forecasting satellite, the mission also benefited from the near real time processing of the data, allowing the set-up of operational applications to feed information services (volcanic alerts, pollution forecast, etc.).

The continuity of the IASI program is ensured with its successor IASI-NG (Clerbaux and Crevoisier, 2013; Crevoisier et al., 2014), to be launched on MetOp-SG platforms that will continue the long-term observation record provided by IASI after 2021. From the optimized instrumental specifications (signal to noise improved by a factor of 2, as well as spectral resolution), it is expected that more accurate observation will be possible, with an improved sensitivity lower in the atmosphere. IASI-NG will be the infrared companion instrument of the Sentinel 5 series of UV–visible sounders, which will form the space segment of the Copernicus atmospheric service dedicated to atmospheric chemistry, air quality and climate.

Acknowledgments

This is an invited contribution to the special issue “Invited contributions of 2014 geoscience laureates of the French Academy of Sciences”. It has been reviewed by Didier Roche and Editor Vincent Courtillot. Cathy Clerbaux is very grateful to Gérard Mégie for giving her the opportunity to work on the IASI mission and to Marie-Lise Chanin for her scientific enthusiasm and continuous support. This work benefited from the contribution of several PhD students and post-docs both at LATMOS (former “Service d’aéronomie”) and ULB. The French scientists are grateful to CNES and CNRS for continuing scientific collaboration and financial support. L.C. is research associate with the F.R.S.–FNRS. The research in Belgium was supported by F.R.S.–FNRS and Belspo (ESA Prodex arrangements). The IASI mission is a joint mission of Eumetsat and the “Centre national d’études spatiales” (CNES, France). The IASI L1 data are distributed in near real time by Eumetsat through the Eumetcast system distribution. The authors acknowledge the French Ether atmospheric database (http://ether.ipsl.jussieu.fr), Cathy Boonne and Nathalie Poulet-Crovisier for their support. The Ixion orbitography software is available here: http://climserv.ipsl.polytechnique.fr/ixion.html.

2 From Laboratoire de Météorologie Dynamique (LMD), former Service d’Aéronomie (SA) and former Laboratoire de Physique Moléculaire et Applications (LPMA).


Bibliographie

[Barret et al., 2005] B. Barret; S. Turquety; D. Hurtmans; C. Clerbaux; J. Hadji-Lazaro; I. Bey; M. Auvray; P.-F. Coheur Global carbon monoxide vertical distributions from spaceborne high-resolution FTIR nadir measurements, Atmos. Chem. Phys., Volume 5 (2005), pp. 2901-2914

[Barret et al., 2011] B. Barret; E. Le Flochmoen; B. Sauvage; E. Pavelin; M. Matricardi; J.-P. Cammas The detection of post-monsoon tropospheric ozone variability over south Asia using IASI data, Atmos. Chem. Phys., Volume 11 (2011), pp. 9533-9548 | DOI

[Bauduin et al., 2014] S. Bauduin; L. Clarisse; C. Clerbaux; D. Hurtmans; P.-F. Coheur IASI observations of sulfur dioxide (SO2) in the boundary layer of Norilsk, J. Geophys. Res. Atmos., Volume 119 (2014), pp. 4253-4263 | DOI

[Blumstein et al., 2004] D. Blumstein; G. Chalon; T. Carlier; C. Buil; P. Hébert; T. Maciaszek; G. Ponce; T. Phulpin; B. Tournier; D. Siméoni IASI instrument: technical overview and measured performances, Atmos. Chem. Phys., Volume 13 (2004), pp. 8569-8584 | DOI

[Boichu et al., 2013] M. Boichu; L. Menut; D. Khvorostyanov; L. Clarisse; C. Clerbaux; S. Turquety; P.-F. Coheur Inverting for volcanic SO2 flux at high temporal resolution using spaceborne plume imagery and chemistry-transport modelling: the 2010 Eyjafjallajökull eruption case study, Atmos. Chem. Phys., Volume 13 (2013), pp. 8569-8584 http://www.atmos-chem-phys.net/13/8569/2013/acp-13-8569-2013.html

[Boichu et al., 2014] M. Boichu; L. Clarisse; D. Khvorostyanov; C. Clerbaux Improving volcanic sulfur dioxide cloud dispersal forecasts by progressive assimilation of satellite observations, Geophys. Res. Lett., Volume 41 (2014) no. 7, pp. 2637-2643 | DOI

[Boynard et al., 2009] A. Boynard; C. Clerbaux; P.-F. Coheur; D. Hurtmans; S. Turquety; M. George; J. Hadji-Lazaro; C. Keim; J. Mayer-Arnek Measurements of total and tropospheric ozone from the IASI instrument: comparison with satellite and ozonesonde observations, Atmos. Chem. Phys., Volume 9 (2009), pp. 6255-6271

[Boynard et al., 2014] A. Boynard; C. Clerbaux; L. Clarisse; S. Safieddine; M. Pommier; M. Van Damme; S. Bauduin; C. Oudot; J. Hadji-Lazaro; D. Hurtmans; P.-F. Coheur First simultaneous space measurements of atmospheric pollutants in the boundary layer from IASI: a case study in the North China Plain, Geophys. Res. Lett., Volume 41 (2014) no. 2, pp. 645-651 | DOI

[Brenot et al., 2014] H. Brenot; N. Theys; L. Clarisse; J. van Geffen; J. van Gent; M. Van Roozendael; R. van der A; D. Hurtmans; P.-F. Coheur; C. Clerbaux; P. Valks; P. Hedelt; F. Prata; O. Rasson; K. Sievers; C. Zehner Support to Aviation Control Service (SACS): an online service for near real time satellite monitoring of volcanic plumes, Nat. Hazards Earth Syst. Sci., Volume 14 (2014), pp. 1099-1123 | DOI

[Capderou, 2005] M. Capderou Satellites: Orbits and Missions, Springer, Paris, 2005

[Capelle et al., 2014] V. Capelle; A. Chédin; M. Siméon; C. Tsamalis; C. Pierangelo; M. Pondrom; C. Crevoisier; L. Crepeau; N.A. Scott Evaluation of IASI derived dust aerosols characteristics over the tropical belt, Atmos. Chem. Phys., Volume 14 (2014), pp. 9343-9362 | DOI

[Cayla, 1993] F.R. Cayla IASI infrared interferometer for operations and research (A. Chedin; M.T. Chahine; N.A. Scott, eds.), High Spectral Resolution Infrared Remote Sensing for Earth's Weather and Climate Studies, NATO ASI Series, Ser. I, vol. 9, Springer Verlag, Berlin, 1993

[Clarisse et al., 2008] L. Clarisse; P.-F. Coheur; A.J. Prata; D. Hurtmans; A. Razavi; T. Phulpin; J. Hadji-Lazaro; C. Clerbaux Tracking and quantifying volcanic SO2 with IASI, the September 2007 eruption at Jebel at Tair, Atmos. Chem. Phys., Volume 8 (2008), pp. 7723-7734

[Clarisse et al., 2009] L. Clarisse; C. Clerbaux; F. Dentener; D. Hurtmans; P.-F. Coheur Global ammonia distribution derived from infrared satellite observations, Nat. Geosci., Volume 2 (2009), pp. 479-483 | DOI

[Clarisse et al., 2010a] L. Clarisse; D. Hurtmans; A.J. Prata; F. Karagulian; C. Clerbaux; M. De Mazière; P.-F. Coheur Retrieving radius, concentration, optical depth, and mass of different types of aerosols from high-resolution infrared nadir spectra, Appl. Opt., Volume 49 (2010), pp. 3713-3722

[Clarisse et al., 2010b] L. Clarisse; M.W. Shephard; F. Dentener; D. Hurtmans; K. Cady-Pereira; F. Karagulian; M. Van Damme; C. Clerbaux; P.-F. Coheur Satellite monitoring of ammonia: a case study of the San Joaquin Valley, J. Geophys. Res., Volume 115 (2010), p. D13 (D13302) | DOI

[Clarisse et al., 2010c] L. Clarisse; F. Prata; J.-L. Lacour; D. Hurtmans; C. Clerbaux; P.-F. Coheur A correlation method for volcanic ash detection using hyperspectral infrared measurements, Geophys. Res. Lett., Volume 37 (2010), p. L19806 | DOI

[Clarisse et al., 2011a] L. Clarisse; Y. R’Honi; P.-F. Coheur; D. Hurtmans; C. Clerbaux Thermal infrared nadir observations of 24 atmospheric gases, Geophys. Res. Lett., Volume 38 (2011), p. L10802 | DOI

[Clarisse et al., 2011b] L. Clarisse; M. Fromm; Y. Ngadi; L. Emmons; C. Clerbaux; D. Hurtmans; P.-F. Coheur Intercontinental transport of anthropogenic sulfur dioxide and other pollutants: an infrared remote sensing case study, Geophys. Res. Lett., Volume 38 (2011), p. L19806 | DOI

[Clarisse et al., 2011c] L. Clarisse; P.-F. Coheur; S. Chefdeville; J.-L. Lacour; D. Hurtmans; C. Clerbaux Infrared satellite observations of hydrogen sulfide in the volcanic plume of the August 2008 Kasatochi eruption, Geophys. Res. Lett., Volume 38 (2011), p. L10804 | DOI

[Clarisse et al., 2012] L. Clarisse; D. Hurtmans; C. Clerbaux; J. Hadji-Lazaro; Y. Ngadi; P.-F. Coheur Retrieval of sulphur dioxide from the infrared atmospheric sounding interferometer (IASI), Atmos. Meas. Tech., Volume 5 (2012), pp. 581-594 | DOI

[Clarisse et al., 2013] L. Clarisse; P.-F. Coheur; F. Prata; J. Hadji-Lazaro; D. Hurtmans; C. Clerbaux A unified approach to infrared aerosol remote sensing and type specification, Atmos. Chem. Phys., Volume 13 (2013), pp. 2195-2221 | DOI

[Clarisse et al., 2014] L. Clarisse; P.-F. Coheur; N. Theys; D. Hurtmans; C. Clerbaux The 2011 Nabro eruption, a SO2 plume height analysis using IASI measurements, Atmos. Chem. Phys., Volume 14 (2014), pp. 3095-3111 | DOI

[Clerbaux et al., 1998] C. Clerbaux; P. Chazette; J. Hadji-Lazaro; G. Mégie; J.-F. Müller; S.A. Clough Remote sensing of CO, CH4 and O3 using a spaceborne nadir-viewing interferometer, J. Geophys. Res., Volume 103 (1998), p. D15 (18,999–19,013)

[Clerbaux et al., 1999] C. Clerbaux; J. Hadji-Lazaro; S. Payan; C. Camy-Peyret; G. Mégie Retrieval of CO columns from IMG/ADEOS spectra, IEEE Trans. Geosci. Remote Sensing, Volume 37 (1999) no. 3, pp. 1657-1661

[Clerbaux et al., 2001] C. Clerbaux; J. Hadji-Lazaro; D. Hauglustaine; G. Mégie; B. Khattatov; J.-F. Lamarque Assimilation of carbon monoxide measured from satellite in a three-dimensional chemistry transport model, J. Geophys. Res., Volume 106 (2001), p. D14 (15,385–15,394)

[Clerbaux et al., 2002] C. Clerbaux; J. Hadji-Lazaro; S. Payan; C. Camy-Peyret; J. Wang; D. Edwards; M. Luo Retrieval of CO from nadir remote sensing measurements in the infrared by use of four different inversion algorithms, Appl. Opt., Volume 41 (2002) no. 33, pp. 7068-7078

[Clerbaux et al., 2003] C. Clerbaux; J. Hadji-Lazaro; S. Turquety; G. Mégie; P.-F. Coheur Trace gas measurements from infrared satellite for chemistry and climate applications, Atmos. Chem. Phys., Volume 3 (2003), pp. 1495-1508

[Clerbaux et al., 2009] C. Clerbaux; A. Boynard; L. Clarisse; M. George; J. Hadji-Lazaro; H. Herbin; D. Hurtmans; M. Pommier; A. Razavi; S. Turquety; C. Wespes; P.-F. Coheur Monitoring of atmospheric composition using the thermal infrared IASI/MetOp sounder, Atmos. Chem. Phys., Volume 9 (2009), pp. 6041-6054

[Clerbaux et al., 2010] C. Clerbaux; S. Turquety; P.-F. Coheur Infrared remote sensing of atmospheric composition and air quality: towards operational applications, C.R. Geoscience, Volume 342 (2010) no. 4–5, pp. 349-356 | DOI

[Clerbaux et al., 2011] C. Clerbaux; M. George; J. Hadji-Lazaro; L. Clarisse; D. Hurtmans; P. Coheur Mesure du SO2 et des cendres volcaniques avec IASI, Meteorologie, Volume 74 (2011), pp. 35-41

[Clerbaux and Crevoisier, 2013] C. Clerbaux; C. Crevoisier New directions: infrared remote sensing of the troposphere from satellite: less, but better, Atmos. Environ., Volume 72 (2013), pp. 24-26 | DOI

[CNES, 1989] CNES, 1989. http://www.cnes.fr/web/CNES-fr/9883-st-seminaire-de-prospective-scientifique-cap-d-agde-1989.php.

[Coheur et al., 2003] P.-F. Coheur; C. Clerbaux; R. Colin Spectroscopic measurements of halocarbons and hydrohalocarbons by satellite-borne remote sensors, J. Geophys. Res., Volume 108 (2003), p. D4 | DOI

[Coheur et al., 2005] P.-F. Coheur; B. Barret; S. Turquety; D. Hurtmans; J. Hadji-Lazaro; C. Clerbaux Retrieval and characterization of ozone vertical profiles from a thermal infrared nadir sounder, J. Geophys. Res., Volume 110 (2005), p. D24303 | DOI

[Coheur et al., 2009] P.-F. Coheur; L. Clarisse; S. Turquety; D. Hurtmans; C. Clerbaux IASI measurements of reactive trace species in biomass burning plumes, Atmos. Chem. Phys., Volume 9 (2009), pp. 5655-5667

[Cooper et al., 2014] M. Cooper; R.V. Martin; C. Wespes; P.-F. Coheur; C. Clerbaux; L.T. Murray Tropospheric nitric acid columns from the IASI satellite instrument interpreted with a chemical transport model: implications for parameterizations of nitric oxide production by lightning, J. Geophys. Res. Atmos., Volume 119 (2014), pp. 10068-10079 | DOI

[Crevoisier et al., 2014] C. Crevoisier; C. Clerbaux; V. Guidard; T. Phulpin; R. Armante; B. Barret; C. Camy-Peyret; J.-P. Chaboureau; P.-F. Coheur; L. Crépeau; G. Dufour; L. Labonnote; L. Lavanant; J. Hadji-Lazaro; H. Herbin; N. Jacquinet-Husson; S. Payan; E. Péquignot; C. Pierangelo; P. Sellitto; C. Stubenrauch Towards IASI-New Generation (IASI-NG): impact of improved spectral resolution and radiometric noise on the retrieval of thermodynamic, chemistry and climate variables, Atmos. Meas. Tech., Volume 7 (2014), pp. 4367-4385 | DOI

[Cuesta et al., 2013] J. Cuesta; M. Eremenko; X. Liu; G. Dufour; Z. Cai; M. Höpfner; T. von Clarmann; P. Sellitto; G. Foret; B. Gaubert; M. Beekmann; J. Orphal; K. Chance; R. Spurr; J.-M. Flaud Satellite observation of lowermost tropospheric ozone by multispectral synergism of IASI thermal infrared and GOME-2 ultraviolet measurements, Atmos. Chem. Phys., Volume 13 (2013), pp. 9675-9693 | DOI

[Doche et al., 2014] C. Doche; G. Dufour; G. Foret; M. Eremenko; J. Cuesta; M. Beekmann; P. Kalabokas Summertime tropospheric ozone variability over the Mediterranean basin observed with IAS, Atmos. Chem. Phys., Volume 14 (2014), pp. 10589-10600 | DOI

[Duflot et al., 2013] V. Duflot; D. Hurtmans; L. Clarisse; Y. R’honi; C. Vigouroux; M. De Mazière; E. Mahieu; C. Servais; C. Clerbaux; P.-F. Coheur Measurements of hydrogen cyanide (HCN) and acetylene (C2H2) from the Infrared Atmospheric Sounding Interferometer (IASI), Atmos. Meas. Tech., Volume 6 (2013), pp. 917-925 | DOI

[Dufour et al., 2010] G. Dufour; M. Eremenko; J. Orphal; J.-M. Flaud IASI observations of seasonal and day-to-day variations of tropospheric ozone over three highly populated areas of China: Beijing, Shanghai, and Hong Kong, Atmos. Chem. Phys., Volume 10 (2010), pp. 3787-3801

[Eremenko et al., 2008] M. Eremenko; G. Dufour; G. Foret; C. Keim; J. Orphal; M. Beekmann; G. Bergametti; J.-M. Flaud Tropospheric ozone distributions over Europe during the heat wave in July 2007 observed from infrared nadir spectra recorded by IASI, Geophys. Res. Lett., Volume 35 (2008), p. L18805

[Foret et al., 2014] G. Foret; M. Eremenko; J. Cuesta; P. Sellitto; J. Barré; B. Gaubert; A. Coman; G. Dufour; X. Liu; M. Joly; C. Doche; M. Beekmann Ozone pollution: what can we see from space? A case study, J. Geophys. Res., Volume 119 (2014), pp. 8476-8499 | DOI

[Fortems-Cheiney et al., 2009] A. Fortems-Cheiney; F. Chevallier; I. Pison; P. Bousquet; C. Carouge; C. Clerbaux; P.-F. Coheur; M. George; D. Hurtmans; S. Szopa On the capability of IASI measurements to inform about CO surface emission, Atmos. Chem. Phys., Volume 9 (2009), pp. 8735-8743

[Gazeaux et al., 2013] J. Gazeaux; C. Clerbaux; M. George; J. Hadji-Lazaro; J. Kuttippurath; P.-F. Coheur; D. Hurtmans; T. Deshler; M. Kovilakam; P. Campbell; V. Guidard; F. Rabier; J.-N. Thépaut Intercomparison of polar ozone profiles by IASI/MetOp sounder with 2010 Concordiasi ozonesonde observations, Atmos. Meas. Tech., Volume 6 (2013), pp. 613-620 | DOI

[George et al., 2009] M. George; C. Clerbaux; D. Hurtmans; S. Turquety; P.-F. Coheur; M. Pommier; J. Hadji-Lazaro; D.P. Edwards; H. Worden; M. Luo; C. Rinsland; W. McMillan Carbon monoxide distributions from the IASI/METOP mission: evaluation with other spaceborne remote sensors, Atmos. Chem. Phys., Volume 9 (2009), pp. 8317-8330

[Ginoux et al., 2012] P. Ginoux; L. Clarisse; C. Clerbaux; P.-F. Coheur; O. Dubovik; N.C. Hsu; M. Van Damme Mixing of dust and NH3 observed globally over anthropogenic dust sources, Atmos. Chem. Phys., Volume 12 (2012), pp. 7351-7363 | DOI

[Hadji-Lazaro et al., 1999] J. Hadji-Lazaro; C. Clerbaux; S. Thiria An inversion algorithm using neural networks to retrieve atmospheric CO total columns from high-resolution nadir radiances, J. Geophys. Res., Volume 104 (1999), p. D19 (23,841–23,854)

[Hadji-Lazaro et al., 2001] J. Hadji-Lazaro; C. Clerbaux; P. Couvert; P. Chazette; C. Boonne Cloud filter for CO retrieval from IMG infrared spectra using ECMWF temperatures and POLDER cloud data, Geophys. Res. Lett., Volume 28 (2001) no. 12, pp. 2397-2400

[Heald et al., 2012] C.L. Heald; J.L. Collett; T. Lee; K.B. Benedict; F.M. Schwandner; Y. Li; L. Clarisse; D.R. Hurtmans; M. Van Damme; C. Clerbaux; P.-F. Coheur; S. Philip; R.V. Martin; H.O.T. Pye Atmospheric ammonia and particulate inorganic nitrogen over the United States, Atmos. Chem. Phys., Volume 12 (2012), pp. 10295-10312 (SRef-ID: 1680-7324/acp/2012-12-10295)

[Herbin et al., 2007] H. Herbin; D. Hurtmans; C. Wespes; B. Barret; S. Turquety; J. Hadji-Lazaro; C. Clerbaux; P.-F. Coheur Global distributions of water vapour isotopologues retrieved from IMG/ADEOS data, Atmos. Chem. Phys., Volume 7 (2007), pp. 3957-3968

[Herbin et al., 2009] H. Herbin; D. Hurtmans; C. Clerbaux; L. Clarisse; P.-F. Coheur H216O and HDO measurements with IASI/MetOp, Atmos. Chem. Phys., Volume 9 (2009), pp. 9433-9447

[Hilton et al., 2012] F. Hilton; T. August; C. Barnet; A. Bouchard; C. Camy-Peyret; L. Clarisse; C. Clerbaux; P.-F. Coheur; A. Collard; C. Crevoisier; G. Dufour; D. Edwards; F. Faijan; N. Fourrié; A. Gambacorta; S. Gauguin; V. Guidard; D. Hurtmans; S. Illingworth; N. Jacquinet-Husson; T. Kerzenmacher; D. Klaes; L. Lavanant; G. Masiello; M. Matricardi; T. McNally; S. Newman; E. Pavelin; E. Péquignot; T. Phulpin; J. Remedios; P. Schlüssel; C. Serio; L. Strow; J. Taylor; D. Tobin; A. Uspensky; D. Zhou Hyperspectral earth observation from IASI: five years of accomplishments, Bull. Am. Meteorol. Soc., Volume 93 (2012) no. 3, pp. 347-370 | DOI

[Hoffmann et al., 2014] L. Hoffmann; M.J. Alexander; C. Clerbaux; A.W. Grimsdell; C.I. Meyer; T. Rößler; B. Tournier Intercomparison of stratospheric gravity wave observations with AIRS and IASI, Atmos. Meas. Tech., Volume 7 (2014), pp. 4517-4537 | DOI

[Huijnen et al., 2012] V. Huijnen; J. Flemming; J.W. Kaiser; A. Inness; J. Leitão; A. Heil; H.J. Eskes; M.G. Schultz; A. Benedetti; J. Hadji-Lazaro; G. Dufour; M. Eremenko Hindcast experiments of tropospheric composition during the summer 2010 fires over western Russia, Atmos. Chem. Phys., Volume 12 (2012), pp. 4341-4364 | DOI

[Hurtmans et al., 2012] D. Hurtmans; P.-F. Coheur; C. Wespes; L. Clarisse; O. Scharf; C. Clerbaux; J. Hadji-Lazaro; M. George; S. Turquety FORLI radiative transfer and retrieval code for IAS, J. Quant. Spectrosc. Radiat. Transfer, Volume 113 (2012) no. 11, pp. 1391-1408

[IASI Science Plan, 1998] IASI Science Plan A Report From The IASI Sounding Science Working Group, Edited by C. Camy-Peyret and J. Eyre, 1998 http://smsc.cnes.fr/IASI/IASI_Science_Plan_Issue1_released_version.pdf

[Inness et al., 2013] A. Inness; F. Baier; A. Benedetti; I. Bouarar; S. Chabrillat; H. Clark; C. Clerbaux; P. Coheur; R.J. Engelen; Q. Errera; J. Flemming; M. George; C. Granier; J. Hadji-Lazaro; V. Huijnen; D. Hurtmans; L. Jones; J.W. Kaiser; J. Kapsomenakis; K. Lefever; J. Leitão; M. Razinger; A. Richter; M.G. Schultz; A.J. Simmons; M. Suttie; O. Stein; J.-N. Thépaut; V. Thouret; M. Vrekoussis; C. Zerefos; the MACC team The MACC reanalysis: an 8 yr data set of atmospheric composition, Atmos. Chem. Phys., Volume 13 (2013), pp. 4073-4109 | DOI

[Karagulian et al., 2010] F. Karagulian; L. Clarisse; C. Clerbaux; A.J. Prata; D. Hurtmans; P.-F. Coheur Detection of volcanic SO2, ash, and H2SO4 using the Infrared Atmospheric Sounding Interferometer (IASI), J. Geophys. Res., Volume 115 (2010), p. D00L02 | DOI

[Klonecki et al., 2012] A. Klonecki; M. Pommier; C. Clerbaux; G. Ancellet; J.-P. Cammas; P.-F. Coheur; A. Cozic; G.S. Diskin; J. Hadji-Lazaro; D.A. Hauglustaine; D. Hurtmans; B. Khattatov; J.-F. Lamarque; K.S. Law; P. Nedelec; J.-D. Paris; J.R. Podolske; P. Prunet; H. Schlager; S. Szopa; S. Turquety Assimilation of IASI satellite CO fields into a global chemistry transport model for validation against aircraft measurements, Atmos. Chem. Phys., Volume 12 (2012), pp. 4493-4512 | DOI

[Kobayashi et al., 1999] H. Kobayashi; A. Shimota; C. Yoshigahara; I. Yoshida; Y. Uehara; K. Kondo Satellite-borne high-resolution FTIR for lower atmosphere sounding and its evaluation, IEEE Trans. Geosci. Remote Sens., Volume 37 (1999), pp. 1496-1507

[Krol et al., 2013] M. Krol; W. Peters; P. Hooghiemstra; M. George; C. Clerbaux; D. Hurtmans; D. McInerney; F. Sedano; P. Bergamaschi; M. El Hajj; J.W. Kaiser; D. Fisher; V. Yershov; J.-P. Muller How much CO was emitted by the 2010 fires around Moscow?, Atmos. Chem. Phys., Volume 13 (2013), pp. 4737-4747 | DOI

[Lacour et al., 2012] J.-L. Lacour; C. Risi; L. Clarisse; S. Bony; D. Hurtmans; C. Clerbaux; P.-F. Coheur Mid-tropospheric δD observations from IASI/MetOp at high spatial and temporal resolution, Atmos. Chem. Phys., Volume 12 (2012), pp. 10817-10832 | DOI

[Lacour et al., 2015] J.-L. Lacour; L. Clarisse; J. Worden; M. Schneider; S. Barthlott; F. Hase; C. Risi; C. Clerbaux; D. Hurtmans; P.-F. Coheur Cross-validation of IASI/MetOp derived tropospheric δD with TES and ground-based FTIR observations, Atmos. Meas. Tech., Volume 8 (2015), pp. 1447-1466 | DOI

[Peyridieu et al., 2013] S. Peyridieu; A. Chédin; V. Capelle; C. Tsamalis; C. Pierangelo; R. Armante; C. Crevoisier; L. Crépeau; M. Siméon; F. Ducos; N.A. Scott Characterization of dust aerosols in the infrared from IASI and comparison with PARASOL, MODIS, MISR, CALIOP, and AERONET observations, Atmos. Chem. Phys., Volume 13 (2013), pp. 6065-6082 | DOI

[Pommier et al., 2010] M. Pommier; K.S. Law; C. Clerbaux; S. Turquety; D. Hurtmans; J. Hadji-Lazaro; P.-F. Coheur; H. Schlager; G. Ancellet; J.-D. Paris; P. Nédélec; G.S. Diskin; J.R. Podolske; J.S. Holloway; P. Bernath IASI carbon monoxide validation over the Arctic during POLARCAT spring and summer campaigns, Atmos. Chem. Phys., Volume 10 (2010), pp. 10655-10678 | DOI

[Pommier et al., 2012] M. Pommier; C. Clerbaux; K.S. Law; G. Ancellet; P. Bernath; P.-F. Coheur; J. Hadji-Lazaro; D. Hurtmans; P. Nédélec; J.-D. Paris; F. Ravetta; T.B. Ryerson; H. Schlager; A.J. Weinheimer Analysis of IASI tropospheric O3 data over the Arctic during POLARCAT campaigns in 2008, Atmos. Chem. Phys., Volume 12 (2012), pp. 7371-7389 | DOI

[Pommier et al., 2014] M. Pommier; J.-L. Lacour; C. Risi; F.M. Bréon; C. Clerbaux; P.-F. Coheur; K. Gribanov; D. Hurtmans; J. Jouzel; V. Zakharov Observation of tropospheric D by IASI over western Siberia: comparison with a general circulation model, Atmos. Meas. Tech., Volume 7 (2014), pp. 1581-1595 | DOI

[Razavi et al., 2011] A. Razavi; F. Karagulian; L. Clarisse; D. Hurtmans; P.-F. Coheur; C. Clerbaux; J.-F. Müller; T. Stavrakou Global distributions of methanol and formic acid retrieved for the first time from the IASI/MetOp thermal infrared sounder, Atmos. Chem. Phys., Volume 11 (2011), pp. 857-872 | DOI

[R’Honi et al., 2013] Y. R’Honi; L. Clarisse; C. Clerbaux; D. Hurtmans; V. Duflot; S. Turquety; Y. Ngadi; P.-F. Coheur Exceptional emissions of NH3 and HCOOH in the 2010 Russian wildfires, Atmos. Chem. Phys., Volume 13 (2013), pp. 4171-4181 | DOI

[Safieddine et al., 2013] S. Safieddine; C. Clerbaux; M. George; J. Hadji-Lazaro; D. Hurtmans; P.-F. Coheur; C. Wespes; D. Loyola; P. Valks; N. Hao Tropospheric ozone and nitrogen dioxide measurements in urban and rural regions as seen by IASI and GOME-2, J. Geophys. Res. Atmos., Volume 118 (2013), p. 10,555-10,556 | DOI

[Safieddine et al., 2014] S. Safieddine; A. Boynard; P.-F. Coheur; D. Hurtmans; G. Pfister; B. Quennehen; J.L. Thomas; J.-C. Raut; K.S. Law; Z. Klimont; J. Hadji-Lazaro; M. George; C. Clerbaux Summertime tropospheric ozone assessment over the Mediterranean region using the thermal infrared IASI/MetOp sounder and the WRF-Chem model, Atmos. Chem. Phys., Volume 14 (2014), pp. 10119-10131 | DOI

[Sauvage et al., 2007] B. Sauvage; R.V. Martin; A. van Donkelaar; J.R. Ziemke Quantification of the factors controlling tropical tropospheric ozone and the South Atlantic maximum, J. Geophys. Res., Volume 112 (2007), p. D11309 | DOI

[Scannell et al., 2012] C. Scannell; D. Hurtmans; A. Boynard; J. Hadji-Lazaro; M. George; A. Delcloo; O. Tuinder; P.-F. Coheur; C. Clerbaux Antarctic ozone hole as observed by IASI/MetOp for 2008–2010, Atmos. Meas. Tech., Volume 5 (2012), pp. 123-139 | DOI

[Schneider and Hase, 2011] M. Schneider; F. Hase Optimal estimation of tropospheric H2O and D with IASI/METOP, Atmos. Chem. Phys., Volume 11 (2011), pp. 11207-11220 | DOI

[Sears et al., 2013] T.M. Sears; G.E. Thomas; E. Carboni; A.J.A. Smith; R.G. Grainger SO2 as a possible proxy for volcanic ash in aviation hazard avoidance, J. Geophys. Res., Volume 118 (2013) no. 11, pp. 5698-5709 | DOI

[Stavrakou et al., 2011] T. Stavrakou; A. Guenther; A. Razavi; L. Clarisse; C. Clerbaux; P.-F. Coheur; D. Hurtmans; F. Karagulian; M. De Mazière; C. Vigouroux; C. Amelynck; N. Schoon; Q. Laffineur; B. Heinesch; M. Aubinet; C. Rinsland; J.-F. Müller First space-based derivation of the global atmospheric methanol emission fluxes, Atmos. Chem. Phys., Volume 11 (2011), pp. 4873-4898 | DOI

[Stavrakou et al., 2012] T. Stavrakou; J.-F. Müller; J. Peeters; A. Razavi; L. Clarisse; C. Clerbaux; P.-F. Coheur; D. Hurtmans; M. De Mazière; C. Vigouroux; N.M. Deutscher; D.W.T. Griffith; N. Jones; C. Paton-Walsh Satellite evidence for a large source of formic acid from boreal and tropical forests, Nat. Geosci., Volume 5 (2012), pp. 26-30 | DOI

[Theys et al., 2013] N. Theys; R. Campion; L. Clarisse; H. Brenot; J. van Gent; B. Dils; S. Corradini; L. Merucci; P.-F. Coheur; M. Van Roozendael; D. Hurtmans; C. Clerbaux; S. Tait; F. Ferrucci Volcanic SO2 fluxes derived from satellite data: a survey using OMI, GOME-2, IASI and MODIS, Atmos. Chem. Phys., Volume 13 (2013), pp. 5945-5968 | DOI

[Thonat et al., 2012] T. Thonat; C. Crevoisier; N.A. Scott; A. Chédin; T. Schuck; R. Armante; L. Crépeau Retrieval of tropospheric CO column from hyperspectral infrared sounders – application to four years of Aqua/AIRS and MetOp-A/IASI, Atmos. Meas. Tech., Volume 5 (2012), pp. 2413-2429 | DOI

[Turquety et al., 2002] S. Turquety; J. Hadji-Lazaro; C. Clerbaux First satellite ozone distributions retrieved from nadir high-resolution infrared spectra, Geophys. Res. Lett., Volume 29 (2002) no. 24, p. 2198 | DOI

[Turquety et al., 2004] S. Turquety; J. Hadji-Lazaro; C. Clerbaux; D.A. Hauglustaine; S.A. Clough; V. Cassé; P. Schlüssel; G. Mégie Operational trace gas retrieval algorithm for the Infrared Atmospheric Sounding Interferometer, J. Geophys. Res., Volume 109 (2004), p. D21301 | DOI

[Turquety et al., 2009] S. Turquety; D. Hurtmans; J. Hadji-Lazaro; P.-F. Coheur; C. Clerbaux; D. Josset; C. Tsamalis Tracking the emission and transport of pollution from wildfires using the IASI CO retrievals: analysis of the summer 2007 Greek fires, Atmos. Chem. Phys., Volume 9 (2009), pp. 4897-4913

[Van Damme et al., 2014a] M. Van Damme; L. Clarisse; C.L. Heald; D. Hurtmans; Y. Ngadi; C. Clerbaux; A.J. Dolman; J.W. Erisman; P.-F. Coheur Global distributions, time series and error characterization of atmospheric ammonia (NH3) from IASI satellite observations, Atmos. Chem. Phys., Volume 14 (2014), pp. 2905-2922 | DOI

[Van Damme et al., 2014b] M. Van Damme; R.J. Wichink Kruit; M. Schaap; L. Clarisse; C. Clerbaux; P.-F. Coheur; E. Dammers; A.J. Dolman; J.W. Erisman Evaluating 4 years of atmospheric ammonia (NH3) over Europe using IASI satellite observations and LOTOS-EUROS model results, J. Geophys. Res., Volume 119 (2014), p. D15 (9549–9566)

[Vandenbussche et al., 2013] S. Vandenbussche; S. Kochenova; A.C. Vandaele; N. Kumps; M. De Mazière Retrieval of desert dust aerosol vertical profiles from IASI measurements in the TIR atmospheric window, Atmos. Meas. Tech., Volume 6 (2013) no. 10, pp. 2577-2591 | DOI

[Walker et al., 2011] J.C. Walker; A. Dudhia; E. Carboni An effective method for the detection of trace species demonstrated using the MetOp Infrared Atmospheric Sounding Interferometer, Atmos. Meas. Tech., Volume 4 (2011), pp. 1567-1580 | DOI

[Walker et al., 2012] J.C. Walker; E. Carboni; A. Dudhia; R.G. Grainger Improved detection of sulphur dioxide in volcanic plumes using satellite-based hyperspectral infrared measurements: application to the Eyjafjallajökull 2010 eruption, J. Geophys. Res., Volume 117 (2012), p. D00U16 | DOI

[Wells et al., 2012] K.C. Wells; D.B. Millet; L. Hu; K.E. Cady-Pereira; Y. Xiao; M.W. Shephard; C. Clerbaux; L. Clarisse; P.-F. Coheur; E.C. Apel; J. de Gouw; C. Warneke; H.B. Singh; A.H. Goldstein; B.C. Sive Tropospheric methanol observations from space: retrieval evaluation and constraints on the seasonality of biogenic emissions, Atmos. Chem. Phys., Volume 12 (2012), pp. 5897-5912 | DOI

[Wespes et al., 2007] C. Wespes; D. Hurtmans; H. Herbin; B. Barret; S. Turquety; J. Hadji-Lazaro; C. Clerbaux; P.-F. Coheur First global distributions of nitric acid in the troposphere and the stratosphere derived from infrared satellite measurements, J. Geophys. Res., Volume 112 (2007), p. D13 (D13311) | DOI

[Wespes et al., 2009] C. Wespes; D. Hurtmans; C. Clerbaux; M.L. Santee; R.V. Martin; P.-F. Coheur Global distributions of nitric acid from IASI/MetOP measurements, Atmos. Chem. Phys., Volume 9 (2009), pp. 7949-7962

[Wespes et al., 2012] C. Wespes; L. Emmons; D.P. Edwards; J. Hannigan; D. Hurtmans; M. Saunois; P.-F. Coheur; C. Clerbaux; M.T. Coffey; R.L. Batchelor; R. Lindenmaier; K. Strong; A.J. Weinheimer; J.B. Nowak; T.B. Ryerson; J.D. Crounse; P.O. Wennberg Analysis of ozone and nitric acid in spring and summer Arctic pollution using aircraft, ground-based, satellite observations and MOZART-4 model: source attribution and partitioning, ACP, Volume 12 (2012), pp. 237-259

[Whitburn et al., 2015] S. Whitburn; M. Van Damme; J.W. Kaiser; G.R. Van Der Werf; S. Turquety; D. Hurtmans; L. Clarisse; C. Clerbaux; P.-F. Coheur Ammonia Emissions in tropical biomass burning regions: comparison between satellite-derived emissions and bottom-up fire inventories, Atmos. Environ. (2015) | DOI

[WHO, 2014] WHO, 2014. http://www.who.int/mediacentre/news/releases/air-pollution/en/.

[Wiegele et al., 2014] A. Wiegele; M. Schneider; F. Hase; S. Barthlott; O. Garcia; E. Sepulveda; Y. Gonzalez; T. Blumenstock; U. Raffalski; M. Gisi; R. Kohlhepp The MUSICA MetOp/IASI H2O and D products: characterisation and long-term comparison to NDACC/FTIR data, Atmos. Meas. Tech., Volume 7 (2014), pp. 2719-2732 | DOI

[Worden et al., 2013] H.M. Worden; M.N. Deeter; C. Frankenberg; M. George; F. Nichitiu; J. Worden; I. Aben; K.W. Bowman; C. Clerbaux; P.F. Coheur; A.T.J. de Laat; R. Detweiler; J.R. Drummond; D.P. Edwards; J.C. Gille; D. Hurtmans; M. Luo; S. Martínez-Alonso; S. Massie; G. Pfister; J.X. Warner Decadal record of satellite carbon monoxide observations, Atmos. Chem. Phys., Volume 13 (2013), pp. 837-850 | DOI


Commentaires - Politique


Ces articles pourraient vous intéresser

Infrared remote sensing of atmospheric composition and air quality: Towards operational applications

Cathy Clerbaux; Solène Turquety; Pierre Coheur

C. R. Géos (2010)


Monitoring tropospheric pollution using infrared spectroscopy from geostationary orbit

Johannes Orphal; Gilles Bergametti; Benoît Beghin; ...

C. R. Phys (2005)


A review of remote sensing techniques and related spectroscopy problems

Sébastien Payan; Jérôme de La Noë; Alain Hauchecorne; ...

C. R. Phys (2005)