

1 Introduction
The Powder River Basin (Wyoming, USA) is one of the most active areas for coal bed methane production (EIA, 2007). Major ion mass balances and radiogenic isotope measurements (e.g., Sr, Nd, U, Th) are powerful tools for analyzing the rates and mechanisms of water–rock interaction during groundwater transport. Numerous studies have utilized these techniques to develop comprehensive models that describe the origin and compositional evolution of groundwater in silicate and carbonate aquifers (e.g., Banner and Hanson, 1990; Bullen et al., 1996; Jacobson and Wasserburg, 2005; Johnson and DePaolo, 1997; Lucas et al., 2010; Maher et al., 2006; Négrel and Petelet-Giraud, 2010). By comparison, only a few studies have examined water/rock interactions in coal bed aquifers (Bartos and Ogle, 2002; Bates et al., 2011; Brinck et al., 2008; Frost et al., 2002; Rice et al., 2000) and at present, models describing the geochemistry of these unique aquifer systems are relatively scarce (Bartos and Ogle, 2002).
To address this problem, we analyzed the downgradient evolution of dissolved major ions, 87Sr/86Sr ratios and 11B/10B ratios (expressed below as δ11B in ‰) along a 102 km flow path in the Wyodak-Anderson coal bed (WACB) aquifer in the Powder River Basin (PRB). The opportunity to sample groundwater in the WACB aquifer has increased, owing to the expansion of wells for extracting microbially-produced methane (e.g., Frost et al., 2002; Rice et al., 2000). Importantly, microbial methanogenesis is known to concurrently modify carbonate equilibria conditions and major ion concentrations in organic-rich aquifers (e.g., McIntosh et al., 2004). By analogy to the methanogenic Antrim Shale in the Michigan Basin, microbial methanogenesis is expected to greatly influence the compositional evolution of WACB groundwater (McIntosh et al., 2004), but the lack of major ion characterizations has hindered consensus on the overall reaction pathway occurring within the aquifer (Bartos and Ogle, 2002). Other factors affecting the transport of major ions may include sulfate reduction, ion-exchange, and cross-formational mixing (Bartos and Ogle, 2002; Frost et al., 2002; Rice et al., 2000). However, the interrelationships between these various processes, as well as their rates and relative controls on solute geochemistry, are presently unknown.
In this paper, we use a 1D multicomponent advective transport model to determine reaction pathways and rates required to produce the observed water chemistry in the WACB aquifer. The model incorporates new geochemical data for both groundwater and coal samples. To evaluate the downgradient evolution of Sr2+, we treat dissolved 87Sr/86Sr ratios as dynamic tracers of progressive water–rock interaction (Johnson and DePaolo, 1997; Maher et al., 2006). That is, dissolved 87Sr/86Sr ratios measured at a given distance downgradient reflect the physical properties of fluid transport (e.g., velocity, cross-formational mixing, etc.) as well as the chemical properties of the dissolving, precipitating, or exchanging solid phases (e.g., Sr concentration, 87Sr/86Sr ratio, rate of reaction, etc.). Importantly, because the Sr isotope model is linked to the major element data through mass-balance relationships, we are able to present an integrative and self-consistent interpretation of the factors controlling groundwater geochemistry in the WACB aquifer. We further couple this information with the behavior of B isotopes, which can elucidate the nature of water–rock interactions, in particular pH-dependent processes, as well as those resulting from water-mass mixing (e.g., Cividini et al., 2010; Gonfiantini and Pennisi, 2006; Lemarchand and Gaillardet, 2006; Vengosh et al., 1994; Zhao et al., 2011).
2 Sampling site
2.1 Geological characteristics
The study region is located in north-eastern Wyoming near the eastern margin of the ∼35,000-km2 Powder River Basin (Fig. 1). The Paleocene Fort Union Formation, which is subdivided into the Tullock, Lebo, and Tongue River Members, contains sandstone, siltstone, mudstone, claystone, carbonaceous shale, limestone, and coal (Ellis, 2002; Warwick and Stanton, 1988). The thickest and most laterally continuous coal beds in the PRB belong to the Wyodak-Anderson Coal Zone (WACZ) in the Tongue River Member (Bartos and Ogle, 2002; Ellis et al., 1999; Flores and Bader, 1999; Flores et al., 1999). At least eleven individual coal beds compose the WACZ (Flores et al., 1999). The beds developed from raised peat mires that were dissected or overrun by meandering fluvial systems fed by ancestral alluvial fans at the margin of the PRB (Ellis, 2002; Flores and Bader, 1999; Warwick and Stanton, 1988). Between the top of the uppermost bed and the bottom of the lowermost one, the entire WACZ is ∼180 m thick (Ellis, 1999). Individual beds ranging in thickness from a few centimeters to > 60 m (Frost et al., 2002) are separated by clastic sedimentary rocks ranging in thickness from a few centimeters to ∼45 m (Ellis, 1999).

Map showing sample locations (S1, W1–W9) and the generalized geology of the study area. Groundwater flow is to the northwest. Inset shows the location of the Powder River Basin (PRB) within the geographic context of the USA. Small box within the inset shows the approximate location of the study site within the PRB.
The coal is non-marine, low-sulfur, and subbituminous in rank (Ellis, 2002; Ellis et al., 1999; Flores and Bader, 1999; Van Voast, 2003). Small amounts of silicate, carbonate, phosphate, sulfate, sulfide, and metal oxide minerals are present in WACZ coal (Brownfield et al., 2005; Crowley et al., 1993; Palmer et al., 2000). Mineral sources include volcanic ash fall, Eolian deposition, and fluvial delivery during peat formation; in situ alteration of primary minerals during diagenesis, coalification, and groundwater flow; and direct precipitation from solution (Brownfield et al., 2005; Crowley et al., 1993; Palmer et al., 2000). Of these minerals, quartz and kaolinite are the most prevalent (Brownfield et al., 2005). Trace carbonates include calcite and dolomite (Brownfield et al., 2005). No studies have reported halite. The WACZ outcrops along the eastern margin of the PRB. In this region, natural burning of coal has baked overlying sediments to form clinker, which has a distinct orange to red color (Heffern and Coates, 1999; Warwick and Stanton, 1988). The Tongue River Member is overlain by the Eocene Formation, which has a similar depositional history and lithology as the Fort Union Formation (Flores and Bader, 1999). The Wasatch Formation is aerially exposed in much of the PRB (Bartos and Ogle, 2002).
2.2 Hydrological characteristics
The aquifer recharges through infiltration of precipitation and stream-flow loss in the clinker zone. The clinker is highly permeable, but a low-permeability zone at the base can delay water infiltration and cause accumulation above the coal (Bartos and Ogle, 2002). Following recharge, groundwater flows through west-to-northwest trending fractures in the coal. The fracture porosity in the aquifer is ∼1% (DOE, 2003). The matrix porosity of the coal itself is also ∼1% (DOE, 2003). The hydraulic conductivity ranges between 56 and 100 m/yr (Bartos and Ogle, 2002), and the hydraulic gradient is ∼1.5·10−3 (Daddow, 1986). The gross water velocity is ∼10 m/yr. Shales and fine-grained units belonging to the Wasatch Formation confine the top of the aquifer, while thick, low-permeability units belonging to the Lebo Member confine the bottom. At present, the extent of vertical connectivity between the WACB aquifer and the overlying Wasatch aquifer is unclear. Vertical hydraulic conductivities in the WACB aquifer are ∼1 to 2 orders of magnitude less than horizontal hydraulic conductivities, but downward leakage may occur in regions where the hydraulic head in the WACB aquifer is less than that in the Wasatch aquifer (Bartos and Ogle, 2002; Frost et al., 2002).
3 Samples and analytical methods
Ten water samples were collected, one from a spring discharging from clinker at the eastern margin of the PRB (S1), and nine from continuously pumping coal bed methane (CBM) production wells completed in the WACB aquifer (W1–W9; Fig. 1). We assume that S1 represents input to the aquifer and that wells W1–W9 lie along a nominal hydrologic flow path, with W1 intersecting the youngest water and W9 intersecting the oldest water. Before sampling, a closed flow-through cell was attached to the wellhead in order to purge the wells with at least one well volume of water. Samples were collected after pH, temperature, and conductivity stabilized.
Water was passed through 0.45-μm filter capsules and collected in acid-cleaned HDPE bottles. Cation samples were acidified to pH = 2 with concentrated, ultrapure HCl immediately after collection. Cation and Sr concentrations were measured by Inter-Mountain Laboratories, Inc. in Sheridan, WY, using a Varian VistaPro ICP-OES, and anion concentrations were measured using a Dionex DX-100. The uncertainties are better than 10% (± 2 SD).
Strontium isotope ratios were determined on a VG Sector mass spectrometer following the procedure traditionally used at the LHyGeS (e.g., Riotte and Chabaux, 1999). Boron concentrations were measured at LHyGeS using a Thermo X-Series II Q-ICP-MS, following the method presented in Cividini et al. (2010). 11B/10B ratios were measured at LHyGeS by negative thermo-ionization mass-spectrometry using a Thermo-Finnigan Triton and the total evaporation method (TE-NTIMS) following the procedure developed by Foster et al. (2006). Results are expressed with the classical δ11B notation (the permil deviation from the standard NIST SRM 951, certified value = 4.0436). Each sample was analyzed for B isotope ratios at least three times, with repeated analyses giving an analytical uncertainty of 0.8‰ (± 2 SD).
4 Results
Field parameters, 87Sr/86Sr ratios and δ11B values measured in the water samples are given in Table 1. (Solute concentrations are given in Table S1, Supplementary Information.) The data are reported in increasing order downgradient. Major ion concentrations are plotted as a function of distance in Fig. 2. In general, the major ion abundances observed for S1 and W1–W9 are consistent with results reported in prior studies of the clinker recharge zone and the greater WACB aquifer (e.g., Bartos and Ogle, 2002; Rice et al., 2000). Following recharge, Ca2+, Mg2+, Na+, Cl−, and HCO3−concentrations display four trends with increasing distance downgradient: S1-W1, W1–W3, W3–W6, and W6–W9 (Table S1 and Fig. 2).
General characteristics of water samples.
| Distance | T | pH | [Sr2+] | 87Sr/86Sr | [B] | δ11B | |
| (km) | (°C) | μmol/L | μg/L | (‰) | |||
| S1 | 0 | 18.3 | 8.42 | 31.84 | 0.7121 | 372 | 4.6 |
| W1 | 10 | 15.4 | 7.18 | 2.72 | 0.713 | 159 | 24.1 |
| W2 | 22 | 13.7 | 7.18 | 5.82 | 0.7125 | 196 | 20.4 |
| W3 | 30 | 19.2 | 7.1 | 6.07 | 0.7135 | 155 | 23 |
| W4 | 48 | 21.7 | 7.87 | 5.63 | 0.7138 | 98 | 15.1 |
| W5 | 53 | 20.1 | 7.64 | 5.46 | 0.7143 | 100 | 14 |
| W6 | 76 | 26 | 7.46 | 4.50 | 0.7162 | 99 | 19 |
| W7 | 98 | 21.9 | 7.6 | 4.53 | 0.7125 | 94 | 20.3 |
| W8 | 101 | 20.5 | 7.62 | 3.29 | 0.7124 | 110 | 19.8 |
| W9 | 102 | 19.6 | 7.98 | 2.12 | 0.7124 | 68 | 26.9 |
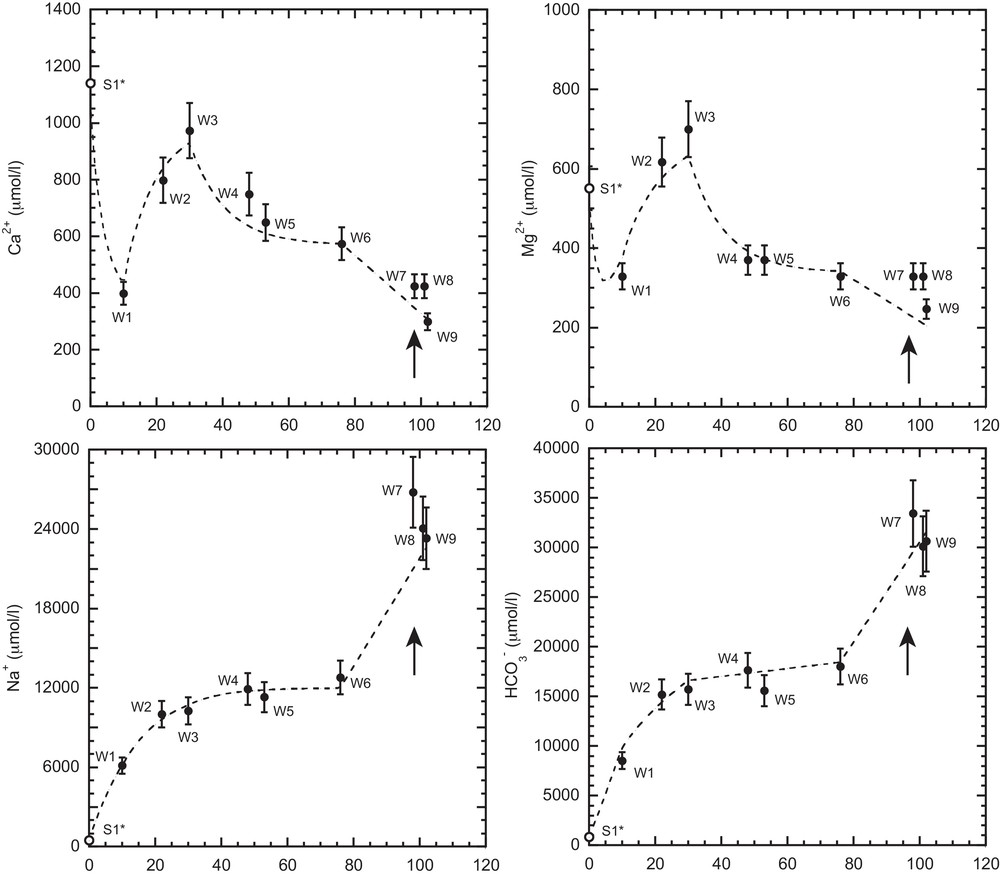
Major ion concentration versus distance for water samples. S1* (open symbol) corresponds to the S1 sample corrected for evaporation (see text). Arrows indicate the addition of water from the overlying Wasatch aquifer. Error bars display the 10% uncertainty of the concentration measurements. Dashed line shows theoretical model output.
Like major elements, Sr2+ and B concentrations in S1 are high relative to the range observed in W1–W9. The downgradient evolution of Sr2+ shown in Fig. 3a closely follows the trend observed for Ca2+. Between S1 and W6, dissolved 87Sr/86Sr ratios increase from 0.712384 to 0.716245 (Fig. 3b). One exception to this trend is W2, which has an 87Sr/86Sr ratio of 0.712534. Between W6 and W9, dissolved 87Sr/86Sr ratios decrease to 0.712372.

Sr2+, 87Sr/86Sr, B and δ11B versus distance for water samples. S1* (open symbol) corresponds to the S1 sample corrected for evaporation (see text). Arrows indicate the addition of water from the overlying Wasatch aquifer. Dashed line shows theoretical model output.
Concentration and isotope ratio data for B are presented in Fig. 3c,d. The B concentrations are similar to those observed in other aquifers (e.g., Pennisi et al., 2006a). B isotopic compositions (δ11B) span a relatively large range (from 4.6‰ to 26.9‰) and inversely correlate with pH, except for W9.
5 Discussion
5.1 Chemical composition of the recharge water
Sample S1 was collected during the summer months, whereas most of the recharge occurs during the spring snowmelt (Martin et al., 1988). Therefore, the high solute concentrations observed in S1 relative to W1–W9 likely reflect evaporative concentration during groundwater infiltration. Because Cl−is not involved in the chemical reactions that affect the transport of major ions (see discussion below and Bartos and Ogle, 2002), we assume that Cl−undergoes conservative transport and that the background Cl−concentration in the aquifer is 200 μmol/L (inferred from W1–W6). This value is consistent with average concentrations observed in the clinker recharge zone (Rice et al., 2002). We thus deduce that S1 is evaporatively concentrated by a factor ∼5, which is applied to all other solute concentrations (Fig. 2). Because B isotopes behave conservatively during water evaporation (Gaillardet et al., 2001), no isotopic shifts are expected.
5.2 1-D mass transport model
The groundwater evolution from a Ca–SO4-type to a Na-HCO3-type composition reflects several reactions commonly observed in organic-rich aquifers. These reactions include the coupling of sulfate reduction (sfr), methanogenesis (met), and ion-exchange (ixc), with dolomite dissolution (dol) and calcite dissolution and precipitation (cal) (e.g., Chapelle and McMahon, 1991; McIntosh et al., 2004):
We use a simple multicomponent numerical optimization model to calculate effective reaction rates occurring between initial and final waters along the flow path. The model uses the method of least-squares minimization to estimate the optimal rates for the above reactions that best reproduce the measured concentrations for a given transport velocity. The model is based on the following steady state 1D advective transport equation, in which diffusion is neglected:
| (1) |
| (2) |
| (3) |
| (4) |
| (5) |
| (6) |
| (7) |
Modeled reaction rates are reported in Table S2, and comparisons between the measured and modeled solute concentrations are shown in Fig. 2. Overall, there is reasonable agreement between the measured and modeled concentrations, suggesting that the reactions considered adequately describe major ion transport in the WACB aquifer. However, we acknowledge that the modeled rates rely on numerous assumptions and that the solutions may not be unique, but they are the best ones to fit the data with the numerical method employed. The main conclusion is that the coupling between organic matter oxidation by bacteria to produce methane and the dissolved carbonate system is a key mechanism for solute evolution in the WACB aquifer. Without the microbial modification of carbonate equilibrium conditions, the aquifer waters would most likely display much lower Na+ and HCO3−concentrations prior to the onset of vertical leakage. While most of the methane in the PRB may have been thermogenically produced ∼10–35 Ma (Rice, 1993), it appears that microbial methanogenesis has modified the chemistry of WACB fluids for at least the past 10 kyr, which is roughly the age of the oldest water in the aquifer estimated by dividing the flow path distance (102 km) by the water velocity (10 m/yr).
5.3 Geochemical evolution of Sr2+ in the WACB aquifer
Given the major ion model results, we evaluate the transport of Sr2+ to characterize more precisely the sources and reactions controlling groundwater geochemistry. By analogy to Ca, decreasing Sr concentrations between S1 and W1 could represent either uptake during calcite precipitation or adsorption onto coal surfaces. Increasing concentrations between W1 and W3 likely result from carbonate dissolution, whereas decreasing concentrations between W3 and W9 are consistent with adsorption onto coal surfaces. However, increasing 87Sr/86Sr ratios between S1 and W6 are not predicted by this model and indicate that a source of radiogenic Sr2+ is required. Assuming that Si behaves conservatively during transport, the modest Si increase between S1 and W6 does not support the hypothesis of silicate mineral dissolution. Alternatively, the increase of dissolved 87Sr/86Sr ratios with increasing distance downgradient can be attributed to the release of radiogenic, labile Sr2+ adsorbed to coal surfaces. This is consistent with a radiogenic 87Sr/86Sr ratio (0.71569) observed by Frost et al. (2002) in a previous study of the WACB aquifer. To test this hypothesis, we assume that the aquifer waters are in steady state, and we treat Sr2+ ion-exchange reactions in a manner identical to normal dissolution and precipitation reactions (Johnson and DePaolo, 1997; Maher et al., 2006). The transport equation describing the evolution of dissolved Sr2+ concentrations is:
| (8) |
The transport equation describing the evolution of dissolved 87Sr/86Sr ratios is:
| (9) |
Comparisons between the measured and modeled data are shown in Fig. 3a,b. Between S1 and W1, dolomite dissolution and desorption add Sr2+ at rates of 5.0 and 1.2 nmol/L/yr, respectively, whereas adsorption removes Sr2+ at a rate of 9.8 nmol/L/yr. Here, dissolved 87Sr/86Sr ratios increase because the desorbed Sr2+ is radiogenic (Frost et al., 2002). Between W1 and W3, the total average input rate from carbonate dissolution and desorption slightly exceeds the average adsorption rate (4.8 vs. 5.3 nmol/L/yr, respectively). As shown in Fig. 3b, dissolved 87Sr/86Sr ratios in this region of the aquifer first undergo an initial decrease when the rates of dolomite dissolution and calcite precipitation are highest. As the rates decrease during the approach to carbonate mineral saturation, the desorption contribution becomes more significant, and dissolved 87Sr/86Sr ratios increase. This behavior is tentatively confirmed by the agreement between W2 and the theoretical output (Fig. 3b). Between W3 and W6, Sr2+ concentrations decrease because the sorption rate exceeds the desorption rate (0.54 vs. 0.20 nmol/L/yr). However, dissolved 87Sr/86Sr ratios undergo a steady increase because desorbing Sr2+ continues to mix with Sr2+ in the fluid phase. Lastly, between W6 and W9, Wasatch water inflow delivers unradiogenic Sr2+ (0.71266) at a rate of 1.7 nmol/L/yr, but Sr2+ concentrations decrease because the average removal rate is more rapid (2.5 nmol/L/yr). These results demonstrate that exchange reactions exert an important control on the downgradient evolution of Sr2+.
5.4 B geochemistry in the WACB aquifer
Because B is highly soluble, its concentration in formation waters strongly correlates with salinity, a chemical property that has prompted numerous groundwater studies to use B as a tracer of water salinization (e.g., Vengosh et al., 2002), anthropogenic contamination (e.g., Pennisi et al., 2006b), thermal maturation of organic matter (e.g., Williams et al., 2013), and hydraulic fracturing (e.g., Warner et al., 2014). Moreover, B has been recognized as a potential contaminant worthy of regulation. Interest in coupling B isotopes with major elements and Sr isotopes is based on 1) the need to understand the reactions that control B distributions in groundwater, particularly in aquifers considered for water or mineral resources exploitation (e.g., Millot and Négrel, 2007; Pennisi et al., 2006), and 2) the chemical properties of B isotopes that help elucidate water/rock interactions, in particular those that are pH-dependent (e.g., Hemming et al., 1995; Lemarchand et al., 2007; Schmitt et al., 2012; Spivack et al., 1987). Fig. 4 provides a review of published relationships between pH and the B partition coefficient (Kd) and the B isotopic fractionation factor (α). In the pH range of the WACB samples, both B species are present in solution. Therefore, dissolved B isotope ratios are strongly linked to solution pH through the cumulative effects of adsorption/desorption reactions and carbonate precipitation/dissolution (e.g., Lemarchand et al., 2007; Ruiz-Agudo et al., 2012).
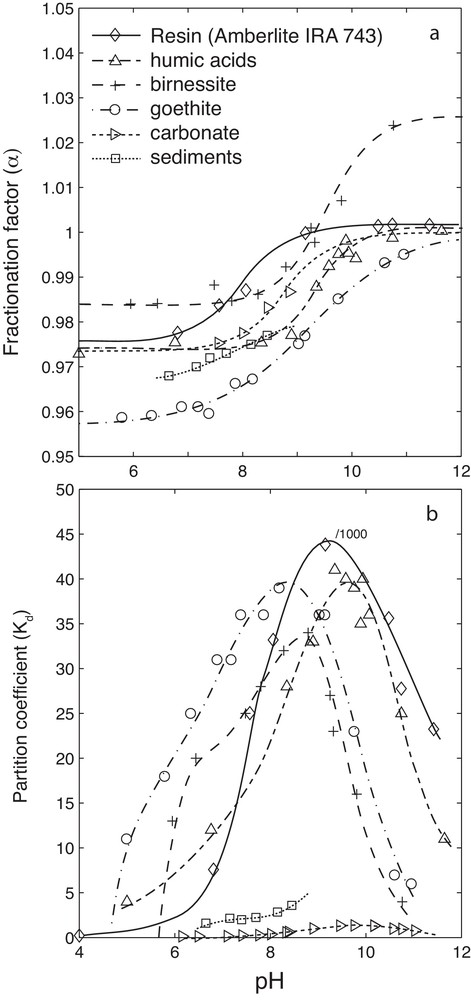
Review of Kd–pH and α–pH relationships. “Resin” data are from Lemarchand (2001); “humic acids” data are from Lemarchand et al., 2005; “birnessite” and “goethite” data are from Lemarchand et al., 2007; “carbonate” data are from Hemming et al. (1995) and Goldberg and Forster (1991); “sediments” data are from Spivack et al. (1987).
It is difficult to model the reactive transport of B using the equations above because neither B concentrations nor the isotope composition of expected sources and sinks are known. Similarly, data are lacking for the isotopic fractionation factor (α) and the partition coefficient (Kd) corresponding to the various reactions. Nonetheless, the B mass balance in WACB waters and the inverse correlation between δ11B values and pH (Fig. 5) provide evidence that pH-dependent reactions control the B distribution. This reduces the B transport modeling to equilibrium reactions involving B exchange between groundwater and host minerals.
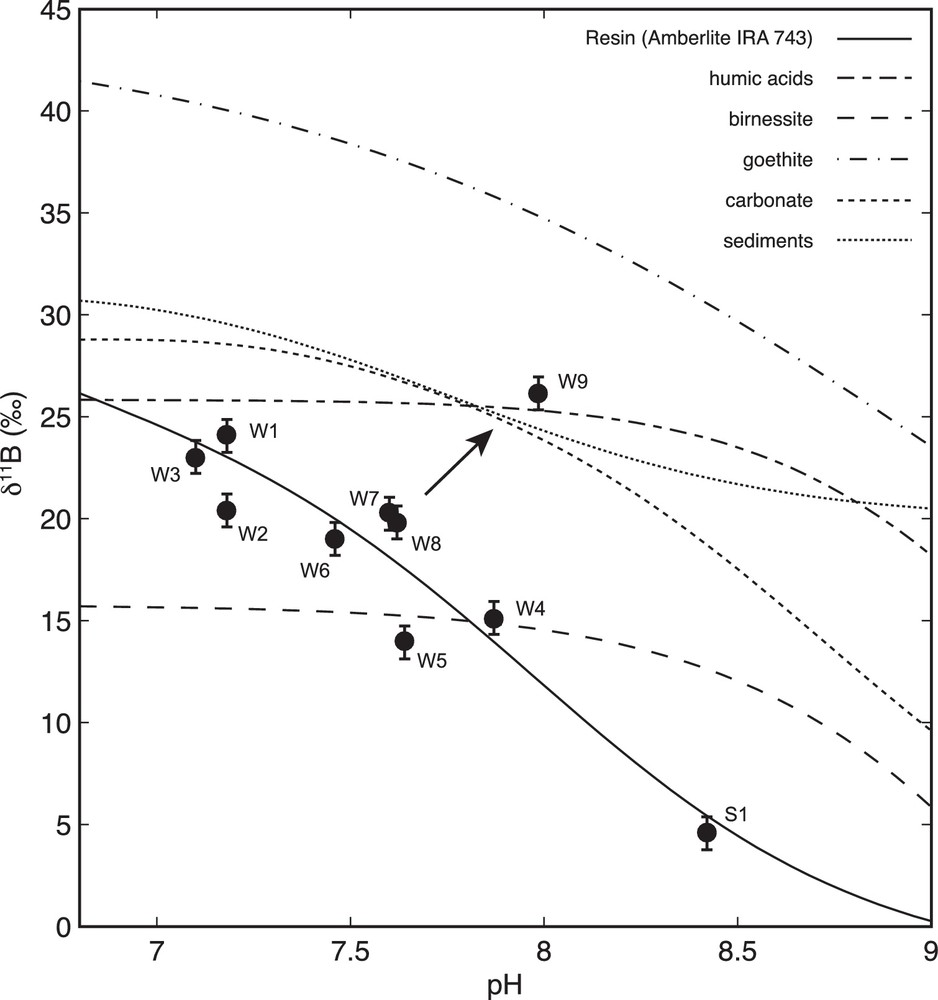
Comparison of dissolved and theoretical δ11B versus pH assuming different natures of the reactive surface. Arrow indicates the addition of water from the overlying Wasatch aquifer Theoretical curves derive from the same studies as those in Fig. 4.
The pH-dependency of dissolved B interactions with mineral or organic surfaces is related to the distribution and structure of the surface complexes formed (Goldberg et al., 2000; Lemarchand et al., 2005, 2007). These studies demonstrate that all B-surface interactions can be rationalized by the combined formation of trigonal/tetrahedral, monodendate/bidendate, and inner-sphere/outer-sphere complexes. Depending on the reaction, differences between the formation constants of B-surface complexes induce different Kd–pH and α–pH relationships (Fig. 4), which can be implemented in an inverse model to identify the chemical reactions controlling dissolved B concentrations. Because B concentrations are dilute, the partitioning between solution and surfaces can be modeled using the following simplified expression:
| (10) |
Similarly, the B isotopic ratio of the groundwater (Rw) can be conveniently expressed using only the total isotopic ratio (RT), the water/rock ratio (wr), the partition coefficient (Kd), and the fractionation factor (α):
| (11) |
| (12) |
Environment implications – While B has a high chemical affinity for organic surfaces, such as coal, which magnifies exchange between groundwater and host surfaces in the WACB aquifer, other host minerals, like clays, may show elevated B partition coefficients, possibly leading to similar pH-dependent behavior. For instance, in the Cornia Plain aquifer, Italy (Pennisi et al., 2006), the Strengbach watershed, France (Cividini et al., 2010), and the French Guiana coastal aquifer (Négrel et al., 2002), similar inverse correlations between δ11B and pH have been described (Fig. 6), indicating that pH-dependent controls on B transport are likely fundamental. However, the non-marine Hastings aquifer in southeastern England (Mather and Porteous, 2001, not shown) does not show a clear relationship with pH. Water mixing with adjacent aquifers, host minerals, like sandstone, having lower B partition coefficients, and more acidic solutions (in a pH range where the boric acid form dominates) might explain the apparent exception. Finally, significant B adsorption onto host surfaces can be expected in aquifers where pH-dependent ion-exchange reactions dominate. In the case of recharge water acidification by atmospheric CO2 rise or anthropogenic contamination, adsorbed B will transfer to solution and potentially exceed safe drinking water limits.
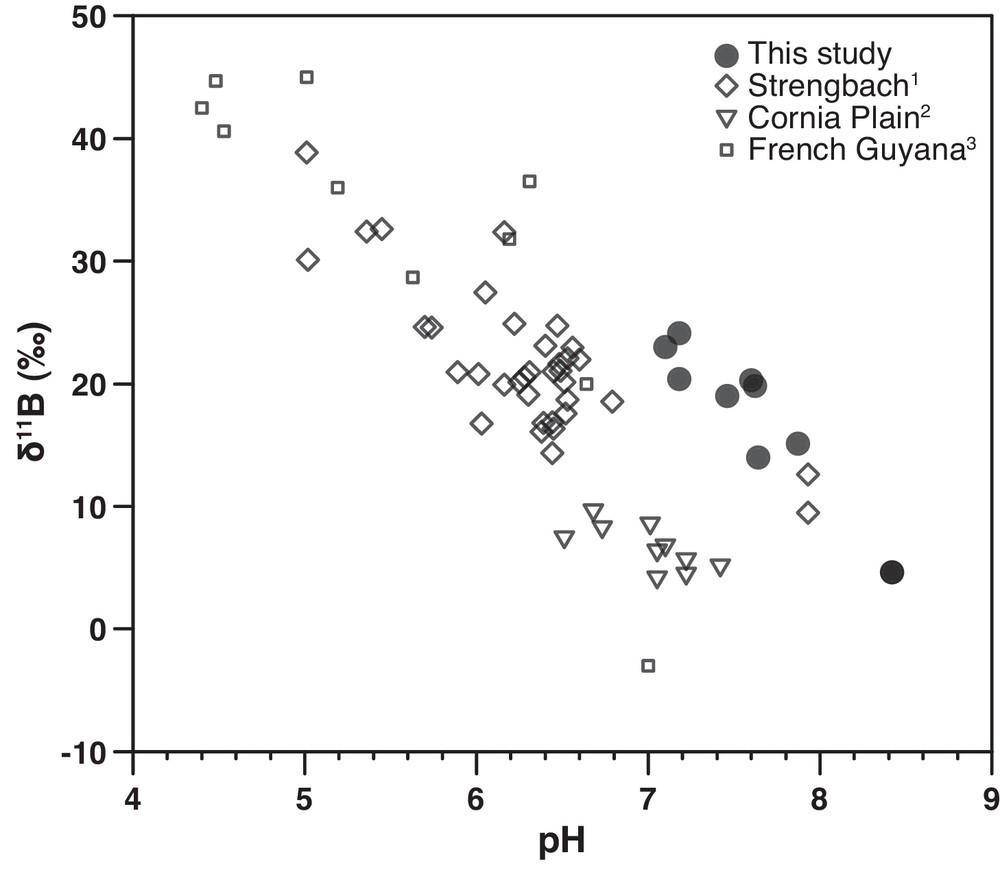
δ11B versus pH in groundwaters and surface waters. 1data from Cividini et al. (2010). 2data from Pennisi et al. (2006). 3data from Négrel et al. (2002).
6 Conclusions
This study identifies geochemical processes occurring in the WACB aquifer. Major ion concentrations, 87Sr/86Sr ratios, δ11B values were used to determinate and quantify the main reactions controlling the downgradient chemical evolution of groundwater.
A 1D mass transport model provides evidence that the oxidation of organic matter by bacteria is a key mechanism controlling carbonate equilibria conditions.
Groundwater Sr concentrations reflect carbonate mineral dissolution and adsorption on coal surfaces. Isotopic analyses identify the release of labile radiogenic Sr2+ from coal surfaces, as well as water input from the overlying Wasatch formation.
Concentration and isotope ratio data for B further confirm the importance of pH-dependent ion-exchange reactions. Boron concentrations in groundwater could increase if acidification occurs.