

1 Introduction
Increased industrial, agricultural and urban development has increased nitrogen, phosphate and sulphate fluxes in many watersheds worldwide [e.g., (IEAE, 2013)]. Increased nutrient fluxes can negatively impact water quality in aquatic systems; adverse effects to ecosystems include eutrophication, hypoxia and acidification, all of which subsequently lead to a loss of biodiversity (Vitousek et al., 1997). NO3– has been found in increasing concentrations in surface waters and in groundwaters in many different locations worldwide (Kendall et al., 2007; Vitousek et al., 1997; Xue et al., 2009). Isotopic studies of nitrate in surface water and groundwater can be used to discriminate between sources of nitrate, as nitrate originating from different sources has characteristic δ15N and δ18O values (e.g., Kendall, 1998; Mayer et al., 2002). In addition, the process of denitrification preferentially metabolizes the light isotopes 14N and 16O thereby enriching 15N and 18O in the remaining nitrate (Böttcher et al., 1990). This leads to characteristic trends of increasing δ15N and δ18O values as nitrate concentrations decrease suggesting that denitrification occurs. Whether this process is coupled with oxidation of organic matter or with pyrite oxidation can be further revealed by isotope analyses on sulfate, since sulfide oxidation typically yields significantly increased concentrations of sulfate in the aquifer with low δ34S and δ18O values of the sulfate (McCallum et al., 2008). Other sources of SO42– with distinct isotopic compositions in aqueous systems include the atmosphere, pedosphere and lithosphere (Mayer, 2005), as well as anthropogenic activities. Lithospheric sources of SO42– include evaporites, and sulfide minerals in igneous, metamorphic and sedimentary rocks that oxidize to SO42–. Atmospheric SO42– can be derived from both natural and anthropogenic sources; however, in industrial countries, the majority of atmospheric SO42– has been identified to be of anthropogenic origin (Aravena and Mayer, 2010; Benkovitz et al., 1996; Mayer, 2005). Natural sources of atmospheric SO42– include volcanic emissions, sulfur emissions from wetlands and seaspray (Mayer, 2005), while anthropogenic activities contribute precursors of SO42– (e.g., SO2) to the atmosphere through burning of fossil fuels (Clark and Fritz, 1997). Soaps, detergents and fertilizers can also contribute anthropogenic SO42– to aqueous systems (Mayer, 2005). Therefore, the dual isotope approach for nitrate and sulfate (δ15N–NO3–, δ18O–NO3–, δ34S–SO42–, and δ18O–SO42–) is often effective in identifying the contaminant sources and the processes leading to nitrate and sulfate contamination of surface water and groundwater (Otero et al., 2009; Rock and Mayer, 2002). However, this approach has not been widely used to assess contamination sources for aquatic ecosystems in western Canada, including British Columbia.
The Kettle River Basin is located in South central British Columbia (BC), Canada, between the Monashee Mountains in the west, the Okanagan Highlands in the east and the US border in the south. The originally rather pristine watershed is drained by the Kettle and the West Kettle River and has recently been exposed to increasing anthropogenic pressures. The high number of surface water applications and licenses has resulted recently in lower flows than previously recorded (Outdoor Recreation Council of BC, 2011) and there are concerns that the quality of surface water and groundwater may deteriorate due to expanding anthropogenic land use. In a recent water quality report published by Environment Canada and the BC Ministry of Environment (2007), the water quality of the Kettle River at the sampling station Midway was ranked only as “fair” based on seasonal guideline exceedances of phosphorous and fluoride and other parameters associated with high turbidity during high flows and the Outdoor Recreation Council of BC ranked the Kettle River as the most endangered river in BC in 2011.
Previous water quantity and quality monitoring in the Kettle River Basis has focused on surface water systems. A water quality monitoring network began collecting data bi-weekly on the Kettle River at the Midway station at the outlet of the basin in 1972 (Environment Canada, 2003). Results and recommendations from the Water Quality assessment published by Dessouki (2009) state that aquatic life standards were seasonally exceeded by total aluminium, total chromium, fecal coliform, dissolved fluoride and total iron. This report recommended monitoring to be continued on the Kettle River to assess the impact of various land uses in the Kettle River Basin, to assess its potential as a source of drinking and irrigation water, and to monitor trans-boundary effects between British Columbia and Washington State (Dessouki, 2009). Aqueous chemistry of groundwater has not been previously systematically investigated in the Kettle River basin and there are only limited reports assessing surface water quantity and quality. As a consequence, the current impact of changing land use in the watershed on groundwater on surface water chemistry is unknown. The objective of this study was to delineate natural and anthropogenic sources and processes affecting NO3– and SO42– in surface waters and groundwater in the Kettle River Basin. A combination of hydrological, geochemical and isotopic approaches was used to achieve this goal.
2 Study area
The Kettle River Basin is located in South central British Columbia, Canada. The study area extended from the headwaters of the Kettle River and the West Kettle River, beyond their confluence to the Canadian–US border, south of the town of Midway (Fig. 1a). The Kettle River originates in the Monashee Mountains at an elevation of 1350 m above sea level (asl) and the headwaters of the West Kettle River are located in the Okanagan Highlands at 1250 m asl (Dessouki, 2009). The Kettle and West Kettle rivers flow south from their respective headwaters for circa 160 km and 105 km, respectively towards their confluence. Downstream of the confluence the river continues as the Kettle River, until the town of Rock Creek (BC), where the river turns east towards the town of Midway (BC). Beyond Midway, the Kettle River flows south into the United States at an elevation of 572 m asl. Beyond the confluence, the Kettle River flows for an additional 50 km before crossing the Canada–United States border.
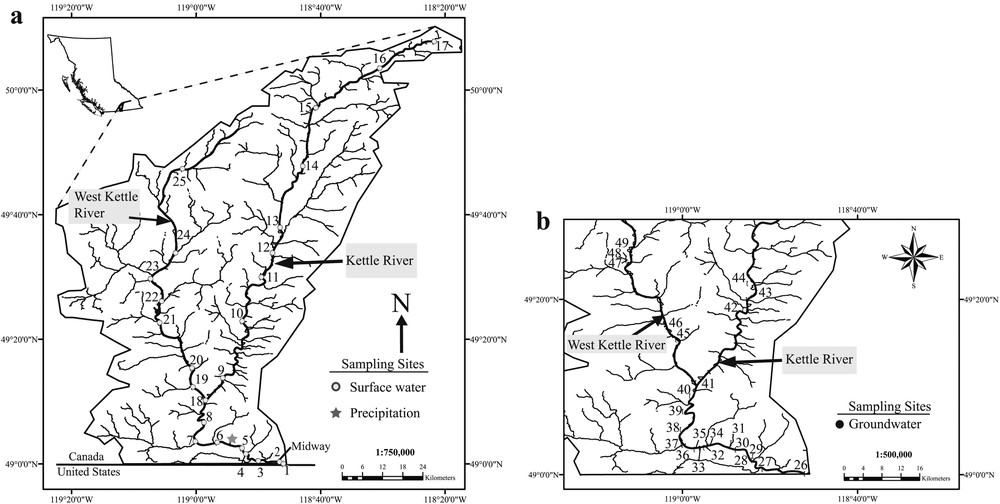
Location of the Kettle River Basin, and surface water (a) and groundwater (b) sampling stations.
2.1 Hydrology and hydrogeology
Historical average annual temperatures recorded between 1981 and 2010 vary from 5.0 °C at the Beaverdell North climate station to 10.4 °C at the Osoyoos climate station (Environment Canada, 2014). Average annual precipitation determined at the Beaverdell North and Osoyoos climate stations ranged from 323 mm to 485 mm between 1981 and 2010 (Environment Canada, 2014). This shows that the southern portion of the watershed between Rock Creek and Midway is characterized by higher temperatures and lower amounts of precipitation compared to the more northern areas within the basin.
Hydrometric stations located on the Kettle and West Kettle Rivers, prior to their confluence, indicate that the Kettle River contributes more to flow beyond the confluence. In 2009 and 2010, the daily maximum flow rates along the Kettle River prior to the confluence were 197 m3/s and 205 m3/s, respectively; the daily minimum flow rates were 1.4 m3/s and 1.6 m3/s in 2009 and 2010 (Environment Canada, 2014). Daily maximum flow rates along the West Kettle River prior to the confluence were 57 m3/s and 92 m3/s in 2009 and 2010, respectively, whereas the daily minimum flow rates were 0.5 m3/s in 2009 and 0.7 m3/s in 2010. The US Geological Survey (USGS) maintains a hydrometric station south of the US border at Ferry, Washington, that reported daily annual average discharge rates in 2009 of 30 m3/s and in 2010 of 37 m3/s, compared to the average value between 1929 and 2013 of 43 m3/s, indicating overall lower flow rates in 2009 and 2010 (USGS, 2014).
The BC Ministry of Environment Observation Well #306 located near Beaverdell, BC has recorded groundwater levels since 1989 (BC Ministry of Environment, 2014). The average groundwater levels measured in 2009 were 5.71 m below ground surface (mbgs) and in 2010 5.57 mbgs, compared to the daily annual average between 1990 and 2008 of 5.47 mbgs, indicating groundwater levels were lower in 2009 and 2010 compared to historical average levels. Observed decreases in surface water discharge rates and groundwater levels may be due to climatic conditions or anthropogenic surface water and groundwater use. There was not sufficient climate or anthropogenic water use data available to determine the reason for the decline.
2.2 Geology and topography
The Kettle River Basin is located within the Omineca belt in the Canadian Cordillera and is underlain by parts of the Kootenay and Quesnel terranes (Gabrielse and Yorath, 1991; Monger et al., 1982), The bedrock is composed of chert, volcanics, volcanoclastics, mudstones, siltstones and greenschist metamorphic rocks (BC Geological Survey, 2005). The topography in the Kettle and West Kettle River Basin is characterized by flat valley bottoms surrounded by steep bedrock hills. Advance and retreat of Pleistocene glaciers (Clague and James, 2002) lead to deposition of thick sequences of glacial and fluvial materials in valley bottoms. There is no information available on the origin of glacial materials in the Kettle River Basin and because of the size of the Cordilleran ice sheet, it is not possible to hypothesize on the provenance of these materials. The uppermost sections of the valley bottoms are comprised of fluvial materials, deposited by the Kettle and West Kettle Rivers, the provenance of which is likely derived from within the basin. Unconsolidated materials of either glacial or fluvial origin are composed of sand, gravel, silt and clay (Wei et al., 1993, 2010).
2.3 Anthropogenic activity
Anthropogenic activity within the basin began in the 1850s initially due to mineral exploration, which lead to development of several mines. The largest of these was the Highland Bell Mine, which was a silver-lead-zinc mine in continuous production between 1913 and 1991 (BC Ministry of Energy and Mines, 2011). Currently, there are several sites of active exploration (BC Ministry of Energy and Mines, 2011). Other types of anthropogenic activity include logging since much of the basin is forested (BC Ministry of Environment, 1997) and agriculture and ranching activities (Sprout and Kelly, 1964). Population in the basin is concentrated in the small towns of Midway, Rock Creek, Beaverdell, Westbridge and Bridesville and rural areas surrounding these towns. The 2011 census reported 674 people living in Midway; a population was not reported for other towns or rural areas (BC Stats, 2014).
3 Methods
3.1 Sampling campaigns and sampling locations
Surface water and groundwater samples were collected during three sampling campaigns in 2009 and 2010 on the following sampling dates: October 30–November 1, 2009, June 17–June 21, 2010 and October 15–18, 2010. Surface water samples were collected at various sites between the headwaters of the two rivers and their confluence, and between the confluence and the southernmost location on the river before it crosses the Canadian–US border. During each sampling campaign, between 22 and 25 surface water samples were collected. Groundwater samples were collected in 2010 from residential groundwater wells. In June of 2010, 23 groundwater samples were collected and in October of 2010, 25 groundwater samples were collected. The location of surface water and groundwater sampling stations are summarized in Table S1 and shown in Fig. 1a and b. In addition to surface water and groundwater samples, a total of four precipitation samples were collected between June 8 and June 18, 2010 from one location near Rock Creek, BC (49.061°N and –118.905°W).
3.2 Field methods
Surface water samples were collected from the river where the water was fast flowing and well mixed. During sample collection, a YSI probe was used to measure field parameters including temperature, pH, electrical conductivity and dissolved oxygen. Surface water and groundwater samples were collected for analysis of major anions (alkalinity, Cl–, SO42– and NO3–) and cations (Ca2+, Mg2+, Na+ and K+), silica and stable isotope abundance ratios of hydrogen (), oxygen (), NO3– ( and ) and SO42– ( and ). All water samples were filtered through a 45-μm Millipore filter, except those for alkalinity analysis and transported and stored either refrigerated or frozen. Sample water for major cation and anion analysis was collected in 125 mL plastic high-density polyethylene (HDPE) bottles. For cation analysis, HNO3– was added until the pH of sample water was less than 2.0. Sample water for stable isotope analysis of NO3– was also collected using 125 mL HDPE bottles and was preserved by freezing. Sample water for δ2H and δ18O analysis was collected in 10 mL vacuum-sealed containers.
Precipitation samples were collected during rain events. Sample bottles were opened during rain events and subsequently closed after the rain event. Precipitation samples were analyzed for major anion and cation concentrations, and δ2H and δ18O values.
3.3 Laboratory methods
All laboratory analysis was completed at the University of Calgary, either in the Applied Geochemistry Group Laboratory or in the Isotope Science Laboratory.
3.3.1 Anions and cations
Major anions including SO42– and NO3– concentrations were analysed by Ion Chromatography (IC) (Dionex ICS-2000). When measured more than once, the average of the measurements was reported. Concentrations of major cations were determined by Atomic Absorption Spectrometry (PerkinElmer AAnalyst 100) and alkalinity was measured by titration with 0.1 N sulfuric acid. The reported uncertainty associated with each of these methods was less than 5%. Charge balance was calculated using major anion and cation concentrations and was usually better than 3% for surface water samples and the average charge balance of groundwater samples was 0.7% (Table S1).
3.3.2 Stable isotope analyses
Hydrogen (2H/1H) and oxygen isotope ratios of water (18O/16O) were measured using a Los Gatos Research “DLT-100” laser spectroscopy instrument. The measurement uncertainty of δ18O is ± 0.2‰ and for δ2H is ± 1.0‰. Measured δ18O and δ2H values are reported relative to Vienna Standard Mean Ocean Water (V-SMOW).
The stable isotope composition of dissolved NO3– (15N/14N and 18O/16O) was determined using the “denitrifier method”, which reduces NO3– to the measurement gas N2O using denitrifying bacteria (Casciotti et al., 2002; Sigman et al., 2001). δ15N values of nitrate were determined with a measurement uncertainty of ± 0.5‰ and for δ18O values of nitrate with an uncertainty of ± 1.0‰. The obtained and values were calibrated and normalized against N2 (air) and V-SMOW using international reference materials.
The stable isotope composition of dissolved SO42– (34S/32S, 18O/16O) was determined by first producing a pure BaSO4 precipitate by addition of BaCl2 solution. Subsequently, the dried BaSO4 was thermally decomposed in an elemental analyser to SO2 and in a pyrolysis reactor to CO for subsequent sulfur and oxygen isotope ratio measurements, respectively, that were normalized with several international reference materials. values are reported relative to Vienna Canyon Diablo Troilite (V-CDT) with a measurement uncertainty of ± 0.3‰. δ18O values of dissolved sulphate are reported with respect to V-SMOW with a measurement uncertainty of ± 0.5‰.
4 Results and discussion
4.1 δ2H and δ18O
The δ18O and δ2H values of precipitation, surface water and groundwater samples in the Kettle River Basin were used to assess the temporal and spatial variations of source water, and processes, such as evaporation. Precipitation in the southern interior of British Columbia is dominantly derived from weather systems that originate from the Pacific Ocean that experience successive rainout of the heavy isotopes 2H and 18O causing δ18O and δ2H values of atmospheric moisture and subsequent precipitation to become increasingly more negative with increasing distance from the coast (Yonge et al., 1989). In the summer months, precipitation can be partially augmented by local water vapour sources due to convective activity caused by evaporation and transpiration due to high rates of insolation and cool unstable air (Athanasopoulos, 2009; Wassenaar et al., 2011). A local meteoric water line has been established for the Okanagan Basin (OMWL) which borders the Kettle River Basin, to the west with a relation of δ2H = 6.6 × δ18O – 22.7 based on 106 precipitation samples collected between April 2006 and June 2010 (Wassenaar et al., 2011). The Global Meteoric Water Line (GMWL) follows the relationship δ2H = 8 × δ18O + 10 (Craig, 1961). The few δ18O and δ2H values of precipitation water collected near Rock Creek plot either along the OMWL or between the OMWL and the GMWL and had average δ18O values of –15.2 ± 1.7‰ (n = 4) and δ2H values of –117 ± 13‰ (n = 4). δ18O values ranged from –17.7 to –13.8‰ and δ2H values ranged from –134 to –103‰.
Isotopic compositions of surface water samples plot within a narrow range of values between the GMWL and the OMWL (Fig. 2). The average δ18O and δ2H values of surface water samples were –17.0 ± 0.4‰ and –129 ± 3‰ (n = 72), respectively. δ18O values ranged from –17.9 to –16.4 ‰ and δ2H values ranged from –137 to –125‰. Only slight variations in isotopic compositions beyond the measurement uncertainty were observed along the flow paths of the Kettle River and along the West Kettle River. This indicates that surface water is of meteoric origin and has not undergone significant evaporation.
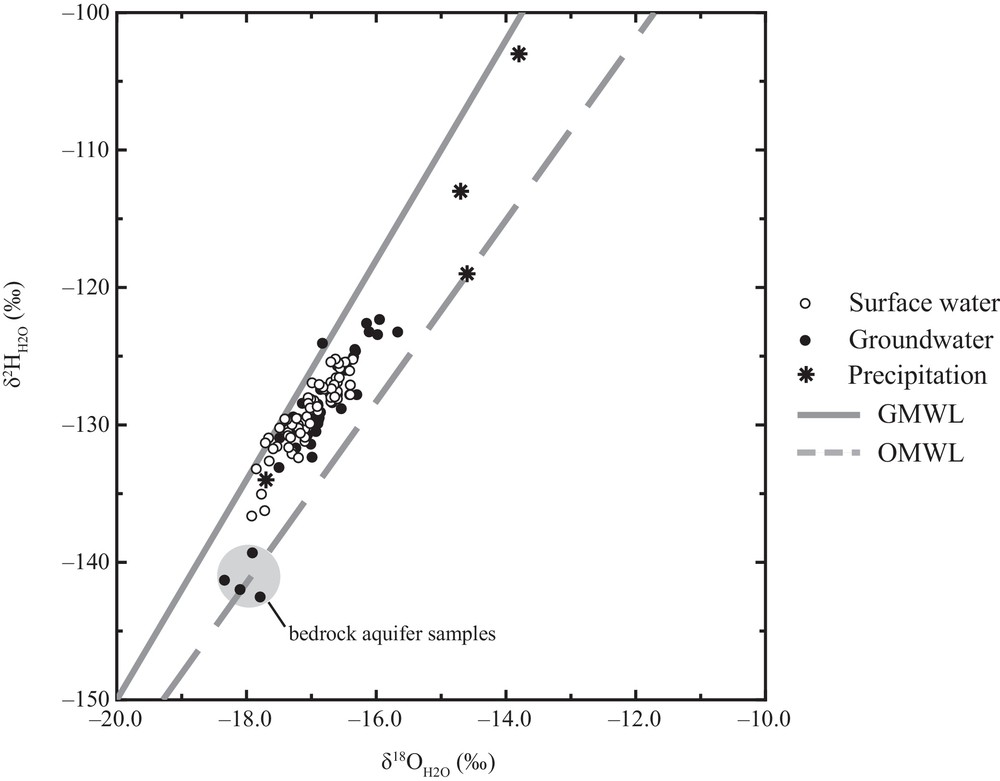
and values of precipitation water, surface water and groundwater. Samples are shown in relation to the Global Meteoric Water Line (GMWL) and the Okanagan Meteoric Water Line (OMWL; Wassenaar et al. (2011)).
The δ18O and δ2H values of groundwater samples plot between the GWML and the OMWL, and most samples fall within the range of precipitation samples (Fig. 2). The average δ18O and δ2H values of groundwater samples were –16.9 ± 0.5‰ and –129 ± 5‰ (n = 48), respectively. δ18O values ranged from –18.3 to –15.7‰ and δ2H values ranged from –143 to –122‰. Groundwater and surface water samples have very similar ranges in δ18O and δ2H values (Fig. 2), suggesting that surface waters are primarily derived from groundwaters originating from unconsolidated valley aquifers. Groundwater samples from two locations were found to have more negative δ18O and δ2H values compared to other groundwater samples and precipitation (circled in Fig. 2). Based on the location of these samples, this water is likely representative of bedrock aquifers.
4.2 Major ion chemistry
A summary of average concentrations of major anions, cations and total dissolved solids (TDS) for surface water samples collected before and after the confluence of the Kettle and West Kettle Rivers and for groundwater is provided in Table 1. Surface water and groundwater samples were dominantly Ca–HCO3 water type with only two groundwater samples with Na–HCO3 water type. These two samples were also characterized by more negative δ18O and δ2H values compared to other groundwater samples and precipitation, suggesting that these two groundwater samples originate from bedrock aquifers.
Average major anion and cation concentrations in the Kettle and West Kettle Rivers, and in groundwater.
| Sampling event | Location and type of sample | HCO3– (mg/L) |
NO3– (mg/L) |
Cl– (mg/L) |
SO42– (mg/L) |
Ca2+ (mg/L) |
Mg2+ (mg/L) |
Na+ | K+ | Si4+ (mg/L) |
TDS (mg/L) |
| Oct. 2009 and 2010 | Kettle before confluence | 64 | 0.09 | 0.7 | 4.1 | 18 | 1.7 | 1.7 | 0.59 | 4.6 | 96 |
|
|
West Kettle before confluence | 63 | 0.10 | 3.7 | 5.2 | 17 | 2.9 | 3.5 | 0.93 | 6.6 | 101 |
| Kettle after confluence | 80 | 0.20 | 2.1 | 6.6 | 21 | 3.4 | 3.7 | 0.95 | 5.8 | 124 | |
| June 2010 | Kettle before confluence | 30 | – | 0.31 | 2.2 | 10 | 0.76 | 0.70 | 0.36 | 3.5 | 48 |
| West Kettle before confluence | 19 | – | 1.1 | 1.3 | 5.9 | 1.0 | 1.5 | 0.46 | 5.1 | 36 | |
| Kettle after confluence | 26 | – | 0.63 | 1.8 | 8.2 | 1.1 | 1.3 | 0.48 | 4.7 | 45 | |
| Oct. 2009 & 2010 | Groundwater | 190 | 28 | 11 | 29 | 49 | 9.2 | 22 | 2.4 | 8.3 | 341 |
| June 2010 | Groundwater | 196 | 6.3 | 11 | 28 | 48 | 9.8 | 23 | 2.0 | 8.3 | 330 |
Concentrations of dissolved constituents in surface water were generally lower in the high run-off season in June and higher during base flow in October. Bicarbonate was the dominant anion ranging from average concentrations of 19 to 80 mg/L, followed by SO42– (1.3 to 6.6 mg/L), while average Cl– and NO3– concentrations were < 4 and < 0.25 mg/L, respectively. Average cation concentrations in surface water samples were dominated by Ca2+ ranging from 5.9 to 21 mg/L, followed by silica concentrations varying between 3.5 and 6.6 mg/L, while average concentrations of other cations were consistently < 4 mg/L. TDS of surface waters ranged from 36 mg/L at high flow to 124 mg/L at base flow. The dominant anion in groundwater was bicarbonate with an average concentration of 193 mg/L, followed by SO42– (28 mg/L), NO3– (17 mg/L) and Cl– (11 mg/L). Ca2+ was the cation measured in highest concentrations in groundwater (49 mg/L), followed by Na+ (23 mg/L) while the average concentrations of other cations (Mg2+, K+ and Si4+) were less than 10 mg/L. Groundwater TDS ranged from 145.7 to 571.5 mg/L with an average value of 336 mg/L and exhibited little variation between June and October at the re-sampled groundwater wells.
4.3 Occurrence and sources of nitrate
High concentrations of NO3– in aqueous systems can negatively influence ecosystems and human health. The maximum allowable concentration of NO3– in drinking water in Canada is 45 mg/L (Health Canada, 2010) since elevated NO3– concentrations in drinking water can potentially cause methemoglobinia, gastric cancer and non-Hodgkin's lymphoma (Babiker et al., 2004). In the Grand Forks area east of the study area, elevated NO3– concentrations in groundwater have been previously reported and were thought to be associated with agricultural practices, although the specific source has not been identified (Wei et al., 2010). In the agricultural areas surrounding Osoyoos, to the west of the Kettle River Basin, elevated NO3– concentrations have also been detected in groundwater which is thought to originate from synthetic fertilizers associated with agricultural practices (Athanasopoulos, 2009). Therefore, we evaluated the occurrence of nitrate in surface waters and groundwaters of the study area and attempted to determine the nitrate sources.
4.3.1 NO3– concentrations
NO3– was not detected in surface water samples collected in June 2010, whereas in October 2010, NO3– concentrations of surface waters sampled were generally less than 0.5 mg/L, with the exception of one sample with a concentration of 1.7 mg/L, but NO3– contributes on average only 0.1% of TDS. NO3– concentrations in groundwater samples from the Kettle River Basin varied from “not detected” to 41.3 mg/L, approaching the maximum allowable concentration for drinking water (Health Canada, 2010). The average concentration of detectable NO3– in groundwater was 27.7 ± 8.5 mg/L in June (n = 18) and 6.3 ± 5.7 mg/L in October (n = 16) indicating significant nitrate pollution of some aquifers constituting on average 5.8% of TDS. The NO3– concentrations of precipitation samples ranged from 0.92 to 2.06 mg/L with an average NO3– concentration of 1.4 ± 0.6 mg/L (n = 3).
4.3.2 and values
It was only possible to determine δ15N and δ18O values for one surface water sample from June and six samples from October of 2010, due to low NO3– concentrations. δ15N values of surface water nitrate ranged from 3.0 to 7.2‰ and δ18O values ranged from –0.6 to 8.1‰. The average δ15N value of surface water nitrate was 5.1 ± 1.8‰ (n = 7) and the average δ18O value of NO3– was 3.2 ± 3.0‰ (n = 7). δ15N values for groundwater nitrate ranged from 2.5 to 18.9‰ and δ18O values of nitrate ranged from –8.7 to 5.5‰. The average δ15N value of groundwater nitrate was 7.2 ± 3.9‰ (n = 38) and the average δ18O value of NO3– was –3.7 ± 3.2‰ (n = 38).
4.3.3 Identification of nitrate sources
Natural sources of NO3– in watersheds include predominantly nitrification of soil organic matter and to a much smaller extent biogenic soil emissions. Anthropogenic sources include synthetic fertilizers, animal manure, septic systems, wastewater treatment effluents, and anthropogenic N sources contributing to atmospheric N deposition (Kendall et al., 2007). Denitrification, a redox reaction that occurs under anoxic conditions, is a key process with the potential to decrease NO3– concentrations in groundwater and surface waters (Aravena and Robertson, 1998; Mayer et al., 2002; Seitzinger et al., 2002).
Sources of NO3– can often be differentiated using a dual isotope approach based on the stable isotope ratios of N (15N and 14N) and O (18O and 16O), as different sources of NO3– often have unique combinations of and values (e.g., Mayer, 2005; Kendall et al., 2007; Xue et al., 2009). Plotting δ15N versus δ18O values in relation to the isotopic compositions of different NO3– sources from the literature reveals that nitrate in surface water and groundwater of our study area is mainly derived from soil nitrification, sewage and/or manure (Fig. 3a). Surface water and groundwater samples plot within the range of soil nitrification and within the overlap between soil nitrification and sewage/manure. This suggests that NO3– is derived from soil nitrification, effluents from wastewater treatment or septic systems, manure or is a mixture of these sources. The spatial distribution of δ15N values of groundwater samples was investigated to determine whether the groundwater NO3– derived from sewage/manure originates from several point sources or a non-point source. Anthropogenically influenced groundwaters, as indicated by δ15N values greater than 8.0‰, are distributed throughout the Kettle River Basin, indicating the contamination originates from various point source locations.
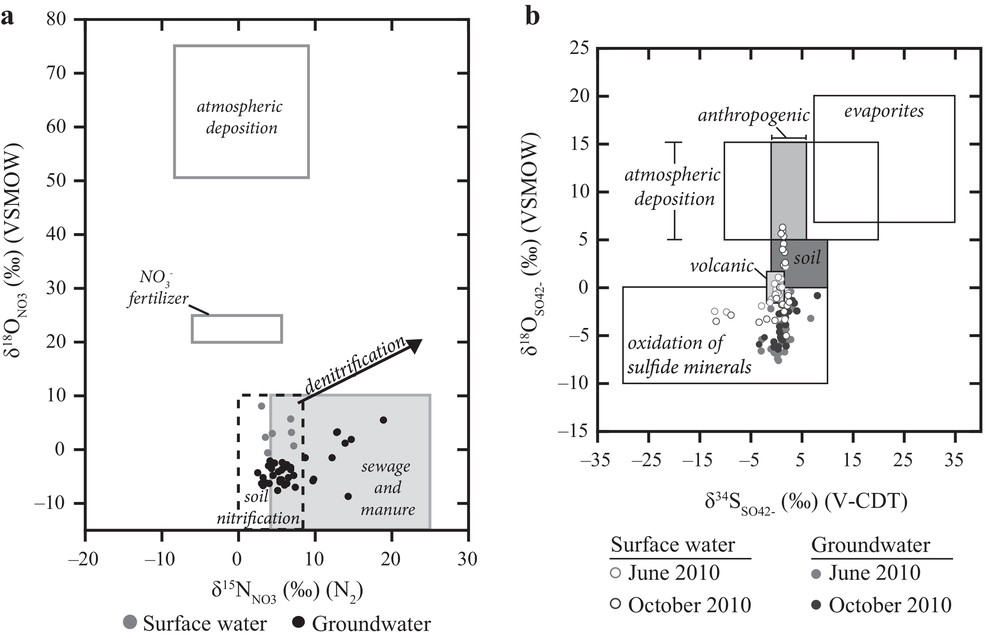
Surface water and groundwater δ15N and δ18O values of NO3– in relation to isotopic compositions of potential NO3– sources (a: after Mayer, 2005 and Kendall et al., 2007) and surface water and groundwater and values in relation to isotopic compositions of potential SO42–sources (b: after Mayer, 2005).
A combination of concentration and isotopic data can be used to assess mixing between NO3– from soil nitrification and sewage/manure, or to indicate whether or not denitrification is an active process attenuating NO3– concentrations (Mayer et al., 2002). If mixing of nitrate from two different sources is occurring, NO3– concentrations and δ15N values typically increase. In contrast, if denitrification is occurring NO3– concentrations decrease and δ15N values increase. NO3– concentrations of surface water and groundwater samples are plotted versus δ15N values in Fig. 4, and expected mixing and denitrification trends are indicated with arrows. Surface water nitrate concentrations are very low; however, there are three samples (circled in Fig. 4a) that, based on elevated values compared to the other surface water samples, may have NO3– derived from a mixture of soil nitrification and nitrate from effluents of waste waters, septic systems or manure. All three of these samples were collected from locations downstream of population centers; two were collected downstream of Rock Creek and one was collected downstream of Beaverdell. Hence, the values of these three samples suggest a slight anthropogenic NO3– influence on surface waters downstream of population centres most likely from wastewater effluents.
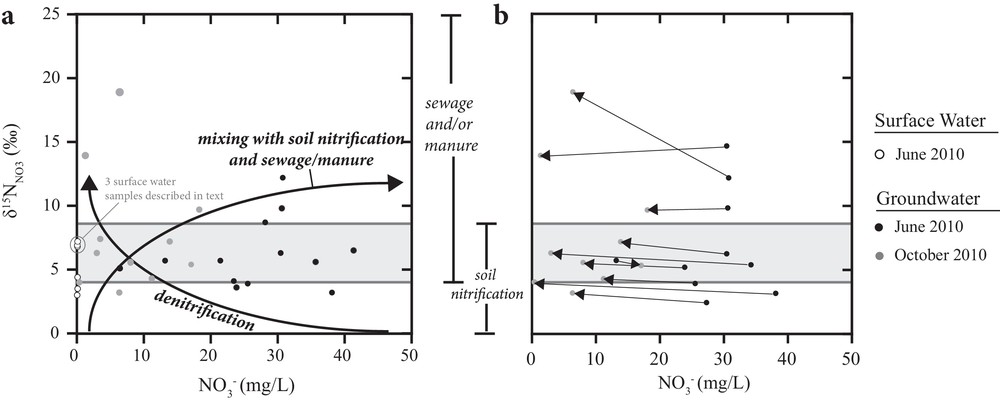
Surface water and groundwater values versus NO3– concentrations. Ranges of of sewage and/or manure and soil nitrification are indicated. Mixing and denitrification trends are indicated with arrows in (a). Samples collected from the same sampling stations or wells in June and October are connected with lines in (b).
As shown in Fig. 4b, groundwater samples had higher NO3– concentrations in June compared to October. The higher NO3– concentrations in June could be due to recharge during snowmelt delivering NO3– from soil nitrification, septic systems or manure to the groundwater. In order to identify possible mixing or denitrification trends, the values and concentrations of NO3– of samples collected in June and October from the same well were connected (Fig. 4b). In most locations, the δ15N values did not vary significantly despite decreasing nitrate concentration indicating that the source of NO3– did not change temporally. Only at one groundwater sampling site did values increase and concentrations decrease between June and October suggesting that denitrification may have occurred in this aquifer. Because dissolved oxygen concentrations of groundwater samples collected from this well were 10.6 mg/L in June 2010 and 6.3 mg/L in October of 2010, denitrification is likely not an active process in the aquifer and instead the source of NO3– appears to change temporally.
Considering concentration and stable isotope data for NO3–, only three surface water samples were identified to have slight anthropogenic influence and 6 of 25 groundwater samples are likely to have NO3– originating from either waste water effluents from septic systems or manure. Denitrification does not appear to be an active process attenuating NO3– concentrations in groundwater accessed by the sampled wells in the Kettle River Basin.
4.4 Occurrence and sources of sulfate
Since no SO42– concentration data have been reported for groundwater in the Kettle River Basin and its proximal areas, we evaluated the occurrence and sources of sulfate in surface waters and groundwaters of the study area and the potential connection to nitrate contamination.
4.4.1 SO42– concentrations
Surface water SO42– concentrations ranged from 0.7 to 8.3 mg/L and the average concentration of all surface water samples was 4.0 ± 2.3 mg/L (n = 72). Fig. 5a depicts surface water SO42– concentrations with increasing distance downstream. On average, SO42– in surface water constituted 4.5% of TDS. Groundwater SO42– concentrations ranged from 4.3 to 145.6 mg/L and the average SO42– concentration of groundwater samples was 28.4 ± 32.1 mg/L (n = 48) comprising 7.6% of TDS.
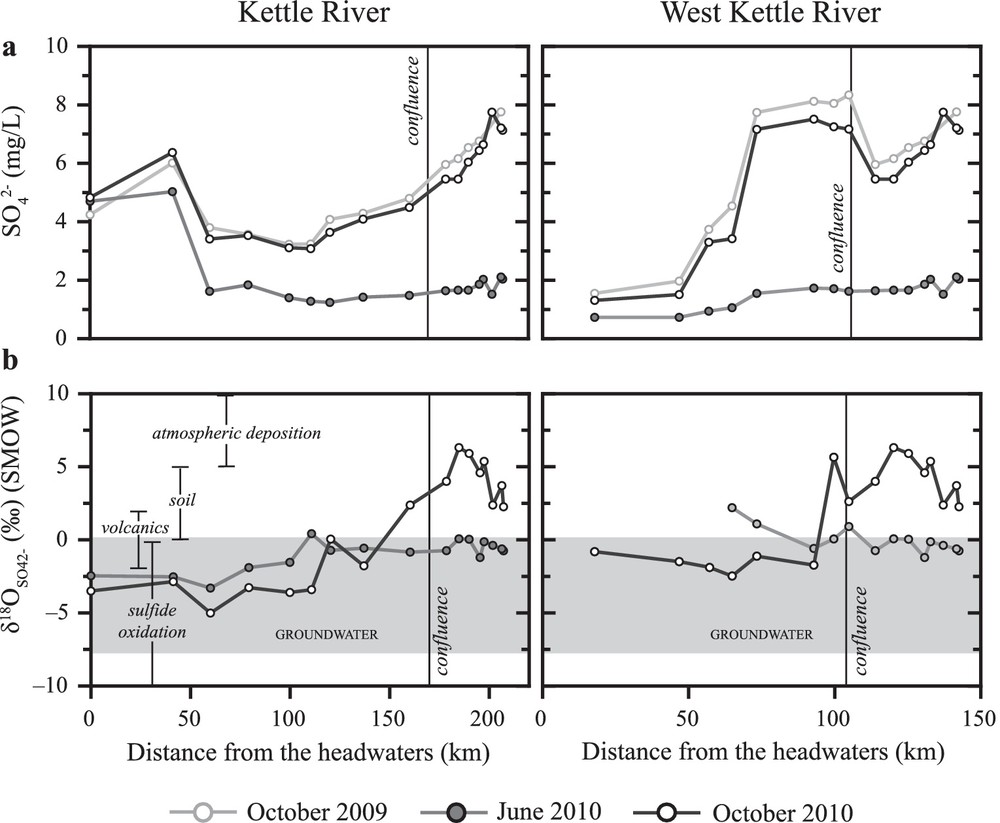
Surface water SO42– concentrations (a) and values (b) with distance downstream along the Kettle and West Kettle Rivers, in relation to the ranges of values of groundwater samples and sources of sulphate.
4.4.2 and values
δ34S values of surface water SO42– ranged from –12.1 to 2.5‰ and the average δ34S value of SO42– in surface waters samples was –0.3 ± 3.4‰ (n = 47). δ18O values in surface water sulfate ranged from –5.0 to 6.3‰ (Fig. 5b) and the average δ18O value of SO42– was 0.0 ± 2.8‰ (n = 47). The range of groundwater values was –3.4 to 8.0‰ and the range in values was –7.6 to 0.1‰ (Fig. 5b). The average δ34S value of SO42– was 1.2 ± 2.1‰ (n = 48) and the average δ18O value of SO42– was –4.3 ± 1.9‰ (n = 48).
4.4.3 Identification of sulfate sources
The δ34S and δ18O values of the various sources of SO42– have been extensively studied and documented (e.g., Claypool et al., 1980; Mayer, 2005; Seal, 2006) revealing the following: sulfate from evaporite dissolution is characterized by elevated δ34S and δ18O values; sulfate from sulfide mineral oxidation is often characterized by low δ34S and δ18O values; sulfate from atmospheric deposition in industrialized countries has typically δ34S values from 0 to 6‰ and δ18O often > 5‰, whereas sulfate derived from mineralization of soil organic sulfur has a similar range of δ34S values, but lower δ18O values than sulfate from atmospheric deposition.
Plotting δ34S and δ18O values for surface water SO42– from the Kettle River Basin (Fig. 3b) indicates that the sources of surface water SO42– are sulfide oxidation in bedrock or Quaternary deposits, with possible contributions from mineralization in soils and/or atmospheric SO42– deposition. Surface water samples collected from the two sampling sites closest to the headwaters of the Kettle River have more negative values (–12.1 to –8.9‰) compared to other surface water (–3.4 to 1.9‰) and groundwater samples. These values combined with low δ18O values of sulfate are indicative of oxidation of sulfide minerals in the sedimentary and volcanic lithologies. Lithological differences underlying the sampling sites is a potential reason for the more negative δ34S values at the headwaters of the Kettle River, as sedimentary units contain sulfide minerals that often have more negative δ34S values than sulfides in volcanic lithologies (Seal, 2006).
δ18O values of SO42– in surface water samples indicate that additional sources of SO42–may also be influencing surface water samples. Fig. 5b shows values in surface water samples plotted against distance downstream, in relation to the ranges of δ18O values of respective SO42–sources. Upstream of the confluence of the Kettle and West Kettle Rivers, δ18O values of SO42–are within the range of SO42–from sulfide oxidation and mineralization of soil organic sulfur, however downstream of the confluence, a few samples fall within the range of values of SO42– derived from atmospheric deposition or mineralization of organic soil sulfur. Sulfate from atmospheric deposition that has cycled through the pedosphere, or potentially sulfate from local anthropogenic impacts may be responsible for the increasing δ18O values of surface waters in the more populated area after the confluence of West Kettle and Kettle Rivers (Fig. 5b).
As shown in Fig. 5b, the dominant source of groundwater SO42– appears to be oxidation of sulfide minerals but we found no evidence that sulfide oxidation is linked to denitrification. The isotopic composition of a few SO42– samples that are close to the soil SO42– range suggest that this may be an additional source of SO42– to groundwater.
5 Conclusions
We investigated the geochemical compositions of surface water and groundwater and identified the natural and anthropogenic sources and processes influencing NO3– and SO42– in the Kettle River Basin. Interpretation of and values and NO3– concentration data suggest that NO3– in surface water and groundwater is predominantly derived from natural sources, with some evidence of additional contributions from anthropogenically derived NO3–, in both surface water and groundwater samples. Possible anthropogenic influence on surface water samples was confined to three samples collected directly downstream of population centres suggesting that waste water effluent is the likely nitrate source. Groundwater samples identified to contain anthropogenic NO3– were confined to point source locations and manure or septic systems were identified as the likely nitrate sources. Based on and values of surface water and groundwater samples, the source of SO42– appears to be primarily from natural processes, including oxidation of sulfide minerals and mineralization of soil sulfur compounds, although the latter are in part derived from anthropogenically impacted atmospheric SO42– deposition. The obtained data provide a solid baseline against which impacts of future anthropogenic activities on quantity and quality of groundwater and surface water in the watershed can be assessed.
Acknowledgments
Financial support from the Natural Sciences and Engineering Research Council of Canada (NSERC) to Ian Hutcheon and Bernhard Mayer enabled this study and is gratefully acknowledged.