

1 Introduction
Tidal currents in estuaries induce resuspension and transport of sediments. These processes are of great importance for coastal engineering, as they have a direct impact on human facilities, such as dams, dykes and waterways. Over longer time scales, they are also responsible for the sediment infilling of estuaries (Dalrymple et al., 1992). Sediment suspension and transport are more intense during the peaks of flood and ebb currents, the velocity of which can reach values up to a few meters per second. High suspended sediment concentrations (SSC) are generally observed at the head of the estuary at the fresh/salt water interface. For instance, Castaing (1981) measured SSC of 20 g/L during a flood in the Garonne estuary. This turbidity maximum zone (TMZ) has been widely studied by in situ measurements (e.g., Jiufa and Chen, 1998; Uncles and Stephens, 1993).
In some tide-dominated estuaries, tidal bores represent another potential mechanism for strong sediment resuspension. This wave propagating upstream in channels is generated by the water level difference between the front of the rising tide and the river level at low flow, controlled by the fluvial discharge. The hydrodynamics of tidal bores have been investigated in recent studies (Furgerot, 2014; Huang et al., 2013; Simon, 2013; Simpson et al., 2004). The impact of tidal bores on sediment resuspension has been estimated by punctual SSC measurements (Chanson et al., 2011; Fan et al., 2014; Furgerot et al., in press; Wolanski et al., 2004). Chanson et al. (2011) present the only quantitative estimation of sediment fluxes from ADV measurements. Unfortunately, the deduction of SSC from ADV signal amplitude in one point of the water column induces significant uncertainties. In all cases, SSC measurements in highly turbid and turbulent flows remain a technical challenge. SSC can be measured by various techniques (acoustic, optical, sampling), which all require a calibration in laboratory with sediment from the measurement site (van Rijn, 2007).
In this paper, we compare two methods of SSC measurement in loaded flow: the optical method and direct sampling. We apply these methods to SSC measurements during a tidal bore passage in the Sée River (Mont-Saint-Michel Bay, NW France). A first quantification of the bore hydrodynamics and SSC has been presented in Furgerot et al. (in press). After a significant laboratory calibration step, we discuss the reliability of both measurement methods. Once corrected, the SSC data coupled with velocity measurements allow us to calculate reliable sediment fluxes during tidal bore passages.
2 Measurement site
2.1 The Mont-Saint-Michel Bay: general context
The Mont-Saint-Michel Bay (English Channel, NW France) is a 500-km2 depression nested between Brittany and the Cotentin Peninsula (Fig. 1A). It is characterized by a C-type hypertidal regime (Archer, 2013), semi-diurnal with an insignificant diurnal inequality. The hypertidal range that reaches up to 14 m at the seaward entrance of the bay is due to the reflection of the incoming tidal wave from the Atlantic Ocean along the Cotentin Peninsula, which induces an amplified standing wave (Larsonneur, 1989).
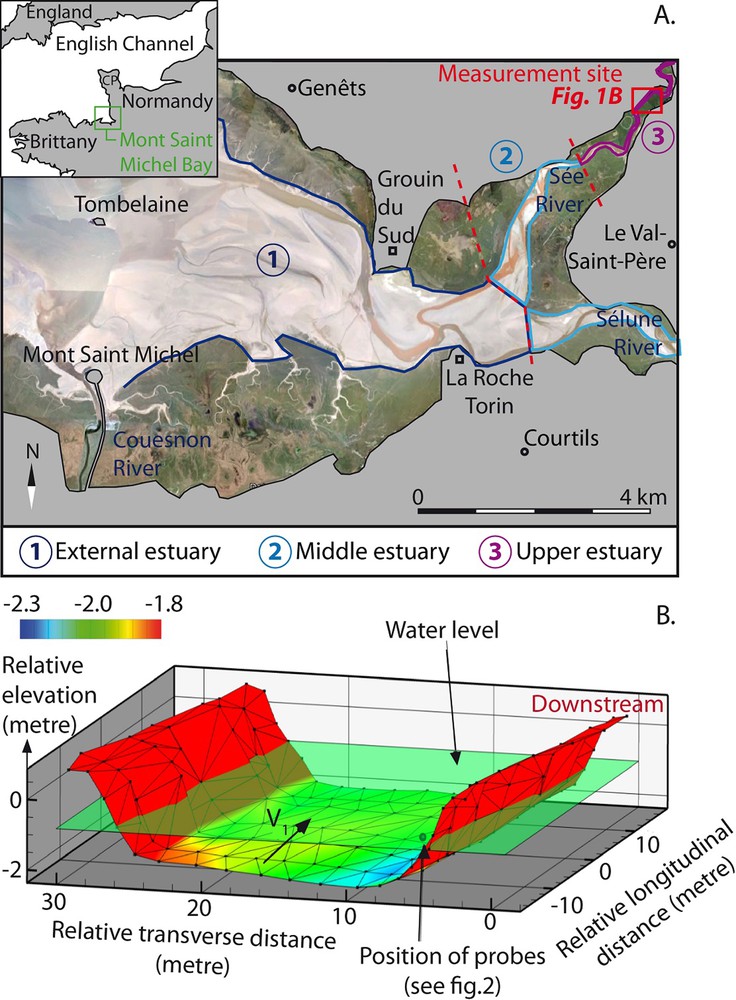
A. Spot image (2007) of the estuarine system in the eastern part of Mont-Saint-Michel Bay. The site of tidal bore measurements (“Le Bateau”) is located upstream on the Sée River (red square). The three distinct estuarine areas (1, 2, 3) are defined on the basis of tidal channel mobility. CP: Cotentin Peninsula. B. 3D reconstruction of the Sée River channel at “Le Bateau”. The water level corresponds to a low tide level for a low river flow (V1).
Three main rivers flow into the south-eastern part of the bay, the Couesnon, the Sélune and the Sée rivers, forming an extensive tidal estuary. The large tidal ranges induce high-energy tidal currents (up to 2 m/s) controlling sedimentary processes and channel migration (Lanier and Tessier, 1998). Three distinct estuarine areas are defined based on tidal channel mobility:
- • the external estuary with highly mobile channels;
- • the middle estuary with low migration rate channels;
- • the upper estuary with channelized rivers (Fig. 1A).
Tidal bores are observed potentially in these three zones (Furgerot, 2014), depending on local channel morphology.
2.2 Measurement site “Le Bateau”
Tidal bore measurements were performed in the Sée River, about 15 km upstream of the estuary mouth (i.e. Tombelaine, Fig. 1A) on a site named “Le Bateau” where maximum tidal range reaches 1.5 m. The mean annual river discharge is less than 10 m3/s, and never exceeds 20 m3/s during the wet season. Biennial flood discharge is in the order of 50 m3/s (Bonnot-Courtois et al., 2002).
The general morphology of the channel is a 570-m-long straight section between elbow meanders, and bordered by marsh banks (Fig. 1A). Topo-bathymetric profiles were performed across the channel using a tachometer, covering a longitudinal distance of 40 m. The spacing of measurement points was approximately 2 m. A total of 140 points were used to reconstruct the channel morphology (Fig. 1B). The bankfull channel width is around 30 m, and is fairly constant along the stretch with a longitudinal slope of 0.16% in average. The channel cross-section (Fig. 1B) reveals steep banks (∼ 30°) and a flat 20-m-wide bottom. Water depth at low tide is frequently lower than 1 m (Fig. 2). Bankfull conditions are reached during high tides and high water discharges, with water depths of 2.5 m.
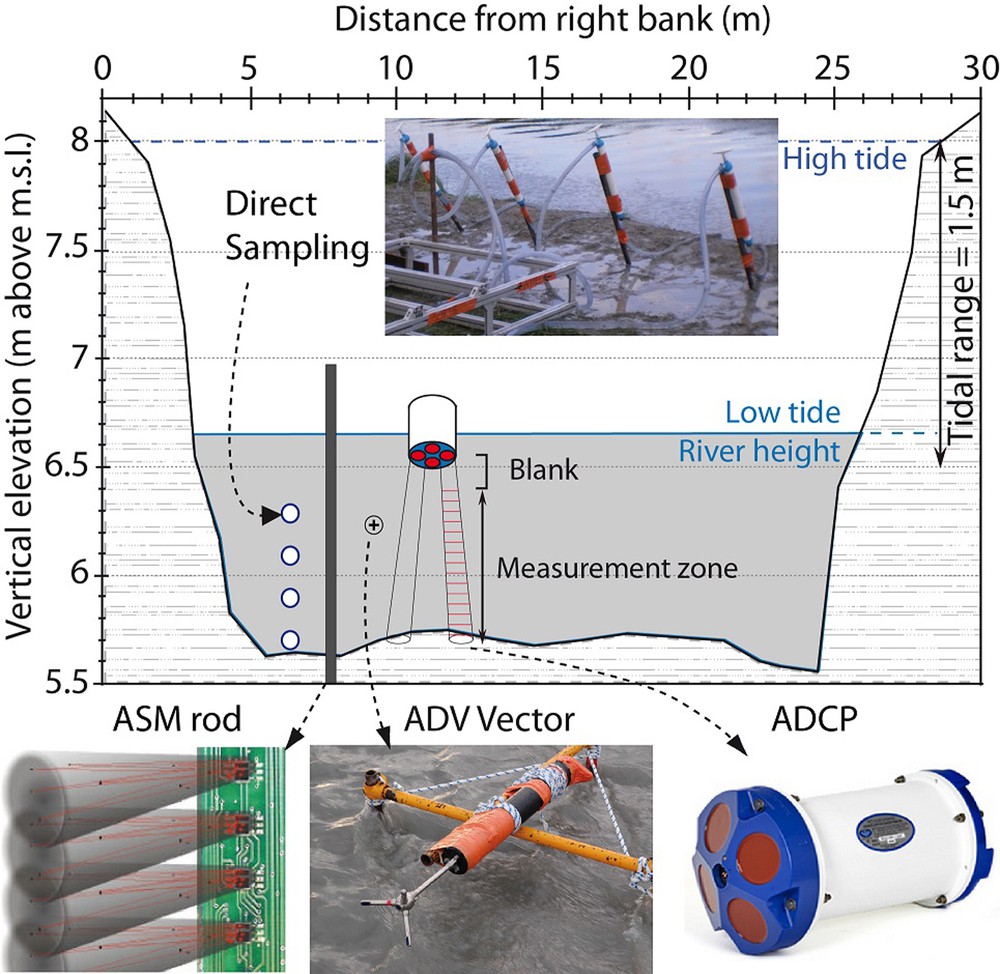
In situ measurement setup in the channel cross-section (“Le Bateau” locality, Sée River): ASM: Argus Surface Meter; ADV: Acoustic Doppler Velocimeter; ADCP: Acoustic Doppler Current Profiler; m·s.l.: mean sea level.
In addition to its local channel morphology, the river water depth at low tide, exclusively controlled by the fluvial discharge, is a critical parameter for tidal bore development and shape (Huang et al., 2013). Breaking bores are observed when the water depth is low, causing an aeration of the wave. Undular bores develop with larger water depths, and are characterized by a succession a wave forms with a wavelength around 2 m and a smooth surface. If fluvial discharge is too large, the tidal wave is rapidly attenuated in its upstream propagation, inhibiting tidal bore development. This phenomenon was observed on the Sée River during a flood event in January 2014, with a peak discharge above 35 m3/s.
The shape of the tidal bore is also sensitive to the evolution of the water depth during its upstream propagation. Generally, the tidal bore is undular over the whole rectilinear section. Then, it evolves progressively toward a breaking bore at the end of the section.
At “Le Bateau” measurement site, tidal range can be considered as large in comparison with the river discharge, which is in average very low, so that in addition to the local channel morphology, conditions are favorable for steady tidal bore development.
2.3 Sediment characteristics
The backscattered signal of optical or acoustic probes used to measure suspended sediment concentration strongly depends on the sediment particle shape, composition, and size (Moate and Thorne, 2012; Thorne and Meral, 2008). It is therefore critical to properly characterize the sediment in suspension at the measurement site.
The solid discharge of the three rivers entering the bay is almost negligible (Bonnot-Courtois et al., 2002; Larsonneur, 1989). This implies that the sediment infilling the Mont-Saint-Michel Bay is almost exclusively of marine origin, and composed of siliciclastic material reworked from the English Channel seafloor by tidal currents and waves, and of biogenic carbonates (mainly shell fragments and red algae).
The mean sediment size decreases progressively from offshore to the most internal parts of the bay. In the middle to upper estuary, sediments are composed of silty sands to sandy silts, named locally “tangue” (Bourcart and Charlier, 1959; Larsonneur, 1989; Tessier, 1993). According to particle size analysis, the mode of the “tangue” grain size distribution is 116 μm in the outer estuary (at Grouin du Sud – Fig. 1A) and decreases upstream to 80 μm at the “Le Bateau” site, where d10 is 25 μm and d90 is 138 μm, indicating well-sorted sediments. The “tangue” contains an average of 50% of carbonates, mainly composed of shell fragments and foraminifera tests, and almost no clay and organic matter. This composition induces heterogeneous and highly irregular particle shapes, from spherical to elongated or flat shapes.
This peculiar sediment is suspected to have a significant influence on the measurement methods of the SSC, and thus implies a rigorous calibration of the instruments (direct and indirect) using sediment sampled from the study site.
3 Methods
Various parameters were measured in situ during the passage of 30 tidal bores (10 field campaigns from January 2011 to May 2012): salinity, temperature, sediment rheology and grain size, flow velocities in the three directions and SSC. Only the results of velocity and SSC measurements obtained during one campaign (May 2012) are presented herein. This is the only campaign where turbid water samples were collected at four elevations across the water column. The arrangement of the instruments used in this paper is presented in Fig. 2.
3.1 Suspended sediment concentration: measurements and calibration
An optical method and a direct sampling method were used for SSC measurements. In order to get reliable and comparable data, both were carefully calibrated using two different systems.
3.1.1 Optical measurements with an ASM (ARGUS surface meter)
The ASM rod records the signal reflectivity (Rs) on a vertical profile at 2 Hz, thanks to 144 optical sensors (OBS type) spaced 1 cm apart. The conversion from Rs to SSC values (defined as CASM) has been done through a calibration function defined in the laboratory prior to the field survey. Because nephelometric measurements depend on the size, on the refraction index, and on the shape of the suspended sediment, the calibration has to be made with sediments from the survey site. Suspensions at different concentrations (Creal) have been prepared with sediment sampled in situ, and introduced in a closed tube circuit. The ASM sensors recorded the reflectivity values in the circuit for 5 min at 1 Hz. The calibration curve (Fig. 3A) has been built by associating the mean of the reflectivity values (Rs) measured by the sensors with the real SSC (Creal). The ASM rod is calibrated for Creal ranging between 0 and 30 g/L. This represents a good compromise between the measurement range and the resolution of the SSC measurements. When concentrations exceed 30 g/L, the sensors give a saturation value. The calibration curve provides an equation CASM = f(Rs) ± ΔCASM with uncertainty ΔCASM. This uncertainty comprises the uncertainty related to ASM rod (reflectivity measurement) and the uncertainty related to the sediment concentration introduced in the calibration apparatus (Creal). The ASM rod manufacturer gives a relative uncertainty:
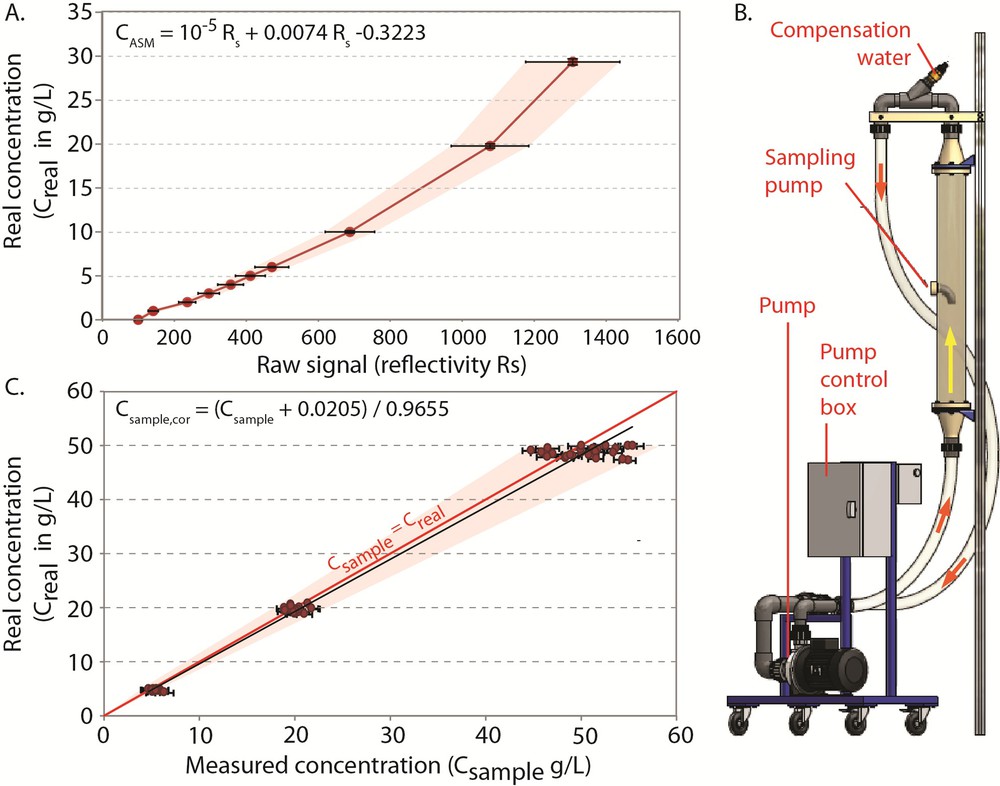
Calibration of SSC measuring instruments. A. Calibration curve of the ASM rod based on reflectivity measurements of several real SSC (Creal from 0 to 30 g/L). B. Recirculating circuit used to calibrate direct samplings by pumps. C. Calibration curves for direct sampling by pumps.
The uncertainty of Creal is related to the uncertainties of the sediment mass (mreal) and of the volume of water (Vcircuit) introduced in the calibration system:
These calculated uncertainties are reported as error bars in Fig. 3A.
3.1.2 Direct sampling by pumping
Because ASM optical measurements are limited by the sensor saturation value (at 30 g/L), and to check the consistency of this indirect method, water from the channel was sampled during the passage of tidal bores using manual pumps. Four sampling points were positioned at different levels in the water column, just above the bed and at 20, 40 and 60 cm above the bed. At the passage of the tidal bore, a maximum sampling frequency of about 0.5 Hz was achieved. Two rising tides with tidal bore were surveyed by using this sampling pump system, and about 800 samples per tide were collected and stored in hermetic plastic pots.
Generally, SSC is determined from water samples by filtration. This method is fast to process, but fine particles may be lost depending on the quality of the mesh filters. We used another protocol to measure the suspended sediment concentration, which preserves the sediment for further investigations (grain size distribution measurements and sediment composition observation under a binocular microscope). This included three steps:
- • a weighing of the pot containing the sediment and the water (P1);
- • a weighing of the pot and the sediment (P2) after drying at 35 °C;
- • a weighing of the mass of the empty pot (P3).
From these weights, the SSC (Csample) is calculated using the following formula:
With ΔCsample, the uncertainty related to the weighing of P1, P2, and P3 is defined as:
The uncertainty on the mass (ΔP1, ΔP2, and ΔP3) is 0.2 g, and is related to the characteristics of the weighing scale. varies from 4% for concentrations of 30 g/L to 40% for concentrations of 1 g/L. The uncertainty is significant for low concentrations because it essentially depends on weighing.
This method of SSC measurement is also calibrated in the laboratory in a second calibration system. The experimental setup is made of a closed recirculating circuit in which a known volume of water and sediment is introduced. A recirculation pump ensures a certain level of turbulence in the circuit, and a homogeneous water/sediment mixture (Fig. 3B). The recirculating turbid water is sampled with a manual pump identical to that used on the field, and SSC (Csample) is determined using the protocol described previously. Three concentrations (Creal at 5, 20 and 50 g/L) were chosen for the calibration of the pump (Fig. 3C). For each concentration, the experiment was repeated five times (with complete cleaning of the system). During each experiment, five samples were taken. This resulted in 25 samples per concentration value.
Measured SSC values (Csample) are plotted against real SSC values (Creal) (Fig. 3C). On average, Csample slightly overestimates Creal. A correction equation (Csample,cor = f(Csample)) may be proposed, but a significant dispersion of values around the average is observed. A variability in the sample concentration values of about 10% is determined graphically, which has to be added to the uncertainty related to the weighing process. The uncertainty from the calibration system is negligible: . This significant uncertainty comes probably from the pump system:
- • the sediment can be lost during the filling of the pots (underestimation of Csample), or;
- • the sediment can settle into the sampling system (pump and pipes), which could distort the next sample (overestimation of Csample).
These uncertainties have not been estimated experimentally.
3.2 Current velocity measurements
Velocity measurements were performed with an Acoustic Doppler Current Profiler (ADCP) and an Acoustic Doppler Velocimeter (ADV), both mounted on a metal structure anchored on the channel bank (Fig. 2). The ADV (Vector Nortek) was placed horizontally and looking upstream 60 cm above the channel bed. It recorded the three components of the velocity (u, v, w) at a frequency of 64 Hz. The ADCP (Workhorse Sentinel) was placed just below the water surface, looking downward (Fig. 2). It recorded vertical velocity profiles down to the sediment bed at a frequency of 2 Hz, with a signal frequency of 1200 kHz. The ADCP was configured according to the desired acquisition frequency, the measurement conditions, and the size of the vertical measurements cells. During the field survey, the water depth was low (∼1 m) and the cell size was set at 5 cm. The manufacturer gives a relative uncertainty on the velocity measurement (Δu/u) of 0.3%.
4 Results
The results presented in this paper focus on the data obtained during the survey of an undular tidal bore that developed during the high spring tide of 8 May 2012 (the tidal range in the outer estuary was 12.85 m). The SSC and velocity evolutions during and after the passage of the tidal bores of 7 May 2012 at “Le Bateau” have been discussed in Furgerot et al. (in press) (same field campaign). Herein, we present a quantification of sediment fluxes during the tidal bore passage in the Sée River from (i) SSC measurements (ASM probe and direct sampling), and (ii) velocity measurements (ADV and ADCP probes). We discuss the reliability and the limits of each method in highly turbid and turbulent water, and emphasize on the importance and difficulties of tool calibration in such environments.
4.1 Suspended sediment concentration
We compare the results of the ASM rod (CASM) and direct sampling corrected (Csample) after laboratory calibrations (Fig. 4).
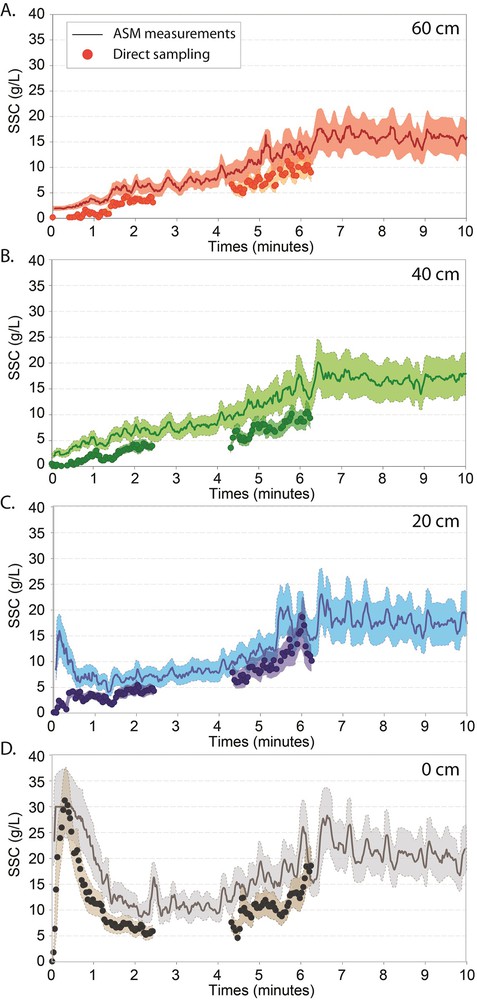
Comparison between ASM (including error envelope) and direct sampling measurements at the same elevations, i.e. at 0 (A), 20 (B), 40 (C) and 60 cm above the bottom (D). Survey of 8 May 2012.
Data are presented at four sampling depths (0, 20, 40 and 60 cm above channel bed). Overall, the SSC evolution measured with the ASM rod follows the SSC evolution measured with the pump sampling method. As described in Furgerot et al. (in press), a high increase in SSC during the tidal bore passage (the first seconds) is measured at the bottom (Fig. 4D). The saturation of the ASM rod suggested SSC greater than 30 g/L, confirmed by direct sampling with SSC values up to 35 g/L. After the passage of the tidal bore front, SSC gradually increases over the whole water column. Although the global SSC evolution is similar with the two methods, the ASM measurements (CASM) show a constant positive offset compared to the pump sampling measurements (Csample). This difference appears constant over time and is not explained by the errors due to the instrumentation previously identified (envelope curve in Fig. 4).
4.2 Flow velocities
A detailed description of the velocity evolution measured using an ADV vector on the two components u and w is provided by Furgerot et al. (in press). Herein we supplement these ADV data with ADCP measurements that provide vertical profiles of longitudinal velocity u (Fig. 5).
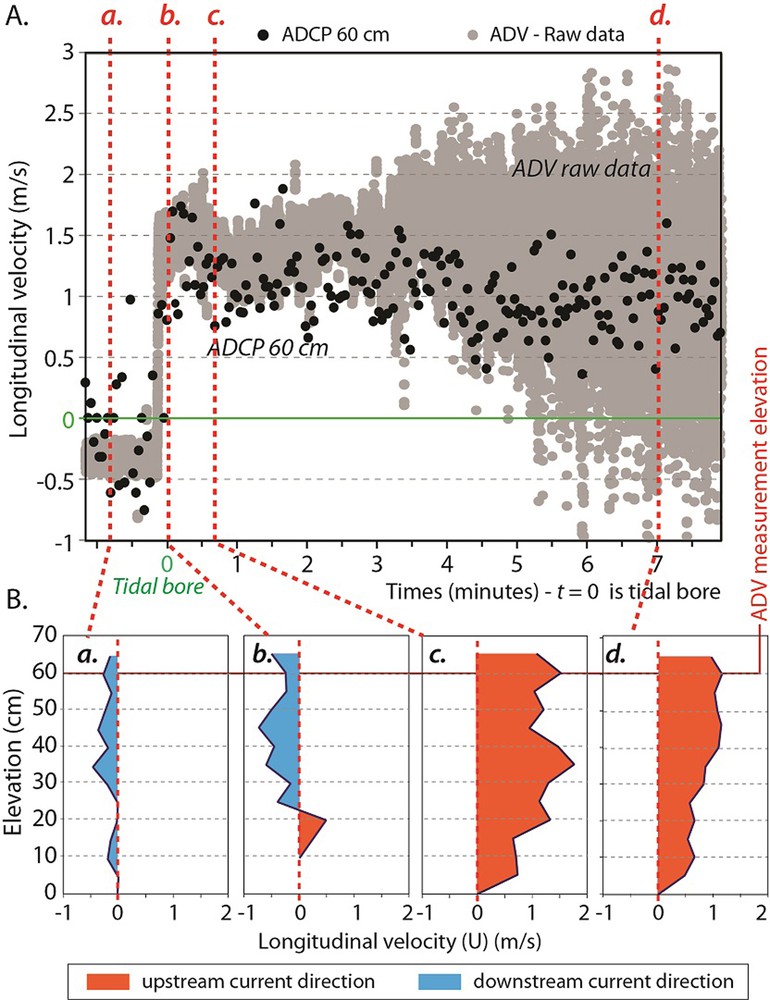
A. Longitudinal velocity (u) comparison between ADV Vector and ADCP Workhorse Sentinel at 60 cm from the initial bed level. B. Vertical velocity profiles (u) extracted from ADCP measurements at four different times (a, b, c and d, located on Fig. 5A).
The average velocity () on the 60 cm of the water column is 0.3 m/s (Fig. 5B, profile a). The river flow is very low compared to the flow after the tidal bore passage with in the upstream direction. The ADCP profile b at the tidal bore passage (Fig. 5B) clearly shows that the longitudinal velocity inversion (from a downstream-directed to an upstream-directed flow) first occurs at the bottom of the water column. This inversion has been recorded over the four successive tidal bores surveyed on 7 and 8 May 2012. The inversion then occurs all across the water column almost immediately after the bore passage. The longitudinal velocity is maximal just after the tidal bore's passage (up to 2 m/s) throughout the water column. Then, the averaged velocity decreases along the vertical profile, with some fluctuations around a mean value of 0.7 m/s (Fig. 5B, profile d).
4.3 Sediment flux calculation
Velocities (u) and SSC (CASM) data are used to estimate the instantaneous advective suspended sediment flux (qs). The formula used for this calculation has already been used by several authors in comparable environmental conditions (Berni, 2010; Chanson et al., 2011; Desguée et al., 2011):
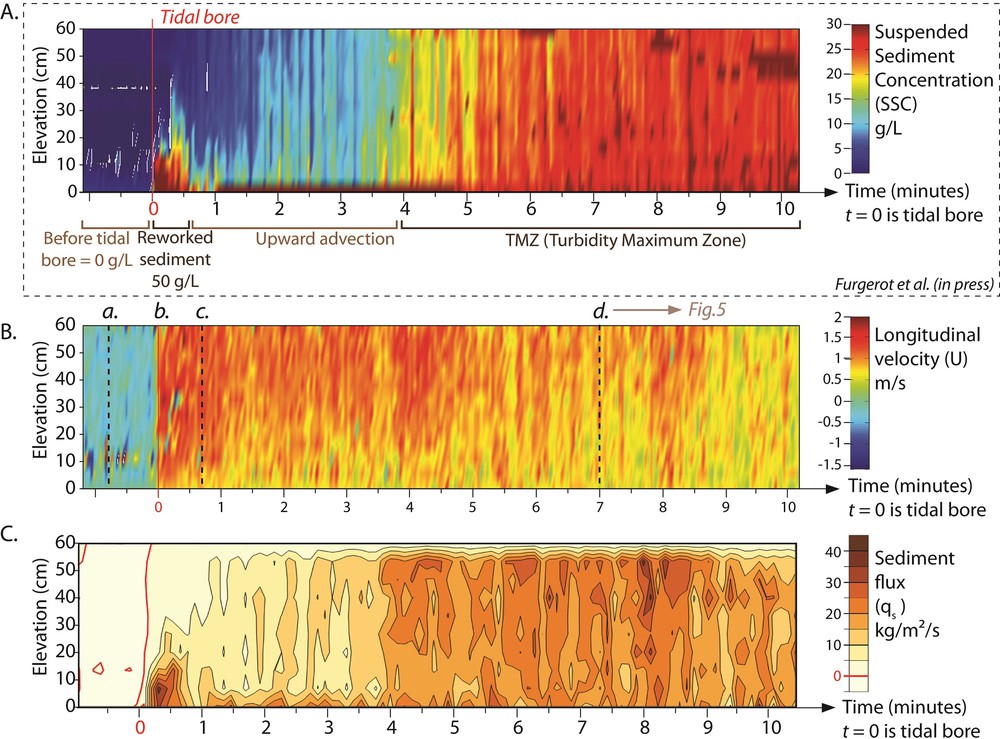
Time space diagrams. A. CASM (ASM data corrected by sampling). B. Longitudinal velocities (ADCP data). C. Sediment flux (qs).
is estimated at 10%. The main source of error is the ASM rod measurement. Despite this uncertainty, we obtain an order of magnitude of the sediment flux. Also note that the ASM rod saturates at 30 g/L. There is therefore an underestimation of the SSC and the sediment flux at the tidal bore's passage.
Before the passage of the tidal bore, the downstream sediment flux is close to 0 kg/m2/s. At the tidal bore's passage, a period of significant sediment flux occurs on the bottom, with values reaching at least 40 ± 4 kg/m2/s (Fig. 6C). During the 3 next minutes after the bore, the sediment flux in the measured water column is lower, with values less than 10 ± 1 kg/m2/s. It then increases progressively in the whole measured water column between 4 and 9 min after the passage of the tidal bore, reaching maximum values of 25 ± 2.5 kg/m2/s. Nine minutes after the bore, despite SSC reaches its maximum, the sediment flux starts to decrease as a consequence of the decrease in the flow velocity.
5 Discussion
While SSC evolution associated with the passage of a tidal bore is precisely described in Furgerot et al. (in press), in the present paper, we propose to discuss three mains points:
- • the reliability of SSC measurements by direct sampling;
- • the comparison between ASM and direct sampling measurements;
- • the influence of tidal bores on sediment fluxes.
Direct samplings for SSC measurements are commonly used and generally allow the validation of indirect measures of SSC (optical or acoustic). To our knowledge, no study reports a calibration of the method to determine the validity of the direct sampling measures. However, our in situ data indicate that calibration is necessary for quantifying accurately SSC. In our case, a difference of 5 g/L is measured between Csample and CASM. In laboratory, a slight overestimation of Csample is noted in average and an equation is proposed for corrected the in situ SSC measurements. Despite this calibration and the application of error bars on the data, some differences between CASM and Csample are recorded in situ. We consider that the main source of error comes from the ASM rod, because the direct samplings are checked and the potential sources of uncertainty have been identified and estimated. The ASM rod manufacturer gives two measurement ranges for two different particle sizes: from 0.005 to 5 g/L for mud (d50 = 20 μm) and from 0.05 to 50 g/L for sand (d50 = 250 μm). The “tangue” on the site is of intermediate size (silt with mode at 80 μm). Because the probe has been calibrated on a large range (0 to 30 g/L), a bias is possible due to the particle size. In addition, access to the raw ASM data is limited. After calibration of the rod, the instrument provides only data in g/L during field measurements. An error due to ASM measurement is therefore difficult to identify. As the offset between CASM and Csample is roughly constant, in situ calibration of the ASM rod can be performed using direct sampling.
Despite these errors, it is interesting to couple these methods, which show similar SSC evolution and present complementary advantages:
- • direct sampling is the only way to determine reliable calibration curves for acoustic and optical probes, with a distinction between backscatter and absorption phases of the signal. Direct sampling is also independent of the sediment heterogeneity, unlike indirect SSC measurements that can be dependent on grain size, shape and composition (Moate and Thorne, 2012; Thorne and Meral, 2008);
- • the ASM rod allows a space-time measurement with an important resolution every centimeter at 2 Hz, and a monitoring of the sediment bed's evolution (erosion and deposition). The processing of this method is rapid unlike direct sampling, which is time-consuming (drying, weighing). In addition, the ASM rod is able to perform measurements in highly concentrated flows, up to 30 g/L in the present case unlike most available instruments, i.e. from 0 to 5 g/L for an OBS-3 (Optical Backscatter Sensor) and from 0 to 20 g/L for an ABS (Acoustic Backscattering System). However, large measurement ranges imply smaller accuracies.
In parallel to SSC measurements, ADCP measurements allowed us to examine the evolution of the flow velocity in the water column at the passage and some minutes after a tidal bore. Our data clearly evidence that the flow inversion occurs first on the bottom before it propagates in the whole water column. Cébile (2010) on the Garonne River, as well as Bazin (1865) on the Seine River already reported that current reverses first on the bottom at the tidal bore passage. We suppose that this inversion causes a very significant shear stress on the sediment bed and subsequent erosion. One hypothesis is proposed in perspective of this publication.
From these measurements of SSC and velocity, sediment fluxes are calculated. Our data demonstrate that, on our study site, upstream-directed sediment fluxes become maximal in the whole water column about 8–9 min after the passage of the tidal bore. This highlights the presence of a turbidity maximum zone (TMZ), which is a common feature in tide-dominated estuaries (e.g., the Seine estuary, Avoine et al., 1981, the Garonne estuary, Castaing, 1981). Its development in the Mont-Saint-Michel estuary is quantified for the first time in our study. All the data acquired during the several surveys on the tidal bore site “Le Bateau” evidence that the salinity front actually arrives more than 10 min after the tidal bore passage in average (Furgerot, 2014). This fact demonstrates that flocculation processes due to the salt water do not explain the TMZ, unlike in most river estuaries where the TMZ develops at the salt water/fresh water interface. We believe that a significant part of the sediments supplying the TMZ should come from the channel bed and bank erosion due to the tidal bore passage. After the passage, the TMZ starts to develop, with values of sediment flux up to 25 kg/m2/s, and this transport persists over a few minutes (about 5 min in our case).
For the first time, a quantification of sediment fluxes during a high spring flood accompanied with a tidal bore is provided for a tidal channel of the Mont-Saint-Michel inner estuary. Very few quantitative data of sediment fluxes have been published until now in this hypertidal setting. Desguée et al. (2011) have calculated sediment fluxes during spring tides in the inner estuary (Couesnon River) at the beginning of the flood very close to the bottom but on the basis of data collected on the tidal flat, not into the channel, and without tidal bore. Maximum values of 1.1 kg/m2/s were calculated, which is 40 times less than the sediment fluxes we have calculated on the channel bottom at the tidal bore passage. Ehrhold (1999) used a numerical model on the basis of data collected at the entrance of the estuary and calculated sediment fluxes greater than 10 kg/m2/s in the inner estuary for spring tide conditions. These values are averaged over the whole inner estuary and a whole tidal cycle. This implies that very high sediment fluxes, much higher than 10 kg/m2/s, necessarily occur in the inner estuary during spring tides when tidal bores develop. This is consistent with our results. Similarly, Chanson et al. (2011) calculated sedimentary fluxes in the Garonne estuary during a tidal bore using ADV measurements at one point at the top of the water column. Downstream sediment flux was 1.5 kg/m2/s before the tidal bore. A few seconds after the passage, upstream sediment fluxes reached up to 100 kg/m2/s and then gradually decreased to 40 kg/m2/s several minutes after the bore. Taking into account the huge differences in initial conditions between our site and the Garonne River estuary (fluvial flow and sediment fluxes, sediment grain size, channel size and morphology), in addition to the different means used to measure SSC (ADV signal inversion vs direct sampling and ASM rod), we consider that the values of sediment fluxes associated with the passage of a tidal bore obtained by Chanson et al. (2011) are in a range comparable with those we have calculated in this study. Although few values of sediment fluxes are finally available in estuaries where tidal bore can form, our comparative analysis tends to demonstrate that the development of a tidal bore results in very high sediment fluxes initiated by the bore front and impact on the bottom, of the order of 10 to 40 times higher than sediment fluxes without tidal bore.
We wish to quickly come back to the velocity inversion, to present our first hypothesis in perspective of this article. We suggest that the inversion occurs first at the bottom due to two main features:
- • at tidal bore passage, hydrostatic pressure from the sudden rise of the free surface in addition to upstream velocities (top of water column) deflects the downstream river flow to the middle of the water column;
- • at the same time, close to the bottom, due to a thinner and steeper boundary layer, tidal flow velocity is higher than the fluvial one.
The combined effect of these two features results in streamlines contraction and acceleration in the middle of the water column of river flow. The velocity inversion is therefore starting at the bed, and is delayed at higher elevations.
6 Conclusion
Measurements of suspended sediment concentration and flow velocity were used to calculate sediment fluxes during the passage of a tidal bore passage in the Sée River estuary (Mont-Saint-Michel Bay). From these measurements, three points are developed in this paper:
- • reliability of SSC measurements by direct sampling;
- • comparison between direct sampling and ASM rod for SSC measurements;
- • evolution of sediment flux with the passage of a tidal bore.
Both ASM and direct sampling methods for SSC measurements were calibrated in the laboratory. Despite the laboratory calibration, a difference of 5 g/L at maximum was observed between both methods in the campaign results. Some hypotheses are proposed to explain this difference. This paper shows the difficulty of measuring reliable SSC even with direct sampling, which is currently considered as a reliable method. New tests should be performed to reduce the high uncertainty of the SSC measurements, including a more advanced ASM calibration with different ranges of particle size, and the automation of direct sampling in the field.
Despite the uncertainties on the SSC measurements, sediment fluxes were calculated and compared with other studies conducted in the Mont-Saint-Michel Bay without tidal bore, and in the Garonne estuary during a tidal bore. It shows the significant role of the tidal bore on sediment transport by an important resuspension of sediments at the passage of a tidal bore (Furgerot et al., in press). This important resuspension seems to contribute to the supply of a turbidity maximum zone (TMZ) highlighted for the first time in the Mont-Saint-Michel Bay.
Finally, we propose that the inversion of velocity on the bottom is due to the difference in thickness of the boundary layer between the river flow and the flood flow below the tidal bore front. Further processing of current velocity data is in course to confirm this hypothesis.
Acknowledgements
This study is part of Lucille Furgerot PhD works (University of Caen), supported by the ANR project “Mascaret” (ANR-2010-BLAN-0911), whose coordinator, Prof. Pierre Lubin, is warmly thanked, and by the Regional Council of Basse-Normandie (CRBN). We are grateful to all the colleagues of the “Mascaret” team and of the M2C research lab, as well as friends, who provided helpful assistance for field surveys. We warmly thank Jean-Yves Cocaign, the Director of “La Maison de la Baie” in the Mont-Saint-Michel Bay, for the logistical assistance he kindly supplied during the surveys. We also thank Teledyne Instruments for the loan of several ADCP including ADCP Workhorse Sentinel. Finally, we thank Pr. Daidu Fan and Dr. Benoît Camenen for their very constructive comments.