

1 Introduction
Clay materials are used as raw materials in papermaking, ceramics, paint, rubber, plastics, pharmaceutical industries (Murray, 2000), agroalimentary industry for decolourizing vegetal oils (Nguetnkam et al., 2008a), and in environmental protection (Nkoumbou et al., 2001). There are numerous clay deposits in all the regions of Cameroon. Many authors have provided data on the deposits in central, southern and eastern regions (e.g., Nkoumbou et al., 2006a, 2006b, 2008a, 2008b); in the Douala sedimentary basin (e.g., Ngon Ngon et al., 2012); in Adamaoua and northern regions; along the Cameroon Volcanic Line (Nguetnkam et al., 2007, 2008b; Njoya et al., 2006, 2007; Nkoumbou et al., 2009; Pialy et al., 2008; Tassongwa et al., 2014). A few attempts of applications concern rubber reinforcement (Njopwouo et al., 1987, 1988), ceramics (e.g., Djangang et al., 2008; Elimbi and Njopwouo, 2002), oil bleaching (e.g., Djoufac et al., 2010), crop and seed protection (Mbouga Nguemtchouin et al., 2015), and geophagy (Njopwouo et al., 1998). Beside these applications, Cameroon clays are also used to manufacture bricks and potteries. Since a century, Balengou clays are consumed (geophagy) either to reduce nausea by pregnant women or for gastric treatment by the whole population. However, the risk of unbalanced intake of minerals may be serious since the mineralogy and chemistry of geophagic clays are uncontrolled, variable, and difficult to standardize. Previous works on the Balengou clays (Njopwouo et al., 1998) were carried out on five samples collected in one gallery on the site. These studies revealed that the Balengou clays are suitable for reinforcing natural rubber. The trace elements display low concentrations of oligo-elements, suitable for human consumption and pharmacology. Up to now, no systematic sampling has been realized on the Balengou clay deposit. In this study, detailed field description of the deposit, sampling along two pits (10 and 20 m depths), analysis of grain size distribution and of Atterberg's limits coupled with mineralogy and geochemistry were carried out on the Balengou clays in order to determine the genesis of their occurrence.
2 Geological setting
The Cameroon volcanic line is a Tertiary–Quaternary plutono-volcanic structure (1600 km long and 100 km width) oriented N030°E. More than sixty plutono-volcanics complexes including the Bana complex are scattered along this line. The Balengou clay deposit is located at the eastern flank of the Bana Complex, at the northern border of the Pan-African Bazou granitic pluton (583 ± 4 Ma, U–Pb on zircon, Tchouankoué et al., 2016); they are partially covered with basalts northwards (Fig. 1).
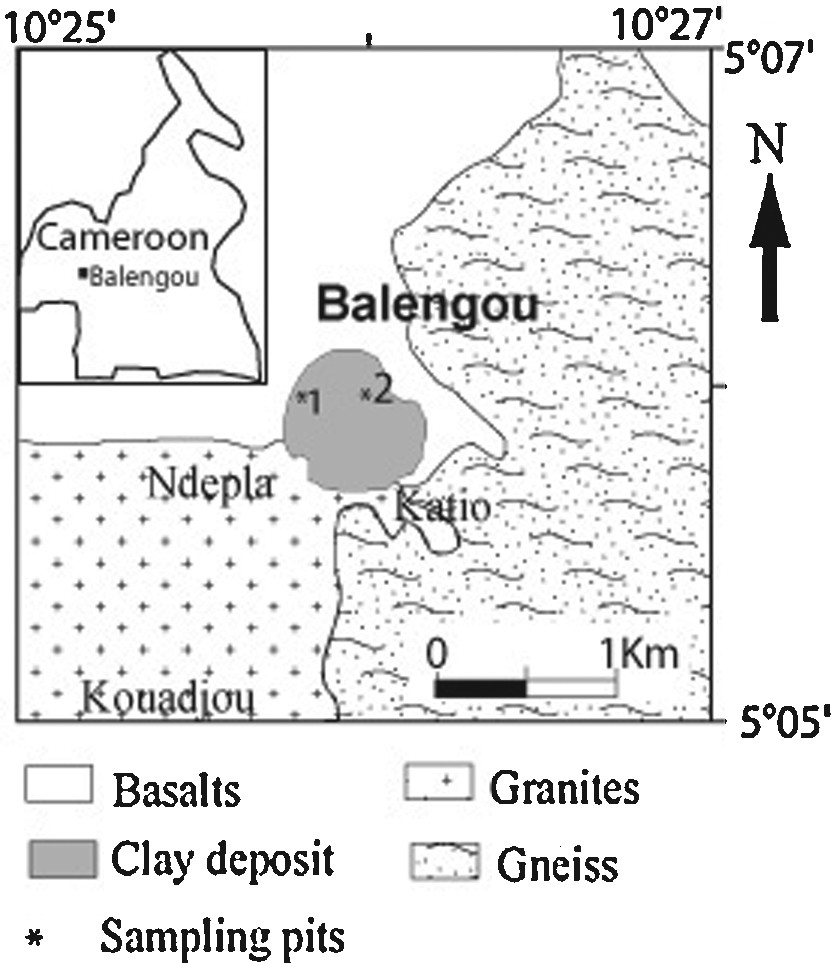
Geological map of the Balengou clay deposit. Inset: location of Balengou in Cameroon.
3 Field methods and experimental techniques
During field study, a pit was dug at the core of the mineralized zone and another 34 m to the west to follow the lateral extension of the edible clay (Table 1). XRD analyses were performed at the Laboratory of Micro-analysis of the ‘Mission de promotion des matériaux locaux’ (MIPROMALO), Yaoundé, Cameroon, on five random powder samples, using a D8 Advance Brucker diffractometer operating by reflexion. The Cu Kα1 radiation (λ = 1.5406 Å) was used at 40 kV and 30 mA as operating conditions. The data were recorded between 5° and 60°, with a step time of 6 s at an ambient temperature of 25 °C. Granulometry analyses were performed on 12 samples at MIPROMALO, Yaoundé, Cameroon. Sodium hexamethaphosphate (5 wt.%) was used as a dispersing agent. Atterberg's limits were determined on ≤ 400 μm fractions using Casagrande's method. Diffuse Reflectance Infrared Fourier Transform (DRIFT) spectroscopy measurements were taken on ten bulk samples crushed and sieved at about 200 μm in the 4000–400 cm−1 range on a Bruker 10037077, α alpha P spectrometer at the Laboratory of Analytical Chemistry of the University of Yaoundé-1. the spectrum of each sample was recorded, smoothed and indexed using an OPUS software. Thermal analyses (DSC and TGA) were carried out on five samples at the Laboratory of Applied Inorganic Chemistry of the University of Yaoundé-1, using a LINSEIS STA PT-1000 electric oven. The investigated temperature ranged from 20 to 1000 °C, with a heating rate of 10 °C per minute. Alumina pre-heated at 1500 °C served as reference. Chemical analyses were performed on 12 samples, five at the Laboratory of Micro-analysis of MIPROMALO by X-ray fluorescence, and seven at ALS Minerals (South Africa) for both major and trace elements. The analyses were done by Emission Spectrometry using Inductively Coupled Plasma and Atomic Emission Source (ICP–AES) for major elements and Mass Spectrometry (ICP–MS) for trace elements and rare earths, after fusion with LiBO2 and dissolution in HNO3.
Samples location and different analyses.
| Colour | Sample | (1) | (2) | (3) | (4) | (5) | Atterberg's limits | ||
| Wl | Wp | Ip | |||||||
| Pit N1 | |||||||||
| Dark Brown | N13 | X | 58.8 | 50.9 | 7.9 | ||||
| Pink | N14 | X | X | X | X | ||||
| N15 | X | 61 | 52.7 | 8.3 | |||||
| N16 | X | X | 62 | 53.4 | 8.6 | ||||
| N18 | X | 61.9 | 58.2 | 3.6 | |||||
| Pink, speckled with white | N110 | X | X | ||||||
| Dark pink to reddish | N112 | X | X | X | X | X | 59.1 | 50.2 | 8.9 |
| N114 | X | X | |||||||
| Pinkish grey | N116 | X | |||||||
| N117 | X | 60.7 | 55.2 | 5.5 | |||||
| Reddish | N118 | X | X | X | X | ||||
| N120 | X | X | X | 54.1 | 49.8 | 4.3 | |||
| Pit N2 | |||||||||
| Speckled pink, brown and grey | N23 | X | X | X | X | ||||
| Pinkish grey | N26 | X | 59.6 | 50.9 | 8.7 | ||||
| N27 | X | X | X | 51.7 | 47.2 | 4.4 | |||
| Whitish grey | N28 | X | 53.1 | 47.2 | 6 | ||||
| N29 | X | X | X | X | X | 51.5 | 45.7 | 5.8 | |
| N210 | X | X | X | 49 | 44.2 | 4.8 |
4 Results
4.1 Field description
The Balengou deposit is situated in the highlands of West Cameroon, where the humid tropical climate yields thick red soils. Successive magmatic events occurred there since the Tertiary. The Balengou clay deposit (Fig. 1) outcrops in a couple of hills. The eastern hill is abandoned since a few years after a landslide that buried three persons. Its survey through drills with manual auger revealed reworked sandy clays, and blocks of felsic volcanic rocks. The western hill is limited westwards by a cliff likely related to a fault striking N30° E. The eastern mined slope is covered with barren sandy clays and by rhyolite blocks (Fig. 2a and b), whereas the northern slope is partially covered with a basalt flow. On this hill, craftsmen dug galleries following veins of pink and light grey blocky sand-poor clays, which crosscut sand-rich clays (Fig. 2c and d). At the bottom of the hill, a thin horizon of red lateritic soil covers the silty light brown clay (Fig. 2e). Rhyolite blocks are scattered on this red lateritic cover (Fig. 2f). This study is focussed on the western hill. In order to obtain a complete and undisturbed profile, the pit N1 was located on the western flank of the hill (N05°05′49′′; E10°25′55.7′′, altitude 1284 m). It presents four major types of clay described in Fig. 3. Unfortunately, right to a 20-m depth, the light grey clay mined by craftsmen was still not found. There was only red to dark brown sandy clay.
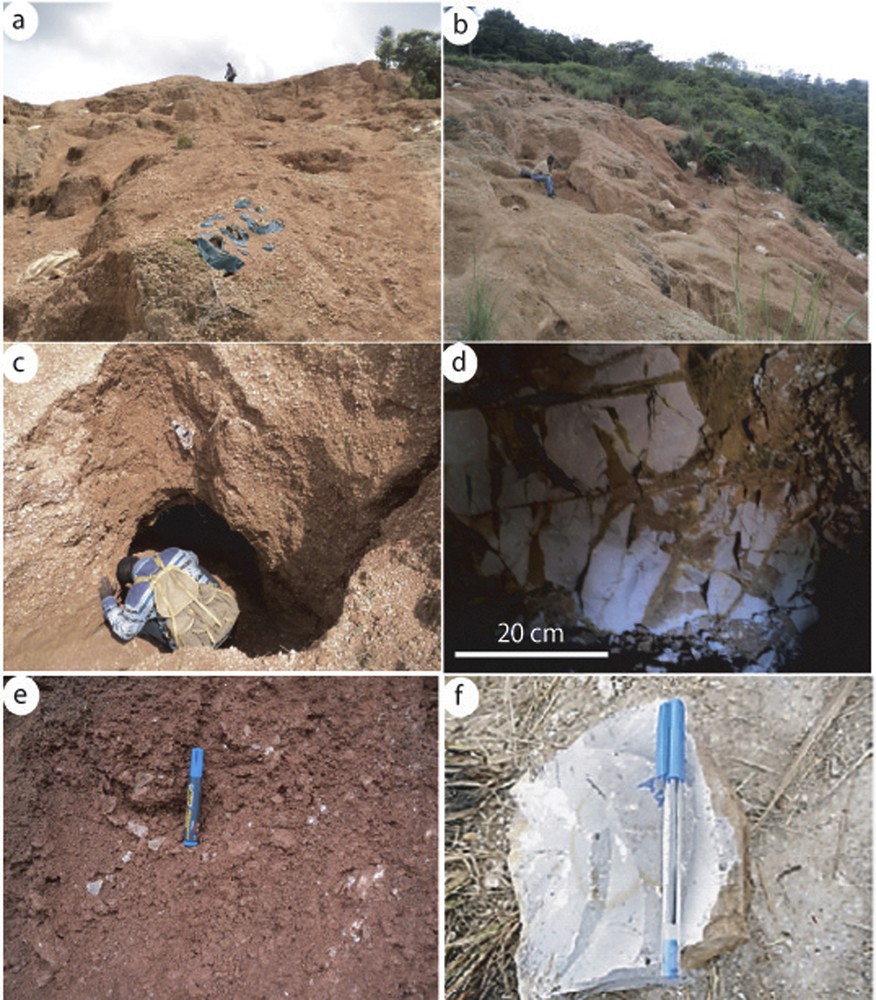
a: top of the western hill; b: a view of its eastern slope; c: a gallery entry; d: a dike of sand-poor clay in the gallery; e: red lateritic soil cover of the deposit; f: a sample of rhyolite from a boulder at the eastern bottom of the western hill. The pen is 14 cm in length.
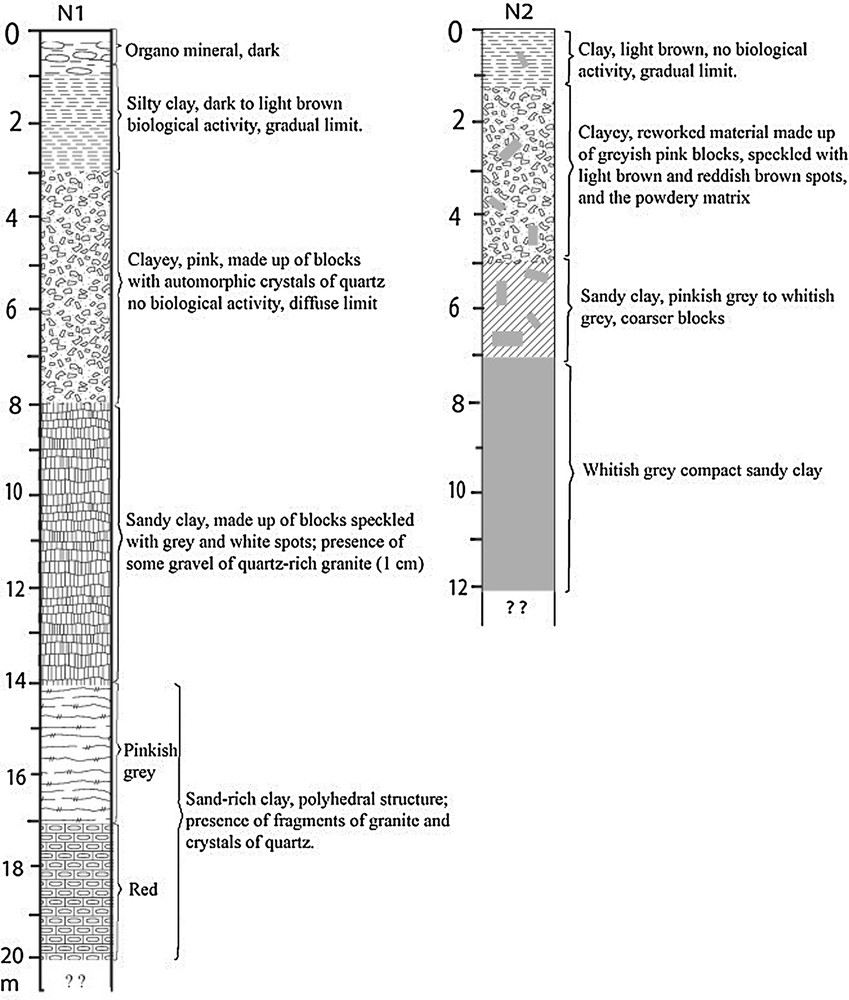
LOGs of pits N1 and N2.
In order to collect fresh samples of mined sand-poor clays and, if possible, its contact with the felsic parent rock, the second pit N2 (N05°05′50.3′′; Longitude E10°25′56.2′′, 1289 ± 5 m altitude) was dug at the heart of the mining zone, where blocks of whitish grey clays are extracted and sold for geophagism. Three types of clays were identified and described in Fig. 3. At this pit too, the parent rock was not reached.
4.2 Physical characterization and mineralogy of the Balengou clays
4.2.1 Particle-size distribution and Atterberg's limits
Two groups of particles are distinct in pit N1 on cumulative curves (not shown). Small particles (< 66 μm) are more abundant at shallow depths (< 9 m) than at deep ones (90% vs. 60%). Samples from pit N2 are characterized by huge amounts (90–98%) of small particles (< 66 μm). In Fig. 4a, samples from shallow depth (pit N1) and those of pit N2 are similar, and they overlap with a mode around 10 μm, whereas samples from deep depth display two modes, around 10 and 1000 μm. In Fig. 4b, shallow samples from pit N1 and all the samples from pit N2 fall in the fields of fine clayey silts and silts, whereas the deep samples of pit N1 correspond to coarse silts.

a and b: grain-size distribution diagrams of pits N1 and N2; c: position of Balengou clays in the ternary diagram of clay vs limon vs sand.
The values of the plasticity index (PI) allowed the classification of the materials as non-plastic (0 < PI < 5), moderately plastic (5 < PI < 15), fully plastic (15 < PI < 40), very plastic (PI > 40). Only four samples were non-plastic materials (Table 1), while others were moderately plastic (PI from 5.5 to 8.9).
4.2.2 X-ray diffraction
The X-ray patterns of representative bulk samples (Fig. 5) show that the main minerals are halloysite, quartz, cristobalite, and tridymite in some samples, anatase, hematite, associated with gibbsite in samples from shallow depth and illite in samples from the great depth (10–20 m). Some low peaks occurring at 14.98 Å (N14), 15.018 Å (N112), 15.61 Å (samples from pit N1), and at 15.88 Å (N23) and 15.52 Å (N29) (samples from pit N2) are assigned to smectite. The variations would be related to (i) the fluctuations in the number of the water molecules adsorbed on the interlayer cations, (ii) the different substitution rates of interlayer cations, and (iii) likely the nature of the cations at the tetrahedral and octahedral sites. Theoretically, d001 spacing of smectite may vary continuously between 10 Å and about 21 Å (Deer et al., 1992, p. 370).
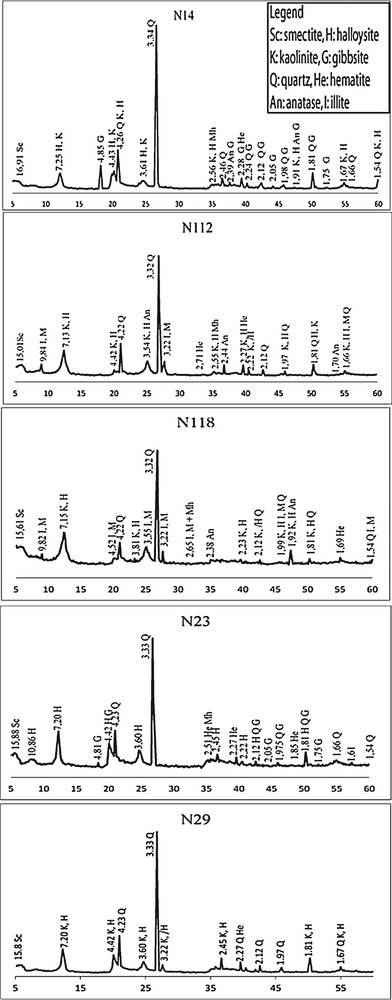
XRD patterns of Balengou clay samples.
4.2.3 Thermal analysis
Curves of thermal analyses show typical peaks of well-crystallised halloysite. The weak endothermic peak around 45–61 °C (Fig. 6a and b) corresponds to hydroscopic water adsorbed on halloysite. It differs from that of kaolinite, which is at 85–91 °C (Njoya et al., 2006; Pialy et al., 2008). Samples N14 and N23 display an endothermic peak at 276 °C and 271 °C respectively, showing the dehydration of gibbsite (Mackenzie, 1957; Njopwouo et al., 1998). The most important endothermic effect is observed between 490–502 °C, testifying to the volatilization of OH in halloysite. This peak is symmetric in all samples, suggesting that the studied halloysite was well crystallised. For hydrated halloysite (poorly crystallised) the corresponding peak is at 515 °C, accompanied with an exothermic peak at 865 °C, while those of kaolinite are at 560 °C and 920 °C respectively (Quantin et al., 1988). According to Soro (2003), the low exothermic peak at 865 °C might be triggered by Fe diffusion in halloysite network. At higher temperature such as 945 °C in sample N118, there is an exothermic effect interpreted in terms of a spinel phase formation (Njopwouo et al., 1998; Pialy et al., 2008).
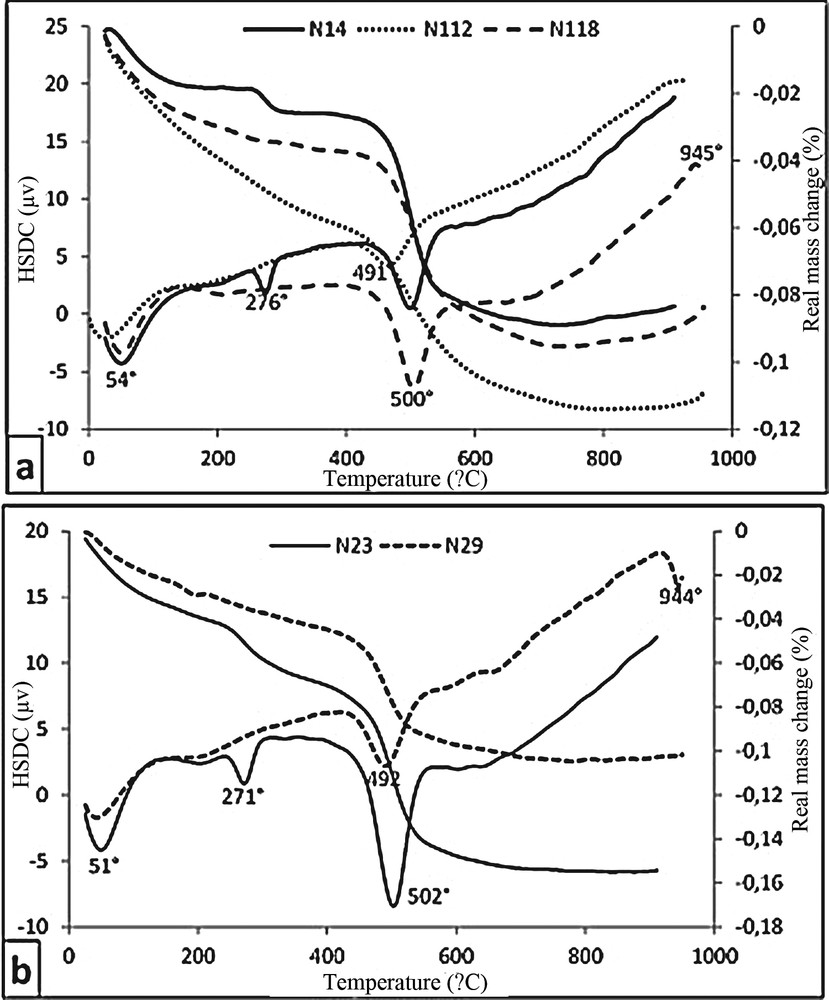
Thermal analyses: a: curves of pits N1 and N2.
On the thermo-gravimetric (TG) curves, there is a 1–3% mass loss below 100 °C, which corresponds to the departure of adsorbed H2O (Fig. 6a and b). Then there is a plateau up to 271–276 °C, followed by a 0.7–1.9% mass loss on the curves (samples N118, N23 and N29) assigned to the dehydration of gibbsite. The most important mass loss (5–8%) is observed between 500 and 550 °C in response to halloysite dehydration. It is noteworthy that samples from 4 and 18 m depths in pit N1 display lower mass loss than that from 12 m deep. The shallow sample of pit N2 shows a huge mass loss compared with the deep samples.
4.2.4 Mineral crystal-chemistry characterization by infrared spectroscopy
All samples present remarkable vibration bands around 3691, 3620 cm−1 and 907–910 cm−1 (Fig. 7a), belonging to well-crystallised halloysite (Quantin et al., 1988). The 3652 cm−1 band in N110 and N118 characterizes kaolinite. Weak bands at 3525 and 3441 cm−1 (N14 and N23) indicate the presence of gibbsite. This is comforted by three bands at 749, 668 and 525 cm−1. The H–O–H deformation band at 1630–1635 cm−1 is common (Qtaitat and Al-Trawneh, 2005). The 400 cm−1–1150 cm−1 intervals of Si–O symmetrical elongation vibrations are similar in all samples. Other bands of halloysite and kaolinite are at 749, 688 cm−1. There is a general shift towards low numbers at 525, 457 and 424 cm−1, characteristic of illite and quartz instead of 540, 470 and 433 cm−1, respectively, for halloysite and kaolinite. The bands at 798, 794, 1119 and 1172 cm−1 correspond to quartz (Fig. 7b).

IRFT diagrams of samples of pits N1 (a) and N2 (b).
4.3 Geochemistry of the Balengou clays
Table 2 shows the chemical compositions of Balengou clays. All samples are made up of SiO2 (52.2–66.3 wt. %), Al2O3 (16.0–27.3 wt. %), Fe2O3 (9.5–2.0 wt. %), and minor TiO2 (1.0–0.2 wt. %) and K2O (3.0–0.0 wt. %). The SiO2/Al2O3 molar ratio values (3.31–6.67) are higher than those of kaolinite and illite (1.18), and point to free silica, be it quartz crystals or amorphous silica. Fe2O3 and TiO2 contents increase with depth (< 3 wt.% Fe2O3 at <10 m depth, 4.9–9.5 wt.% Fe2O3 at great depth >10 m), and are positively correlated, suggesting that they are controlled by Fe–Ti oxides such as ilmenite (Table 3). K2O contents increase with depth from the surface down to 16 m, and the cycle starts again. Conversely, the loss on ignition (L.O.I.) decreases with depth down to 16 m, and the cycle starts again. The values of the chemical index of alteration (CIA = 100*Al2O3/(Al2O3 + CaO + Na2O + K2O)) are high (85–100%). Many trace elements (Ba, Ce, Cr, Cu, Ga, La, Nb, Zn, Zr, Nd, Table 2) show high and varied contents. Ni, V and Pb values are positively correlated with Fe2O3 and TiO2, whereas the Nb contents decrease with a concomitant increase in the Fe2O3 and TiO2 contents (figure not shown). When the sample N120 is discarded, Rb contents are positively correlated with Ba (R2 = 0.88) and Sr (R2 = 0.94) contents. Other positive correlations are observed between Nb and Ta (R2 = 0.98) and between Ta and Zr (R2 = 0.87). Except the 10-m depth sample, which displays an exceptional high REE content (e.g., LaN = 3312), there is a decrease in the REE contents downwards in pit N1. Their patterns (Fig. 8a and b) are marked by an important fractionation of LREE/HREE (LaN/YbN = 19.1–9.4), and by deep Ce (Ce/Ce* = 0.13–0.73) and Eu (Eu/Eu* = 0.17–0.70) anomalies, LREE being more fractionated (LaN/SmN = 4.1–3.5) than HREE (GdN/YbN = 3.0–1.5). However, the pattern of the 10-m-depth sample shows a constant dip (LaN/SmN = GdN/YbN = 5.3). Samples from pit N2 too are rich in REE and their patterns are similar to those of Pit N1 (Fig. 8 and Table 3). The sample taken at 10 m in depth is rich in REE and we speculate, anticipating the discussion section that it was likely induced by convection of hydrothermal fluids.
Chemical compositions of the Balengou clays.
| Pit N1 | Pit N2 | |||||||||||
| N14 | N16 | N110 | N112 | N114 | N116 | N118 | N120 | N23 | N27 | N29 | N210 | |
| Major elements (Oxides in %) | ||||||||||||
| SiO2 | 62.73 | 56.30 | 52.20 | 65.63 | 61.40 | 63.80 | 60.62 | 57.50 | 63.04 | 53.30 | 66.30 | 54.50 |
| Al2O3 | 20.40 | 25.30 | 20.90 | 16.70 | 16.20 | 17.65 | 16.03 | 19.55 | 17.09 | 27.30 | 18.25 | 25.80 |
| Fe2O3 | 2.19 | 2.74 | 9.46 | 5.61 | 8.50 | 4.88 | 9.38 | 8.76 | 4.56 | 2.61 | 1.99 | 2.29 |
| MnO | 0.00 | 0.02 | 0.17 | 0.06 | 0.16 | 0.08 | 0.18 | 0.10 | 0.04 | 0.02 | 0.02 | 0.02 |
| MgO | 0.06 | 0.11 | 0.59 | 0.44 | 0.73 | 0.51 | 0.43 | 0.81 | 0.00 | 0.02 | 0.00 | 0.02 |
| CaO | 0.00 | 0.02 | 0.01 | 0.02 | 0.01 | 0.01 | 0.01 | 0.02 | 0.00 | < 0.01 | 0.00 | 0.03 |
| Na2O | < d.l. | 0.17 | 0.09 | < d.l. | 0.10 | 0.15 | < d.l. | 0.08 | < d.l. | 0.04 | < d.l. | 0.48 |
| K2O | 0.03 | 0.21 | 1.90 | 1.57 | 1.97 | 3.04 | 0.84 | 1.51 | 0.02 | 0.03 | 0.05 | 0.42 |
| TiO2 | 0.22 | 0.28 | 0.97 | 0.41 | 0.76 | 0.57 | 0.79 | 0.59 | 0.26 | 0.30 | 0.23 | 0.30 |
| P2O5 | 0.00 | 0.01 | 0.11 | 0.00 | 0.08 | 0.04 | 0.05 | 0.05 | 0.00 | 0.03 | 0.00 | 0.02 |
| L.O.I. | 14.18 | 14.50 | 11.85 | 9.45 | 10.15 | 8.39 | 11.39 | 11.20 | 14.76 | 15.90 | 12.85 | 14.95 |
| Total | 99.80 | 99.67 | 98.35 | 99.88 | 100.20 | 99.33 | 99.71 | 100.22 | 99.76 | 99.55 | 99.68 | 98.84 |
| Mol.SiO 2 /Al 2 O 3 | 5.22 | 3.78 | 4.24 | 6.67 | 6.43 | 6.13 | 6.43 | 4.99 | 6.26 | 3.31 | 6.16 | 3.58 |
| Σ | 2.49 | 3.53 | 13.02 | 8.04 | 12.07 | 9.16 | 11.44 | 11.77 | 4.83 | 3.00 | 2.27 | 3.54 |
| CIA | 99.87 | 98.44 | 91.27 | 91.32 | 88.62 | 84.65 | 94.98 | 92.39 | 99.91 | 99.74 | 99.73 | 96.52 |
| Trace elements (ppm) | ||||||||||||
| Ag | < 0.5 | < 0.5 | < 0.5 | < 0.5 | < 0.5 | < 0.5 | < 0.5 | |||||
| As | < 5 | < 5 | < 5 | < 5 | < 5 | < 5 | 5 | |||||
| Ba | 101.5 | 741 | 763 | 1325 | 273 | 42.9 | 94 | |||||
| Cd | < 0.5 | < 0.5 | < 0.5 | < 0.5 | < 0.5 | < 0.5 | < 0.5 | |||||
| Ce | 156 | 185.5 | 148.5 | 49.4 | 47.8 | 257 | 323 | |||||
| Co | 9 | 20 | 29 | 14 | 20 | 2 | 4 | |||||
| Cr | 40 | 60 | 102.6 | 410 | 270 | 212.1 | 110 | < 10 | < 10 | |||
| Cs | 0.9 | 2.2 | 1.7 | 2.3 | 2.7 | 0.1 | 0.08 | |||||
| Cu | 4 | 54 | 87.9 | 145 | 36 | 127.8 | 58 | 4 | 2 | |||
| Dy | 24.4 | 46.7 | 12. 5 | 4.9 | 3.7 | 21.5 | 29.2 | |||||
| Er | 12.4 | 18.2 | 5.6 | 2.5 | 2.1 | 11.8 | 13.95 | |||||
| Eu | 2.3 | 7.6 | 2.9 | 1.4 | 1.2 | 1.6 | 3.19 | |||||
| Ga | 44.6 | 52.4 | 31.1 | 22.7 | 22.6 | 26.1 | 44.6 | 49.2 | 37.2 | 50.9 | ||
| Gd | 31.8 | 76.6 | 17.3 | 6.8 | 4.6 | 26.4 | 43.3 | |||||
| Hf | 32.2 | 12.4 | 5.4 | 4.6 | 4.3 | 30.2 | 30.3 | |||||
| Ho | 4.6 | 8.1 | 2.3 | 1.0 | 0.8 | 4.2 | 5.45 | |||||
| La | 331 | 785 | 121.5 | 46.5 | 383.7 | 32.4 | 278 | 341.1 | 502 | |||
| Li | 10 | 20 | 20 | 10 | 30 | 10 | 10 | |||||
| Lu | 1.7 | 1.8 | 0.7 | 0.3 | 0.32 | 1.6 | 1.86 | |||||
| Mo | 4 | 2 | 2 | < 1 | 1 | 4 | 4 | |||||
| Nb | 146.8 | 168.5 | 28.2 | 22.1 | 22.8 | 21.0 | 17.3 | 139.8 | 140.5 | 125.8 | 144.5 | |
| Nd | 305 | 539 | 100.5 | 40.2 | 29.4 | 244 | 342.9 | 424 | ||||
| Ni | 12 | 44 | 62.9 | 60 | 50 | 62.9 | 55 | 7 | 9 | |||
| Pb | 15 | 45 | 184 | 48 | 213.5 | 40 | 7 | 11 | ||||
| Pr | 81.4 | 155.5 | 27.3 | 10.5 | 7.7 | 67.5 | 116.5 | |||||
| Rb | 7.1 | 126.5 | 82.3 | 91.2 | 130 | 45.7 | 112 | 2 | 6.5 | |||
| Sc | 4 | 11 | 18 | 13 | 20 | 4 | 4 | |||||
| Sm | 50.2 | 94.4 | 19.55 | 7.77 | 5.8 | 41.3 | 67.3 | |||||
| Sn | 11 | 3 | 4 | 4 | 4 | 10 | 10 | |||||
| Sr | 4.6 | 98 | 50.7 | 85.8 | 133 | 42.3 | 19.8 | 2.1 | 3.3 | |||
| Ta | 9.9 | 1.5 | 1.4 | 2.1 | 1.4 | 8.7 | 8.8 | |||||
| Tb | 4.4 | 9.7 | 2.39 | 1.0 | 0.6 | 3.9 | 5.53 | |||||
| Th | 36.1 | 23 | 8.6 | 10.4 | 6.1 | 32.1 | 32.9 | |||||
| Tl | < 10 | < 10 | < 10 | < 10 | < 10 | < 10 | < 10 | |||||
| Tm | 1.8 | 2.16 | 0.72 | 0.4 | 0.34 | 1.6 | 1.82 | |||||
| U | 5.1 | 3.6 | 3.8 | 3.8 | 2.8 | 6.1 | 6.18 | |||||
| V | < 5 | 135 | 186 | 79 | 112.0 | 137 | < 5 | < 5 | ||||
| W | 2 | 3 | 2 | 1 | 2 | 1 | 1 | |||||
| Y | 78.7 | 112.5 | 247 | 64.8 | 27.2 | 133.9 | 20.5 | 70.9 | 97.2 | 118.1 | 129 | |
| Yb | 11.8 | 11.5 | 4.69 | 2.3 | 2.4 | 10.7 | 12.0 | |||||
| Zn | 88.4 | 115 | 105 | 56.2 | 72 | 52 | 96.4 | 70 | 112.5 | 103 | 112.5 | 121 |
| Zr | 1110.5 | 1230 | 512 | 88.8 | 162 | 145 | 236.9 | 134 | 1206.7 | 1270 | 1258.5 | 1220 |
| ΣREE | 1019 | 1942 | 466 | 175 | 139 | 971 | 1549 |
Modal compositions of the Balengou clays.
| Sample | N14 | N16 | N110 | N112 | N114 | N116 | N118 | N120 | N23 | N27 | N29 | N210 |
| Halloysite | 51.82 | 61.30 | 21.28 | 21.67 | 10.47 | 2.30 | 25.70 | 24.00 | 47.52 | 73.11 | 48.57 | 60.03 |
| Smectite | 5.76 | 20.28 | 11.43 | 19.96 | 15.25 | 14.17 | 21.04 | – | 1.04 | – | 1.04 | |
| Illite | 0.4 | 2.73 | 24.68 | 20.39 | 25.58 | 39.48 | 10.91 | 19.61 | 0.26 | 0.39 | 1.71 | 5.45 |
| Quartz | 41.25 | 23.97 | 18.79 | 39.14 | 31.98 | 33.24 | 36.15 | 24.05 | 42.73 | 21.16 | 44.73 | 21.33 |
| Gibbsite | 1.65 | 0.80 | ||||||||||
| Anatase | 0.22 | 0.28 | 0.97 | 0.41 | 0.76 | 0.57 | 079 | 0.59 | 0.26 | 0.30 | 0.23 | 0.03 |
| Hematite | 2.19 | 2.74 | 9.46 | 5.61 | 8.50 | 4.88 | 9.38 | 8.76 | 4.56 | 2.61 | 1.99 | 2.29 |
| Feldspar | 3.81 | |||||||||||
| chromite | 0.01 | 0.05 | 0.03 | 0.03 | 0.01 | |||||||
| Zircon | 0.20 | 0.22 | 0.10 | 0.01 | 0.07 | 0.03 | 0.04 | 0.02 | 0.22 | 0.23 | 0.23 | 0.22 |
| Apatite | 0.02 | 0.26 | 0.19 | 0.10 | 0.12 | 0.12 | 0.07 | 0.05 | ||||
| Unknown | 0.44 | 2.65 | 2.53 | 1.21 | 2.69 | 2.45 | 2.4 | 2.52 | 1.83 | 0.64 | 2.22 | 4.34 |
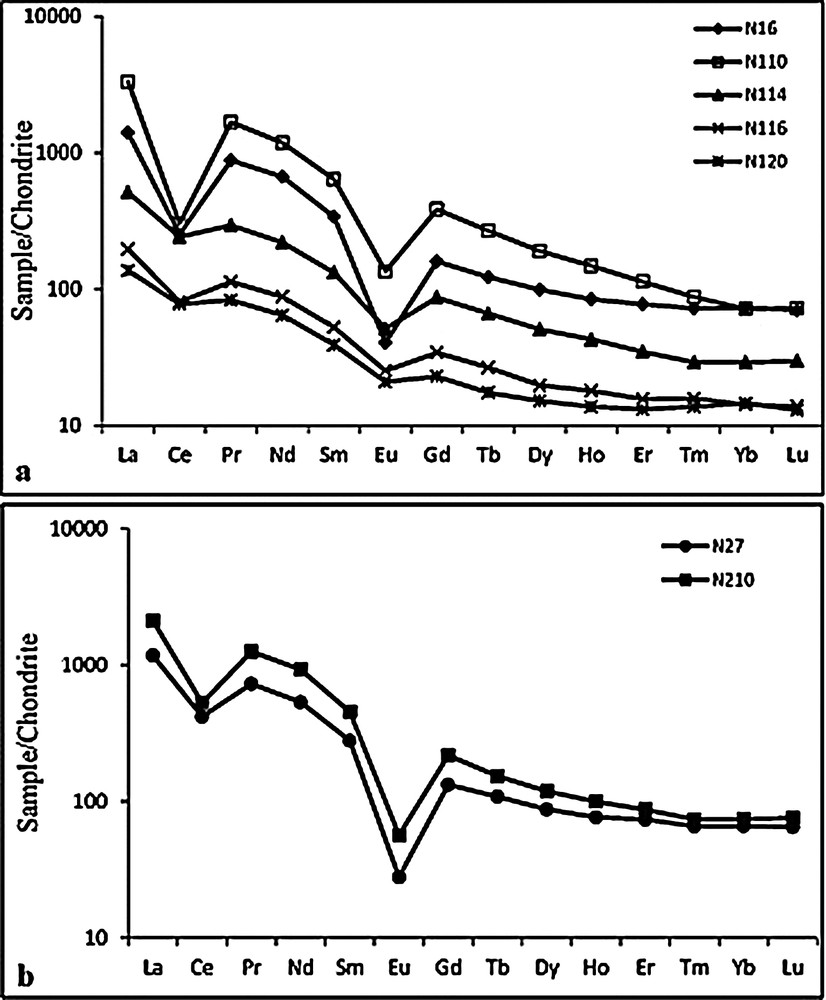
REE patterns of samples from pits N1 (a) and N2 (b). Normlizing values are from McDonough and Sun (1995).
4.4 Modal composition of the Balengou clays
By combining the chemical analyses with the data of qualitative mineralogical compositions established through XRD, DTA and TG studies, modal compositions were determined from chemical analyses according to constrained multi-linear calculations (Yvon et al., 1990) using the following basic formula:
Mi = wt.% mineral “i” in the sample, and
Pi(a) = proportion of element a in the mineral i.
Since chemical analyses of minerals were not available, theoretical compositions of halloysite, montmorillonite, illite, anatase, hematite, and gibbsite were used.
The mineralogical reconstitution scheme is as follows:
- • the TiO2 content, when available, is used for anatase or rutile TiO2;
- • Cr is used for chromite FeCr2O4;
- • Zr is allocated to zircon (ZrSiO4);
- • P2O5 is allocated to apatite (Ca5(PO4)3(OH)) taking into account possible substitutions of Ca by Mn, Ba, Sr, and REE (Deer et al., 1992);
- • gibbsite is calculated using corresponding mass loss measured by GTA;
- • illite (K1.5-1.0Al4[Si6.5-7.0Al1.5-1.0O20](OH)4) is calculated using K2O;
- • MgO is allocated to montmorillonite;
- • the remaining of Al2O3 after the reconstitution of illite and montmorillonite is allocated to halloysite, with a hydration coefficient of 0.72 calculated following the method of Njopwouo et al. (1998);
where ΔP1 = H2O− and ΔP3 = H2O+ − H2O*, H2O* corresponds to the mass loss between 200 and 350 °C of sample N14 (Fig. 5a). H2O+ and H2O− are from Deer et al. (1992, analysis No. 3, p. 354);(1) - • Fe2O3 after the reconstitution of chromite is used for ilmenite;
- • the remaining SiO2 is allocated to quartz.
The results are listed in Table 3. The difference between the chemical composition and the sum of the reconstituted minerals is in the range of 0.5 to 4.3 and is usually attributed to the simplification of the reconstitution scheme (Njoya et al., 2006) and even to the presence of colloidal matrix (Pialy et al., 2008). In this study, the use of an arbitrary constant halloysite hydration coefficient for all samples constitutes an additional factor enhancing the difference. Therefore, we suggest that mineral amounts > 10% are affected by an error of ± 5% and results < 10%, by an error of ± 10%. As a whole, the modal compositions show that clay materials from Balengou are very heterogeneous: halloysite amounts range from 10 to 61% in pits N1 and from 48 to 73% in pit N2; illite amounts range from 0.2 to 39%, montmorillonite from 5 to 21% in pit N1. Montmorillonite occurs in trace amounts in pit N2. Samples of this pit, except N23, display modal compositions very close to those analysed by Njopwouo et al. (1998).
5 Discussion
In this study, based on geological, mineralogical, and chemical data, the discussion focuses on (i) the nature of the protolith, (ii) the origin of the clay deposit, and (iii) the potential related ores.
5.1 Nature of the protolith
Previous works (Njopwouo et al., 1998) and our field observations allow us to claim that the Balengou clay deposit developed at the expense of volcanic acid rocks. These rocks underwent substantial alteration that resulted in chemical modification favoured by the mobility of some major (Si, Mg, Ca, Fe, Al, Ca, Na, K) and trace (e.g., Rb, Sr, Ba, Ni, Co, Sc, V, Cu) elements. As the pits did not reach the bedrock, the determination of the nature of the volcanic felsic rocks and their granitic basement is based on immobile high-field strength elements (e.g., Ti, Zr, Y, Th, Ta, Nb, Hf). Many couples of elements show good positive correlations (Nb–Ta, Ta–Zr, Zr–TiO2) usually considered as a proof of immobility during alteration, although some of these correlations concerning clays, derived from the alteration of Pan-African granites and of Tertiary volcanic felsic rocks, are a simple coincidence. In such cases, the robust argument is that of Workman and Hart (2005), who established that canonical ratios of immobile elements (e.g., Zr/Th, Ta/Th, Nb/Y) remain constant during magmatic and subsequent metamorphism and/or alteration processes. These findings comforted the choice of the diagram Nb/Y versus Zr/TiO2 of Winchester and Floyd (1977) for the determination of the protolith (Fig. 9). Samples from shallow depth of pit N1 and all samples of pit N2 plot in the field of commendite/pantelerite (alkaline granite), whereas deep samples (> 6 m) of pit N1 plot in the fields of rhyolite (granite) and dacite (quartz diorite). Strictly speaking, the deposit is made up of many late volcanic dikes intrusive in a granitic dome. Their alteration (hypogene and/or supergene?) yielded silica-free and silica-rich clays with various modal compositions (Table 3). Therefore, similarly to Mayouom (Njoya et al., 2006; Nkoumbou et al., 2009) and Lembo (Pialy et al., 2008) kaolin deposits, sand-poor, cristobalite and tridymite-bearing clays are assigned to a volcanic origin, whereas sand-rich clays are the products of the alteration of the granitic basement.
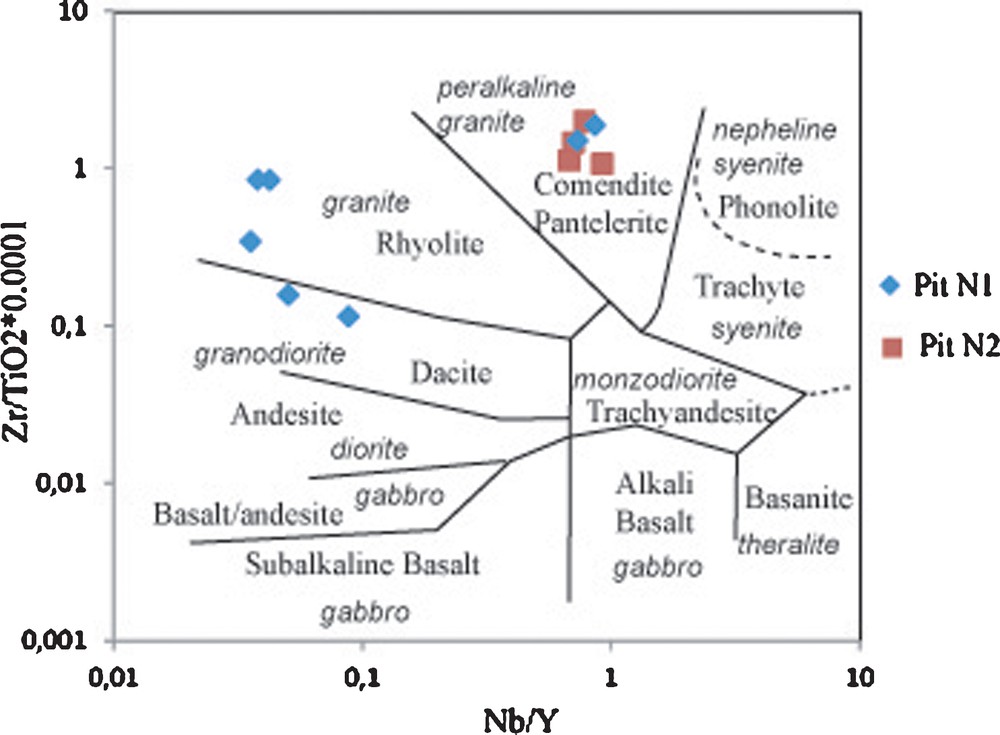
Nb/Y vs Zr/TiO2 (Winchester and Floyd, 1977) showing the protoliths of clays of the Balengou deposit.
5.2 Clay formation: meteoric versus hydrothermal
The problem of meteoric or hydrothermal weathering is inferred here from geological setting, mineral assemblages, and geochemical features. The Balengou clay deposit is under tropical humid climate. Meteoric weathering of rocks here, whatever their nature, yields a thick red ferrallitic soil. This clay deposit constitutes an exception with grey and white clays observed from the surface to a depth of more than 20 m. This exception casts doubt on the meteoric weathering as the main process that has controlled the formation of the clay deposit. If the deposit were resulting from the meteoric alteration of the granitic rock, it would have had a ubiquitous occurrence on the granitic massif (see Tchouankoué et al., 2016). In addition, the meteoric alteration of granitic or gneissic domes is always accompanied by an intense creeping leading to a thin alteration cover at the top. The contradiction between the dip slopes at Balengou and the thick clayey cover (> 20 m) is an additional argument against meteoric weathering as the origin of the clay deposit.
Mineral assemblage in the deposit comprises halloysite + kaolinite + quartz + illite + montmorillonite + hematite + anatase. This assemblage is as common as meteoric weathering or low-temperature hydrothermal products (Pialy et al., 2008; Singer et al., 2004). The occurrence of gibbsite at shallow depth and that of illite in deep layers can be interpreted in terms of meteoritic alteration near the surface, thus as a superposition of meteoric alteration over hydrothermal alteration. This conclusion is strengthened by the absence of the iron hydroxide minerals that prevail in meteoric alteration products under tropical humid climate (Bilong et al., 1992; Bitom et al., 2003; Braun et al., 1990).
Studies based on the chemical compositions of clays have proposed some trace elements (e.g., Fe, Ti, Cr, Nb, P, Ce, Y, La, Ba, Sr, Zr) that can be used to distinguish between hydrothermal and weathering clays (Dill et al., 1997, 2000). Recent studies have proven that trace elements chemical behaviours vary with the deposit; thus, the criteria of Dill et al. (1997) cannot be transferred to classify another deposit (Cravero et al., 2010). Balengou clays contain some amounts of alkalis and alkali earths despite their location on steep slope hills under tropical humid climate. These are good drainage conditions that must have favoured the leaching of these elements during meteoric weathering. All samples present similar REE patterns inferring to a contemporaneous formation under control of the same processes. Generally, weathering and lateritic soil formation processes occur in an oxidizing environment where Ce3+ is oxidized to Ce4+ and therefore behave differently from other REEs, cerium oxides being less soluble than those of other REEs. It can precipitate as cerianite (CeO2), which is adsorbed on particles, and triggers a positive Ce anomaly (Braun et al., 1990). Conversely, hydrothermal processes usually occur in more reducing conditions (Dill et al., 1997, 2000) where Eu3+ is reduced to Eu2+ and fractionates differently from other REEs. Clay samples from Balengou display peculiar deep negative Ce and Eu anomalies (Fig. 8). These anomalies reflect a selective leaching of these two elements in their less oxidized forms, since the corresponding salts are more soluble than those of the more oxidized forms. A highly selective behaviour of trace and rare earth elements is common in hydrothermally altered felsic rocks (Parsapoor et al., 2009). It is very unlikely that these anomalies are attributable to the source rocks. They result from a reducing process at a stage of geological evolution of the system. The high values of Ce and Eu anomalies have been assigned to an advanced argillic alteration, which generally operates under low-temperature conditions (Dill et al., 2000; Shao et al., 2015). In Cameroon, clays formed by advanced argillic hydrothermal alteration are described at Mayouom and they too display Ce and Eu anomalies (Njoya et al., 2006; Tassongwa et al., 2014). Alteration conditions were quite similar to those of the Mayouom kaolin deposit: (i) the fault of the western flank and other tectonic events yielded many fractures in the granitic dome, which have acted as pathways for infiltrating meteoric water in the aquifer; (ii) then the magmatic veins emplacement was accompanied by heat and magmatic fluids which were heated and mixed with the ground water; (iii) magmatic fluids rich in sulphides and sulphates induced an acidic environment where Eu and Ce were reduced and fractionated differently from other REEs; (iv) these hot fluids underwent a convective movement during which the felsic volcanic materials and the neighbouring granitic basement were altered into halloysite, which subsequently unrolled into kaolinite. However, the very plausible hypothesis of low-temperature hydrothermal alteration is yet to be constrained by D/H and 18O/16O studies.
5.3 Potential related ores
Most hydrothermally formed clay deposits host other ores of high economic values such as gold, copper, silver, tourmaline, molybdenum, tin, tungsten, uranium (Robb, 2005) depending on the host rocks, the basement, and the geologic events recorded by the deposits (Dill et al., 2015). At Balengou, the protoliths are alkaline–peralkaline trachytes and rhyolites. In such rocks, the expected metals are REE, Zr, Nb, Ta, Hf, Sn, Mo, W, and F (Nkoumbou et al., 1995). The Pan-African basement is a potassic calc-alkaline granite with expected Au, Ag, Cu, Mo, Pb, Zn, Sn, W (Robb, 2005). Along the Cameroon volcanic line, Sn mineralization is described in the Mayo-Darlé granitic massif (Nguene, 1982). Any attempt of ore prospection at Balengou should apply the new approach recommended by Dill et al. (2015), taking into account the neighbouring tertiary Bana complex (Kuepou et al., 2006) and its Pan-African basement.
6 Conclusion
Field observations, mineralogical and geochemical studies of the Balengou deposit lead to the following conclusions:
- • the presence of a clay deposit at Balengou is testified by > 20 m deep extend;
- • clays developed at the expense of commendite/pantelerite, trachyte and rhyolite or their plutonic equivalents in a granitic dome;
- • the mineral assemblage comprises halloysite + illite + montmorillonite + quartz ± cristobalite ± tridymite ± hematite ± anatase. It does not vary with depth, except that gibbsite occurs in less deep samples. Modal analyses show that halloysite prevails on illite and montmorillonite, but as a whole, the modal compositions are very heterogeneous;
- • chemically, these clays may have inherited of high Zr, Zn, Nb, Ta, Hf, Ba and REE contents from the parent rocks, though they are enriched in Cr, Co, Ni and Sc;
- • geochemical and mineralogical features lead us to infer an advanced argillic hydrothermal alteration origin to the Balengou clay deposit. Likely, heat from late intrusive felsic volcanic veins in the granitic dome created the convection of ground water/magmatic fluids that provoked kaolinization (halloysite and illite formation) in the veins and a halo in the granitic basement.