

1 Introduction
Gorkha earthquake (MW 7.8) occurred on April 25, 2015, in central Nepal and surrounding areas that caused 8790 casualties, 22,300 injuries and approximately $7 billion economic loss (NPC, 2015). After the 1934 Bihar–Nepal earthquake (MW 8.1) Gorkha earthquake is the strongest event in Nepal Himalaya that occurred along the main central thrust (MCT). Gorkha earthquake destroyed 498,852 buildings and damaged additional 256,697 buildings. At least 2900 cultural heritage structures were affected, including world heritages as well as the monumental construction of the 20th century. Before the Gorkha earthquake, structural engineering practices were confined with the seismic coefficient and response spectrum method; however, the Nepal building code endorses any other reliable and internationally acknowledged method for practice. To this note, nonlinear time history method may fulfill the demand of structural engineering to represent the truly nonlinear behavior of structures. Although nonlinear time history analysis has several merits, increasing time history records are not available in Nepal. Strong to major earthquake records are not available, with the exception of a few. To facilitate nonlinear time history analysis, artificial accelerograms are being used worldwide. Several frameworks, like the deterministic, stochastic and others are being practiced to generate spectrum-compatible artificial accelerograms (e.g., Cacciola and Zentner, 2012; Mitropoulou et al., 2015; Rofooei et al., 2001; Spanos and Loli, 1985).
Rapid growth in number of high-rise structures in Nepal and need of vulnerability assessment highlight the need for artificial accelerograms in Nepal. To the best of our knowledge, spectrum compatible artificial accelerograms considering updated seismic hazard analysis did not exist until now. Thus, structural engineering practices are dependent on conventional seismic coefficient and response spectrum methods. To fulfill the need for increasing time history records, we performed seismic hazard analysis considering the sources of Thapa and Guoxin (2013) and carried out seismic hazard analysis as done by Chaulagain et al. (2015). In this paper, we develop artificial accelerograms for 73-, 100-, 170-, 300-, 475-, 700-, 975-, 1379-, 2000-, 2475- and 5000-year return intervals. These time histories may serve for various seismic demands adhering to seismic safety and importance.
2 Materials and methods
We considered Thapa and Gouxin (2013) seismic sources for seismic hazard analysis and converted into 23 seismic sources as reported by Chaulagain et al. (2015). We used OpenQuake-engine developed by Global Earthquake Model (Silva et al., 2014) for seismic hazard assessment of Nepal for the 23 defined seismic source zones. Details of ground motion selection, local site effects and seismic source zones are reported by Chaulagain et al. (2015). Response spectra obtained from PSHA were adjusted using SeismoArtif (SeismoArtif, 2013) considering the tectonic regime, source-to-site distance, and site condition. SeismoArtif provides a platform for a user-defined spectrum to generate artificial accelerograms. Target spectrum and envelope type were defined to generate artificial accelerograms.
The artificial accelerogram calculation method is based on Hallodorsson and Papageorgiou's (2005) algorithm. The accelerogram is defined starting from a synthetic one (simulated by the user) that is compatible with the target spectrum and adapting its frequency content using the Fourier transform. Correction for the random process is carried out for each iteration using the relationship given by Mucciarelli et al. (2004) as follows:
Where SRT(f) is the value of the target spectrum and SR(f)i) is the value of the response spectrum corresponding to the accelerogram of the current iteration for frequency f. F(f)i+1 and F(f)i are the values of the accelerogram in the frequency domain for the current and the previous iterations, respectively. The Fourier transformation is applied to switch from the time domain to the frequency one, and correction to the accelerogram is also carried out simultaneously. Thereafter, an inverse Fourier transformation is applied to return to the time domain where the corresponding spectrum is calculated, convergence is checked and the decision is made of whether the further correction is needed or not.
3 Results and discussion
The expected peak ground acceleration (PGA) for 10 and 5% probability of exceedance in 50 years was obtained between 0.22–0.50 g and 0.30–0.64 g, respectively. Higher PGA was obtained for the eastern and middle western parts of the country, and lower PGA occurred in the southern part of the country. The middle western part of Nepal lies in the central seismic gap, which is believed to be unzipped for at least 500 years, thus the possibility of a major earthquake with high PGA occurrence is high in this section of Himalaya. For different frequencies, we calculated uniform hazard curves for the densely populated capital city region of the Kathmandu valley as shown in Fig. 1.
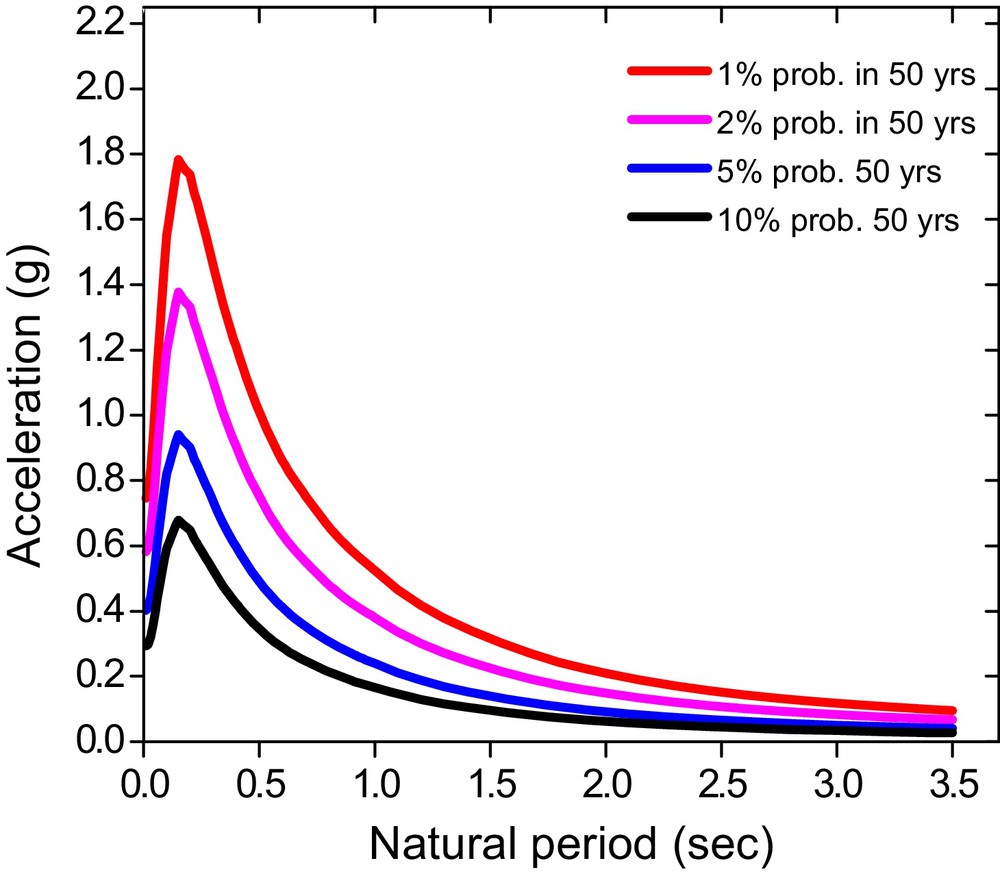
Uniform hazard spectra (5% damping) for the Kathmandu valley.
Fig. 2 depicts the response spectra (5% damping) for Kathmandu for the designated return intervals used to generate artificial acceleration time history. Using a spectral matching technique, we generated artificial acceleration time history for various return periods (see Supplementary material).
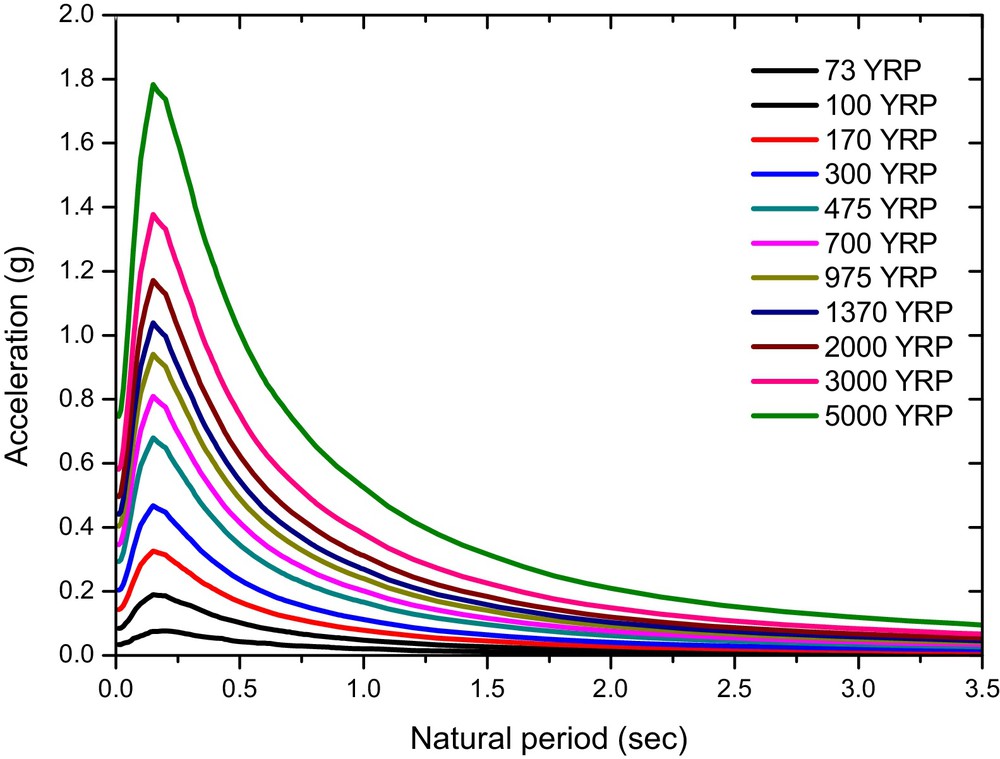
Response spectra (5% damping) for the Kathmandu valley (YRP stands for years return period).
Finally, we compared the artificially generated acceleration time histories with the records of the 2015 Gorkha earthquake in the Kathmandu valley as reported by Takai et al. (2016). Interestingly, the records of the main shock (MW 7.8) matched for 300- and 475-year return periods only (Fig. 3). Fig. 3a and Fig. 3b show good agreement between the synthetic and recorded accelerograms for the peak amplitude, although the starting time is not the same. Moreover, as depicted in Figs. 3c and 3d, the Fourier spectra do not match appreciably. This confirms the anomalous case of ground motion occurrence during Gorkha earthquake as highlighted by the large amplitude of Fourier spectra at low frequency and variation among the Fourier spectra of recorded accelerograms. Notably, the Gorkha earthquake did not affect well-designed structures in the Kathmandu valley remarkably and damage in well-designed structures was limited to non-structural elements (see Gautam and Chaulagain, 2016). Although PGA occurrence was relatively lower than expected, future earthquakes may not follow the similar trend, so that, in the case of strong shaking, higher PGA can be expected in the Kathmandu valley due to its location nearby the active faults. For instance, in the case of the 2475-year return period, the spectral acceleration for the Kathmandu valley was estimated to be 1.38 g, which may represent major earthquakes for Himalaya. Thus, use of a 2475-year return period time history is recommended to assure adequate seismic safety. This time history may be also applicable to hydroelectricity projects, industries, bridges, and dams, which are critical infrastructures for Nepal. As reported by Gautam (2017), heritage and monuments in the Kathmandu valley were so severely damaged due to the Gorkha earthquake that seismic vulnerability analysis of such structures may be important in the near future. For the seismic vulnerability analysis of heritages, we recommend time histories adhering to greater return periods, like 2475 and 5000 years.
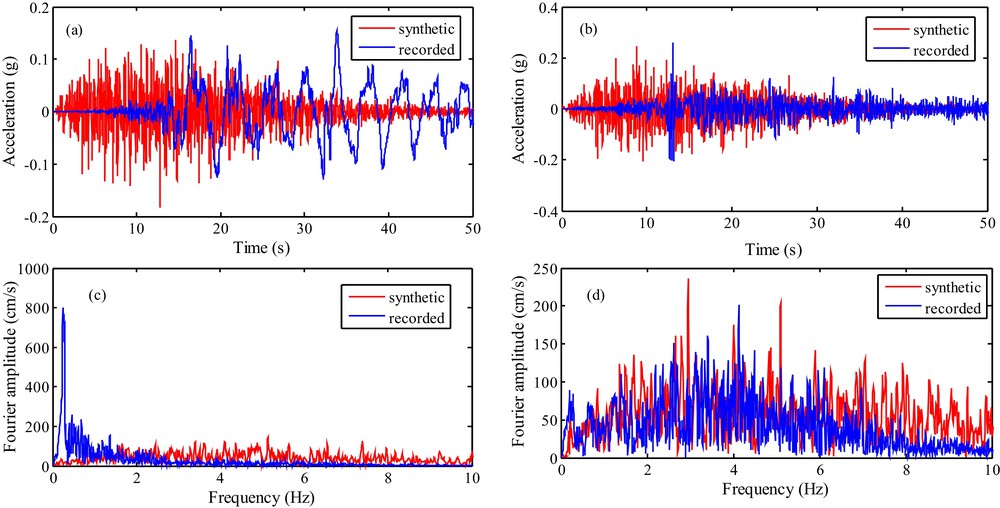
Comparative plots of artificial and recorded accelerograms in the Kathmandu valley: (a) 300-year return period and Thimi station (Takai et al., 2016); (b) 475-year return period and Kirtipur station (Takai et al., 2016); (c) Fourier spectra for a 300-year return period and recorded accelerogram at Thimi; (d) Fourier spectra for a 475-year return period and recorded accelerogram at Kirtipur.
4 Concluding remarks
This study provides the first systematic account of spectrum-compatible acceleration time history for Nepal. In this paper, we have generated artificial accelerograms for 11 return periods to fulfill the gap of increasing time history records for Nepal Himalayas. After the Gorkha earthquake, the importance of nonlinear time history analysis of new designs and seismic vulnerability assessment of existing structures is more pronounced, and artificial accelerograms generated in this study could be useful for both purposes. The comparison between artificially generated and recorded accelerograms shows that the peak amplitude is considerably similar in the case of 300- and 475-year return periods. The recorded maximum PGA during Gorkha earthquake is ∼0.25 g, whereas the design PGA recommended by the Nepal building codes is 0.36 g (NBC-105, 1994). For the design consideration of critical facilities, industrial buildings, high-rise apartments, and other important infrastructures, the seismic demand is higher than for the common residential constructions. Thus, we recommend the use of time histories for 2475- and 5000-year return periods, whereas in the case of residential buildings, an acceleration time history generated for 475 years can be used.
This study is limited to the previous seismic sources defined by Thapa and Guoxin (2013); future studies need to incorporate other seismic sources that may be beyond the Nepali border. It is because earthquakes occurring in China and in India also cause damage in Nepal that seismic sources are important to depict the seismic hazard in Nepal. This will ultimately improve reliability of artificial accelerograms.
Acknowledgement
The authors are grateful to Dr. Giovanni Lanzano (CNR, Italy), and to Dr. Sergio del Gaudio (IRSN, France) for their remarkable efforts to review this manuscript. Their constructive comments have greatly increased the quality of our contribution.