

1 Introduction
Low permeable gas sandstone reservoirs, also called tight reservoirs, are generally considered as stress-sensitive reservoirs (Shanley et al., 2004). Numerous lab tests have shown that the absolute permeability of these reservoir rocks decreases strongly with confinement. For single phase flow, this dependence to confinement is related to the existence of joints and interfaces in tight rocks, which will close when loading is increased (Fu et al., 2015; Ghabezloo, 2015; Holditch, 2006; Schmitt et al., 2015; Shanley et al., 2004; Walsh and Brace, 1984). For two-phase flows in porous media, not only the absolute permeability, but also the relative permeabilities can a priori be modified under loading. Recent experimental results demonstrate that, for tight sandstones, relative permeability curves will change with confinement (Wang, 2016).
The purpose of this paper is to use micromechanics in order to provide support to these experiments and to explain – at least qualitatively – why the behaviour of relative permeabilities under loading can be different between low permeable rocks and permeable rocks. The idea is to compare different morphological models representative either of permeable reservoir rocks or of tight rocks.
This note is organised as follows. Section 2 presents a specific model describing tight rocks behaviour under loading. The proposed modelling is shown to be in fair agreement with measured data. Contrarily, considering a permeable medium in Section 3, we show for some simplified microstructures that the relative permeabilities should not depend on the loading.
2 Tight sandstones relative permeabilities under loading
Recent experimental results on low permeable sandstones (Wang, 2016) highlight a dependence of the gas relative permeability on the confinement (Fig. 1).
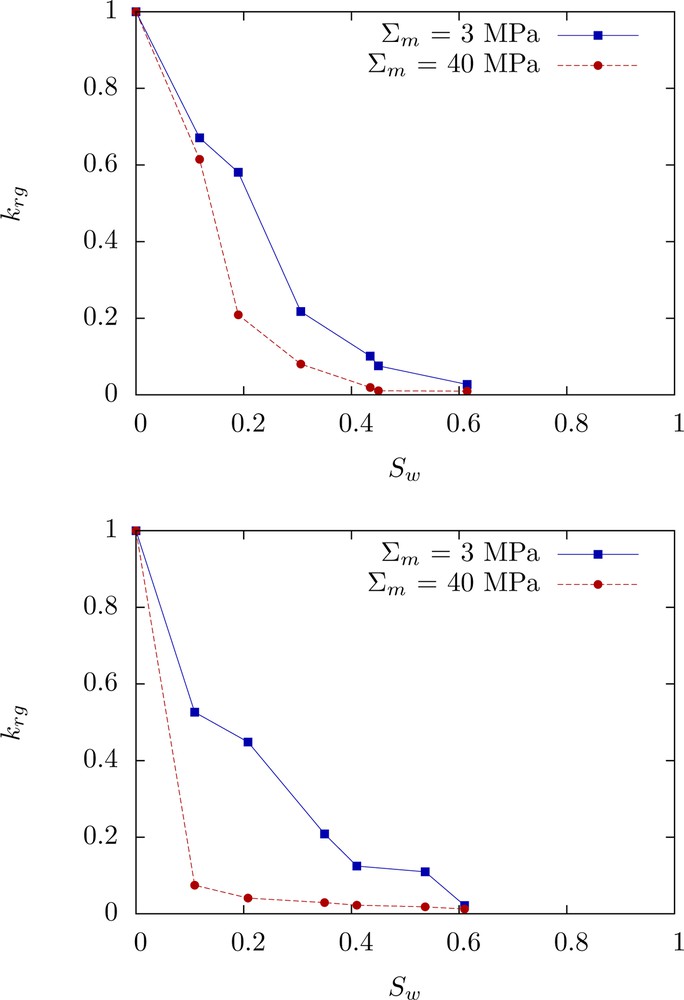
Gas relative permeability measurements for 2 low permeable sandstone samples – loading of 3 MPa (blue curve) – 40 MPa (red curve).
The tight sandstone studied by Wang (2016) is made up of quartz grains and pores (Fig. 2); the contact zone between grains, partially cemented or not, forms joints with very thin openings e (i.e. smaller than a few micrometers) as compared to the grain radius R, which is around 100 μm (i.e. e ≪ R). From a fluid flow point of view, pores and interfaces define the pore network.
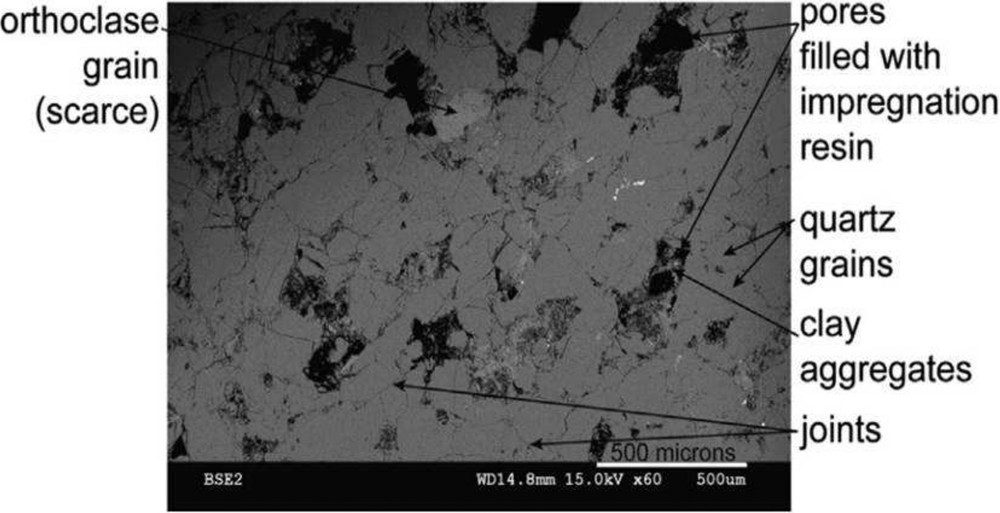
SEM image of a tight sandstone.
2.1 Grain with interfaces: the hydraulic model in the dry case
The morphological model chosen to represent sandstones is in agreement with the SEM observation concerning microstructure (Fig. 2): tight sandstones are considered as an assemblage of spherical grains surrounded by permeable interfaces and of pores. The spherical shape is used to translate the fact that the considered phase does not manifest any anisotropy (Dormieux et al., 2011; Kröner, 1978).
We define the microscopic scale as the one of the heterogeneity of the microstructure (that is the scale of the grains with interfaces and of the pores). At the macroscopic scale, the representative elementary volume (rev) denoted Ω is regarded as a homogenised medium. The pore space occupies the domain Ωp in the rev. For tight sandstones, the porosity ϕ = |Ωp|/|Ω| is usually low (below 10%).
Let z denote the position vector at the microscopic scale in the rev. If a(z) is a field defined on Ω at the microscopic scale, its volume average is denoted by . We also introduce the intrinsic averages over each phase α in Ωα, with α = p for pores or g for grains. Following their definitions, as well are macroscopic quantities.
In order to derive an estimate of the macroscopic absolute permeability khom and gas krg and water krw relative permeabilities, we will use a self-consistent homogenisation scheme to relate microscopic fluid flow properties (i.e. at the pore scale) to the fluid flow behaviour of the rev at the macroscopic scale (see Appendix A).
As proposed for grains with permeable interfaces in Dormieux et al. (2011), a two-dimensional mathematical representation of the interfaces will be adopted. Note that we consider a viscosity equal to 1 in the following. At the microscopic scale, the core of a grain Gi is assumed impermeable, while the surface velocity vector q is assumed to be proportional to the fluid pressure gradient in the interface:
| (1) |
Based on Poiseuille's law, the conductivity of the half-interface associated with one given grain is given by (Dormieux et al., 2011):
| (2) |
In order to estimate the homogenised permeability khom, two auxiliary problems are considered: one related to the flow in the pores and the other one to the flow in the interfaces, around grains.
The first auxiliary problem is a classical Eshelby problem featuring a spherical pore embedded in an infinite homogeneous medium of permeability khom (which is an unknown at this stage). At infinity, the boundary conditions on the fluid pressure write p(z) = ∇ P0 · z, where ∇ P0 is an auxiliary macroscopic pressure gradient, which will be related later to the actual macroscopic pressure gradient ∇ P. Since the characteristic size of the pores is large compared to the width of the interfaces, the pore space is regarded as a phase with infinite permeability. The average of the pressure gradient and the velocity in the pore phase p are deduced from Eqs. (A.1) and (A.2):
| (3) |
In view of estimating the flow in the interfaces around the grains, we next consider a second auxiliary problem of a spherical grain G of radius R surrounded by its half-interface, embedded in an infinite homogeneous medium of permeability equal to the homogenised permeability khom, with the same boundary conditions as previously. The resolution of this auxiliary problems leads to the following estimates of the pressure gradient and velocity averages over grains surrounded by an interface of thickness e:
| (4) |
| (5) |
Since all the interfaces in the material do not have the same thickness, we further assume a continuous distribution of interfaces by means of p.d.f. α; α(e) de represents the proportion of impermeable grains that have an interface with a thickness e in the range [e ; e + de]. α is normalised such that:
| (6) |
| (7) |
We now come back to the definition of the homogenised permeability khom as the tensor relating the average over the rev of the pressure gradient to the average over the rev of the velocity by . The elimination of ∇ P0 in the estimates of and via (3) and (7) yields the following estimate of the homogenised permeability (Dormieux et al., 2011):
| (8) |
| (9) |
2.2 Relative permeability model
Let us now evaluate the relative permeabilities in a simplified way. We denote the water saturation Sw. To evaluate the gas relative permeability krg(Sw), the previous hydraulic model is modified by assuming that interfaces and pores are now saturated either by water or by gas. The gas flow is assumed to take place only in pores and interfaces filled with gas, so that pores and interfaces saturated with water are impermeable with respect to the gas flow.
In this system, the water phase constitutes the wetting fluid. We define e★ as the largest opening of the interfaces invaded by water: for a given saturation Sw, each inclusion with interface opening e between 0 and e★(Sw) is supposed to be filled up by water.
To sum up, the considered rev is made up of four different components:
- – pores saturated with gas, with an infinite gas permeability, of volume fraction ϕ (1 − Sw),
- – pores saturated with water, impermeable to gas, of volume fraction ϕSw,
- – grains with an interface saturated with gas, of volume fraction ,
- – grains with an interface saturated with water, impermeable to gas, of volume fraction .
The homogenised permeability is estimated as previously using the self-consistent scheme. By direct use of (A.6), the estimate of the homogenised gas permeability is the positive root to:
| (10) |
| (11) |
Unfortunately, we are not able to evaluate α in a straightforward way. The distribution β(e) of pores supplied by interfaces of largest thickness in the range [e ; e + de] can be related to the capillary pressure curve.1 The usual interpretation of capillary curve assumes that the filling of a pore is determined by a single interface thickness; in drainage, the pore associated with the largest interface gets filled by the non-wetting fluid at first and, at increasing capillary pressures, pores fed with increasingly smaller interfaces become invaded by the non-wetting fluid. A simplified hypothesis consists in assuming that α(e) is proportional to β(e). Both distribution being normalised to the unity, we hence assume:
| (12) |
Under the assumption (12) and in the case of a log-uniform distribution of interfaces, the solution to (10) and the definition khom(Sw) = krg khom(0) lead to the following gas relative permeability estimate (Bignonnet et al., 2016):
| (13) |
2.3 Loading effect
The purpose of this section is to present a poromechanical model of a low permeable sandstone consistent with the morphology of the previous section, in order to explain the relative permeability evolution under loading that has been observed experimentally. This constitutes an extension to relative permeabilities of a previous work in the dry case (Dormieux et al., 2011).
We hence turn to the micro-poromechanical model proposed by He et al. (2012). The solid grains are assumed to be rigid and surrounded by elastic interfaces. The constitutive law of the interface is characterised by a normal stiffness Kn and a tangential stiffness Kt, supposed to be the same for all interfaces. More precisely, for a macroscopic stress increment ΔΣ, let us denote ΔT the stress vector increment acting on the interface and [Δu] the displacement jump increment across the interface. The constitutive law of the interface reads:
| (14) |
We assume that water and gas pressures do not vary significantly compared to the imposed confinement increment at the microscopic scale. Let us consider an isotropic stress increment ΔΣ = ΔΣm1. Using the strain concentration rules established in the micro-poromechanical model of He et al. (2012), the variation of the opening of each interface is proved to be independent of its initial opening e and given by:
| (15) |
From a hydraulic point of view, a confining stress increment has thus a significant consequence, as each interface with an initial opening lower than Δe is closed and a part of the pore network is no more accessible to the fluid flow. Since by definition β(e) de is the fraction of pores supplied by an interface of largest thickness in the range [e ; e + de], the porosity Δϕ (≥0) trapped due to a load increment verifies2:
| (16) |
The homogenised permeability is then estimated as previously using the self-consistent scheme. Due to loading, trapped pores or grains surrounded by closed interfaces are taken into account as being impermeable to any fluid flow. Let us denote by e★ (≥Δe) the opening of interface (before loading) that separates water-filled interfaces from gas-filled interfaces (after loading). By direct use of (A.6), the estimate of the homogenised gas permeability is the positive root to:
| (17) |
To go forth, our model requires a key information: for a given water saturation Sw, what is the proportion of water-filled interfaces among interfaces still open after loading? Let us denote by f(Sw) this fraction which reads, by definition of e★:
| (18) |
| (19) |
| (20) |
Further, under the assumptions (12) and (19) and in the case of a log-uniform distribution of interfaces, the homogenised permeability of the partially saturated medium under a load that traps a porosity Δϕ verifies:
| (21) |
| (22) |
To study the influence of the shape of the p.d.f. α that governs the grain interface openings, a log-normal distribution of the opening with a mean of log(e) =−7 and a standard deviation of 1 has also been considered. The solution to Eq. (17) is no longer analytical and has been computed numerically. The outputs of the model are presented in Fig. 3 for both the log-normal and log-uniform distributions with a standard deviation of 1, in the case of an initial porosity of 0.1 and a trapped porosity Δϕ of 0.03. It is observed that our simple model does account for the stress sensitivity of relative permeability curves for tight sandstones. At equivalent mean and standard deviation, the influence of the shape – log-uniform or log-normal – of the p.d.f. α of the size distribution of interface openings is of second order on the relative permeabilities.
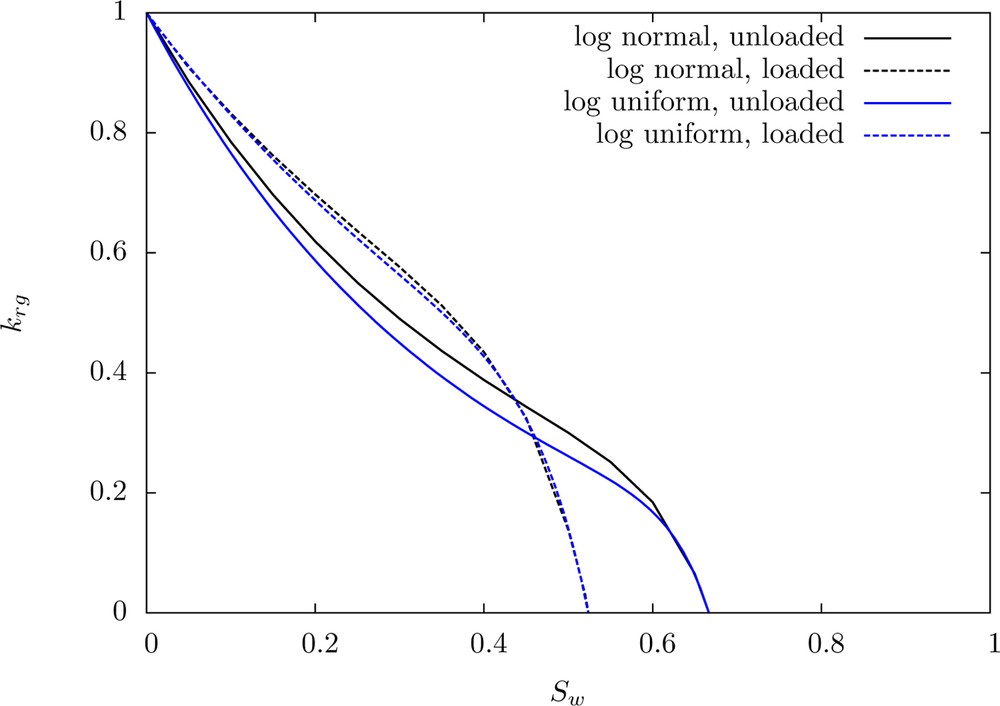
Estimates of gas relative permeabilities without loading (line) and with loading (dashes) for ϕ = 0.1 and Δϕ = 0.03.
2.4 Limitations of the model
The main interest of the present model lies in the use of the same morphological model for the fluid flow and mechanical problems. This allows us to explain qualitatively the effect of loading on relative permeabilities, at least close to the critical water saturation. However, let us stress out that self-consistent estimates do not have the accuracy of percolation models (Guéguen et al., 1997), realised, for example, on a 3D image of the pore network. In particular, the percolation threshold values arising from the self-consistent scheme may not be accurate.
The present model further relies on a number of simplifying hypotheses, which allow us to reach an almost complete analytical treatment of the loaded problem. Namely, this simplified model does not account for complex multi-phase flow mechanisms such as snap-off or flow by film (Dullien, 1992). Moreover, Eq. (12) constitutes a strong assumption on the connectivity of the porous network. A closer comparison of our simplified model to the experimental results presented in Fig. 1 shows some discrepancies for water saturation values that are not close to the critical water saturation (particularly in the case of log-uniform p.d.f. α): the model predicts that the relative gas permeability is higher in the unloaded case than in the loaded one, whereas experiments show the opposite behaviour.
2.5 Effect of the interface bulk porosity distribution laws
The purpose of this section is to study the influence of assumption (12) on the connectivity of the porous network. A relationship between α and β more general than (12) is now assumed:
| (23) |
| (24) |
| (25) |
In the case of a log-uniform distribution of interfaces, the homogenised permeability of the partially saturated medium under a load that traps a porosity Δϕ under assumptions (18) and (23) is analogous to (21), up to the minor modifications:
| (26) |
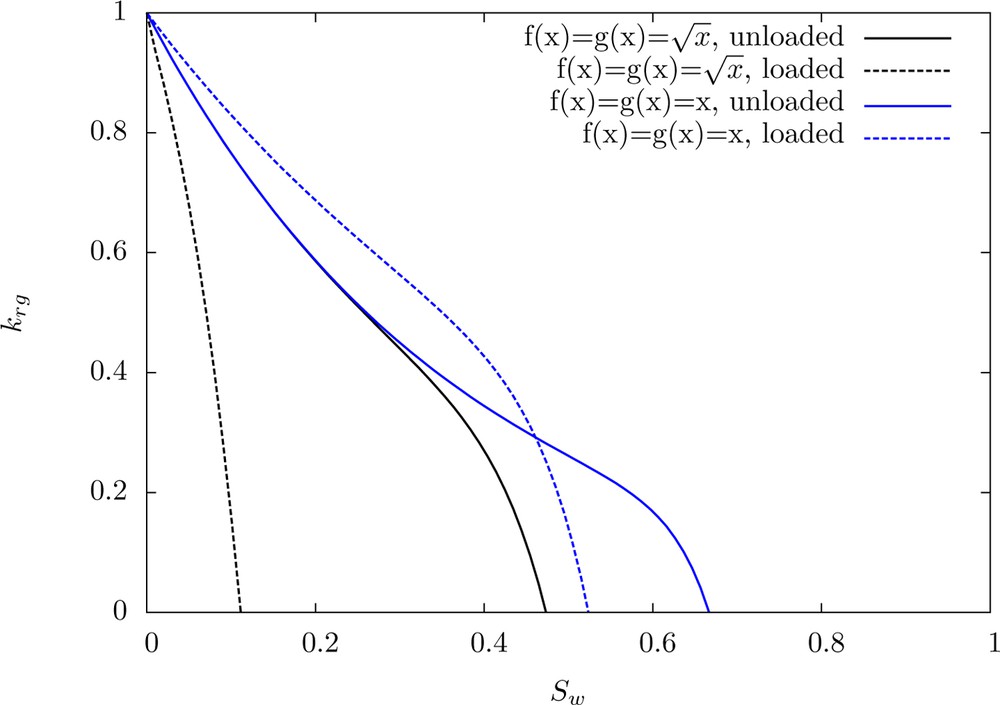
Estimates of gas relative permeabilities: effect of the laws f and g, for a log-uniform p.d.f. α with a standard deviation of 1, ϕ = 0.1 and Δϕ = 0.03.
Thus, an appropriate choice of f and g should be motivated in future works by experimental observations or more sophisticated modelling approaches such as pore network models (Bakke and Øren, 1997; Blunt et al., 2002). Nevertheless, at this stage, the model makes it possible to understand the influence of the closure of joints on the relative permeability in the case of tight sandstones.
3 Model of the relative permeabilities of permeable sandstones
Is is also interesting to use the previous approach with porous medium models adapted to conventional, permeable (i.e. non-tight) sandstones. We assume pores modelled as spherical pores or tubes and show that in these cases relative permeabilities are at first order independent of loading. For such permeable sandstones, the conventional approximation used in reservoir engineering and hydrogeology, which consists in considering the influence of loading on the absolute permeability only and not on the relative permeabilities, thus seems reasonable.
3.1 Porous network made up of spherical pores
Unloaded case. We adopt the same approach as in Section 2 and consider a porous medium made up of spherical pores and an impermeable solid phase. Following Markov et al. (2010), a spherical pore of radius R embedded in a porous medium is equivalent to a spherical permeable inclusion of equivalent permeability3:
| (27) |
Let us consider now as previously a statistical distribution of pore radius characterised by a probability α(R) that a pore has its radius in the range [R ; R + dR]. From Eq. (A.6), the homogenised absolute permeability verifies the following implicit equation:
| (28) |
Let us now turn to the estimation of the relative gas permeability. All pores whose radius is smaller than a critical size R★ governed by the saturation degree are assumed filled by water and impermeable to gas (). Using the self-consistent scheme (A.6), the homogenised gas permeability khom(Sw) = khom(0) × krg(Sw) verifies the following relationship:
| (29) |
Loaded case. The variation of the pore radius ΔR related to an isotropic mechanical loading increment ΔΣm can be readily estimated from micro-poromechanics on the same morphological model (see Dormieux et al., 2006 for more details). The resolution of the micro-poromechanical problem leads to:
| (30) |
| (31) |
3.2 Porous network made up of tubes
Unloaded case. Our second morphological model of conventional, permeable sandstones consists in a porous medium with an isotropic distribution of pores that are tubes (circular cylinders of radius r). Let n be the unit vector along the axis of a tube. The permeability kn of a tube of radius r in its axial direction is given by Poiseuille's law:
| (32) |
| (33) |
Next, we consider an isotropic spatial distribution for the tubes and a probability α(r) that a tube has its radius in the range [r ; r + dr]. From (A.6), the following self-consistent estimate for khom is finally obtained:
| (34) |
The partially water saturated case is dealt with assuming that tubes with a radius r < r★(Sw) are saturated with water and impermeable to gas. In that case, the gas permeability verifies:
| (35) |
Loaded case. In order to deal with the effect of loading on the relative gas permeability, the variation Δr of the radius of the tubes under an isotropic loading increment ΔΣm can be assessed from micro-poromechanics on the same morphological model than for the permeability. From the hydraulic point of view, the relevant output of such a poromechanical model is that Δr/r is proportional to the load increment, i.e.:
| (36) |
4 Conclusion
The application of homogenisation techniques to simplified – but representative – morphologies of either tight, low-permeability sandstones or conventional, permeable sandstones allows one to qualitatively retrieve an experimentally observed behaviour: the relative gas permeabilities of tight sandstones are much more sensitive to confinement than the ones of conventional sandstones. The underlying phenomena at the microscopic scale is the occurrence of closure of the joints due to loading in tight sandstones, which defines new percolation pathways. Conversely, it is shown that the relative permeability is not very sensitive to loading for conventional sandstones under the assumption that the load only modifies the pore radii, without modification of the connectivity of the pore network.
It is emphasised that the tight sandstone model has allowed us to identify that a required, key information is the connectivity of the interfaces and the bulk pores, through the functions f and g. The appropriate choice of these functions has not been investigated in the present work. It should be motivated in future works by experimental observations or dedicated modelling, for example using pore network models. Future works should also take into account capillary effects in the micro-poromechanical model. The difference in the pressure of the gas filled and water filled pores may indeed play an important role on the variation of joint openings, and thus affect pore connectivity.
Appendix A Self-consistent estimate of the homogenised permeability
The homogenised permeability khom is defined as the tensor relating the average over the rev of the pressure gradient to the average over the rev of the velocity by for appropriate boundary conditions (e.g., p(z) = ∇ P · z on the boundary of the rev where is the macroscopic pressure gradient).
The self-consistent homogenisation scheme used in this work relies on the estimate of the velocity and pressure gradient averages of each phase of the heterogeneous rev. These averages are estimated from the solution to Eshelby's problems (Suvorov and Dvorak, 2002), devised as follows. For each phase, an inclusion I (or elementary particle representative of the phase) is embedded in an infinite medium whose permeability k0 is uniform. An auxiliary uniform pressure gradient ∇ P0 is applied such that p(z) = ∇ P0 · z at infinity. If the inclusion I is an ellipsoid with homogeneous permeability kI, the pressure gradient and the velocity solution to the Eshelby problem are constant inside the inclusion. In this case, the pressure gradient inside the inclusion is given by:
| (A.1) |
| (A.2) |
| (A.3) |
The average of the pressure gradient and of the velocity over the rev are then estimated as:
| (A.4) |
The self-consistent estimate consists in choosing the permeability k0 of the embedding infinite medium for each auxiliary Eshelby problem as the looked-for homogenised permeability khom. The elimination of the auxiliary pressure gradient in (A.4) then provides the self-consistent estimate of the homogenised permeability as the solution to the equation:
| (A.5) |
| (A.6) |
1 Which is measured without confinement of the rock sample.
2 Changes of volume fraction of pores and grains related to loading are here neglected.
3 Rigorously, (27) is valid only in the limiting case where kpore(R) is large compared to the permeability of the surrounding porous medium.