

1 Introduction
Density is one of the fundamental information to constrain when estimating planet's interiors using observed geophysical data. In particular, a density data of metals at high pressures and high temperatures, and its thermoelastic properties, such as the bulk modulus and thermal expansion, provide significant information to understand the compositions and dynamics of planetary metallic cores.
The X-ray absorption method is an effective method for density measurement of non-crystalline materials, such as liquid and glass. In regard to the density determination of a liquid metal at high pressures and high temperatures, Katayama et al. (1993) developed the X-ray absorption method combined with a multi-anvil press. In this method, density can be obtained from the measured intensities of the incident and transmitted X-rays from the sample. The details of the method are described in the Experimental section. Several density measurements have been conducted for different liquid metals using this method (e.g., for Fe–Si: Sanloup et al., 2004; for Fe–S: Nishida et al., 2011; and for Fe–C: Shimoyama et al., 2013). In these measurements, it is common to use an ion chamber or a photodiode to detect X-ray intensities. Some studies reported the X-ray absorption imaging method, which was performed using a charge-coupled device (CCD) (e.g., Chen et al., 2005, Terasaki et al., 2010). These density measurements for liquid materials with a large volume press have been limited to pressures below 10 GPa. Density measurements at higher pressures have been attempted using diamond anvil cell (DAC) combined with the X-ray absorption method (e.g., Petitgirard et al., 2015; Sato and Funamori, 2008; Shen et al., 2002a,b). Petitgirard et al. (2015) significantly extended the measured pressure range up to 127 GPa and determined the density of MgSiO3 glass at room temperature. However, most of the X-ray absorption measurements with DAC are performed at room temperature. Only Shen et al. (2002b) performed measurements at high temperature using an externally heated DAC up to 710 K and 8.5 GPa. In addition to the X-ray absorption method combined with DAC, density can be also obtained from X-ray diffraction data (Eggert et al., 2002). This method is another option to extend the density measurement to higher P–T conditions by using laser-heated DAC (Morard et al., 2013).
In X-ray absorption measurements using DAC, a one-dimensional detector, such as an ion chamber or a photodiode, was used to measure X-ray absorption. As a scanning of the sample is needed to obtain the X-ray absorption profile using these detectors, the time for measurement generally requires a relatively long time (typically 5 to 30 min) at one P–T condition. On the contrary, the typical exposure time for an X-ray absorption imaging is reported to be less than 1 min (Terasaki et al., 2010). It is important for a liquid sample to make the measure in the shortest possible time because of the high reactivity and mobility of the liquid sample.
In this study, we developed an X-ray absorption imaging method combined with an externally heated DAC and measured the densities of solid and liquid indium up to 719 K and 18.6 GPa. Indium (In) was used as a sample because its melting temperature is relatively low (430 K at 1 atm) and its density is close to that of Fe, i.e. a density analog to that of Fe. The measured density of solid In from the X-ray absorption method was evaluated by comparing the density obtained from X-ray diffraction (XRD). Then, dependences of density on pressure and temperature, i.e. the isothermal bulk modulus and thermal expansion coefficient of In, will be discussed.
2 Methods
High-pressure experiments were conducted using a symmetric DAC with a lever-arm frame (Whale cell; Syntek Co., Ltd.). Diamond-anvils with a culet size of 600 and 450 μm in diameter were employed depending on the target pressures. The starting material was In powder (99.999% in purity; The Nilaco Corp.). A Re gasket was pre-indented to 75–100 μm in thickness. The gasket has two or three holes of 60–100 μm in diameter, which were laser drilled at the same distance from the center of the culet. The In sample and two of density reference materials (NaCl, Fe, or KBr) were placed in each hole (Fig. 1). The reference materials and the Re gasket were used for the calibration of the X-ray absorption and for the determination of experimental pressures. The experimental pressures were determined from the average values between pressures of the reference materials (NaCl, KBr, and Fe). The errors of the experimental pressures were taken from the largest pressure difference between the references.
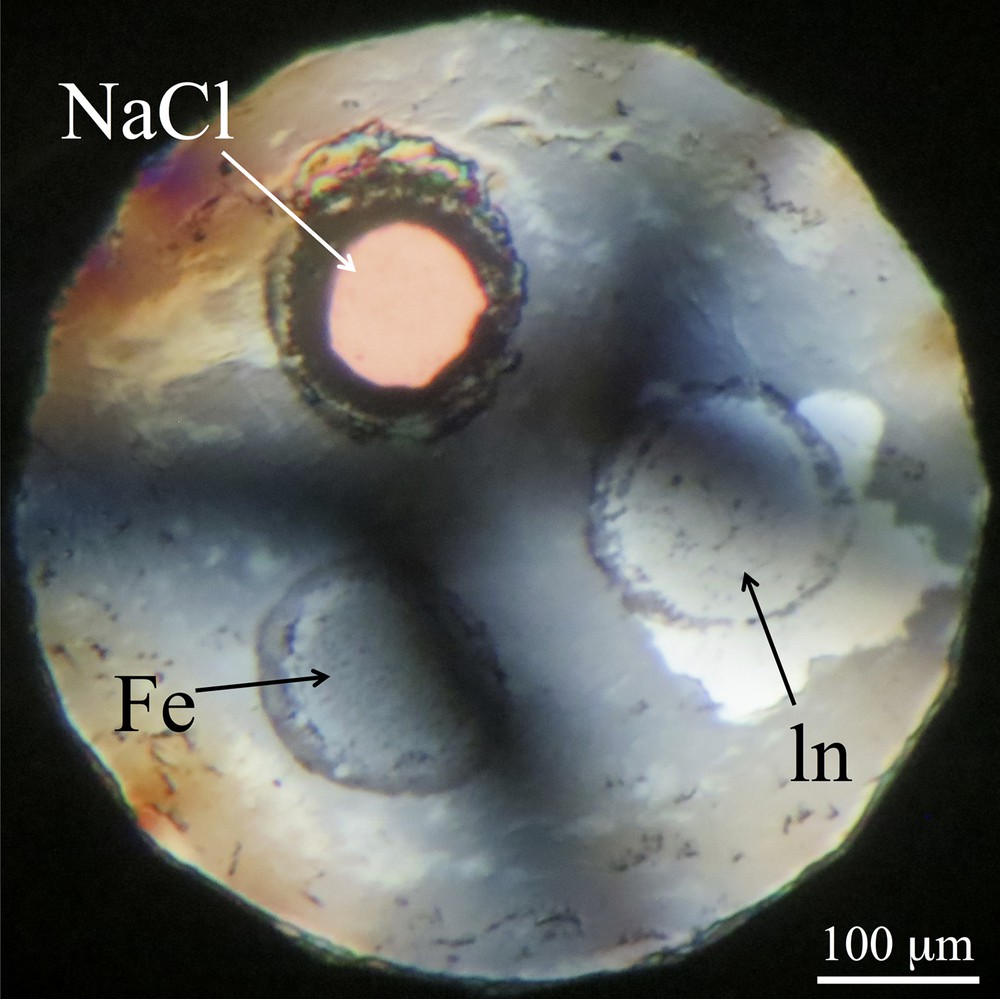
Optical microscope image of the sample chamber at 3.6 GPa and 297.5 K in the first run. The sample of In and the reference materials of NaCl and Fe were located at a same distance from the center of the Re gasket.
Density measurements were conducted by using the X-ray absorption method at the AR-NE1A beamline (Photon Factory Activity Report, 2008) of Photon Factory-Advanced Ring (Tsukuba, Japan) and the BL22XU beamline (Shobu et al., 2007) of the SPring-8 synchrotron radiation facility (Sayo, Japan). The experimental set-up is shown in Fig. 2. A monochromatic X-ray beam tuned to 29.7–30 keV was used for X-ray absorption imaging and diffraction measurements. This X-ray energy was optimized for the best X-ray absorption contrast between the sample and the reference materials. At the AR-NE1A beamline, the incident X-ray beam was collimated to a diameter of 600 and 30 μm for imaging and XRD, respectively. The transmitted X-ray through the sample in the DAC was converted into visible light using a YAG:Ce scintillator disc that was attached behind the sample and then detected by CCD cameras (BS-42 N; BITRAN Corp. and VH-5500; KEYENCE Corp.). The used exposure time for image collection of each camera ranged from 4 to 17 s, depending on the image contrast. The image resolutions were 0.59 and 0.37 μm/pixel for BS-42 N and VH-5500, respectively. The angle-dispersive XRD patterns of the sample and the reference materials were collected using an imaging plate system (R-AXIS IV, Rigaku Corp.). At the BL22XU beamline, the incident beam was collimated to 1.5 × 1.5 mm2 for imaging and 20 × 20 μm2 for XRD. The transmitted X-ray images were detected by a CMOS camera (ORCA-Flash 4.0 V2; Hamamatsu Photonics K. K.). The exposure time for imaging was 2–3 s, and the image resolution was 3.6 μm/pixel. A flat-panel sensor (C7942CK-12; Hamamatsu Photonics K. K.) was used for XRD measurements.

Schematic diagram of the optic systems for density measurement using X-ray absorption image and XRD spectra at (a) the AR-NE1A beamline of Photon Factory–advanced ring and (b) the BL22XU beamline of the SPring-8 synchrotron radiation facility.
The high-pressure and high-temperature experiments were conducted in an externally heated DAC (Fig. 3). The two heater cartridges were inserted in the DAC (Fig. 3). This configuration can heat only around the sample chamber. The heater cartridge consists of Pt87Rh13 resistance wire coils with a diameter of 0.30 mm and zirconia insulators (shown as “g” and “h” in Fig. 3). To prevent the oxidation of the heater wire and the graphitization of the diamonds during heating, Ar gas was flowed around the DAC. The DAC was surrounded by the cylindrical pyrophyllite insulator in the laver-arm frame (“k” in Fig. 3). The frame was water-cooled. Temperatures were monitored by a K-type thermocouple contacted to the rear of the diamond anvil (“i” in Fig. 3). The errors of the temperatures were derived from the temperature fluctuation during the X-ray absorption measurements.
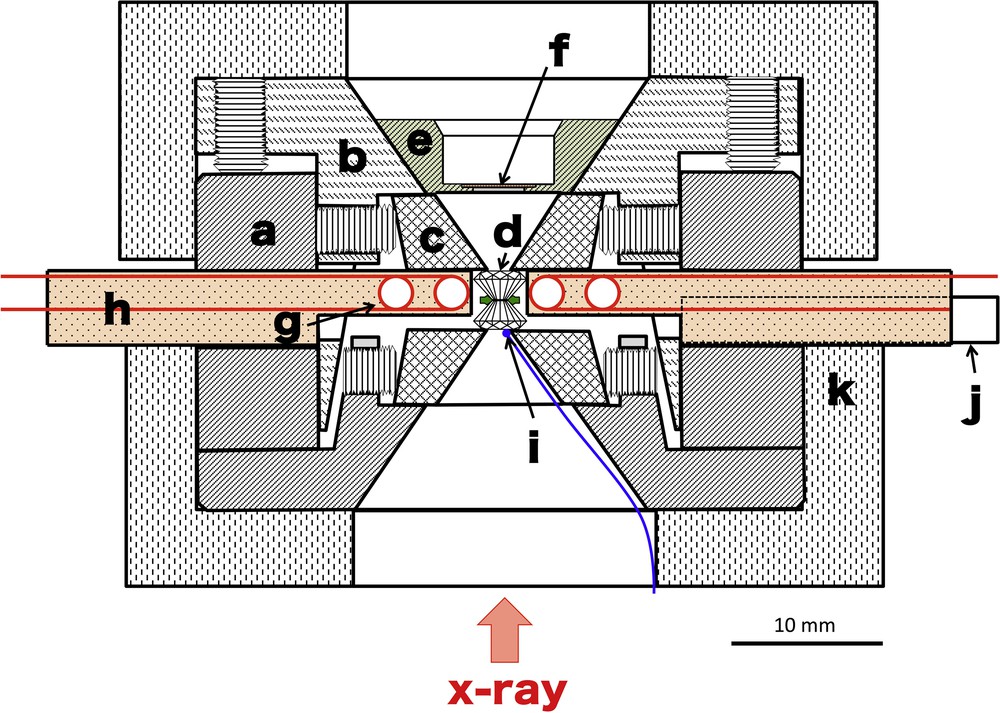
Schematic drawing of the externally heated diamond anvil cell: a: cylinder; b: piston; c: silicon nitride seat; d: diamond anvil; e: scintillator holder; f: YAG:Ce scintillator; g: Pt87Rh13 resistance wire coils; h: zirconia insulator; i: K-type thermocouple; j: alumina tube for Ar gas flow, and k: pyrophyllite thermal insulator.
The sample density was measured using the X-ray absorption method combined with the X-ray absorption imaging technique (Chen et al., 2005; Terasaki et al., 2010). The relationship between the intensities of the transmitted X-rays and the density of the material can be described by the Beer–Lambert law, as follows:
| (1) |
where I0 and I denote the intensities of the incident and transmitted X-rays, respectively, and μ, ρ, and t represent the mass absorption coefficient, density, and thickness in the X-rays’ direction, respectively. The subscripts “s” and “dia” indicate the sample and diamond anvils, respectively. In this study, the transmitted X-ray intensities of the In sample and the density references (NaCl, Fe, KBr, and Re) were measured following the method of Shen et al. (2002a, b) and Sato and Funamori (2008). If the densities of NaCl and Fe are used as references, the transmitted X-ray intensities of the samples and references can be expressed as follows:
| (2) |
| (3) |
| (4) |
Assuming that, within the sample chamber, the term I0 exp(−μdiaρdiatdia) is constant, and that the thicknesses of the sample and references are identical (i.e. ts = tIn = tNaCl = tFe), the density of In is expressed by combining Eqs. (2)–(4):
| (5) |
The rom, IFe, and rom were obtained from X-ray absorption images. The X-ray absorption image of In is shown in Fig. 4. The variation of the X-ray absorption intensity in Fig. 4 was derived from the intensity variation of the incident X-rays. Thus, a flat top region of the image (rectangle area in Fig. 4) was used to obtain I. The obtained luminance value of the image reflects the intensity of the transmitted X-rays through the sample and the diamond anvil. The values of ρFe and ρNaCl were obtained from the XRD spectra. Those of μFe and μNaCl were obtained from the online database of the National Institute of Standards and Technology (Berger et al., 2010). The value of ρIn was obtained from the density (from XRD) and its X-ray absorption image using Eq. (1). The obtained mass absorption coefficient corresponds to the apparent value that contains the influence of X-ray scattering from the DAC. The errors in ρIn from X-ray absorption imaging are mainly derived from the spatial distributions of IIn, IFe, and INaCl in the analyzed area (Fig. 4b), which correspond typically to spatial dispersions of 0.9%. Other sources of density error are errors of ρFe and ρNaCl determined from the XRD spectra, which are less than 0.1% (except for the ρhcp–Fe error of 1.2%). These errors correspond to that of the ρImaging of In (0.05–0.14 g/cm3, i.e. 0.6–2.0%), as listed in Table 1.
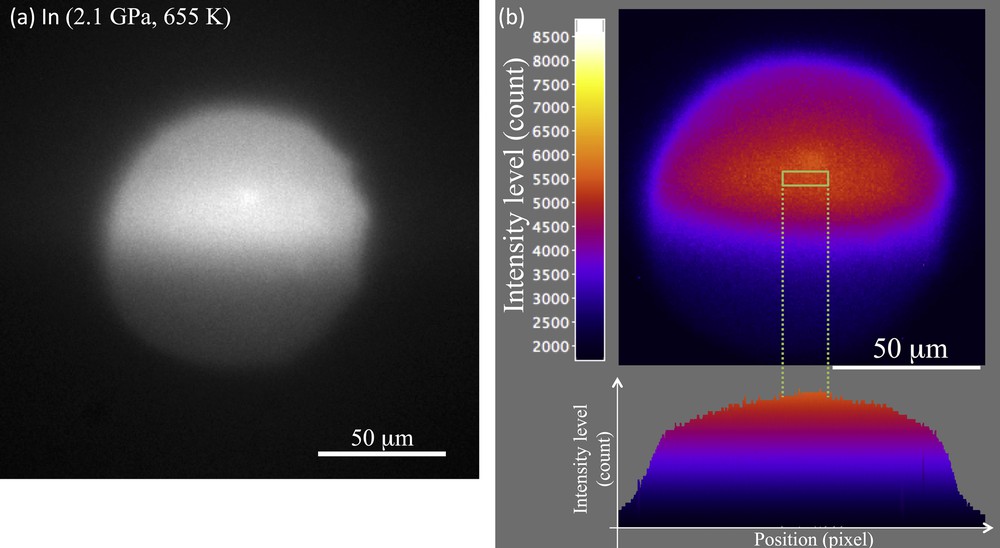
X-ray absorption image at 2.1 GPa and 655 K; a: X-ray absorption image of In. The exposure time of the image was 6 s; b: the color contour of the luminance distribution of the image (a). The rectangle region indicates the analyzed area of 8 × 26 pixels, which corresponds to 4.7 × 26 μm. The spatial dispersion of the incident X-ray intensity is only 0.9% in the area.
Experimental conditions and results.
| Pressurea (GPa) |
Temperature (K) |
ρdiffraction (g/cm3) |
ρimaging (g/cm3) |
Phase of In | References | |
| First run | 5.34 (6) | 297.3 (1) | 7.992 (10) | Solid | NaCl | |
| 5.29 (5) | 342.6 (22) | 8.083 (23) | 8.08 (9) | Solid | NaCl | |
| 5.37 (5) | 395 (10) | 8.08 (5) | 8.03 (9) | Solid | NaCl | |
| 5.45 (5) | 303.5 (21) | 8.108 (13) | Solid | NaCl | ||
| Second run | 5.79 (6) | 293.7 (1) | 8.118 (8) | Solid | NaCl | |
| 5.90 (6) | 338.9 (23) | 8.111 (5) | Solid | NaCl | ||
| 6.14 (6) | 393 (4) | 8.101 (5) | 7.95 (5) | Solid | NaCl | |
| 5.96 (7) | 297.3 (4) | 8.119 (4) | Solid | NaCl | ||
| Third run | 3.6 (6) | 297.5 (11) | 7.849 (4) | Solid | NaCl, Fe(α) | |
| 3.4 (7) | 445 (4) | 7.614 (4) | Solid | NaCl, Fe(α) | ||
| 2.1 (9) | 655 (9) | 7.16 (14) | Liquid | NaCl, Fe(α) | ||
| Forth run | 11.02 (6) | 298.2 (–) | 8.692 (5) | Solid | NaCl, Fe(α,ε) | |
| 9.2 (4) | 426.9 (11) | 8.502 (11) | Solid | NaCl, Fe(α,ε) | ||
| 6.7 (3) | 635.6 (21) | 7.91 (7) | Liquid | NaCl, Fe(α) | ||
| 5.1 (3) | 719.2 (20) | 7.80 (14) | Liquid | NaCl, Fe(α) | ||
| Fifth run | 8.4 (5) | 296.2 (1) | 8.335 (5) | Solid | NaCl, Fe(α) | |
| 8.2 (6) | 405.4 (4) | 8.266 (9) | Solid | NaCl, Fe(α) | ||
| 8.7 (4) | 506.2 (7) | 8.219 (5) | Solid | NaCl, Fe(α) | ||
| 9.0 (2) | 507.0 (6) | 8.250 (7) | Solid | NaCl, Fe(α) | ||
| 9.78 (10) | 506.4 (5) | 8.353 (9) | Solid | NaCl, Fe(α) | ||
| 10.75 (2) | 504.7 (5) | 8.451 (16) | Solid | NaCl, Fe(α) | ||
| 11.5 (4) | 504.9 (5) | 8.569 (10) | Solid | NaCl, Fe(α,ε) | ||
| 15.7(14) | 503.4 (7) | 8.765 (10) | 8.75 (6) | Solid | NaCl, Fe(ε) | |
| 18.6 (10) | 403.1 (3) | 8.951 (12) | 8.91 (9) | Solid | NaCl, Fe(ε) | |
| Sixth run | 4.9 (4) | 295.8 (1) | 8.011 (7) | Solid | NaCl, Fe(α) | |
| 5.1 (3) | 403.3 (4) | 7.992 (6) | Solid | NaCl, Fe(α) | ||
| 5.0 (4) | 502.5 (10) | 7.9330 (23) | Solid | NaCl, Fe(α) | ||
| Seventh run | 5.0 (6) | 297.4 (1) | 8.089 (10) | Solid | NaCl, Fe(α) | |
| 7.4 (5) | 402.0 (5) | 8.287 (14) | Solid | NaCl, Fe(α) | ||
| 8.7 (10) | 404.4 (2) | 8.386 (9) | Solid | NaCl, Fe(α) | ||
| 10.0 (9) | 400.2 (2) | 8.504 (17) | Solid | NaCl, Fe(α) | ||
| 12.5 (15) | 399.8 (2) | 8.631 (8) | Solid | NaCl, Fe(ε) | ||
| Eighth run | 3.19 (18) | 297.7 (–) | 7.761 (23) | Solid | NaCl, Fe(α) | |
| 3.19 (18) | 404.9 (10) | 7.734 (15) | 7.58 (7) | Solid | NaCl, Fe(α) | |
| 3.19 (18) | 511.5 (3) | 7.706 (18) | Solid | NaCl, Fe(α) | ||
| 3.19 (18) | 569 (13) | 7.686 (10) | 7.57 (10) | Solid/liquid | NaCl, Fe(α) |
a In the first to the seventh run, the pressure of the In sample was determined by collecting the XRD data of reference (NaCl, KBr and Fe) combined with their EOS (for NaCl: Matsui et al., 2012; for KBr: Dewaele et al., 2012; for α(bcc)-Fe: Zhang & Guyot, 1999; for ɛ(hcp)-Fe: Uchida et al., 2001). In the eighth run, the pressure of the sample was determined by the density of In at 300 K and the EOS for solid In (Shen et al., 2002a).
3 Results and discussion
Eight sets of density measurements were performed and the density of In was measured up to 18.6 GPa and 719.2 K (Fig. 5). The experimental conditions and the obtained results are summarized in Table 1. The first to sixth runs were conducted at the AR-NE1A beamline, and the other runs were conducted at the BL22XU beamline. The experiments were basically first taken to the target pressure and then heated (detailed sequences are shown in Fig. 5 by arrows). In most of the runs, except the third and the fourth, the DAC was set in the lever-arm frame. In these runs, no pressure drop of the sample during heating was observed. We collected X-ray absorption images and XRD spectra of the sample and the references in 100 K steps under a fixed load.
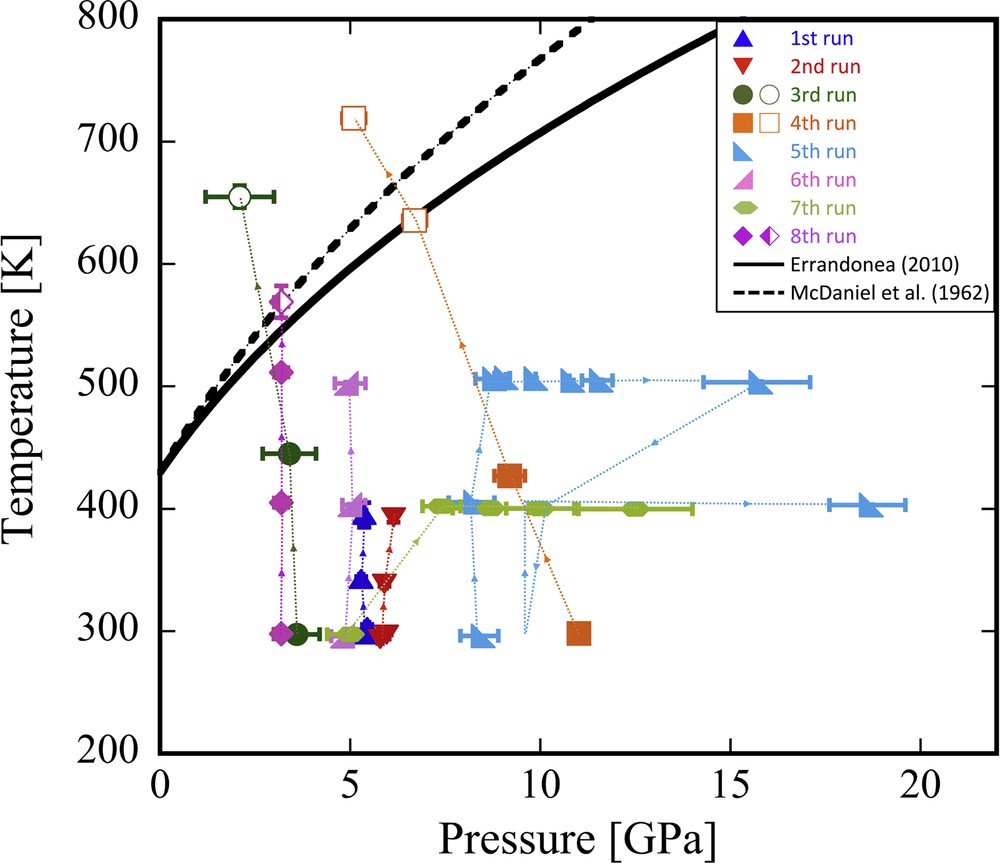
The experimental pressure–temperature condition. The solid and open diamonds denote the solid and liquid states, respectively. The half-filled diamond denotes the condition that In melted during measurement. The solid and dotted curves show the melting curves of In from Errandonea (2010) and McDaniel et al. (1962), respectively. The experimental sequences of each run were indicated by arrows. The melting of In was confirmed based on the appearance of a diffuse scattering signal. The observed melting temperature at 6.7 GPa was consistent with the melting curve of In reported by Errandonea (2010).
The density of solid In plotted as a function of pressure at various temperature conditions is shown in Fig. 6. The errors in measured density from X-ray absorption imaging range from 0.6 to 2.0%. The accuracy of the present X-ray absorption imaging method is almost the same as that of a previously reported X-ray absorption method using DAC−Δρ/ρ is 1.4% (Shen et al., 2002b) and about 2.9% (Petitgirard et al., 2015). The densities of In obtained from the X-ray absorption imaging method (ρimage) show a good agreement with those obtained from XRD (ρdiff) within a difference of 2.0% (Fig. 7). Therefore, the present X-ray absorption imaging method can measure the sample's density in this accuracy. In order to reduce the density error, enlargement of the analyzed area for X-ray absorption intensity and/or correction of intensity distribution of incident X-ray are required in future measurements.
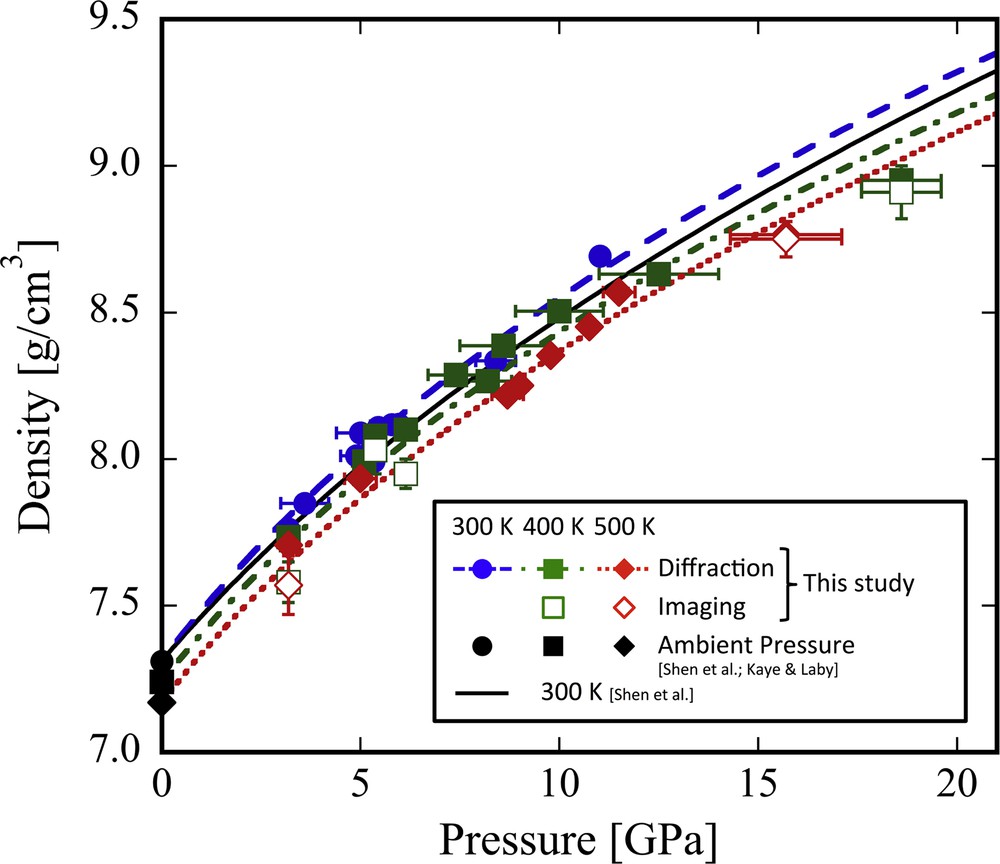
Effect of pressure on the density of solid In. The solid and open symbols denote the densities of In obtained from XRD spectra and X-ray absorption images, respectively. The values of ambient pressure (black solid symbols) are from previous data (Kaye & Laby, 2010; Shen et al., 2002a). The black solid curve denotes the compression of In at 300 K reported by Shen et al. (2002a). The blue dashed curve, green dashed-dotted and red dotted curves denote the compression curves of In at 300 K, 400 K, and 500 K, respectively. Each compression curve shows the fitting line except for the one around 3.19 GPa using the third-order Birch–Murnaghan EOS for K′ = 6.

Difference in density of In between the X-ray absorption imaging and XRD methods. The numbers denote the experimental temperatures.
The density of In increases with pressure and decreases with increasing temperature. To obtain the isothermal bulk modulus of In at high temperature, the obtained densities of In were fitted with the third-order Birch–Murnaghan equation of state (EOS), as shown below:
| (6) |
where ρ0(T) and K0T(T) denote the density and the isothermal bulk modulus at ambient pressure and at a certain temperature (T), respectively. The value of ρ0(T) was calculated from the following Eqs. (7) and (8):
| (7) |
| (8) |
where α0 represents the thermal expansion coefficient at ambient pressure [α0 = 9.63 × 10⁻⁵ K−1 (Kaye & Laby, 2010)], and T0 is the reference temperature (300 K). The value of ρ0 at T0 is reported as 7.31 g/cm3 (Shen et al., 2002a). Thermal expansion coefficients (α) of In were obtained from the present data with Eqs. (7) and (8). The obtained value of α varies from (6.4 ± 0.4) K−1 to (6.9 ± 0.6) K−1 in the range of pressure from around 5.0 to 11.4 GPa. Thus, the effect of pressure on the value of α of In was small in the present pressure conditions.
The isothermal compression curves of In at 300, 400, and 500 K are also shown in Fig. 6. The obtained values of K0T at 300 K to 500 K are listed in Table 2. The curve at 300 K shows a similar with that reported by Shen et al. (2002a). Because the K′ (= dK/dP) is difficult to constrain in this study due to the limited number of density data, we used the possible K′ range of 4 to 6. The obtained K0, 500K varies from 48.0 ± 1.1 GPa (with K′ = 4) to 40.9 ± 0.8 GPa (with K′ = 6). Although the uncertainty in K0T is relatively large, there is no large difference between the K0, 500K of this study and K0, 300K = 45.7 ± 0.6 GPa of Shen et al. (2002a) (with K′ = 5.2). Instead of the third B-M EOS, the Vinet universal EOS (Vinet et al., 1987) was also used to fit the present data as listed in Table 2. The obtained K0T from the Vinet universal EOS shows a good agreement with that from the B–M EOS. This suggests that K0T determined in this study are well constrained. In the eighth run, the pressures of the sample and the references tend to be different probably due to difference in the filling rate in each sample hole at low pressure. Thus, the data obtained in the eighth run were excluded in the EOS fitting to estimate K0T. When we estimate the pressure of the eighth run from the density of In with the EOS of Shen et al. (2002a), the melting point at this pressure (3.19 GPa and 569 K) was consistent with the reported melting curve (Errandonea, 2010; McDaniel et al., 1962).
Isothermal bulk moduli of solid In obtained from third-order Birch-Murnaghan EOS and Vinet universal EOS.
| T0 (K) | ρ0 (g/cm3)a | K′b | K0, T0 (GPa) | K0, T0 (GPa) | Reference |
| (3rd B-M EOS) | (Vinet universal EOS) | ||||
| 300 | 7.31 | 4 | 45.4 (9) | 45.6 (9) | This study |
| 5 | 42.5 (8) | 42.8 (8) | |||
| 6 | 40.0 (8) | 40.2 (8) | |||
| 300 | 7.31 | 5.2 (2) | 45.7 (6) | Shen et al. (2002a) | |
| 400 | 7.24 | 4 | 48.6 (20) | 49.0 (21) | This study |
| 5 | 44.8 (16) | 45.3 (17) | |||
| 6 | 41.5 (13) | 41.8 (13) | |||
| 500 | 7.17 | 4 | 48.0 (11) | 48.4 (12) | This study |
| 5 | 44.2 (9) | 44.7 (10) | |||
| 6 | 40.9 (8) | 41.2 (8) |
a The values of the ambient pressure were calculated from references (Shen et al., 2002a; Kaye & Laby, 2010).
b The K′ in this study was treated as a fixed parameter for the fitting calculation.
As stated above, it was shown that the density of a solid material can be accurately measured by the X-ray absorption imaging method. This method can be applied to density measurements of non-crystalline materials. The obtained density of liquid In as a function of pressure is shown in Fig. 8. The obtained density increases approximately 10% with pressure from 2.1 GPa to 6.7 GPa at around 645 K. The compression curve of liquid In approaches that of solid In at higher pressures. The densities of liquid In obtained in this study is in good agreement with those calculated using the elastic parameters reported by Komabayashi et al. (2015). However, the pressure dependence on the density of this study is smaller than that at 710 K reported by Shen et al. (2002a, b). The result of this study implies that a reversal of the compression curves of solid and liquid In does not occur up to at least 6.7 GPa (Fig. 8). From a thermodynamic perspective, it is reported that the melting curve of In has a positive Clapeyron slope up to at least 12 GPa (Errandonea, 2010, see Fig. 5). This suggests that the volume of liquid In is larger than that of solid In, at least up to 12 GPa. Therefore, the liquid compression curve does not cross the solid one, as supported by the present results.
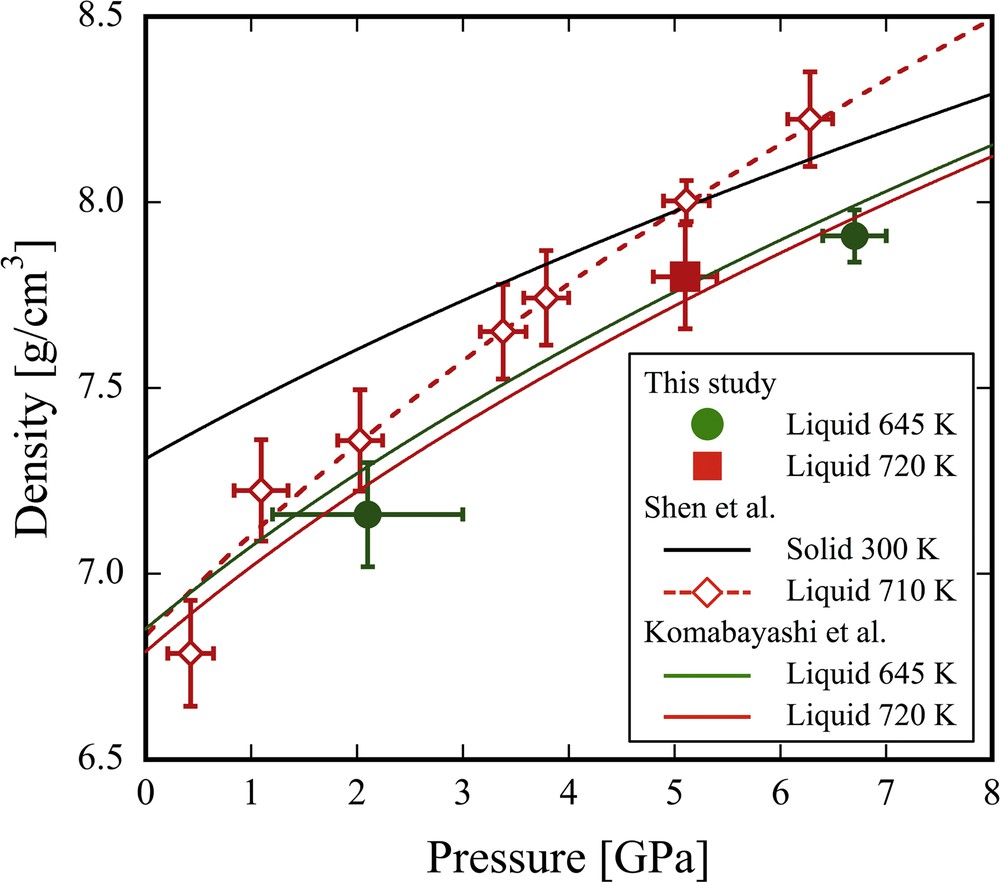
Densities of liquid In at high pressures. The solid symbols denote the densities of liquid In determined by X-ray absorption images in this study. The green and red curves are calculated compression data based on the EOS of liquid In (Komabayashi et al., 2015). The red open diamonds denote the reported density of liquid In at 710 K by Shen et al. (2002a, b). The black curve denotes the compression of solid In at 300 K reported by Shen et al. (2002a).
4 Conclusions
We developed an X-ray absorption imaging method that can measure a density at high pressure and temperature in a short time, regardless of the crystalline state of the sample. The densities of solid and liquid In were measured in the pressure–temperature range of 3.2–18.6 GPa and 294–719 K. The obtained density using an X-ray absorption imaging method were in good agreement with the density measured by XRD within a difference of 2%. The isothermal bulk moduli of solid In were obtained to be 48.6 ± 2.0–41.5 ± 1.3 GPa at 400 K and 48.0 ± 1.1–40.9 ± 0.8 GPa at 500 K, assuming K′ = 4 to 6, respectively. The density of liquid In increases by about 10% with pressure (in the range 2.1–6.7 GPa) at around 645 K and it is consistent with those calculated from previously reported elastic parameters. These results show that a reversal between solid and liquid In density does not occur up to at least 6.7 GPa.
The X-ray absorption imaging method combined with externally heated DAC enables us to determine densities of both solids and liquids precisely in wide pressure–temperature ranges. This method is also applicable for density measurements under extreme conditions targeted to planetary interiors.
Acknowledgements
The authors acknowledge S. Urakawa for the constructive suggestions and technical assistance at the SPring-8 synchrotron radiation facility, and also appreciate S. Hiromi and Y. Okawa's assistance in density measurement at Photon Factory-Advanced Ring. This work was partly supported by a Grant-in-Aid for JSPS Fellows to Y.T. (No. 26 1795) and also by Grants-in-Aid for scientific research from the Ministry of Education, Culture, Science, and Sport and Technology of the Japanese Government to H.T. (No. 26247089). The experiments have been performed under a contract of the Photon Factory Program Advisory Committee (proposal numbers: 2014G113, 2016G177) and of the SPring-8 facility (proposal numbers: 2016A3787, 2017B3782). A part of this work was performed under the Shared Use Program of JAEA and QST Facilities (proposal numbers: 2016A-E22, 2017B-H11) supported by JAEA, QST Advanced Characterization Nanotechnology Platform as a program of the “Nanotechnology Platform” of MEXT (proposal Nos.: A-15-AE-0040, A-17-QS-0026).