

1 Introduction
The extent of chemical and physical interaction between the metallic core and the silicate mantle is poorly understood. The core–mantle boundary (CMB) region is considered a region where direct physicochemical interactions between core and mantle may occur. Seismologically unique areas immediately above the CMB have been identified as the D′′ layer (e.g., Pertier, 2007), the large low shear velocity provinces (LLSVPs) (e.g., Dziewonski, 1984; Garnero and McNamara, 2008) and the ultra-low velocity zones (ULVZ) (e.g., McNamara et al., 2010; Williams and Garnero, 1996). Some seismological observations suggest that the LLSVPs and ULVZs correspond to some chemical heterogeneity at the base of the lower mantle.
Perturbations in the Earth's rotation rate at decadal time periods require the existence of dissipative coupling at the CMB. Theoretical modeling indicates that a core–mantle boundary coupling torque of 1017 Nm requires the presence of a thin conductive layer with a conductance of 108 S or greater (Buffett, 1992; Holme, 1998). Several models have been proposed to explain anomalously high electrical conductance in some regions above the CMB:
- • a capillary rise of iron-rich melt into the mantle (Poirier and Le Mouël, 1992);
- • a suction mechanism for iron entrainment into the mantle (Kanda and Stevenson, 2006);
- • the presence of post-perovskite or extremely Fe-rich (Mg,Fe)O with high electrical conductivity (Ohta et al., 2008, 2014);
- • penetration of molten iron into the mantle by morphological instability (Otsuka and Karato, 2012).
High electrical conductivity of post-perovskite in the D′′ layer is a plausible explanation of the regional electrical conductivity variations observed by geomagnetic jerks due to sudden changes in Earth's magnetic field (Ohta et al., 2008). Although this interpretation does not require core–mantle chemical interaction, recent tungsten isotope (μ182W) data obtained from modern oceanic island basalts (OIB) yield negative values as does the outer core (Mundl et al., 2017).
The length scale of capillary mechanism-inducing infiltration of core materials into the base of the mantle was estimated to be 20 m or less (Poirier and Le Mouël, 1992), because metallic materials from the outer core have higher density than silicates and oxides. Alternatively, iron-rich core materials may infiltrate into the mantle along a pressure gradient caused by the dynamic topography at the CMB (Kanda and Stevenson, 2006). A suction mechanism to maintain a porous medium on the mantle side of the CMB requires that the interconnected pore-space be partly or entirely filled with liquid iron up to a thickness of 1 km.
Otsuka and Karato (2012) reported an experimental observation on the penetration of iron-rich metallic liquid blobs into a single crystal of (Mg,Fe)O by morphological instability and the penetration depth of iron-rich blobs was estimated to be 50–100 km, which is considerably larger than that of other mechanisms. This mechanism presents suitable physical processes for explaining the high conductance predicted in some regions immediately above the CMB. The high abundance of highly siderophile elements in the bulk silicate Earth can also be produced by this process. However, such experiments have been performed only on (Mg,Fe)O, which is a stable phase at pressures lower than the lower-mantle conditions. To understand the dynamics and chemical processes of the lower mantle, consisting mainly of silicate minerals, it is necessary to investigate whether molten Fe alloy can penetrate bridgmanite-dominant lithology under lower-mantle conditions.
In this study, high-pressure experiments on the penetration of molten iron alloy liquid into lower-mantle phases were performed in the stability field of the major lower-mantle phase (bridgmanite) using a large volume press. The influence of light elements in Fe alloy on its penetration into the silicate phases is also investigated for carbon and sulfur. This paper discusses the validity of the penetration process, based on the experimental results, to form a high-conductance layer immediately above the CMB and to modify the chemical composition of the bulk silicate Earth.
2 Experimental method
Starting materials for the penetration experiments were sintered aggregates composed of lower-mantle phases with equigranular microstructure. Three types of lower mantle phases, (Mg,Fe)O, bridgmanite and post-spinel, were prepared. Sintered aggregates of (Mg,Fe)O with different amounts of iron (XFe = 0.2, 0.5) were prepared from mixtures of sponge iron and reagent-grade magnesium powder following the method of Yoshino et al. (2011). The resultant mixtures were baked at 1673 K for a few hours using a CO2 and H2 gas mixture for controlled oxygen fugacity just above the iron wüstite (IW) buffer. The baked powder was loaded into a Mo capsule and sintered at 1 GPa and 1273 K for 1 h in a piston cylinder apparatus. The samples were confirmed to be (Mg,Fe)O by a micro-focused X-ray diffractometry (XRD) and compositional homogeneity was confirmed by electron microprobe analysis. Chemical analyses of recovered samples show that the molar Fe/(Mg + Fe) ratios were 0.2 and 0.5 for each sample. Sintered (Mg,Fe)O aggregates exhibited an equigranular (∼ 40 μm) structure, which suggests the establishment of a textural equilibrium.
Starting materials for bridgmanite and post-spinel aggregates were synthetic Fe- and Al-bearing enstatite powder (Al2O3 ∼ 4 wt%, XFe = 0.1) and San Carlos olivine powder (XFe = 0.1), respectively. The cell assembly for the high-pressure experiment consisted of an octahedron with 14-mm edge lengths. A LaCrO3 sleeve surrounded by ZrO2 thermal insulators was used as the heater. The powdered mixture was packed in a Pt capsule, which was electrically insulated from the furnace by an MgO spacer. The temperature was monitored using a W97Re3/W75Re25 thermocouple. Tungsten carbide cubes with 46-mm edge lengths were used as second-stage anvils to obtain a large sample volume. The truncation edge length was 6 mm. Synthesis experiments were conducted at 1873 K and 25 GPa for various annealing times (1 to 5 h) in a Kawai-type multi-anvil apparatus. Recovered samples were cored into cylinders with a diameter of 1 mm and the cylindrical core was cut into slices for the penetration experiments. The grain size of bridgmanite and (Mg,Fe)O in post-spinel was less than 3 μm, while two Fe, Al-bearing bridgmanite samples showed distinctly larger grains. The grain size of samples synthesized in Fe capsules was smaller (1 μm) than samples synthesized in Pt capsules (∼ 5 μm).
Three types of Fe alloy were used as the penetration phase: pure Fe; Fe–C; and Fe–S. Pure Fe samples were prepared from a 1-mm-diameter Fe rod. Fe–C samples were synthesized from a mixture of iron and graphite powder (> 99.99% purity) with an atomic ratio of 85:15, which is close to the eutectic composition in the Fe–Fe3C join at pressures up to 20 GPa (Lord et al., 2009; Nakajima et al., 2009). Two kinds of Fe–S samples were synthesized from a mixture of iron and FeS powder (> 99.99% purity). Atomic ratios (Fe:S) were set to 8:2 and 7:3, which are close to the eutectic composition of the Fe–S system at 21 GPa (Fei et al., 2000). The Fe–C and Fe–S mixtures were then packed in an MgO capsule and equilibrated at 1 GPa and 1373 K using an end-loaded piston cylinder apparatus. Sintered samples were recovered at ambient conditions and phases were analyzed using XRD and electronic microprobe analyses. Recovered samples in the Fe–C system were confirmed to be polycrystalline phases composed of Fe and Fe3C with an orthorhombic structure (space group: Pnma). For the Fe–S system, a partially molten texture composed of large Fe crystals surrounded by a fine Fe and FeS mixture was observed. The fine Fe and FeS mixture is a quench product from an Fe–S partial melt above the eutectic temperature.
Penetration experiments were performed using a Kawai-type multi-anvil apparatus. Tungsten carbide cubes with 4-mm truncations were used as second-stage anvils. The octahedral edge-length of the Cr2O3-doped MgO pressure medium was 10 mm. A cross-section of the cell assembly is shown in Fig. 1. In all experiments, disk-shaped Fe or Fe alloy aggregates approximately 300 μm in thickness and 1 mm in diameter were sandwiched by 300-μm-thick aggregates of sintered (Mg,Fe)O and bridgmanite or post-spinel. The layered sample assembly was directly inserted into a polycrystalline MgO sleeve. The cylindrical axis of the sample capsule was vertically aligned with gravity and the sintered (Mg,Fe)O aggregate was always set in the gravitationally upper position. The temperature was monitored with a W97Re3-W75Re25 thermocouple with the junction placed in contact with one end of the sample capsule. Ceramic parts of the cell assemblies were fired at 1273 K before assemblage. In each experiment, starting materials were compressed by increasing the load at room temperature. The temperature was subsequently increased by applying a current across the furnace at a rate of more than 200 K/min up to the target temperature to minimize possible chemical reactions between (Mg,Fe)O and metallic iron during heating. Annealing durations ranging from 10 min to 4 h were adjusted by the rate of melt penetration into the (Mg,Fe)O aggregate. The samples were then quenched by shutting off the heating power and subsequently decompressed at room temperature. All experiments were conducted at 25 GPa and annealing temperatures ranged from 1873 to 2573 K, depending on the melting temperature of the Fe alloy. Experimental conditions and results are summarized in Table 1.
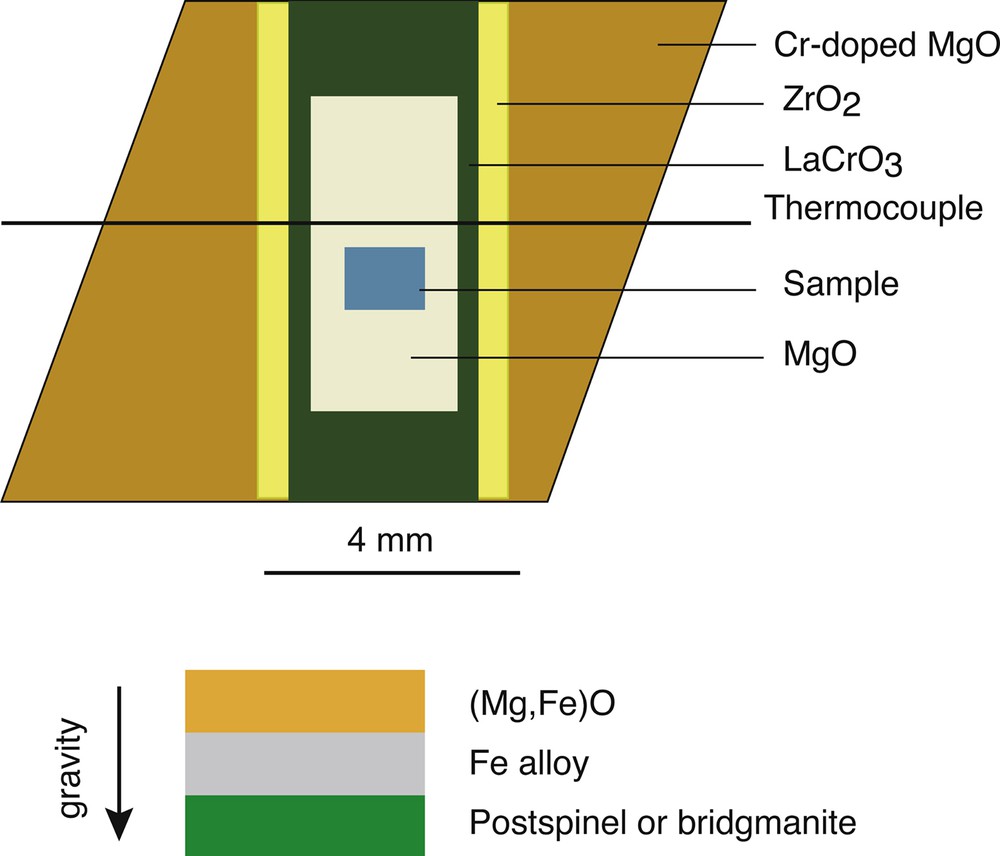
Schematic drawing of the cell assembly for a Kawai-type multi-anvil apparatus.
Summary of runs.
| Run # | T a | t b | Silicatec | Alloy | Oxide | d MSI d | d CR e | λf | Remarksg |
| (K) | (h) | Mg# | (μm) | (μm) | (μm) | ||||
| Fe | |||||||||
| 1K2699 | 2573 | 0.16 | Brg | Fe | 50 | 19 | 180 | 5 | |
| 1K2702 | 2573 | 1 | PS | Fe | 50 | 55 | 350 | 6 | |
| Fe-S | |||||||||
| 1K2639 | 1873 | 0.25 | PS | Fe8S2 | 80 | 8 | 13 | 8 | dp |
| 1K2646 | 1873 | 2 | PS | Fe8S2 | 50 | 12 | 85 | 7 | FP layer, dp |
| 5K2983 | 2173 | 0.5 | Brg | Fe8S2 | 50 | 6 | 62 | 5 | |
| 1K2645 | 2173 | 4 | PS | Fe8S2 | 50 | 18 | 173 | 5 | FP layer, dp |
| 1K2649 | > 2673 | Total melting | |||||||
| Fe-C | |||||||||
| 1K2635 | 2073 | 0.25 | Brg | Fe-C | 50 | 28 | 124 | 4 | FP layer, dp |
| 1K2638 | 2073 | 0.5 | Brg | Fe-C | 50 | 42 | 155 | 8 | |
| 1K2641 | 2173 | 1 | PS | Fe-C | 80 | 3 | 140 | 4 | FP layer, dp |
| 1K2644 | 2273 | 0.25 | PS | Fe-C | 80 | 2 | 180 | 5 | FP layer, dp |
| 1K2642 | 2373 | 0.5 | PS | Fe-C | 80 | n.d. | n.d. | n.d. | LaCrO3 contamination |
a Italicized values show temperatures estimated using a power–temperature calibration.
b Annealing duration defined as the time during which the temperature was held at the target temperature.
c Brg: bridgmanite; PS: post-spinel.
d Penetration distance for the Mullins–Sekerka instability.
e Penetration distance for the capillarity phenomenon.
f Characteristic wavelength at which the instability grows.
g (Mg,Fe)O layer developed at the interface between the Fe alloy and the post-spinel or bridgmanite phase (FP layer); small Fe particles produced by disproportionation reaction were observed in the post-spinel or bridgmanite phases (dp).
Recovered samples were polished normal to the interface to determine the penetration distance of Fe alloy by scanning electron microscopy. Element maps for Fe, Mg and O were obtained using an electron microprobe analyzer, which was performed under operating conditions of 15 kV, 12 nA, and a point beam with a 1-μm step interval.
3 Experimental results
Figs. 2 and 3 show back-scattered electron images and Fe and O element maps showing penetration textures of each molten Fe alloy system, respectively. All Fe-alloy melts were found to penetrate the (Mg,Fe)O (XFe = 0.5, 0.2), whereas Fe-rich melt penetration into bridgmanite and post-spinel was not observed from the same run product. The oxygen element maps show that significant amounts of oxygen had dissolved into the molten Fe alloy.
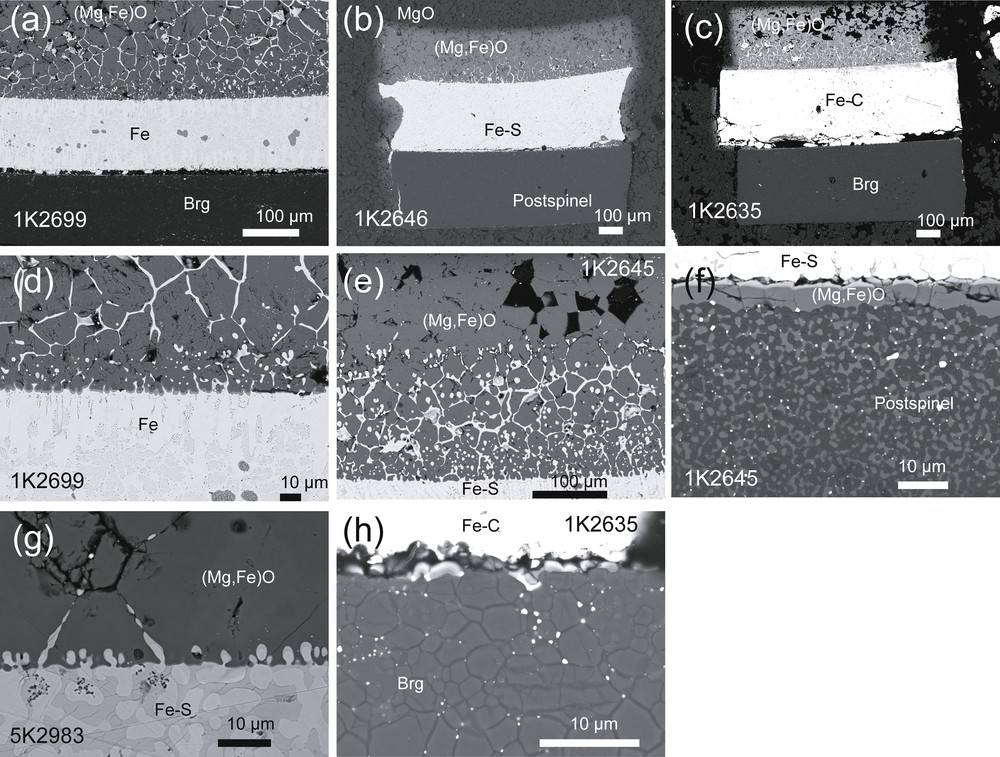
Backscattered electron images of experimental run products. Overviews of run products showing penetration of Fe alloy into (Mg,Fe)O aggregates and no penetration of Fe alloy into silicates: (a) (Mg0.50Fe0.50)O–Fe–bridgmanite set (1K2699); (b) (Mg0.50Fe0.50)O–Fe80S20–postspinel set (1K2646); (c) (Mg0.50Fe0.50)O-Fe94C6-bridgmanite set (1K2635). Close-up views near the interface between (d) (Mg0.50Fe0.50)O and Fe80S20 (1K2699), (e) (Mg0.50Fe0.50)O and Fe80S20 (1K2645), (f) postspinel and Fe80S20 (1K2645), (g) (Mg0.50Fe0.50)O and Fe80S20 (5K2983), (h) Fe94C6 and bridgmanite (1K2635).
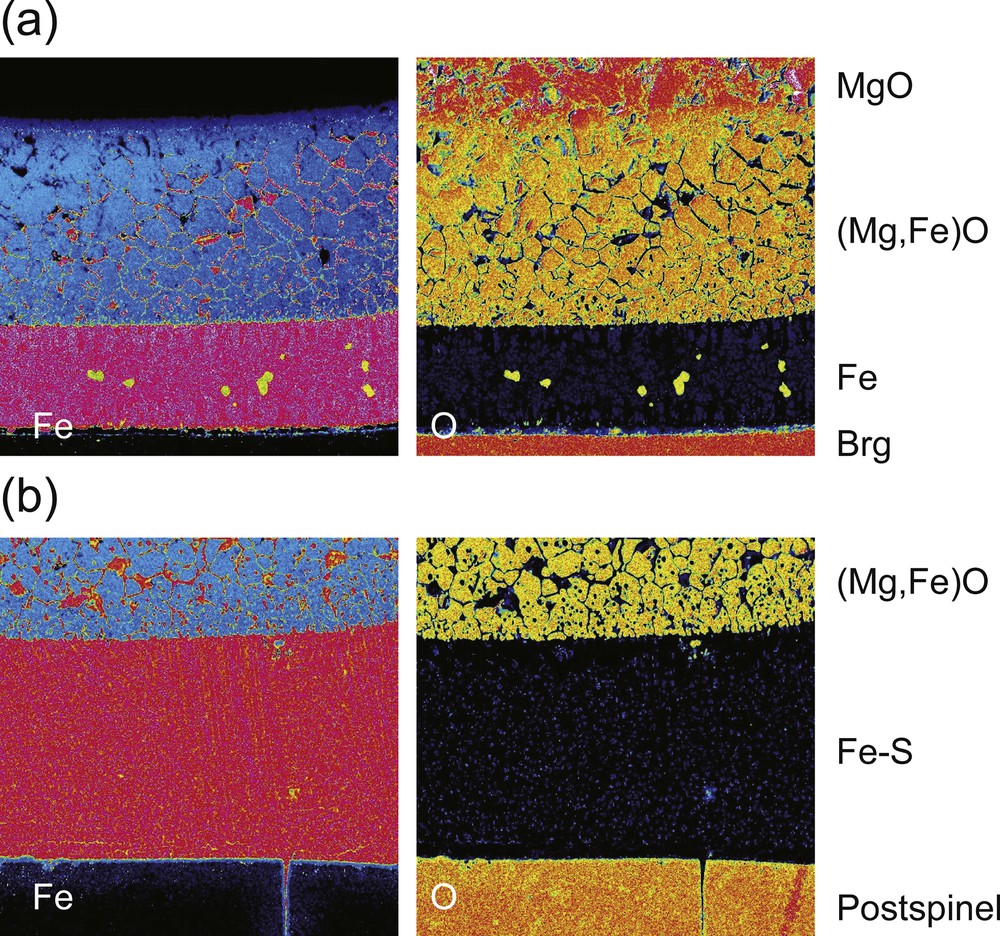
Distribution of Fe and O in the annealed sets consisting of molten Fe alloy, silicates, and solid (Mg,Fe)O. Concentration maps of Fe (left panel) and O (right panel) in (a) sample 1K2699 annealed at 2,573 K for 10 min and (b) sample 1K2645 annealed at 2173 K for 4 h.
The microstructure of the (Mg,Fe)O aggregates reveals that the penetration areas consist of two different morphologies. One significant morphology is the penetration of Fe-rich alloy through the grain boundaries of (Mg,Fe)O, which is controlled by the capillarity phenomenon. For XFe = 0.5, all grain boundaries were covered with Fe-alloy melt as shown in Fig. 2a–e, g, suggesting very low interfacial energy between the Fe alloy and (Mg,Fe)O. The layer thickness along grain boundaries is almost constant (∼ 1 μm) regardless of the distance from the interface. The infiltration front formed by grain boundary wetting is nearly parallel to the interface. The volume fraction of Fe-alloy melt in the (Mg,Fe)O aggregates is essentially constant and lower than 0.05. No significant grain coarsening of (Mg,Fe)O was observed, despite the much higher temperatures compared with synthesis conditions (1373 K). In all systems, element maps of oxygen showed that the oxygen-rich portion appeared as an isolated or quench phase in the Fe-alloy layer (Figs. 3 and 4). The interface slightly moved in the direction of the Fe-rich melt. These observations suggest that precipitation of FeO component in the Fe-rich melt occurred in response to its dissolution along grain boundaries of the (Mg,Fe)O aggregates.

Distribution of Fe and O across the interface between molten Fe alloy and (Mg,Fe)O. Concentration maps of Fe (left panel) and O (right panel) in (a) sample 1K2699 annealed at 2573 K for 10 min, (b) sample 1K2638 annealed at 2073 K for 0.5 h and (c) sample 1K2645 annealed at 2173 K for 4 h. In the left panels, red and blue correspond to high and low Fe concentrations. In the right panels, yellow to green colors correspond to high O concentrations. The penetration front corresponds to the infiltration front of the molten Fe alloy by capillary force. The melt-rich layer (MRL) represents a region formed by transcrystalline migration of iron-rich liquid inclusions due to the Mullins–Sekerka instability. Thick lines are a scale bar corresponding to 50 μm.
Each interface between (Mg,Fe)O aggregate and molten iron alloy was serrated and the liquid metal penetrated (Mg,Fe)O crystals to form a metal-rich layer (MRL) containing many metal-rich blobs (Fig. 2d, e, g). This morphological feature is similar to that of iron blobs penetrating an (Mg,Fe)O single crystal observed by Otsuka and Karato (2012) and formed by Mullins--Sekerka (MS) instability (Mullins and Sekerka, 1964). Elongated fingers formed at the interface eventually pinch off to produce isolated melt blobs or inclusions. In the MRL, the characteristic wavelength of the interface morphology measured along the interface is approximately 5 μm, which is smaller than the average grain size (Fig. 2g). However, the infiltrated area of molten Fe alloy along (Mg,Fe)O grain boundaries was dominantly observed in positions beyond the thickness of the MRL. Even in areas further from the MRL, the elongated fingers occasionally occurred along grain boundaries extending in the opposite direction from the interface. In general, the MRL thickness is considerably shorter than the penetration distance through grain boundaries (Fig. 4).
Fig. 5 shows compositional line profiles measured in (Mg,Fe)O normal to the interface. The FeO content in the (Mg,Fe)O matrix gradually increases with the distance from the interface, which suggests that chemical equilibrium is established at the interface and that the infiltrated area far from the interface is out of equilibrium. Since FeO content in the starting (Mg,Fe)O is distinctly higher than the equilibrium FeO content at the interface, the dissolution of the FeO component in (Mg,Fe)O would continue until the FeO content in (Mg,Fe)O reaches the equilibrium value throughout the sample. This compositional profile is attributed to the degree of FeO dissolution in the (Mg,Fe)O aggregate. The FeO content also decreases toward the opposite side of the (Mg,Fe)O aggregates in contact with MgO by Fe–Mg interdiffusion, but its diffusion length is shorter than the infiltration distance by the capillarity phenomenon. Most of the samples retained the original composition along the infiltration front.
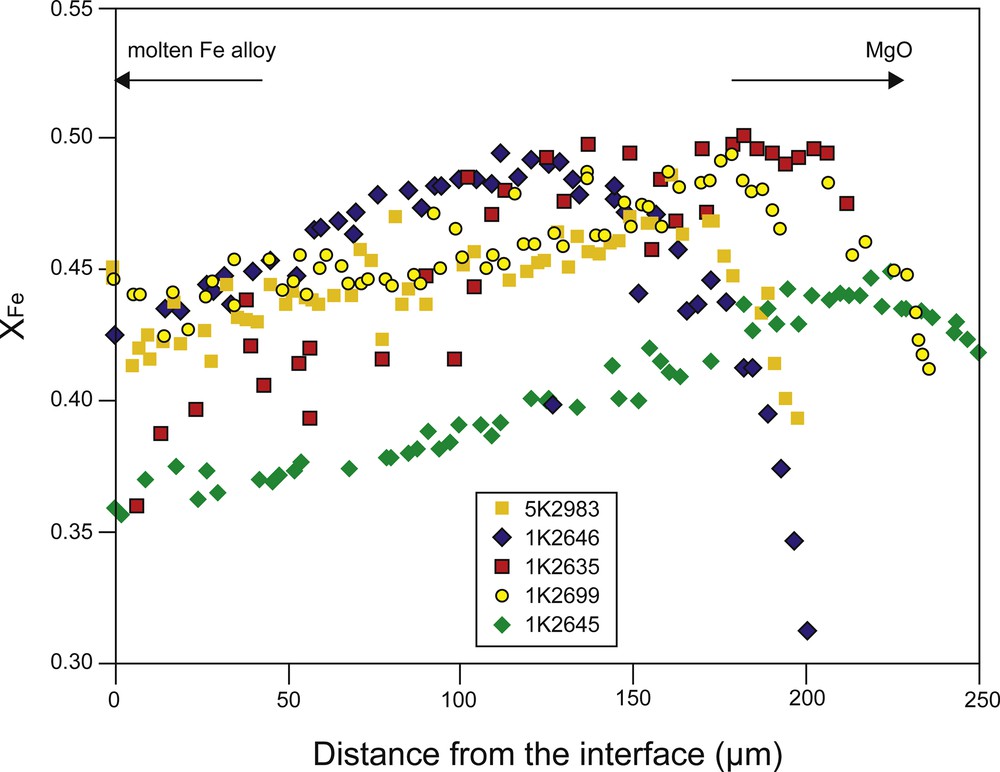
Iron content (XFe = Fe/(Fe + Mg)) in (Mg,Fe)O over the iron-rich liquid penetration region as a function of the distance from the solid–melt interface.
A series of infiltration experiments were performed under the same conditions, with different durations (Table 1). Fig. 6 shows the Fe-rich melt infiltration distance for both the MS instability and capillarity phenomenon as a function of run duration. Compared with the rate of Fe-melt infiltration in (Mg,Fe)O, performed following the same experimental procedure by Otsuka and Karato (2012), the rates of melt infiltration into crystalline material are orders of magnitude lower at higher pressures. The penetration distance by both mechanisms is governed by a diffusion-type rate law,
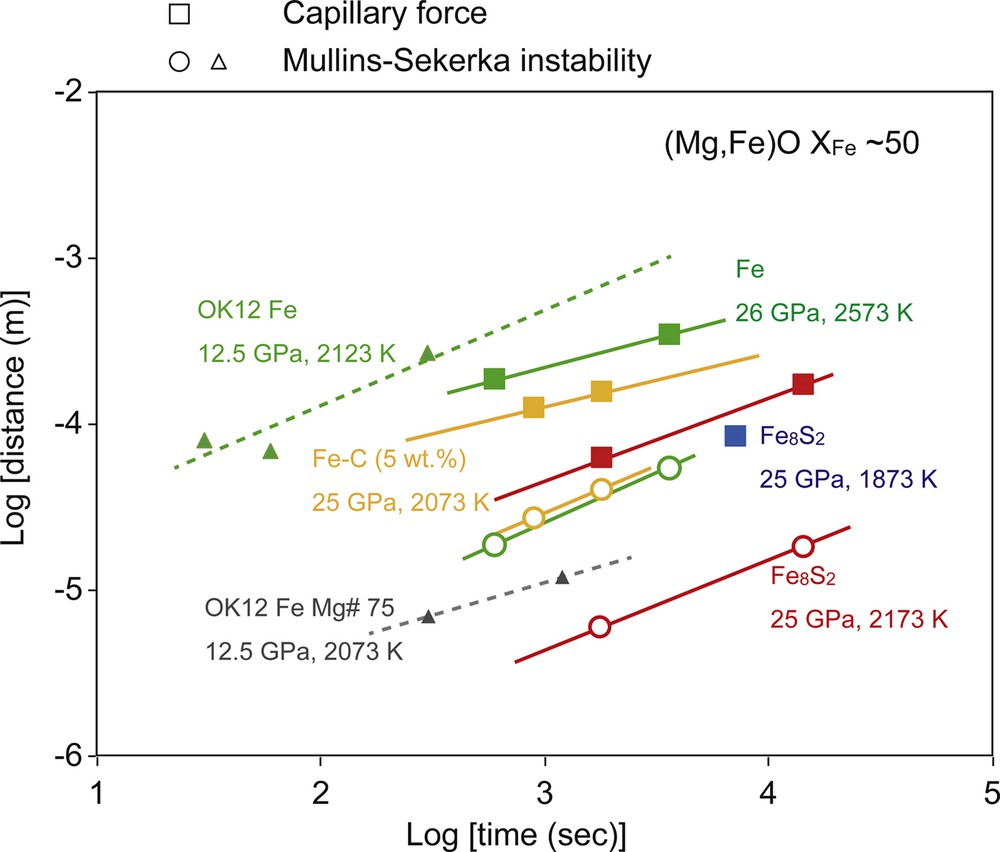
Penetration distance of molten iron alloy liquid into (Mg,Fe)O aggregates as a function of the annealing time. Closed squares, open circles, and triangles denote the penetration distance by the capillarity phenomenon, the thickness of the melt-rich layer formed by the Mullins–Sekerka instability and the penetration distance in single-crystal (Mg,Fe)O determined at 12.5 GPa, respectively (Otsuka and Karato, 2012).
For bridgmanite and post-spinel phases, the penetration of molten Fe alloy was not observed under the same physical conditions where penetration into (Mg,Fe)O aggregate had occurred. A thin FeO-rich (Mg,Fe)O layer (< 3 μm) occasionally formed at the interface between the post-spinel phase and the Fe-alloy melt layer (Fig. 2f). This layer probably formed by precipitation of the dissolved FeO component in (Mg,Fe)O located on the opposite side along the interface between the post-spinel phase and the metallic alloy in association with the diffusion of MgO component in the post-spinel phase. Fe enrichment in the post-spinel and bridgmanite phases was observed only in the region next to the Fe-rich melt layer by Fe-Mg interdiffusion. The length scale of the diffused region is a few micrometers, which is two orders of magnitude shorter than that in (Mg,Fe)O. This observation is consistent with very slow Fe–Mg interdiffusion rates in bridgmanite comparable to Si self-diffusion (Holzapfel et al., 2005).
4 Discussion
4.1 Infiltration mechanisms
The present study demonstrates the occurrence of Fe-alloy melt penetration into the (Mg,Fe)O aggregate, but only minimal penetration into the silicate phase. Liquid penetration at a sharp boundary formed by solid and liquid has been observed in many geological systems for basalt infiltration in dunite and harzbergite (Daines and Kohlstedt, 1994; Morgan and Laing, 2003; Riley and Kohlstedt, 1991; Watson, 1982), carbonate melt infiltration in dunite (Hammouda and Laporte, 2000; Minarik and Watson, 1995) and aqueous fluid infiltration in quartzite (Nakamura and Watson, 2001). Otsuka and Karato (2012) examined the morphological instability of a sharp and planar boundary separating an (Mg,Fe)O single crystal and Fe melt as an analogue of CMB conditions. In the present study, two penetration mechanisms occurred simultaneously at the interface between the Fe-rich melt and the (Mg,Fe)O aggregate. One is melt penetration into (Mg,Fe)O crystal caused by Mullins and Sekerka (MS) instability, also noted by Otsuka and Karato (2012), and the other is infiltration along grain boundaries by the capillarity phenomenon, which is commonly observed in partially molten silicate rocks (Watson, 1982). The most important observation is that the infiltration front of the Fe-rich melt along grain boundaries is located at a distance further than the penetration distance by the MS instability.
Melt penetration into solid is driven by surface tension when the contribution of gravity force is negligible over shorter length scales (Stevenson, 1986). Both the infiltration front formed by the capillarity phenomenon and the penetration front produced by the MS instability are parallel to the interface between the Fe-rich melt and the (Mg,Fe)O aggregate. Such a sharp front is established during reactive dissolution when the solubility of minerals is very low (Chadam et al., 1986). In polycrystalline materials, if the total interfacial energy including the solid–melt interface is lower than that of the purely solid–solid interfacial energy, infiltration can occur along the grain boundaries until the infiltrated melt fraction reaches the minimum interfacial energy (Watson, 1999). This mechanism requires the preferential dissolution of a solid phase along the grain boundaries at the infiltration front.
Melt penetration into crystals proceeds by the MS instability (Mullins and Sekerka, 1964), which occurs on the moving interface for the perturbation larger than the characteristic wavelength (λ);
| (1) |
where Γ is the capillary length, CEqS is the equilibrium concentration in solid, and G is the concentration gradient. The MS instability is induced by a meniscus-shaped deformation of the solid–liquid interface, and occurs when two materials sharing one component are in contact, but chemical equilibrium is attained only near the interface. The concentration gradient (G) of the common component provides the driving force for this instability, and can be approximated by the following equation (Otsuka and Karato, 2012):
| (2) |
where C∞S is the concentration of the FeO component at the leading edges of the metal blob, and L is the thickness of the metallic melt-rich layer. The MS instability forms a layer involving metal blobs inside crystals because surface tension pinches off the penetrated iron-rich melt.
Both mechanisms proceed by a dissolution–precipitation mechanism. Fe-rich melt penetration in the (Mg,Fe)O matrix occurs through three major steps:
- • dissolution of the FeO component proceeds ahead of an infiltration front;
- • the dissolved FeO is then transported by diffusion in the melt toward the Fe-alloy melt reservoir through the grain boundary melt that has already been infiltrated by the Fe-rich melt or toward the opposite end of the metal blob;
- • the FeO component with an equal amount of dissolution at the infiltration front precipitates in the Fe-alloy melt reservoir.
Although both mechanisms are governed by capillary force, the infiltration mechanism along grain boundaries proceeds by dissolution of preexisting grain boundaries, whereas the penetration by the MS instability requires plastic deformation of the interface to form a meniscus shape. Thus, the penetration process due to the MS instability occurs after infiltration along the grain boundaries.
For melt infiltration through the grain boundaries, there appears to be a linear relationship between the infiltration distance and the square root of time (Fig. 6). Oxygen diffusion in the Fe-rich melt is likely to be the rate-limiting process. Diffusion coefficients of oxygen in molten Fe determined at room pressure (Suzuki and Mori, 1971) are comparable to the effective diffusivity obtained from the present study assuming the following relationship: , where Dmi is the effective diffusion coefficient for melt infiltration and t is the time. The estimated Dmi shows similar values in the same conditions, irrespective of the light elements in the Fe-alloy melt. The dissolution of the FeO component into the Fe alloy decreases the surface energy of liquid Fe against (Mg,Fe)O. An increase in the O content in the Fe-alloy melt would then enhance the wettability of the Fe-alloy melt against (Mg,Fe)O (Terasaki et al., 2005). This process may thus decrease the difference between infiltration distances of the Fe-alloy melt containing various light elements. Overall trends from the present results on Arrhenius plots (Fig. 7) show systematically lower diffusivity and activation enthalpy values for melt infiltration through grain boundaries compared with those from a grain-interior study obtained at 12.5 GPa by Otsuka and Karato (2012). This difference is probably caused by a pressure dependence or difference of the rate-limited process. Since the effective diffusivity for the MS instability should include the concentration gradient term (G) (Otsuka and Karato, 2012); lower Dmi for (Mg,Fe)O with low XFe is caused by smaller G.
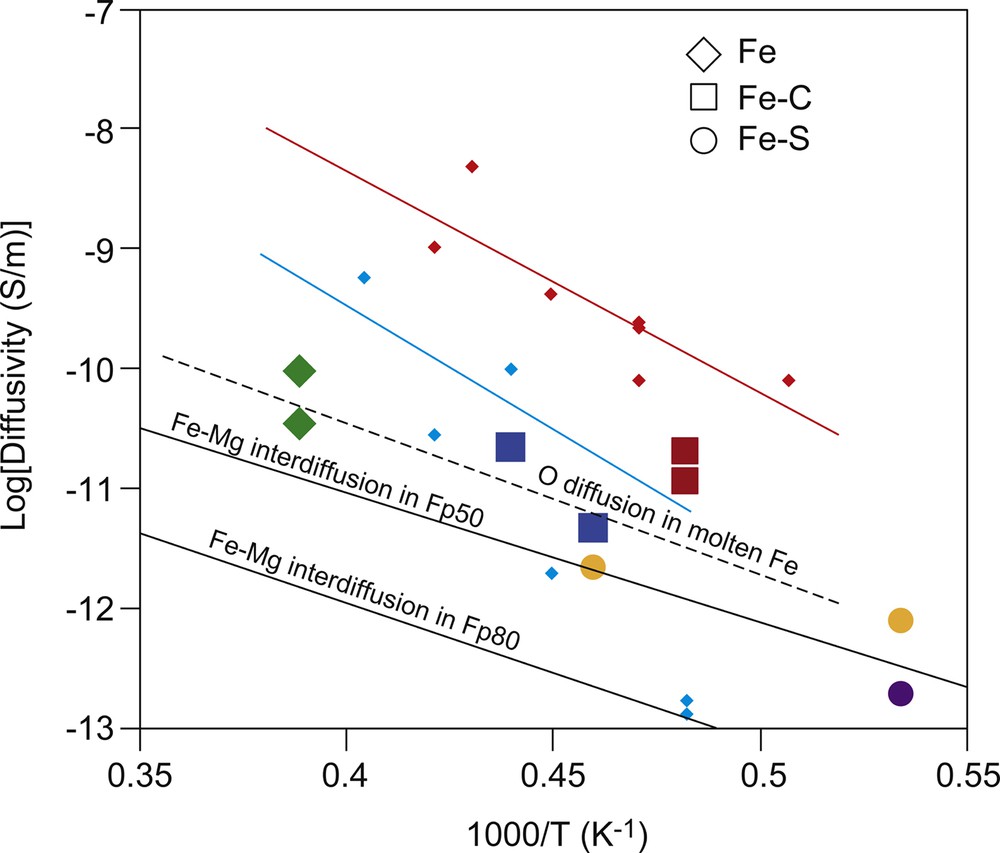
Effective diffusivity corresponding to the infiltration rate of the Fe alloy melt compared with the Fe–Mg interdiffusion coefficient in (Mg,Fe)O. Red squares, Fe–C liquid in (Mg0.5Fe0.5)O; green diamonds, Fe liquid in (Mg0.5Fe0.5)O; orange circles, Fe–S liquid in (Mg0.5Fe0.5)O; blue circles, Fe–C liquid in (Mg0.8Fe0.2)O; and purple circle, Fe–S liquid in (Mg0.8Fe0.2)O. The small red and light blue diamonds denote the data for Fe liquid in (Mg0.45Fe0.55)O and (Mg0.75Fe0.25)O, respectively (Otsuka and Karato, 2012). The solid lines also indicate results from Arrhenius fitting as a function of XFe in (Mg1–x,Fex)O. The solid black lines represent the Fe–Mg interdiffusion coefficients (Yamazaki and Irifune, 2003). The dashed line represents O diffusion in molten Fe determined at 1 atm (Suzuki and Mori, 1971).
The infiltration front through the (Mg,Fe)O grain boundaries is around five times longer than that within the grain interiors. Once grain boundary infiltration begins to proceed, the composition becomes modified to the equilibrium value at the leading edge of the Fe-rich metal blob in the crystalline material produced by the MS instability. The FeO component in (Mg,Fe)O monotonically increases toward the infiltration front produced by infiltration through the grain boundaries (Fig. 5). This compositional modification suppresses the driving force of migration for the Fe-rich metal blobs into the crystals due to the smaller difference of FeO concentration between the leading edge of the blobs and the interface. As a result, a melt-rich layer formed by melt penetration into crystals does not develop. The driving force for the migration of the metal blobs into crystals is controlled by the rate of compositional modification (i.e. Fe–Mg interdiffusion in (Mg,Fe)O), which is dependent on the melt layer spacing (i.e. grain size). Since DFe-Mg in (Mg0.5,Fe0.5)O is approximately five times slower than Do in Fe-rich melt (Fig. 7), the critical grain size is almost comparable to the infiltration length (L). The present study demonstrates that the FeO concentration in (Mg,Fe)O, which is parallel to the metal–oxide boundary, has no considerable lateral variation (Fig. 4), implying that the difference between DFe–Mg in (Mg,Fe)O and Do in the Fe-rich melt is not large. Therefore, the capillary rise through (Mg,Fe)O grain boundaries could be the dominant mechanism for the penetration of Fe-rich melt in (Mg,Fe)O.
Contrary to the (Mg,Fe)O aggregate, neither infiltration by the capillarity phenomenon nor penetration by the MS instability of the Fe-rich melt into the post-spinel or bridgmanite aggregate was observed. There are several reasons to explain this behavior. A morphological instability occurs in the system where two materials sharing one component are in contact, but the chemical equilibrium is attained only near the interface. For a pair composed of Fe and silicate minerals, the sharing component should be FeO, as well as a pair of Fe–(Mg,Fe)O. The values of XFe in bridgmanite in post-spinel and Al-bearing bridgmanite, which are 0.04 and 0.1, respectively, are significantly lower than those in (Mg,Fe)O (XFe = 0.2 and 0.5). The concentration gradient of the FeO component (G) in post-spinel and Al-bearing bridgmanite is much smaller than that for the (Mg,Fe)O aggregate with high XFe. The characteristic wavelength (λ) of the interface morphology measured at the interface between polycrystalline (Mg,Fe)O and Fe-rich melt layer is approximately 5 μm. According to Eq. (1), a smaller G value of the silicate-bearing system in this study leads to larger λ. The necessary condition to induce the MS instability may therefore not be satisfied for post-spinel composed of bridgmanite and ferropericlase with small grain sizes (1 μm). Although Al-bearing bridgmanite aggregates have grain sizes larger than 5 μm, penetration into the crystal material was not observed, nor into post-spinel. The Fe3+/Fetotal in Al-bearing bridgmanite probably exceeds 0.5 because the bridgmanite synthesized in this study is the same as the starting material used for electrical conductivity measurements by Yoshino et al. (2016). Smaller concentrations of the FeO component in Al-bearing bridgmanite would hinder the development of the MS instability.
The post-spinel phase contains a considerable amount of (Mg,Fe)O (32 vol%) and the XFe in (Mg,Fe)O coexisting with Al-free bridgmanite is significantly higher (XFe = 0.17); it is close to the composition of the (Mg,Fe)O aggregate with lower FeO content (XFe = 0.2), which shows Fe-rich melt penetration. Infiltration through grain boundaries is strongly controlled by the wetting angle among constituent phases. Static percolation theory predicts that permeability occurs at any melt fraction when the interfacial angle formed at the solid–melt triple junction is less than 60°, whereas above 60° the melt can migrate only if the melt fraction reaches a percolation threshold (von Bargen and Waff, 1986; Yoshino et al., 2003). Dihedral angles measured for a molten Fe (Fe–O–S) alloy in a bridgmanite matrix are remarkably higher than 60°, and around 80–110° under the conditions prevailing at the top of the lower mantle (Shannon and Agee, 1998; Terasaki et al., 2007), effectively rendering silicate impermeable. Bridgmanite–bridgmanite grain boundaries are therefore unlikely to enhance the infiltration of the metallic melt into a bridgmanite aggregate. For post-spinel, assuming an isotropic texture with the same grain size, phase boundaries composed of bridgmanite-(Mg,Fe)O and bridgmanite–bridgmanite grain boundaries occupy most of the boundary areas. The penetration of an Fe-rich melt in the post-spinel phase would therefore be dominantly controlled by an interphase boundary between (Mg,Fe)O and bridgmanite. However, the proportion of (Mg,Fe)O–(Mg,Fe)O grain boundaries characterized by a low dihedral angle is quite low (∼ 10% for post-spinel). The fact that the interconnectivity of (Mg,Fe)O was not established in the post-spinel phase (Yamazaki et al., 2014; Yoshino et al., 2008) also suggests that (Mg,Fe)O–(Mg,Fe)O grain boundaries are not common in it.
4.2 Implications for core–mantle interaction in the CMB region
If Fe-rich melt and lower mantle phases are not in chemical equilibrium, as would be the case at the CMB, dissolution and precipitation reactions could lead to a very efficient exchange of components between the outer-core Fe-alloy melt and the bulk silicate mantle. However, the present study indicates that a modification of the chemical composition of the mantle, such as the enrichment of highly siderophile elements and the development of the negative μ182W observed in some modern oceanic island basalts (Mundl et al., 2017), does not occur by infiltration due to the capillarity phenomenon nor by penetration due to the MS instability of the metallic melt into the silicate mantle in the CMB region.
Here, I consider only a case where the (Mg,Fe)O phase dominates in the CMB region because the Fe-rich melt can infiltrate through the grain boundaries in (Mg,Fe)O aggregates. (Mg,Fe)O with very high iron content has been considered a source for heterogeneity because of the possible enrichment in iron oxides in the CMB region (Buffett et al., 2000; Dobson and Brodholt, 2005; Kanda and Stevenson, 2006; Labrosse et al., 2007; Nomura et al., 2011; Otsuka and Karato, 2012). Iron-rich (Mg,Fe)O could slow down seismic waves by several percent (Wicks et al., 2010) and has a high electrical conductivity of about ∼ 105 S/m in lowermost mantle conditions (Ohta et al., 2014). The present study demonstrates that iron-rich (Mg,Fe)O has the ability to entrain the Fe-rich melt from the outer core by the capillarity phenomenon.
The infiltration distance is first considered without accounting for gravitational forces to apply the present results to CMB conditions. Assuming a CMB temperature of 4000 K, the infiltration distance of the Fe-alloy melt into (Mg,Fe)O by the capillarity phenomenon throughout Earth's history is estimated to be greater than 200 km from O diffusion in Fe melt (Suzuki and Mori, 1971). Even if the diffusion coefficient is reduced by two orders of magnitude due to the pressure effect, the infiltration distance is still larger than 20 km. Thus, if iron-rich (Mg,Fe)O has existed as a gravitationally stable layer immediately above the CMB throughout Earth's history, this process can form a layer of sufficient thickness to exhibit some geophysical anomalies. However, the Fe metallic liquid has a higher density than the (Mg,Fe)O solid.
The capillary force must overcome the negative buoyancy force induced by the high-density metallic fluid to allow the infiltration of Fe-rich melt. When the Fe-rich melt at the infiltration front maintains the interconnection with its source through the grain boundaries, a height (h) of the melt column formed by capillary rise is determined by the balance of the forces between surface tension and gravity:
where γ is the surface tension of the liquid (i.e. interfacial energy between the solid and the liquid), θ is the wetting angle between the solid and the liquid, ρ is the density of the liquid, g is the value of gravity, and δ is the distance between two plates (i.e. the grain boundary). δ is found to be around 1 μm from the present study. According to Eq. (11) in Poirier and Le Mouël (1992) assuming perfect wetting (θ = 0°), 1-μm melt film thickness, and no tortuosity, capillary rise can produce an Fe-rich melt column of 20 m in height, which corresponds to the maximum estimation of h.
If the ultra-low velocity zone is composed of Fe-rich (Mg,Fe)O with XFe ≥ 0.8, high conductance (108 S) to account for the length of the day requires at least a 1-km thick layer (Ohta et al., 2014). However, for an (Mg,Fe)O layer with low Fe content (XFe < 0.5), the presence of an Fe melt-rich layer is necessary to raise the conductivity of this zone. To estimate the effect of an Fe-rich melt layer in (Mg,Fe)O on the electrical conductivity of the bulk rocks, I applied the Hashin–Shtrikman upper bound as an appropriate mixing model because of its high wetting properties (Hashin and Shtrikman, 1962). Fig. 8 shows the bulk conductivity of rocks composed of (Mg,Fe)O with various amounts of Fe-rich melt. When the volume fraction of the Fe-rich melt exceeds 5%, the bulk rock conductivity is controlled by the Fe-rich melt, irrespectively of the chemical composition of (Mg,Fe)O. However, the plausible volume fraction of the Fe-alloy melt in the layer formed by the capillary rise is distinctly smaller than 5% (Figs. 2 and 4). Assuming a grain size larger than 1 mm and a width of the grain boundaries, filled with a Fe-alloy melt, of 1 μm, the volume fraction is estimated to be less than 0.3%, using the simple geometrical model by Palumbo et al. (1990) (Fig. 9). The layer thickness necessary to explain the high conductance, 108 S, is more than 300 m, which is distinctly larger than the height of the capillary rise (20 m) (Fig. 10). Therefore, the presence of only a 20-m-thick Fe-rich melt zone formed by capillary rise cannot produce high conductance of the CMB region predicted from decadal timescale variations of the length of day. Such thin layers are difficult to detect as a seismic anomaly in the CMB region.

Electrical conductivity of (Mg,Fe)O containing molten Fe alloy as a function of XFe in (Mg,Fe)O aggregates.

Variation of the melt fraction in (Mg,Fe)O aggregates with the grain size assuming constant Fe alloy melt thicknesses of 1 and 3 μm.
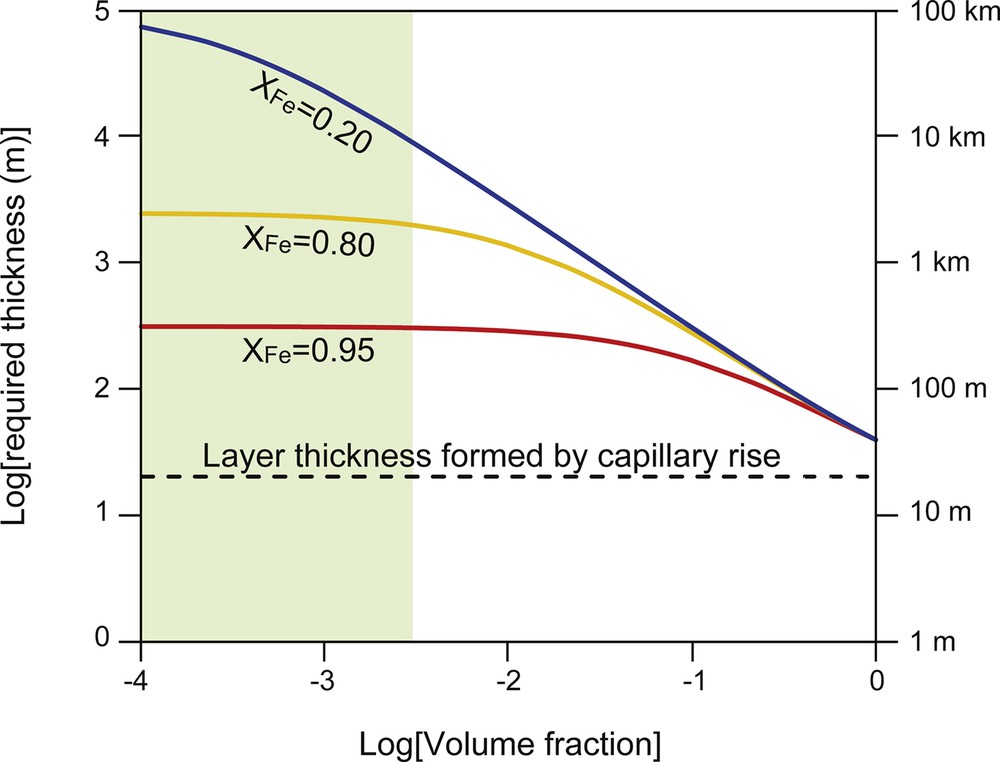
Thickness variations of a (Mg,Fe)O layer with a 1-μm thick film of molten Fe alloy required for 108 S/m predicted from decadal timescale variation of the length of day. The dashed line indicates the maximum layer thickness formed by capillary rise.
In summary, penetration mechanisms (infiltration through grain boundaries and the MS instability) controlled by capillary force are unlikely to explain the high conductance of the CMB region predicted from the decadal variation of the length of day or any geochemical signatures of a leaking core into the mantle, even in the most effective case when the CMB region is composed of only Fe-rich (Mg,Fe)O with perfect wetting.
Acknowledgments
This work was supported by MEXT/KAKENHI, 15H05827 and 17H01155 to T.Y. from the Japan Society for Promotion of Science. The author would like to thank two anonymous reviewers for insightful comments on earlier version of this manuscript.