

1 Introduction
Olivine, especially from the (Fe, Mg)2SiO4 solid solution, is one of the most abundant and ubiquitous minerals in the solar system. Consequently, the knowledge of its elastic properties and of their dependence on chemical composition is fundamental to the understanding of the interior of telluric planets and small bodies. In the Earth's mantle, the relatively high oxygen fugacity tends to favor the crystallization of Mg-rich olivines, and therefore most elasticity studies have focussed on compositions between forsterite (Fo), Mg2SiO4 and (e.g., see Bass, 1995). In environments such as the Moon or Mars, redox conditions are more favorable to Fe-rich olivines (e.g. Herd, 2008; Wadhwa, 2008). Except for the fayalite (Fa) end-member, Fe2SiO4, which presents largely discrepant data, there are very few elastic property measurements in Fe-rich olivine specimens.
The works by Chung (1970, 1971) were the first studies on elastic parameters of olivines as a function of their Fe content, XFe = Fe/(Fe + Mg). The sound velocity measurements in their synthetic samples showed that both bulk and shear moduli decrease with increasing Fe concentration. Andrault et al. (1995), in a study on amorphization of olivines, also measured their compressibility for XFe = 0; 0.17; 0.66; 1. Probably because of the high stress present in their experiments (diamond anvil cell without pressure medium), the dependence of their KT0 values on Fe concentration is unclear, and their KT0 for fayalite is particularly low (≃125 GPa). Speziale et al. (2004) used Brillouin scattering to determine the single-crystal elastic constants of a Fe-rich olivine, . They concluded that chemical composition, therefore Fe content, has a strong effect on the elastic properties of olivine. An attempt to determine the dependence of the bulk modulus with XFe was made by Liu et al. (2005). They combined their ultrasonic interferometry measurements performed on San Carlos olivine, , with Speziale et al.'s data in a linear fit, and proposed that the adiabatic bulk modulus, KS0, follows the trend:
| (1) |
| (2) |
Because a compositional effect on the elastic properties of olivines may have important implications for geodynamic models, we have started a study to better constrain the thermo-elastic parameters of olivines with high Fe content. This article presents our first results obtained at room temperature on the measurements of the bulk modulus of four olivines, with XFe ranging from about 40 to 100% using synchrotron X-ray diffraction.
Elasticity experiments coupling multi-anvil with X-ray diffraction (XRD) usually involve polycrystalline aggregates, a case where deviatoric stress and therefore lattice strain can hardly be avoided. Even if the deviatoric stress, t, can be seen as a two-sided coin (Bassett, 2006), it is considered a parasitic effect in the determination of elastic constants. In an attempt to eliminate t from our measurements, we adopted the approach of Singh et al. (1998) (see also Uchida et al., 1996) to calculate the cell parameters of our samples under hydrostatic pressure. This approach is similar to that of Duffy et al. (1999a) for the determination of the EoS of rhenium, Duffy et al. (1999b) for molybdenum and Xiong et al. (2014) for the EoS of NaCl. Additionally we also corrected the estimated pressure for the differential stress present in the sample as well as in the pressure medium.
2 Experimental procedure
2.1 Sample preparation
In order to better constrain the effect of the iron content on the bulk modulus of olivines, it is important to control their chemical composition, and therefore we used synthetic samples. These were prepared from commercial nanosize oxide powders of SiO2, MgO, and Fe2O3 mixed in the proper stoichiometric proportions to obtain olivines, , with x = 0.4, 0.6; 0.8; 1. Each powder was mixed in alcohol in an agate mortar, dried under an infrared lamp and annealed at 1000 °C/1 atm and a close to that of the iron-wüstite buffer for 2 h. During annealing, the powder was placed inside a Fe-saturated Pt container, and pieces of Fe foils were added at the bottom and on top of the powder to fix the oxygen liberated by the reduction of hematite. This grinding–annealing cycle was repeated twice under the same conditions. The resulting product was checked by XRD to verify that it was pure olivine.
Our fayalite powders were all densified prior to high-pressure experiments using spark plasma sintering, SPS (Béjina and Bystricky, 2009; Guignard et al., 2011). In order to keep our fayalites stable, the powders were surrounded by a Fe jacket, and Si powder was also added nearby in the SPS assembly, therefore maintaining a low . The assembly was placed inside a chamber under vacuum (about 10 Pa), and a pressure of 100 MPa and a temperature of 1000 °C were applied for 30 min. After sintering, we obtained 8-mm-diameter disks about 3 mm in thickness. The porosity of each disk was derived from the measurement of density by Archimedes’ method, and the grain size was estimated by microstructural analysis (Section 2.3 and Table 1). Electron microprobe analysis of our olivines yielded final chemical compositions with fayalite contents of 45; 64; 82; 100% (thereafter named Fa45, Fa64, Fa82 and Fa100 respectively), with a standard deviation of 1%. Cell parameters determined by XRD are given in Table 2.
Characteristics of sintered samples before the experiments and high-pressure run conditions.
| SPS experiments | HP runs | ||||||
| Run# | Fa% | Density | Porosity | grain size | Tonsa | T b | t rangec |
| (%) | (μm) | (K) | (GPa) | ||||
| AM309 | 45 | 3.66 | 2.4 | 0.2–0.5 | 70 | 1100 | [−1.4, 0.0] |
| AM215 | 64 | 3.87 | 2.4 | 0.3–0.7 | 40 | 1100 | [−0.9, 0.1] |
| AN400 | 82 | 4.03 | 3.5 | 0.5–1.2 | 50 | 900 | [−0.8, 1.6] |
| AM313 | 100 | 4.20 | 4.3 | 1–3 | 50 | 900 | [−0.7, 1.1] |
a Maximum value reached.
b Stress-relaxation temperature.
c Differential stress range.
Cell parameters and volumes of our olivine starting specimens.
| Sample | a | b | c | V |
| (Å) | (Å) | (Å) | (Å3) | |
| Fa45 | 4.779 ± 0.004 | 10.319 ± 0.006 | 6.032 ± 0.002 | 297.5 ± 0.3 |
| Fa64 | 4.800 ± 0.003 | 10.380 ± 0.004 | 6.059 ± 0.002 | 301.9 ± 0.3 |
| Fa82 | 4.810 ± 0.001 | 10.422 ± 0.001 | 6.077 ± 0.001 | 304.7 ± 0.1 |
| Fa100 | 4.817 ± 0.001 | 10.478 ± 0.002 | 6.097 ± 0.001 | 307.8 ± 0.1 |
Samples for the high-pressure runs were cored in the sintered disks and both ends of each core were polished in order to be parallel. The final shape of each sample was a 1.2 mm-diameter cylinder about 1 mm long.
2.2 High-pressure experiments
All experiments were performed at the National Synchrotron Light Source (NSLS-I) in Brookhaven National Laboratory (BNL). We used the multi-anvil apparatus (DIA-type) installed at the superconducting wiggler beamline X17B2; energy-dispersive diffraction patterns for both NaCl (as pressure calibrant) and samples were collected at a scattering angle of about 6.5° on the same detection system as that described by Weidner et al. (2010). Both Bragg angle and energy parameters were calibrated at the beginning of each experiment using Al2O3 XRD peaks and the 14- and 122-keV Co fluorescence peaks. Collection duration was between 100 and 300 s.
Two types of cubic cell assemblies were used (Fig. 1). One is a cell modified from rheology experiments (e.g., Weidner and Li, 2006) for runs on samples Fa45 and Fa64 (Fig. 1a). The cell assembly was slightly different for each of these two experiments, the Fa64 sample being sandwiched between two NaCl disks, whereas sample Fa45 was placed with a second olivine specimen (not presented here) separated by a NaCl disk. A Fe disk (30 μm in thickness) placed at the top and bottom of samples Fa45 and Fa64 served as a buffer. The second one (Fig. 1b), for Fa82 and Fa100, is more typical of the cells used for ultrasonic measurements (e.g., Li and Liebermann, 2007). Three 1 μm-thick disks of gold foil were placed at three interfaces: anvil/alumina-rod/sample/NaCl in order to smooth contact. For both assemblies, the primary components are: a fired pyrophyllite cube with a 6-mm edge, a graphite furnace, a BN jacket surrounding the samples and maintaining a low , and a NaCl pressure calibrant, both BN and NaCl providing a pseudo-hydrostatic environment. A WRe3%–WRe25% thermocouple was present to monitor the temperature during the relaxation heating step, and also because the initial goal was to obtain high-temperature data. Samples were pressurized in the DIA with 4-mm truncation anvils, five of them made of tungsten carbide and a sixth (lateral at the back of the cell assembly) of sintered diamond in order to create a transparent path for diffracted X-rays to the detectors. All samples were first pressurized at room temperature before being heated to high temperature to reduce stress, thereafter called the stress-relaxation temperature (all run conditions are listed in Table 1). In experiments that did not present thermocouple failure, we follow a (P, T) path typical of EoS studies: during the cold-compression phase, tonnage was increased at a rate of about 0.2 t/min, and a 3-min plateau was marked every 5 t. XRD data were collected during this phase at the beginning and end of each plateau. Once the target pressure was reached, the samples were heated to the stress-relaxation temperature in about 1 h. Temperature was then decreased by steps of 100 K, and at each temperature XRD data were collected after a 5-min thermal equilibration period. Once at room T, tonnage was lowered by steps of 3–10 t in 30 min, and the sample was brought to high temperature again in less than 1 h. These cycles were repeated until about 5 t. These conditions can vary depending on the experiments, and graphs of temperature and tonnage for each experiment are shown in Fig. S1 (Suppl. Materials). High-temperature results will be presented elsewhere.
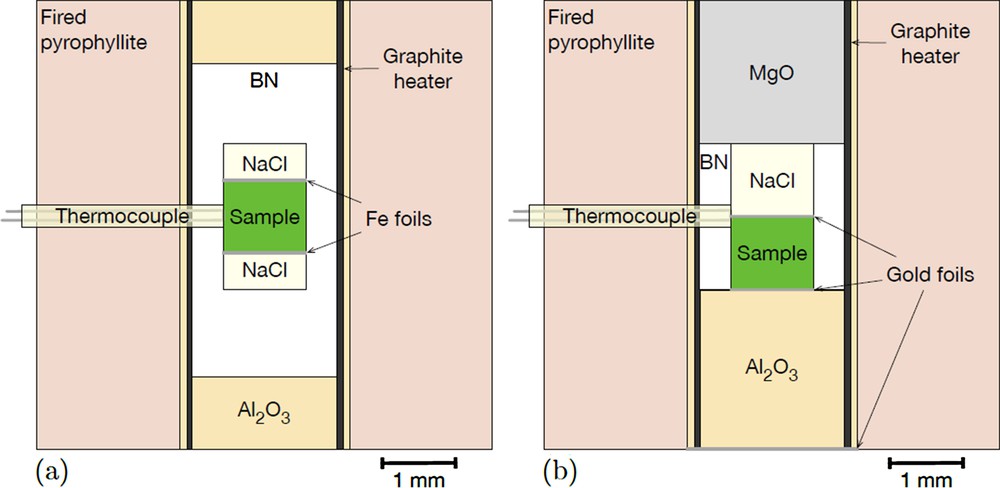
Two types of high-pressure cell assembly used in this work. Both are made of a fired pyrophyllite cube drilled from side to side in its center. We used a graphite furnace for all experiments and NaCl as a pressure standard. (a) Assembly used for sample Fa64 with BN as a pressure medium. A variation of this cell was used for Fa45, where two samples separated by a disk of NaCl were placed in the center. (b) Assembly for samples Fa82 and Fa100. More typical of assemblies used for ultrasonic interferometry experiments, the sample sits on a dense alumina plug. See other details in the text.
For the experiment on Fa64, pressure was measured in both NaCl disks, at the top and bottom of the sample, and both gave the same pressure estimate.
2.3 Microstructure analysis
Microstructural analysis of both sintered samples and samples recovered after the high pressure runs were performed by scanning electron microscopy (SEM) using EDS, orientation contrast (OC), and electron backscatter diffraction (EBSD). Vertical sections were cut and polished to a fine polishing grade using conventional polishing techniques and lapped with a high-pH colloidal silica suspension. Samples were analyzed in a JEOL JSM-7100TTLS LV with a field emission gun (FEG) cathode operating at an accelerating voltage of 15 keV. Diffraction patterns automatically indexed with the Channel 5 software were recorded at small step sizes to generate maps to estimate grain size distributions and to determine pole figures describing the overall texture. Crystallographic preferred orientations were very weak (Fig. S2 in Supplementary Materials), and typical of what is observed in olivine after sintering at high pressure and temperature. An example of a microstructure for sample Fa100 is shown in Fig. 2.
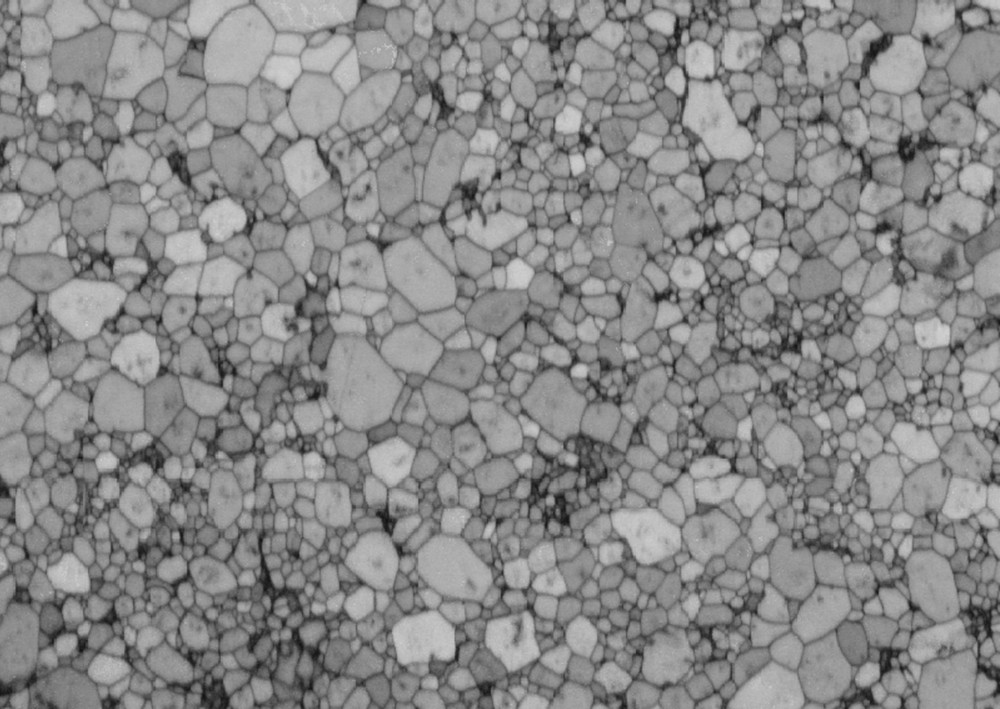
Microstructure of sample Fa100 reconstructed from EBSD data acquired with a step size of 0.1 μm. The horizontal field of view is 80 μm. The sample has a very low porosity and a homogeneous grain size.
3 Data analysis and results
3.1 X-ray diffraction analysis
Energy-dispersive diffraction patterns were analyzed using either the in-house software Plot85 (Weidner et al., 2010) or Fityk (Wojdyr, 2010), both giving very close peak positions. Fig. 3 shows an example of the fit of a XRD pattern using Fityk. The detection system situated at the back of the press is composed of 10 energy dispersive detectors. Nine are separated by 22.5° on a half circle, with detectors 1 and 9 vertical and detector 5 horizontal, and a tenth detector is located opposite to detector 5 (see Fig. S3 in Suppl. Materials). Therefore, when XRD data are collected, we obtain up to 10 patterns. At least, one X-ray-transparent sintered-diamond anvil has to be used in order to unblind detectors 1 to 9. Detector 10 is only used when acquiring calibration data (using Al2O3) or when detector 5 is down. Table S1 (Suppl. Materials) lists the available detectors for each experiment.
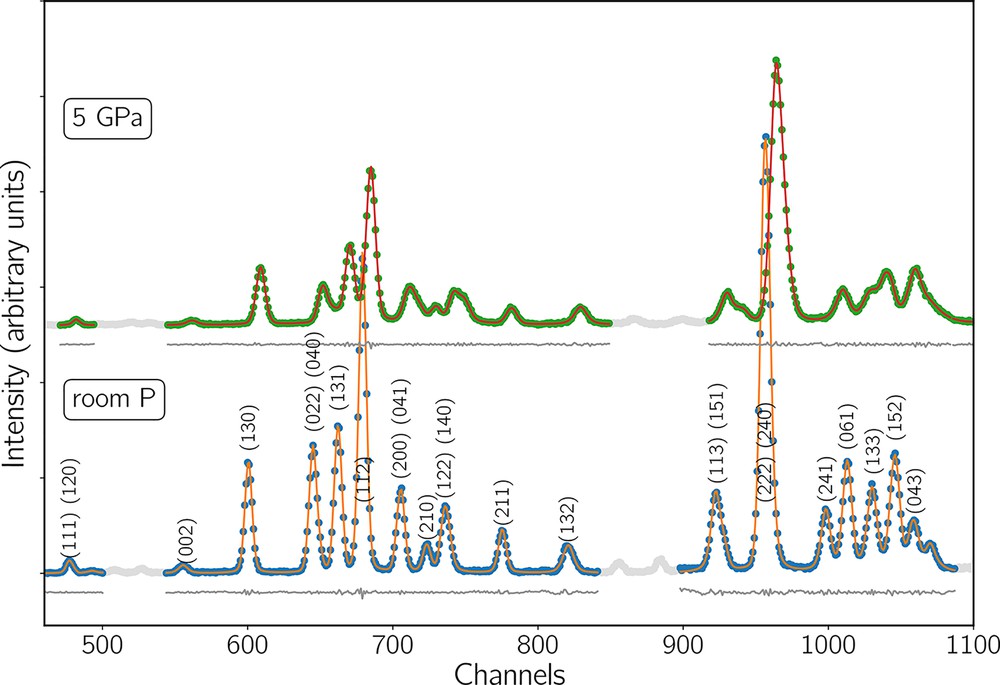
XRD patterns of sample Fa100 and Fa peak positions at room pressure (bottom) and at 5 GPa (top), both at room temperature after background subtraction. Orange and red lines show the fit of the full spectra and the grey lines show their residuals. Extra peaks come from cell assembly materials. Light-grey data points were masked during peak fitting. The peaks used to calculate unit cell volumes are listed in the text.
In a multi-anvil experiment, a cylindrical symmetry of stress may be expected, where the differential stress, t, is uniaxial. To estimate t in both sample and NaCl pressure calibrant, XRD patterns on all detectors were fitted peak by peak instead of minimizing the full crystal structure (see description in Cheung et al., 2017). For a given hkl peak, the d-spacing values measured on each detector align on a straight line when plotted against 1 − 3 cos2ψ, with ψ the detector azimuth. Fig. 4 shows an example of such a plot, together with a weighted linear least-squares fit. As described in Eq. (3) of Singh et al. (1998), this linear relation can be written:
| (3) |
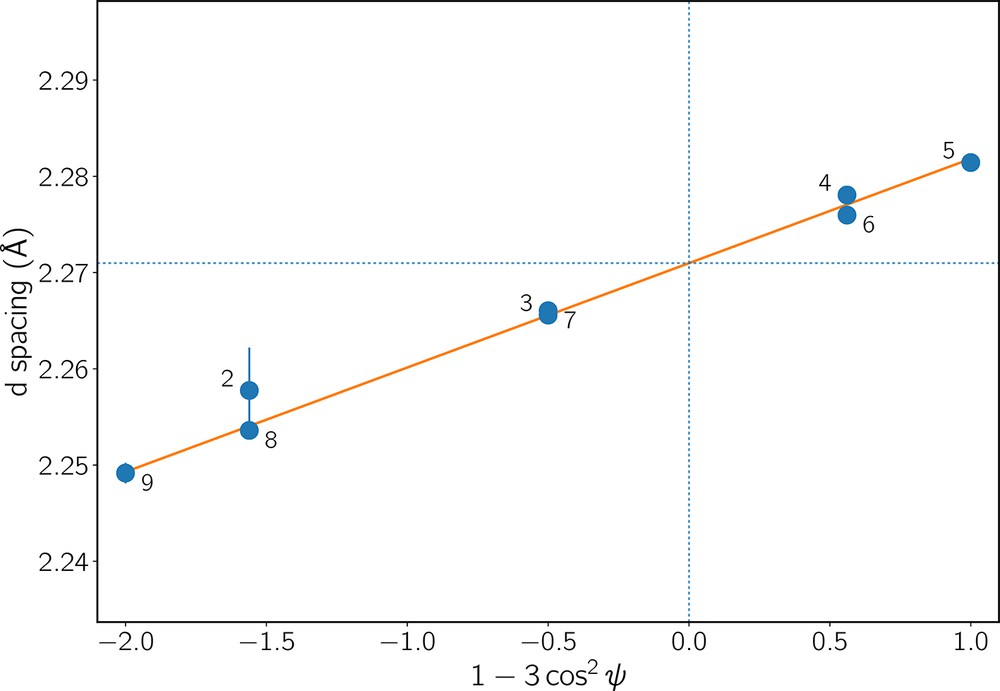
Values of the d-spacings of plane (122) of sample Fa82 measured at about 6 GPa on each detector. On the horizontal axis, ψ is the detector azimuth, and black numbers on the plot refer to detector positions. In this example, detector 1 is missing and detector 10 is blinded by a WC anvil. The orange line shows the linear weighted least-squares fit to the data. Its slope is proportional to the differential stress felt by this hkl plane. Dotted blue lines show how the d-spacings under hydrostatic pressure (dP(hkl)) are determined.
Unit-cell parameters and volumes (V) were calculated from dP(hkl) obtained for each fitted peak using our own set of python routines. For sample Fa100, we checked the validity of our calculations against results provided by UnitCell (Holland and Redfern, 1997) and EosFit (Angel et al., 2014). Both procedures lead to very close volumes and pressures with a difference in the final value of KT0 on the order of 10−2 GPa.
3.2 Pressure and stress calculations
In order to estimate the NaCl unit-cell volumes, we typically fitted between five and seven peaks: (200), (220), (222), (311), (400), (420), (422). On rare occasions, when the quality of the data was poor, the number of peaks had to be reduced to 2 and even to 1 for one XRD pattern. The NaCl unit-cell parameter was calculated from the dP(hkl) described above using the non-linear least-squares minimization from the LMFIT python package (Newville et al., 2014). Pressures were calculated from NaCl unit-cell volumes using a third-order Birch–Murnaghan (BM) EoS (Birch, 1947) and, following recommendations by Strässle et al. (2014), with values of KT0 and K′ fitted from Brown (1999). The differential stress, t, was calculated for each hkl peak using Eq. (3). In order to extract t from Q(hkl) (Singh et al., 1998), we used the compliance tensor and its pressure derivatives from Spetzler et al. (1972). Finally, the so-called macroscopic stress was simply calculated as the average of all hkl stresses, as it is usually done.
For the fayalite samples, unit-cell parameters and volumes were calculated following the same procedure as above. The sets of hkl peaks used were: (112), (130), (131), (133), (222), (241) for Fa45; (022), (061), (112), (122), (130), (131), (132), (133), (222), (241) for Fa64; (022), (061), (112), (122), (130), (131), (140), (152), (210), (241) for Fa82; (061), (112), (122), (130), (131), (132), (133), (152), (210), (211), (222), (241) for Fa100. Stress was then calculated at P measured in NaCl using the compliance tensor (Cij) of and its pressure derivatives from Webb (1989) for Fa45, and Cij of fayalite from Isaak et al. (1993), and dCij/dP from Graham et al. (1988) for Fa64, Fa82 and Fa100. We are not aware of Cij measured in olivines with compositions close to Fa45 and Fa64. As a test, we repeated this calculation for Fa64 with a compliance tensor of forsterite (Isaak et al., 1989) in order to maximise the error, and found that t is reduced by a third. The difference in XFe between Fa64 and fayalite being less that with forsterite, the error is in fact lower. In addition, as shown below, only a fraction of the stress is used in the pressure correction step, and therefore this error has little impact on our final results. It must also be noted that, at this point in the data analysis process, P was not corrected for the deviatoric component. We did verify that the change in P when corrected had negligible effect on the values of t (of the order of 10−2 GPa).
As described in many mineral physics textbooks (e.g., Poirier, 1985), it is possible to decompose the stress tensor into a hydrostatic part and a deviatoric part. The hydrostatic pressure is the only one necessary to fit a BM EoS and the deviatoric tensor should be removed from the overall stress tensor. The differential stress is measured as described above, and two examples of its evolution during an experiment are presented for samples Fa100 and Fa45 in Fig. 5. This figure shows that, while heating to 1100 K relaxes the stress stored in the sample during cold compression, t does not remain at zero after the temperature is lowered back to room T. This was noticed for all samples, and the ranges of t measured in each specimen are listed in Table 1 (see also Supplementary Materials). In the examples shown in Fig. 5, the samples are under extension after heating, probably because of the flow of cell assembly materials at high temperature. It is well accepted that deviatoric stress becomes sufficiently low to be undetectable at T ≥ 723 K (e.g., Wang et al., 1998; Weidner et al., 1994), but it does not mean that stress remains negligible when T changes. This could lead to erroneous estimates of pressure and, of course, of elastic constants.

Differential stress measured in both NaCl (orange crosses) and samples (blue triangles) Fa100 (a) and Fa45 (b) at room T, and pressure (grey squares, right-hand axis) as a function of time. See the text for a description of stress determination. The stress drop visible after 20,000 s for Fa100 (a) and after 10,000 s for Fa45 (b) is due to the flow of cell assembly materials as a result of the relaxation heating. The samples remained under extension until the very end of the experiment.
In NaCl, a differential stress was also measured in all of our experiments, though it was typically much smaller than the one measured in olivine, as one might expect. Therefore, the stress states in olivine and in NaCl are different, and a correction needs to be applied to the pressure measured in NaCl to estimate the hydrostatic pressure in olivine. Assuming an axisymmetric stress state, the vertical component of the stress tensor in the sample is PFa + (2/3)tFa, where PFa is hydrostatic pressure and tFa is differential stress counted as positive in compression. Similarly, the vertical stress component in NaCl is PNaCl + (2/3)tNaCl. At the interface between sample and NaCl, both vertical components are equal, yielding:
| (4) |
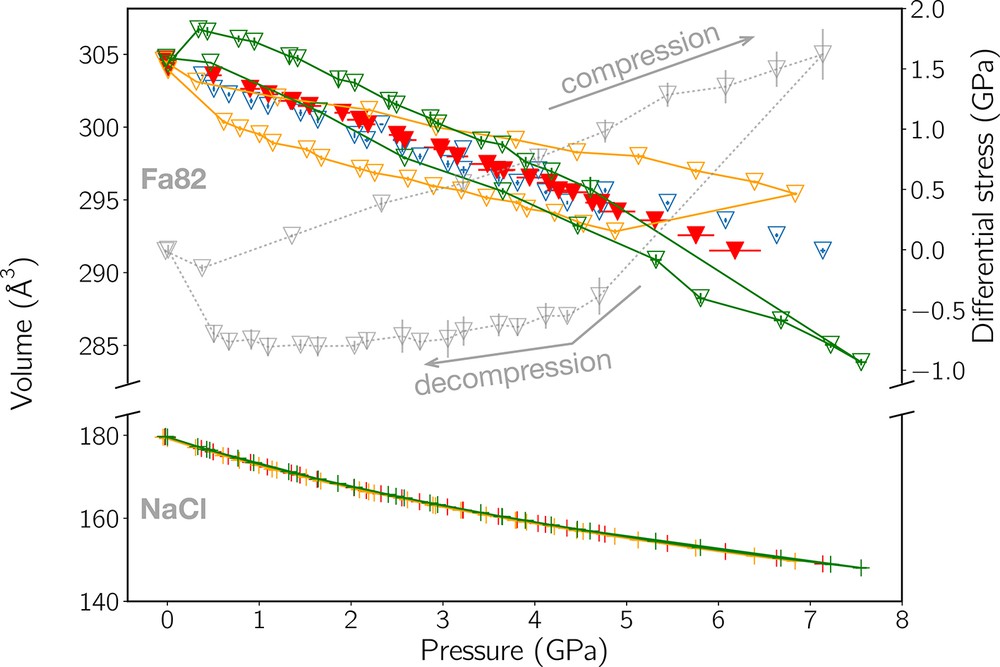
Volumes of Fa82 and NaCl (colored data, left axis), and stress in Fa82 (grey data, right axis) as a function of pressure. The top part of the plot is for Fa82 (down-pointing triangles), the bottom part for NaCl (crosses). Orange and green colors indicate volume data from detectors 5 and 9, respectively, as a function of PFa. Volumes (V) calculated from dP (see Eq. (3)) are shown in blue as a function of PNaCl and in red as a function of PFa after correction using Eq. (4). The grey points show the stress in Fa82 as a function of PFa. The higher stress levels correspond to the cold-compression phase. After relaxation heating, stress lowers but remains measurable throughout the experiments. One can see that the differential stress present in Fa82 does not allow the determination of an EoS from one detector only, unlike for NaCl where stress is low (not shown).
3.3 Results
A summary of all our data is available in the Supplementary Materials: pressure, volume and stress data for each experiment are listed in Tables S2 to S5 and, in addition, d-spacing values for samples and NaCl are included in individual .csv files. Plots of volumes versus PFa are presented in Fig. 7. Table 3 contains the values of KT0 from the second-order BM EoS (BM2) fits shown in Fig. 7. All our fits are minimizations using orthogonal distance regression (ODR), weighted in order to take into account uncertainties in both pressure and volume. We did not try to determine a dK/dP value from our volume data for the following reasons:
- - X-ray diffraction data were sometimes poor, with high background noise,
- - our pressure range is limited to about 6 GPa with non negligible differential stress,
- - our correction of the pressure for the stress in both the specimen and pressure medium still leaves some discrepancy in the V = f(P) plots,
- - this correction depends on the accuracy of our estimate of the macroscopic stress in the cell assembly, a difficult task both in terms of data analysis and interpretation (Burnley, 2015).
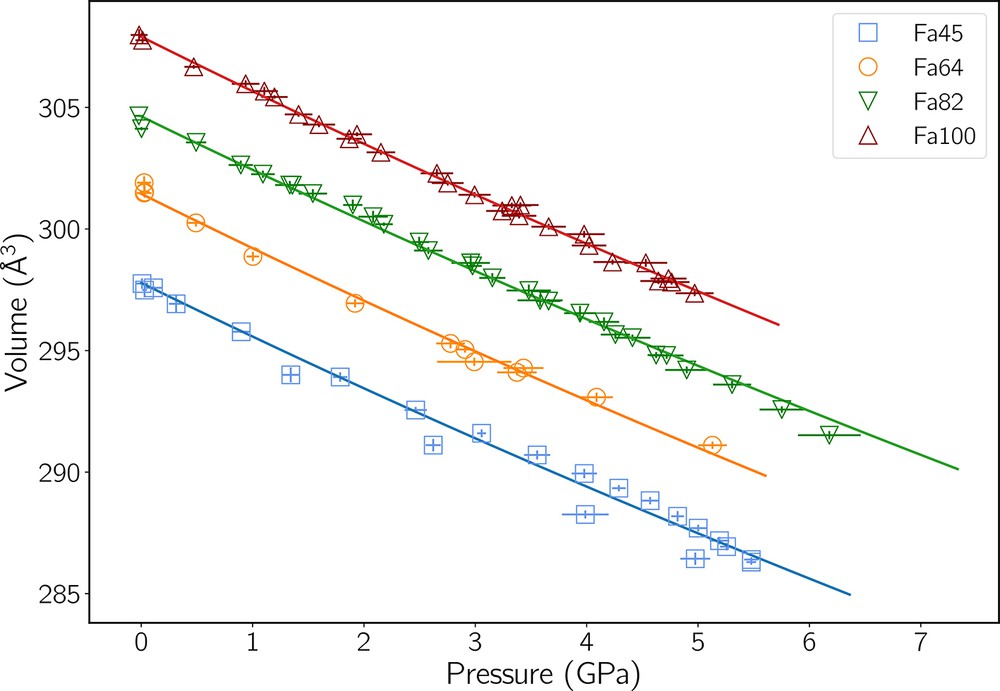
Unit-cell volumes of the four specimens as a function of pressure PFa. Uncertainties are shown as one standard deviation. Pressures are corrected for differential stresses both in NaCl and in the samples. Lines show the orthogonal distance regression (ODR) fits of a BM2 EoS for each dataset. The results are listed in Table 3.
Bulk modulus values for the four olivine compositions obtained with a second-order Birch–Murnaghan EoS and also with a third-order EoS using a fixed value of dK/dP.
| Sample | V 0 | K T0 | dK/dP |
| (Å3) | (GPa) | fixed | |
| Fa45 | 297.79 ± 0.18 | 132.3 ± 3.1 | 4 |
| Fa45a | 297.93 ± 0.16 | 131.4 ± 2.6 | 4 |
| Fa64 | 301.45 ± 0.11 | 132.1 ± 3.1 | 4 |
| Fa82 | 304.63 ± 0.06 | 136.3 ± 1.7 | 4 |
| Fa100 | 307.91 ± 0.06 | 134.8 ± 1.4 | 4 |
| All | 135.3 ± 0.6 | 4 | |
| Fa45 | 297.82 ± 0.19 | 128.9 ± 3.2 | 5.3 |
| Fa45a | 297.98 ± 0.18 | 127.9 ± 2.8 | 5.3 |
| Fa64 | 301.47 ± 0.11 | 129.6 ± 2.9 | 5.3 |
| Fa82 | 304.65 ± 0.07 | 133.4 ± 1.9 | 5.3 |
| Fa100 | 307.94 ± 0.07 | 131.9 ± 1.5 | 5.3 |
| All | 132.4 ± 0.7 | 5.3 |
a Cold-compression data removed.
As one can see from Table 3, uncertainties on K (1 standard deviation) are quite large compared to, for example, Nestola et al. (2011)'s results, whose samples were in a liquid pressure medium. It comes from the large uncertainties in the pressure determination, which comprise uncertainties on PNaCl, tNaCl, and tFa.
4 Discussion
Differential or deviatoric stress has rarely been measured and quantified in elasticity experiments. This is understandable because such measurements are difficult and time consuming. It should though be emphasized that non-hydrostatic conditions are unlikely to be detected when acquiring data with a single energy dispersive detector at a fixed position. However, correcting for non-hydrostaticity is an important and useful step because stress can lead to anomalous results (see for example, Duffy et al., 1999b, their Fig. 7 and discussion). While not perfect, our pressure correction does improve the quality of our data (Fig. 6), and allows the determination of an EoS despite the sometimes high differential stresses (Table 1).
Elastic parameters for olivines with Fe contents above 10% are rare, except for the fayalite end-member. Among these scarce data, the ones from Chung (1971) obtained from sound velocity measurements are the only ones showing a decrease of the bulk modulus with XFe, from ∼127 GPa for Fo to ∼121 GPa for Fa. KFo is near the average of the values for this mineral, whereas KFa is among the lowest ones, with Graham et al. (1988)'s. It is difficult to assert the exact reason for this trend, but the porosity of their samples (∼2%) and the small pressure range of these experiments (<1 GPa) could be of influence. We will therefore ignore these results together with Andrault et al. (1995)'s because of the high differential stresses in their amorphization experiments.
Comparing elastic moduli from different authors is difficult because different EoS or parameters can be used. Our volume–pressure data were fitted against a BM2 EoS to determine KT0 (Table 3) for the reasons listed in Section 3.3. In a recent study on the compressibility of fayalite, Zhang et al. (2017) found dK/dP = 4.0 ± 0.2 using a BM3 EoS with a fixed KT0 = 135 GPa, a result very similar to the BM2 bulk modulus of our specimen Fa100. One can also note that theoretical calculations on fayalite (Stackhouse et al., 2010) lead to KT0 = 139 to 151 GPa depending on the calculation scheme, values that are on the upper end of existing data, but still compatible with our own estimate.
Excluding fayalite, the only data for XFe > 30 are from Speziale et al. (2004) and Nestola et al. (2011). Both used a BM3 EoS and obtained different dK/dP. Therefore we recalculated our data with their respective dK/dP for comparison. Performing Brillouin scattering on a single crystal of , Speziale et al. (2004) found KT0 = 136 . 3 GPa and dK/dP = 4.88. Our values of KT0 for Fa82 and Fa100 obtained with the same dK/dP are 134.3 ± 1.8 (V0 = 304.65 ± 0.07 Å3) and 132.9 ± 1.5 GPa (V0 = 307.93 ± 0.06 Å3) respectively; they are very close to Speziale et al.'s results. In order to compare our results with a selection of data (Angel et al., 2017; Nestola et al., 2011; Speziale et al., 2004), we reported the KT0 of our four samples recalculated for dK/dP = 5.3 (Nestola et al., 2011) against XFe in Fig. 8 (all available previous KT0 can be found in the Supplementary Materials). Fig. 8 shows a possible non-linear trend of KT0 as a function of XFe, with values of KT0 reaching a plateau within about 20% Fe of the two solid-solution end-members and increasing linearly as 15 ± 4XFe for intermediate values. Despite being steeper than that of Liu et al. (2005) (see Eq. (1)), our slope is compatible with theirs within uncertainties. Of course, our selection of data underlines this trend, and the reader is encouraged to look at Fig. S4 in the Supplementary Materials for a more complete set of published KT0.
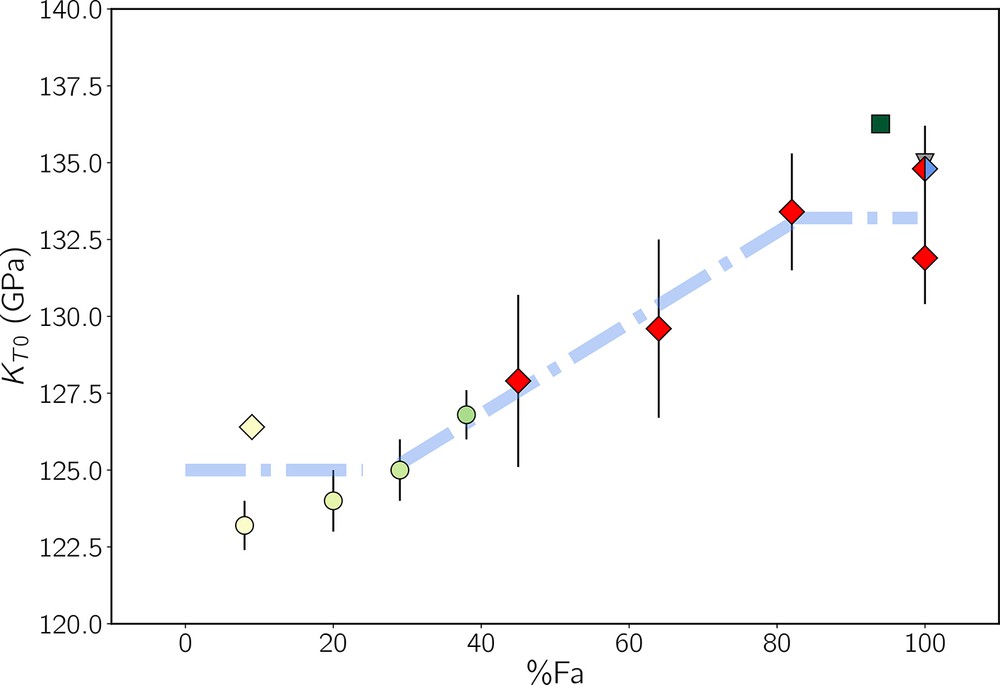
Selected values of the bulk modulus of olivines from the literature that show a possible trend for KT0 as a function of Fe content (blue dashed line). KT0 could present a plateau around 125 GPa for XFe ≲ 20% and around 133 GPa for XFe ≳ 80%, with a linear increase in between (slope ≃ 0.15 GPa/% Fa). Red diamonds are our KT0 values with dK/dP = 5.3 in order to compare with Nestola et al. (2011)'s data (green circles), and the red-blue diamond is our with dK/dP = 4 to compare with the results of Zhang et al. (2017) (grey down triangle). The yellow diamond represents data from Angel et al. (2017, from their BM3 isothermal EoS, dK/dP = 4.5), and the green square is from Speziale et al. (2004, dK/dP = 4.85). These two points would have lower values if recalculated with dK/dP = 5.3. A more complete figure with all published KT0 is given in the Supplementary Materials.
As we emphasized above, comparing bulk moduli from different studies is a delicate task, and KT0 values can shift depending on dK/dP. Consequently, deciphering the true XFe dependence of K and ever more so of dK/dP remains elusive. For example, recent studies on forsterite (e.g., Finkelstein et al., 2014, and references therein) and on olivines with XFe ≃ 10% tend to favor KT0 in the 125–130 GPa range with dK/dP close to 4. From their very precise measurements, Nestola et al. (2011) propose that KT0 = 124 . 7 ±0 . 9 GPa and dK/dP = 5.3 apply to all olivines up to XFe = 38%. A BM2 fit of V/V0 = f(PFa) of all the data from our four samples (Fig. 9) gives KT0 = 135 . 3 ±0 . 6 GPa, whereas with a BM3 EoS and a fixed dK/dP = 5.3, we obtain KT0 = 132 . 4 ±0 . 7 GPa. One cannot therefore completely rule out a linear trend of KT0 versus XFe as proposed by Liu et al. (2005), but if so, probably with a smaller slope.
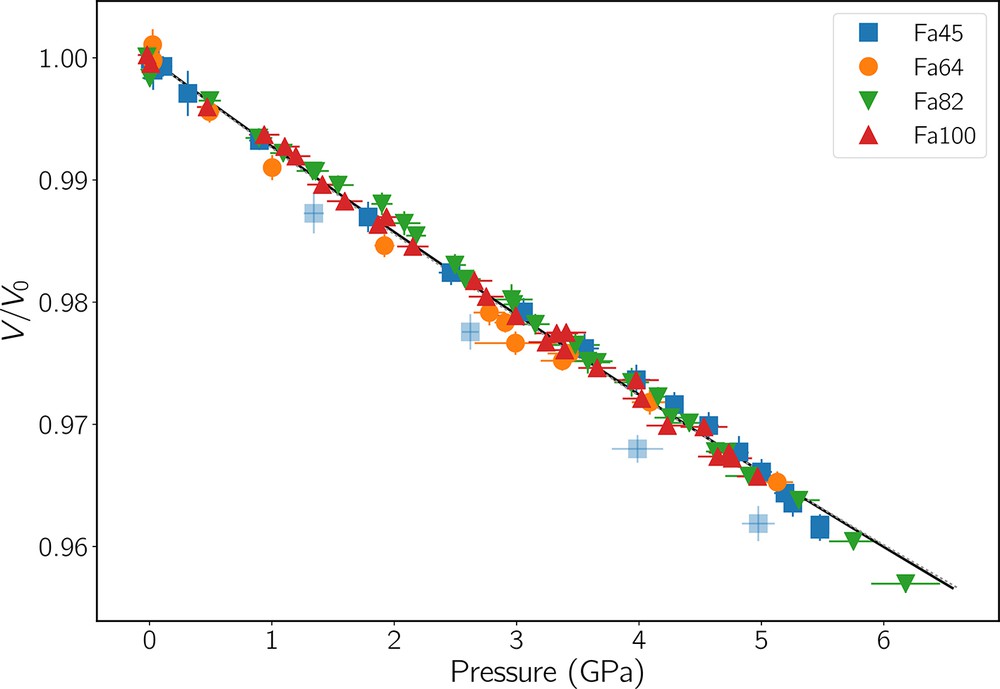
V/V0 as a function of pressure for all four specimens. Uncertainties are shown as one standard deviation. The black line shows the ODR fit of BM2 EoS to all data points and giving KT0 = 135 . 3 GPa. The barely visible dashed line is a BM3 EoS fit with a fixed K′ = 5.3 (Nestola et al., 2011) leading to KT0 = 132 . 4 GPa. The four light-blue squares (data from Fa45) were considered as outliers and excluded from the fit.
5 Conclusion
Despite the presence of differential stresses at high pressures in our experiments, applying Singh et al. (1998)'s analysis to our data in order to obtain unit-cell volumes under hydrostatic pressures allowed us to propose bulk moduli for four olivine samples with XFe ranging from 45 to 100%. These new data on Fe-rich olivines show that KT0 does increase with XFe, though maybe not linearly.
Deviatoric stress in elasticity experiments is not ideal but often unavoidable or unexpected. This approach permits robust estimates of the bulk modulus under non-hydrostatic conditions. Our study shows that heating the assembly to relax the specimen does not prevent the reoccurrence of stress during cooling. The preliminary analysis of our high-temperature data (to be presented elsewhere) even shows that a sample can be under compression during cold pressurization and under extension at high P and T, possibly as a result of the flow of the cell assembly at high T. Data analysis of rheology experiments too may necessitate the determination of KT0 during deformation, and this method may be of rescue for mineral phases with unknown elastic properties.
Acknowledgments
SPS sintering was performed at the “Plateforme nationale de frittage flash” (PNF2) of the CIRIMAT laboratory (Université Paul Sabatier, Toulouse, France). Electron microscopy was done with the help of C. Josse and A. Proietti, and electron microprobe analysis with the help of P. de Parseval and S. Gouy at the “Plateforme de microcaractérisation Raimond Castaing” (Université Paul Sabatier, Toulouse, France). High-pressure experiments were run at hutch X17B2 of NSLS (BNL), thanks to the support of COMPRES. FB and MB acknowledge the support of the French “Agence nationale de la recherche” (ANR), under Grant ANR-JCJC-SIMI6-LS-100197-01-R-01 (projet RHUM), and the CNRS INSU PNP program.