

1 Introduction
Morocco hosts numerous archaeological relics, such as ruins of ancient roman cities in the northern part of the country, and funerary mounds (also called tumuli), rocks engravings, ceramics and paintings (Belmonte et al., 1999; Brooks et al., 2009; Nami, 2008; Souville, 1959, and Nami et al., 2012). The available literature on prehistoric funerary monuments emphasizes that most of such sites are located south of the High Atlas, especially in the pre-Saharan and the Saharan zones (Bokbot, 2000).
Plant and animal species distributions are categorized as random, systematic, or clustered (Brandt et al., 1992; Goings, 2010). Most populations, including human, and their associated behaviors, are naturally clustered. The selection of particular sites for human activity in the prehistoric times was not random, but associated with specific characteristics of the natural environment and to factors related to human activity and human behavior norms (Balla et al., 2014). Therefore, it is commonly thought that prehistoric mounds were built in specific environments, and thus the probability of finding tumuli randomly is small. In the present research, we aim to establish which geo-environmental conditions were prevailing for funerary mound location in southern Morocco.
Over the last decade, the combination of remote sensing and Geographic Information Systems (GIS) opened new horizons and possibilities for archaeology. For instance, aerial photographs can be used to detect the surface imprints of subsurface relics (Haidar-Boustani et al., 2004; Rawlands and Sarris, 2007; Siart et al., 2008). Infrared and thermal electromagnetic radiations help detecting underground archaeological remains (Bewley et al., 1999; McCauley et al., 1982). High-resolution satellite images can also assist archaeology and heritage management (Pappu et al., 2010). Hence, remote sensing data have become a common tool of investigation, prediction, and forecast of archaeological site locations through the development of GIS-based models. However, these approaches have hardly been used yet in Moroccan archaeology (; Belmonte et al., 1999; Roeloffs et al., 2011; Linstädter et Blatt, 2013). Archaeological surveys in Maghreb regions including Morocco still generally use conventional methods such as field inventory, where local population testimonies play a key role to localize archaeological sites (Di Lernia, 2013; Galan et al., 2014). Such field surveys are time consuming, for they are supposed to survey large areas mostly on foot with teams of several people. When the areas are remote, this approach is especially difficult (Linstädter and Blatt, 2013). Morocco includes many remote areas with limited access, and thus locating archeological sites there is a critical challenge.
To overcome this situation, we present here an Archaeological Predictive Model (APM), which is GIS-based and uses geospatial techniques. This APM was developed in the Awserd area of southern Morocco and suggests the potential locations where tumuli may be found preferentially.
2 Geological setting
The study area covers about 1000 km2 in the southern Moroccan Sahara near the Moroccan–Mauritanian border in the province of Awserd (Fig. 1). The area is a typical desert dominated by low-relief landscapes and extended sandy deposits. This desert area straddles the Archean part of the Reguibat Shield of the West African Craton to the east and the Adrar Souttouf or Oulad Dlim massif to the west.
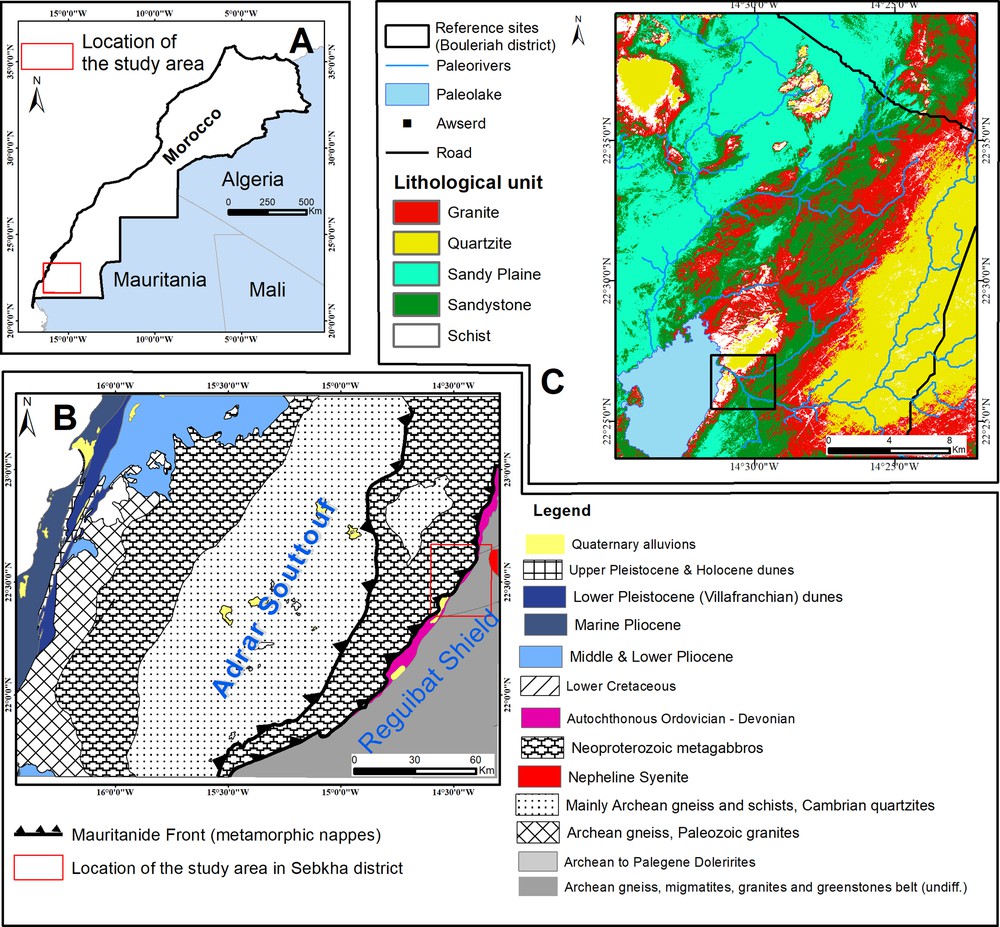
Study area map: location of Awserd region (A); regional simplified geological map (B) (Rjimati and Zemmouri, 2002); classified Landsat ETM+ image: band 1, band 3 and band 7 (C).
The southwestern Reguibat Shield domain is underlain by granites, orthogneiss, migmatites, and greenstones of Archean age, intruded by a number of mafic dykes, mainly Archean to Paleoproterozoic (Bea et al., 2013, 2014; Ennih and Liégeois, 2008; Potrel et al., 1996; Youbi et al., 2013). In the past 600 Ma, the outskirts of the craton were involved in the Pan-African and Variscan orogenic cycles, which resulted in the emplacement of the Adrar Souttouf (Oulad Dlim) segment of the Mauritanides nappes (Michard et al., 2010; Sougy, 1962; Villeneuve et al., 2006). The limit of the autochthonous Archean shield and the allochthonous Adrar Souttouf–Oulad Dlim units (Cambrian quartzites, Archean gneiss, Neoproterozoic metagabbros, etc.) is marked by a narrow corridor of autochthonous/parautochthonous Ordovician-Devonian sedimentary rocks.
The allochthonous terrains and their Precambrian basement dip westward under the Cretaceous–Neogene formations of the Tarfaya–Laayoune–Dakhla Basin (Hollard et al., 1985; Leprêtre et al., 2015; Rjimati et al., 2011). Quaternary deposits are of small thickness and consist of detrital sediments of various types that are often weakly consolidated. The geomorphological landscape is a peneplain with rare prominent reliefs composed of pseudo-cuesta, outliers and scattered hills or inselbergs, locally known as “Glebs”.
3 Data
In order to produce a predictive modeling of archaeological site location, a well-constrained dataset (later referred to as “reference site”) is first required to derive statistical empirical relations describing which environmental factors control the location of recognized archaeological sites. The reference site is an area where archeological sites and geo-environmental factors are well known and can be well described (Kohler, 1988), especially with remote sensing data. Once empirical relations are derived from the reference site analysis, they can be applied to anticipate the distribution of archeological sites in other places. The comparison of model results with actual observations in several sub-zones of a large “validation zone” (i.e. the larger zone of Fig. 1C) allows quantifying the model's robustness.
3.1 Archeological data in reference and validation zones
We conducted different field campaigns between 2014 and 2017 in the reference site zone (∼21 km2) (Fig. 1C) and were able to survey archeological site distributions and geo-environmental factors. We worked with small mobile teams of three people equipped with a handheld GPS, a tape measure, and a compass. The task involved taking GPS coordinates, size and orientation of every observed tumulus. Ultimately, we were able to cover the entire area of interest, i.e. the validation zone (∼1000 km2), and we identified 815 tumuli in this larger zone. However, there were some challenges such as cases of tumuli ransacked to the point that it was almost impossible to discriminate them from the background or sites where sand deposition was hiding most of the sites. We eventually built a GIS database with information on the archeological sites (name of the site, geographic coordinates, type of site, geometry of the site, type of raw material of the site, height of the archeological construction, etc.) and geo-environmental factors in the zone (see below). These data from the reference site were used to develop the predictive model.
3.2 Types of archaeological sites observed
The sites observed correspond to a variety of tumuli. The most predominant tumuli in the Awserd area are conical-shape tumuli with different versions including simple conical tumuli, oval conical tumuli, and circular conical tumuli. The conical tumuli are generally of small size compared to other kinds of mounds. Their diameter ranges from 3 to 25 m and their height from 0.2 to 3.5 m (Fig. 2a). However, the most mesmerizing type of tumulus is the “bazinat” tumulus, which displays two or three levels and has a large diameter of about 20 m. The tumuli were often associated with customized structures called chapels. The last type of tumulus found in the Saharan Morocco has long vertical stones whose length reaches 5 m (Fig. 2b and c). The tumuli with antennas are also frequent, and mainly formed by a central body whose form varies from ovoid, lenticular, elongated or even very elongated (Fig. 2d). Generally, the stony antennas are divergent from the sides of the main body and oriented toward the east, and the lengths of the antennas range from 2 m (minimum) to 250 m.
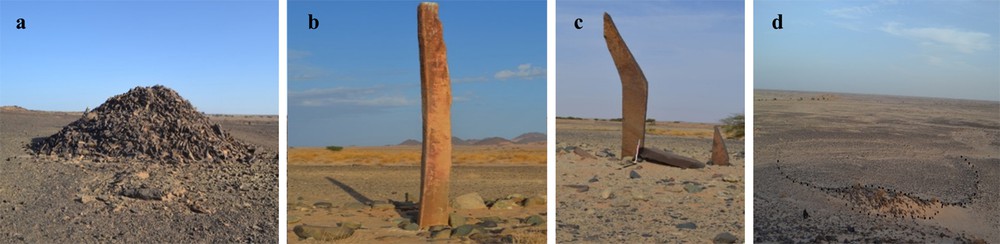
Tumuli in Awserd area: conical tumulus (a); long vertical stone tumulus (b and c); tumulus with antennas (d).
3.3 Topographic and morphological data
To analyze the topography of the zone, we have used different Digital Elevation Models:
- • a 1° arc-second SRTM DEM with a spatial resolution of 30 m and a vertical resolution of 10–20 m (from USGS website http://www.earthexplorer.usgs.gov/);
- • a GDEM V2 ASTER DEM with a 30-m spatial resolution and a 20-m vertical resolution (http://www.jspacesystems.or.jp/ersdac/GDEM/E/4.html);
- • a DEM generated through the digitization of contours and elevation points of a 1:50,000 scale topographic map. This DEM has a 10-m cell size and a 5–10-m vertical resolution.
After the assessment of all DEMs (see more details in Supplementary material SM1), the DEM obtained from digitization of the topographic maps was used as the basic layer of the terrain for further processing in this study.
3.4 Landsat ETM+ multispectral imagery
For geological unit identification, we used the Landsat 7 ETM+ multispectral image cover of the study area, with a spatial resolution of 30 (obtained freely from NASA database http://www.earthexplorer.usgs.gov/).
4 Methodology
The methodology flowchart summarizes the main techniques used (Supplementary Material SM2).
4.1 Geo-environmental variables
4.1.1 Slope
Slope is a direct function of topography (Canning, 2005). Ground slope is a basic parameter in archaeological modeling. The argument is that it is obviously difficult to erect an archaeological monument on steep ground (Mink et al., 2009; Siart et al., 2008). Furthermore, steep areas are highly exposed to erosion, and therefore not suitable to preserve funeral monuments. We thus measured the slopes in the area and included them in a layer of the GIS. Fig. 3 shows the tumulus distribution in the reference site as a function of slope.
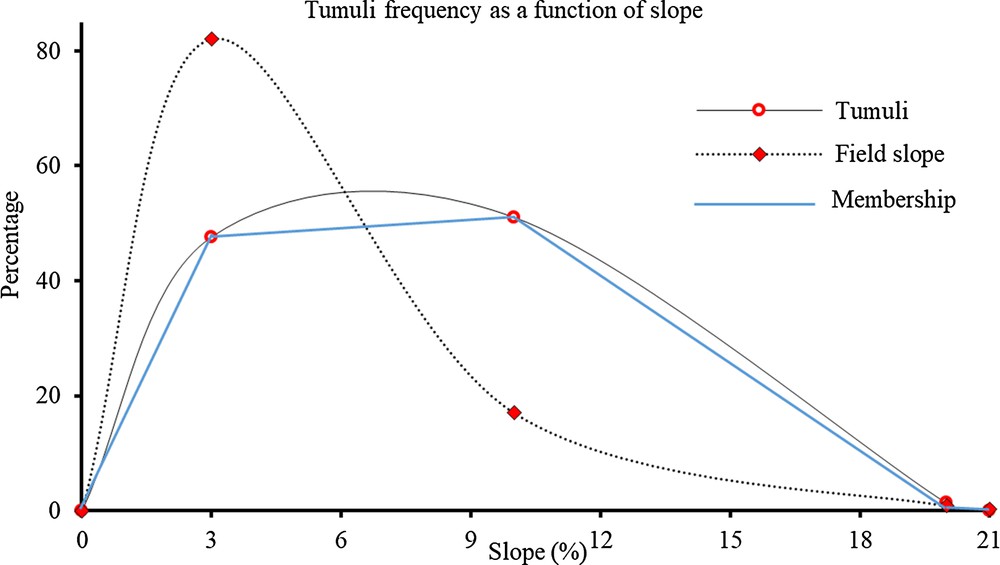
Tumuli location in relation to slope.
4.1.2 Lithology
To get a map of the lithological units in the reference zone, we processed the Landsat ETM+ image of the area using pan-sharpening, supervised classification, and band ratio techniques. Geological formations and sediments bearing raw materials were also identified using an existing geological map (Fig. 1). Landsat 7 ETM+ band 1, band 3 and band 5 were used to produce a composite color image. Crósta and Moore (1989) indeed showed that this band combination is the most effective to discriminate rock types in a semi-arid region. The combination of spectral and texture characteristics mixed with supervised classification using previous field investigations (reference site) were used to identify and map rock types in the area. From the Landsat image analysis, we recognized five lithological units, including quartzite, schist, granites, sandstones, and sandy plain. The accuracy assessment of the classified image was done through matrix confusion approach (Congalton, 1991; Foody, 2002). Overall accuracy was found to be 89%.
During the field survey, we observed that the spatial distribution of the tumuli was linked to the geomorphological setting and the petrographic nature of the rocks. Thus, while on the field we also distinguished the different types of substrates. The most important are alluvial cones, pediments, plains and river terraces, cuesta and plateaus, benches of valley slopes, dykes cutting through the flat ground surface, and Precambrian crystalline basement outcrops. Petrographic types of the mounds’ raw materials vary from one place to another and depend on the lithology of the geological substrates and neighborhoods. When the substrate is Precambrian, the most used stones are magmatic rocks (granites, dolerites, gabbro, and syenites) and associated metamorphic rocks (sericitoschist, light-grey quartzite, gneiss and migmatites). When the substrate consists of Paleozoic land covers, the most used stones are quartzite and sandstone, which are cut into slabs or plates that were used as steles in many tumuli. Therefore, availability of convenient raw materials was likely important for the erection of the archaeological structures (Diggs and Brunswig, 2009).
4.1.3 Aspect (orientation) of the ground surface
The aspect or orientation of a site controls how it is protected from sun and wind, thus giving an indication of the available shelter (Heilen et al., 2013; Kvamme and Jochim, 1989). The aspect was measured from the DEM using the “Aspect geoprocessing tool” of the ArcGIS software.
4.1.4 Topography (elevation)
Local elevation can be a measure of roughness and is important in dictating site location (Heilen et al., 2013). Elevation in the reference site ranges from 233 m to 367 m ASL and averages 250 m ASL; approximately four-fifth of the land within the reference site is below 300 m ASL.
4.1.5 Distance to water sources
Assuming that tumulus locations are linked to prehistoric settlements, water resources are another variable to consider for predictive modeling. Fresh water has always been a main factor for human occupation through space and history. The prehistoric population had to select the area at moderate distance from water sources (Yang et al., 2014).
4.2 Calculation of empirical relations in the reference site
4.2.1 Dependence of tumulus location to geo-environmental variables
The first step of model construction is to assess statistically all the geo-environmental variables cited above. The geo-environmental variables were tested in the reference site to identify whether there are statistically significant differences between the distributions of the tumuli and these variables (Kvamme, 1990). Layers of geo-environmental data are stored in 10 × 10 m raster grids in the GIS database. Each grid cell receives a value for every geo-environmental variable. The values of these variables at locations of known tumuli and their values across the entire study area are compared through the use of the Kolmogorov–Smirnov goodness-of-fit-test (Kvamme, 1990). This test examines the goodness-of-fit of a single sample to a referent population, and is appropriate for continuously distributed data, such as geo-environmental ones (Kvamme, 1990).
The distribution of tumuli according to a given variable is done by comparing the cumulative frequency difference between the number of tumuli observed and the assumed number of tumuli (if the distribution was random and homogeneous) in each interval within a class of each variable. The absolute difference of cumulative frequencies between expected and observed tumuli frequencies noted D shows how a given range of a variable is more or less suitable to host tumuli. The critical value of D is calculated using Eq. (1):
| (1) |
The absolute value of this difference allows us to validate one of two hypotheses:
- • null hypothesis (H0): the tumuli are distributed independently of geo-environmental variables;
- • alternative hypothesis (H1): the tumuli are distributed depending on geo-environmental variables.
Since the study used 233 sites as sample, the sample size n = 233 is greater than 50 and therefore the formula above can be applied for the determination of the critical value of D.
If the maximum absolute difference of the cumulative frequencies between the expected and observed site frequencies noted Dmax exceeds a critical value noted d, then hypothesis H0, stating that archaeological sites are distributed independently regarding geo-environmental variables, is rejected (Wheatley, 1995).
For instance, in the reference site, a slope ranging between 0 and 3% is found in 82% of the total area of the reference site. If the slope had no influence on the tumulus distribution, or if the tumuli were distributed randomly, this range of slope should host 82% of the tumuli, thus 192 tumuli out of the 233 existing. But only 111 tumuli (thus 47.76%) were found in the areas with slope lower than 3%. Therefore, D equals the absolute value of 0.4776 (observations) minus 0.8200 (expectations), which makes 0.347. The values of D within all ranges of slopes were computed. Since the maximum value of D mentioned above (Dmax) exceeds the critical value (d = 0.089) computed from Eq. (1), the tumuli are located with a variable dependence to the slope. We have applied the same approach to all geo-environmental variables. The results showed that all aforementioned variables have an influence on the tumulus distribution (see more details in Supplementary Material SM3).
4.2.2 Variable weighting
Since the APM is a multi-parametric model, the weighting of variables is a crucial step. The modeling begins with a statistical analysis of 233 tumuli in the reference site. This analysis proved that relationships exist between the tumulus distribution and the variation of the five geo-environmental parameters. These relationships are mathematically quantified. The sum of the cumulative differences D between the expected and the observed tumulus number was then used as a weight assignment (Voogd, 1982). For example, let us consider “slope” variable. We showed before that, for slopes lower than 3%, the value of D is equal to |47.64%–82.29%|, and hence 0.347. For the other slope ranges, we find that the value of D is 0.005 for slopes between 3 and 10%, 0.00 for slopes between 10 and 20%, and also 0.00 for slopes greater than 20%. The sum of all the values of D provide the weighting coefficient of the “slope” variable, thus equal to 0.347 + 0.005 + 0.00 + 0.00 = 0.35. The larger the weighting coefficient of a variable, the most important its influence on tumulus occurrence. We have thus applied this method to all model variables, and have then used the weights in the overlay fuzzy tool of ArcGIS. The highest weights have been found for the geological unit variable (weight coefficient of 0.55), the elevation variable (coefficient of 0.46), and the slope variable (coefficient of 0.35). By contrast, aspect (orientation) and distance to water sources have a low coefficient (0.11 and 0.14, respectively) (Supplementary Material SM2).
4.2.3 Fuzzy logic approach
It is not easy to demarcate natural features as they have rarely sharp boundaries (yes-/no-membership). Many features such as geological units, elevation and slope vary gradually from a type to the next across a transition zone (Kondolf and Piégay, 2005). Therefore, it is practically more suitable to model them using a fuzzy set concept with a degree of membership varying from 0 to 1 than using a binary logic concept. The concepts like “steep”, “close”, or “suitable” can be better expressed with degrees of membership to a fuzzy set than to binary (yes/no) classes (Kainz, 2015). Fuzzy logic is a branch of mathematics based on fuzzy set theory introduced by Zadeh (1965), in which the gradual assessment of the membership of elements in a set is permitted; this is described with the aid of a membership function valued in the real unit interval [0,1]. It is a many-valued logic with the truth values of variables that are real numbers ranging from 0 to 1 contrary to Boolean logic, where the truth values of variables may only be 0 or 1. Degrees of membership as values ranging between zero and one look similar to probabilities, which are also given as a value between zero and one. Someone can assume that fuzziness and probability are basically the same. However, probability gives an indication of the occurrence of an event, while fuzziness refers to what degree an element belongs to a class (or phenomenon) (Kainz, 2015).
The linear fuzzy membership function (μA (X)) of site distribution can be expressed by a linear function given by the following equation (2):
| (2) |
In the present study, the analysis of tumulus distribution curves in the reference site allowed us to determine the linear membership function according the aforementioned Eq. (2). For instance, take the case of the elevation variable: the distribution curve of the sites as a function of elevation (Fig. 4) was simplified as a linear function by applying Eq. (2) (Supplementary Material SM3).
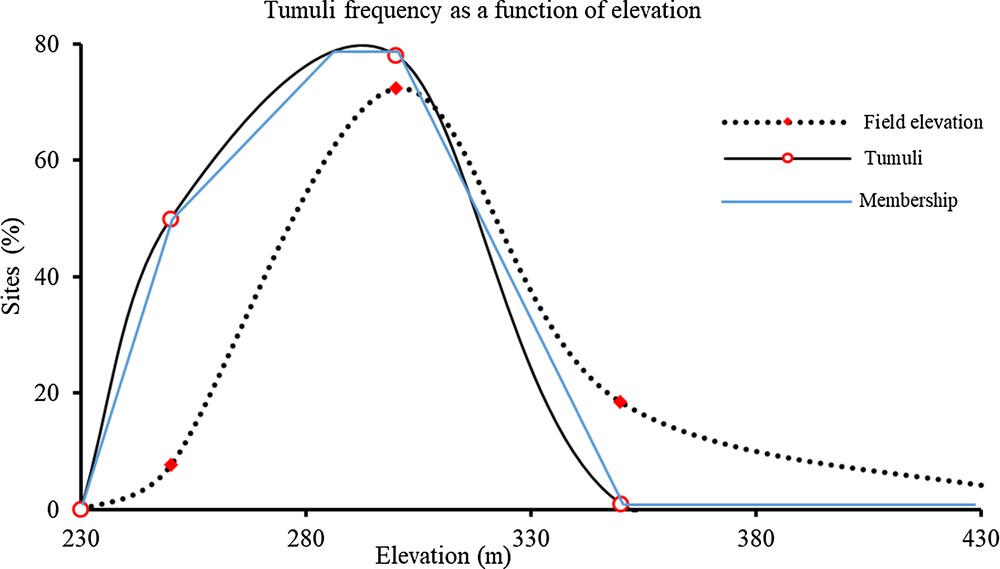
Tumuli location in relation to elevation.
Fuzzification is the process of changing real scalar values into fuzzy values. The fuzzy membership functions allowed us to transform variable raster scans into suitability raster layers. This means that the areas more suitable to host tumuli got values around 1, while areas less suitable got values of 0. Other areas got values varying between 0 and 1 according to their probability to host tumuli in regard of a given geo-environmental parameter. The membership function of every geo-environmental variable has been written then translated into GIS language by condition functionalities in the Raster Calculator (Supplementary Materials SM4). The output of this process is a fuzzified raster surface showing the site suitability with respect to one of the five model parameters (Fig. 5A–D). The predictive model was built by summing products of each variable with its weighting coefficient. In the fuzzy-based approach, the model was worked out by weighted fuzzy membership function tools of Arc GIS using Eq. (4).
| (3) |
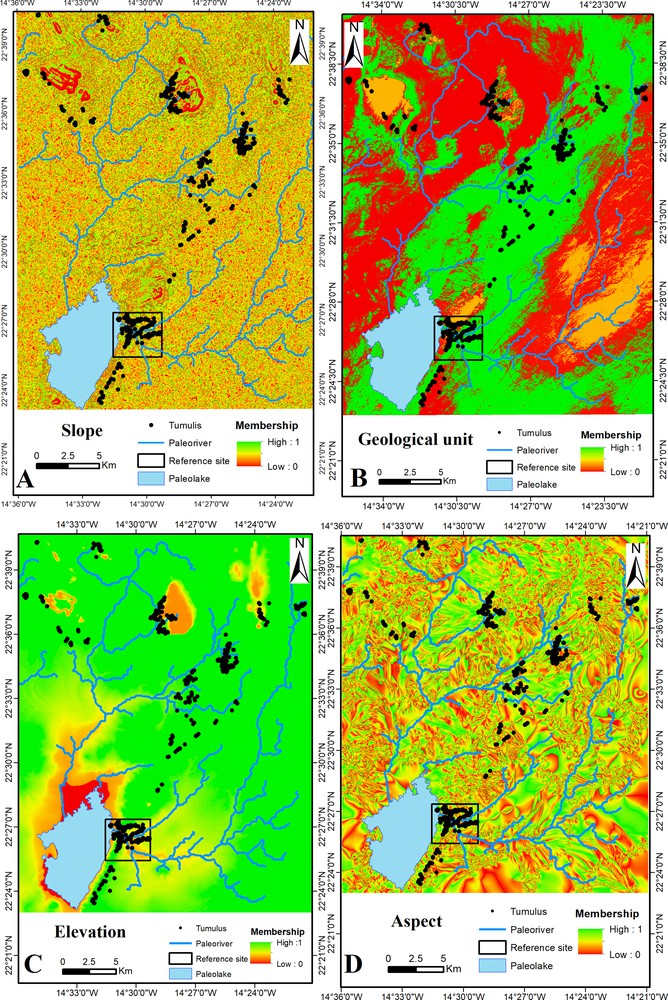
Partial maps of geo-environmental variables: slope (A); geology (B); elevation (C); aspect (D).
where APM is the Archaeological Predictive Model and Wi represents the weight index or the weighting coefficient (calculated in section 4.2.2); variables are fuzzy raster layers of geological units, slope, elevation, aspect, and distance to water sources.
Once weight coefficients are replaced into equation (3), the APM can be expressed as follows:
| (4) |
5 Results
5.1 Empirical relations in the reference site
The comparison between the slope and the tumulus distributions in the reference site reveals that 51% of the tumuli were built on slopes ranging between 3% and 10%, which represent 17% of the total area. About 48% of the sites were built on flat terrains with slopes between 0 and 3%, even though these flat areas represent 82% of the total area. No tumulus was found in steep zones with slope > 20%.
As noted by Diggs and Brunswig (2009), the availability of convenient raw materials for the erection of archaeological structures is a requirement for the occurrence of sites. The consolidated, hard and resistant rocks are most suitable for the construction of tumuli, which the reason why the areas with hard and resistant geological units including quartzite, schist, and granite are likely to host more tumuli than the zones rich in sandstones and sands. As a matter of fact, 68% of the tumulus population occurs in areas where quartzite, schist, and granite are present, even though these rocks barely cover 47% of the total area of the reference site.
A great concentration of prehistoric sites has been recorded in lands of low elevation, especially around the paleolake that exists in the southern part of the reference site. We found that almost half of the tumulus sites are located in areas below 250 m of elevation, thus in lowlands, whereas 28.33% of the sites are located in areas whose elevation ranges between 250 and 300 m, 21% occupy areas with an elevation between 300 and 350 m, and no sites exists in zones with an elevation higher than 350 m (Fig. 4).
The western-oriented areas host less tumuli than the other ones. The northern and eastern orientations are the most suitable for tumulus occurrence, as half of the total population occurs in such areas, even though they only cover 41% of the total region.
Finally, three-quarters of the tumuli are settled at less than 500 m from a potential prehistoric water source. Only 3.24% of the sites are located at more than 1 km from a potential water source.
5.2 Application of empirical relations to the “validation site”
Once empirical relations between tumuli and geo-environmental variables were established in the reference site, and their relative mathematical functions written, we extrapolated them to the validation zone, which covers a much larger area, ∼ 980 km2. About 57% of the tumuli observed in the large validation zone are located in flat lands with a slope lower than 3%, which cover 91% of the total area. Only 21% of the tumuli are found in lands with slope between 3 and 10% (6% of the total area). About 13% of the tumuli exist on lands with slopes between 10 and 20% (2% of the total area), while 8% of the tumuli are found on steep lands whose slope exceeds 20%, even though they occupy only 1% of the total area (Fig. 5A). About 38% of the tumuli occur on granite rocks (31% of total area of validation site). Schist rocks occupy 30% of the area and host 33% of the tumuli, quartzite rocks are present in 4% of the area and host 8% of tumuli, and sandstone and sandplain occupy 7% and 28% of the area, respectively, and host 7% and 14% of the tumulus population (Fig. 5B). We found no tumulus in areas below an elevation of 250 m (which represent 8% of the total area), and 49% of the tumulus population in areas with an elevation between 250 and 300 m (representing 76% of total area of the validation site). The areas with elevation between 300 m and 350 m cover 14% of the total area and host 49% of the tumulus population, while areas beyond 350 m elevation represent 2% of the total area and host 9% of the tumulus population (Fig. 5C).
5.3 Prediction accuracy of the model
Our model was developed based on statistics of 233 known tumuli in a sampling zone. After our model realization (i.e. prediction), we surveyed 582 additional sites in the validation zone.
According to Kvamme (1988), one can estimate the robustness of a predictive model by Eq. (5):
| (5) |
where G is the model gain, PS is the total area of high-potential zones, and OS represents the observed sites within the high-potential zones.
The model gain expresses the ability of the model to predict site locations with acceptable accuracy. The model gain ranges from 1 (high predictive model) to 0 (poor predictive model). Here, from Eq. (5), and model prediction data (Table 1), the calculated gain is 0.80: 44.50% of the observed sites have been found in the zones predicted as high-potential zones (representing only 9% of the total area, SM3). The gain of 80% is considered as satisfactory according to Kvamme (1988).
Predictive model gain.
| Zone potentiality | Area (%) | Number of sites | Sites (%) |
| Low | 44.74 | 129 | 22.16 |
| Medium | 46.24 | 188 | 32.30 |
| High | 9.02 | 265 | 45.54 |
| Sum | 100 | 582 | 100 |
6 Discussion
As noted by Clement et al. (2001), “The premise behind modeling is that historic and prehistoric peoples were closely tied to their natural and cultural environment, and that these environments were a significant determinant in their choice of site location.” Predictive modeling examines lithology, soil components, distance to water, aspect, elevation, and slope as potential natural variables. GIS tools were used for mapping, and additional analysis such as buffer zoning, neighboring computation and overlay analysis were used to construct a predictive model for prehistoric period in an effort to locate areas that could host tumuli. The specific predictive model was built based on the use of a multi-parametric spatial analysis method of geographic elements, statistical and archaeological information to construct maps of archaeological interest (Jacoli and Carrara, 1996; Van Leusen et al., 2005; Alexakis et al., 2011). Our model shows that the high potential areas to carry archaeological sites are located in the southern zones of the study area, in the Bouleriah district (Fig. 6). Other areas with high probability of carrying archaeological sites are located near small isolated mountains that occupy the central part of the study area along a NE–SW axis. The model provides a perspective on past occupation in southern Morocco; prehistoric populations occupied the zones with most favorable conditions in terms of geo-environmental factors. The proximity to the water sources played a major role in the determination of land suitability for humans through time.
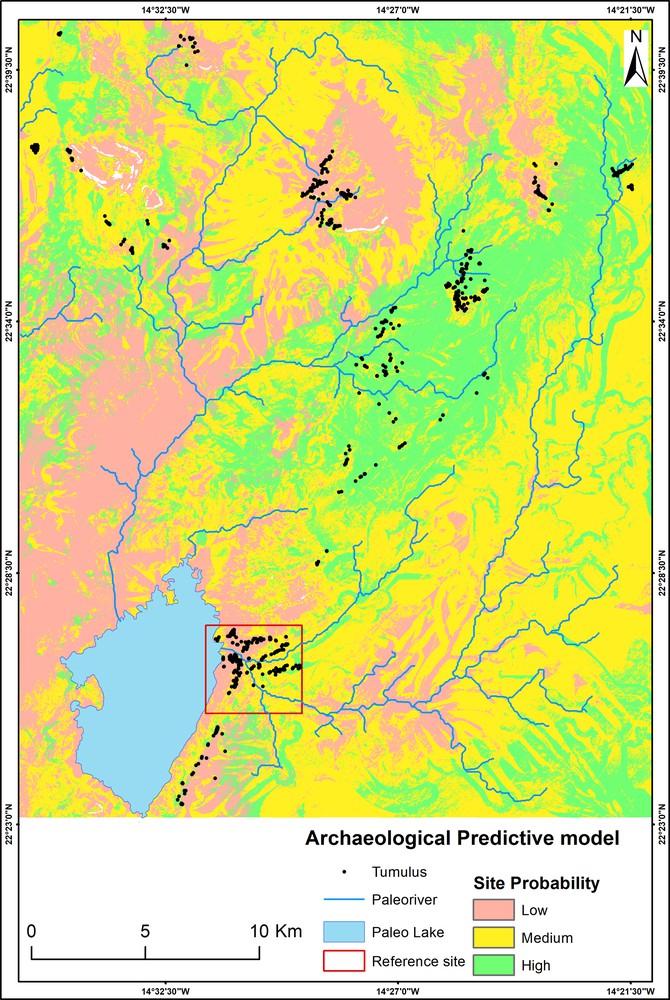
Archaeological predictive map of tumuli in Awserd.
Low slopes and low elevations have a high probability to carry archaeologic sites. This is intuitive, as most people would not live on steep slope or mountain summit (Fig. 7A). Tumulus distribution is also controlled by the lithological formations, as raw materials are essential for tumulus construction. It turns out that 90% of the tumuli were built on hard rocks (granite, quartzite, schist, and sandstones) against 10% built on soft rocks, especially in the sandy plain. Those were generally made of hard raw materials that had been moved from the neighborhood (Fig. 7B). Local elevation has a remarquable influence on the site distribution since more than half of total number of tumuli occur in the elevation range between 250 and 300 m (Fig. 7C). About 65% of the tumuli lay within 500 m distance from a water source and 99% of all the tumulus sites are within 1 km from water streams. Meanwhile, about 35% of the tumuli are located around a paleolake in the southwestern part of the study area (Figs. 6 and 7D). These results confirm that life always depends on water accessibily (Clark, 1944 cited by Mithen, 2010). However, it must be mentioned that very few tumuli were very close to water streams: only 14% of the tumuli were found within 100 m from a stream. This can be explained by the fact that populations did not dwell so close to rivers to avoid flooding because, in the prehistoric time, Sahara was very humid, with many river systems, lakes, and marshes (Tonkeul, 1972).
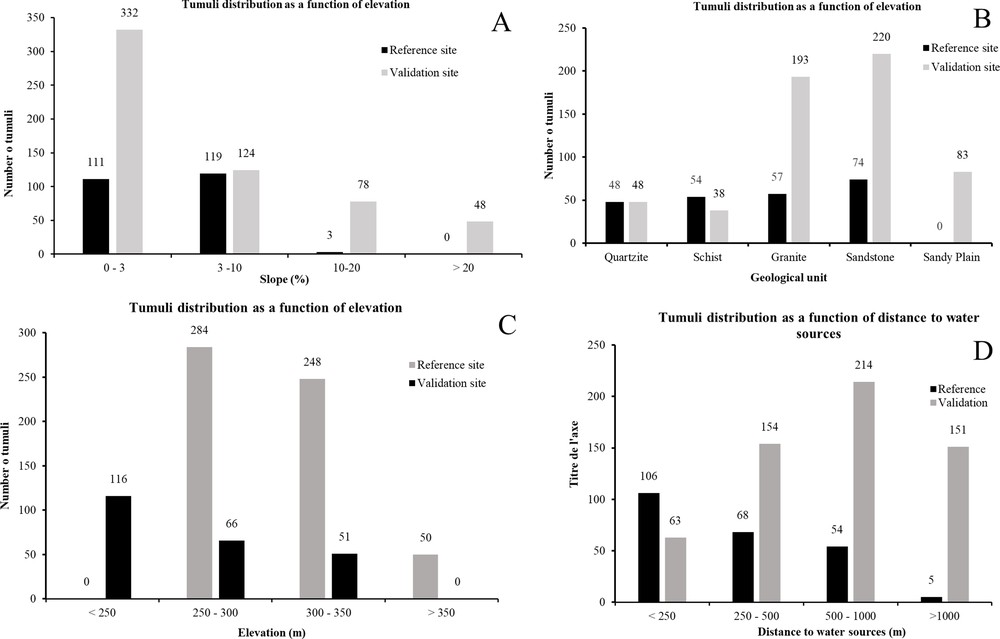
Tumuli distribution in respect to geo-environmental variables: slope (A); geological units (B); elevation (C); distance to water sources (D).
7 Conclusion
We presented a methodology to create an Archeological Predictive Model (APM) that can indicate areas with high potential for hosting archaeological sites. The methodology involves geospatial techniques, which are shown to be a useful and powerful tool for archaeological prospections since they reduce the area of interest for field prospections. Remote data and GIS software have a huge range of applications for archaeology, from recording a unique archaeological site, managing thousands of sites, and creating predictive models. In this study, the APM was used to predict archaeological site locations, based on the observed patterns and assumptions about the human behavior, and it was constructed through the combination of GIS tools, remote sensing data, and archaeological data. The methodology has been applied successfully in the Moroccan Sahara to identify the locations of funeral monuments, and it provided accurate predictions. It could certainly be scaled to larger areas and varied geographic settings, and hence become a useful guide for archeological studies in desert regions.
Acknowledgments
This study is a part of multidiscipline project named project “Atlas of the Cultural and Natural Heritage of the Province of Awserd” that aims to make a full inventory of all natural and archaeological heritage all over the Saharan provinces of Morocco. The project was directed by the Moroccan Association of Rock Art (AMAR) and “Association Nature Initiative” (ANI), in Collaboration with the Directorate of Cultural Heritage of Morocco. The authors wish to thank all teams, including diverse scientists, the “Association Nature Initiative” of Dakhla (ANI), the Awsard Province Administrative Council, and other persons who participated in the realization of this study. The authors are indebted to Abdelhamid Fadil and Mustapha Nami for their constructive reviews, and to André Michard and Isabelle Manighetti for their accurate editorial help.