

1 Introduction
Silicates comprise more than 90% of the Earth's crust and are thus one of the most fundamental and widespread mineral groups. Pressure-induced transformations of silicate minerals strongly affect the physical properties of the Earth's deep crust and mantle, controlling geological processes and geochemical variations. Hydrous silicates control the recycling of water and of other volatiles in the deep Earth, with implications for volcanism, volatile fluxes, and the buoyancy of subducted slabs in the Earth's mantle (Faccenda et al., 2012; Mibe et al., 2011; Wallace, 2005). Volatile cycles also impact aspects of planetary dynamics including mantle convection and partial melting.
Cyclosilicates have attracted considerable interest due to their unusual thermal expansion behavior, as well as the ability for the zeolite-like channels to contain a variety of large volatiles as molecular species (H2O and CO2, etc.). Dioptase is a copper cyclosilicate, Cu6[Si6O18]·6H2O, and crystallizes in a trigonal phase (R and Z = 1) with six-membered Si6O18 rings. Ribbe et al. (1977) described the structure as consisting of distorted trigonal rings of six water molecules in an ice-like configuration between similarly puckered trigonal rings of silicate tetrahedra coordinated laterally and vertically by Cu atoms (Frost and Xi, 2013). Distorted CuO4(H2O)2 octahedra share edges to form dimers and link the silicate rings into a three-dimensional framework (Fig. 1).
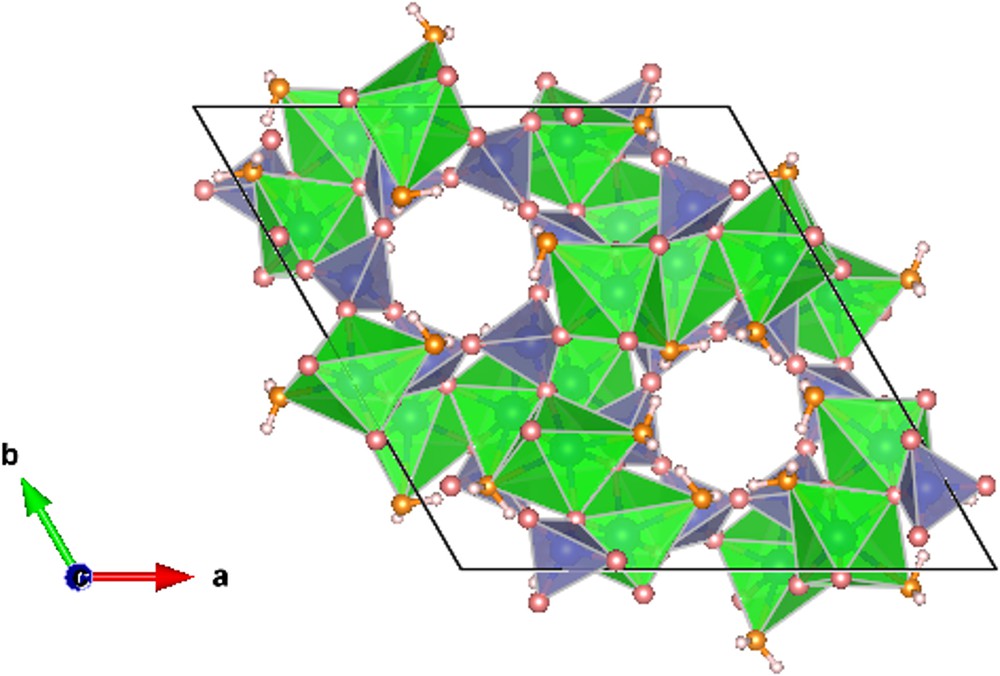
Crystal structure of dioptase. Blue-colored polyhedra represent SiO4 tetrahedra. Green-colored polyhedra represent CuO4(H2O)2 octahedra. The orange-colored spheres are oxygen atoms of the H2O molecules and grey-colored spheres represent oxygen atoms.
The crystal structure of dioptase was refined by Ribbe et al. (1977), followed by a detailed charge density study by Belokoneva et al. (2002). Breuer et al. (1989) and Breuer and Eysel (1988) found two high-temperature polymorphs, the first on heating to above 400 °C was called blue dioptase, and the second on further heating led to a dehydrated black dioptase, Cu6Si6O18, with closely related structure. The vibrational states of dioptase during the dehydration process have also been investigated using IR spectroscopy by Goryainov (1996). Frost and Xi (2013) studied the thermal decomposition of dioptase up to 1000 °C, resulting in a wide temperature range for loss of water (400–730 °C) and two mass-loss stages for losing oxygen (∼793 and 835 °C). Recently, dioptase has attracted attention as an antiferromagnetic material that exhibits strong quantum fluctuations in the system and reduced Néel temperature, TN = 14.5 K (Janson et al., 2010; Podlesnyak et al., 2016). Wang et al. (2015) studied the compressional behavior of single-crystal dioptase up to 11.7 GPa, resulting in KT = 107(6) GPa and K0′ = 3.4(1.2). Whereas most studies of dioptase have focused on the high-temperature decomposition of green dioptase and related magnetic properties, the elastic behavior and potential pressure-induced structural transformations require further study.
We investigated the compression behaviour of dioptase up to ∼30 GPa at room temperature in two separate diamond-anvil cell runs. A pressure-induced phase transition was observed by X-ray diffraction. High-pressure Raman spectroscopy experiment suggests that the transition is associated with dehydration. Knowledge of high-pressure dioptase crystal chemistry contributes broadly to our understanding of how silicate minerals containing water molecules behave under compression.
2 Experimental methods
Single-crystal samples of natural, gem-quality green dioptase were used for high-pressure diffraction and Raman spectroscopy experiments. The dioptase sample measured in this study has the same chemical composition as that of in Ruan et al. (2016), including 45.48% CuO and 42.33% SiO2 as well as some minor components MgO (0.23%), FeO (0.01%) and CaO (0.05%). The ratio of Cu to Si was estimated to be 1:1.08 using an energy-dispersive detector on the FEI Quanta 650 scanning electron microscope with an accelerating voltage of 15 kV and a beam current of 20 nA at Peking University. The results suggested that the chemical formula of the dioptase sample is close to Cu6[Si6O18]·6H2O.
A symmetric-type diamond anvil cell (DAC) and a short symmetric-type DAC fitted with Boehler–Almax diamond anvils were employed to approach the high-pressure conditions in both X-ray diffraction (XRD) and Raman spectroscopic studies. Rhenium gaskets were pre-indented by diamond anvils having 300 μm flat culets to a thickness of ∼35 μm. Holes were drilled to ∼170 μm in diameter and used as the chamber chambers. Single-crystal samples were polished on both sides down to ∼10 um thickness using 3 M™ diamond lapping films. A Pt foil was used for pressure calibration in XRD experiments, and a small Ruby sphere was for use as a pressure calibrant in Raman spectroscopic study (Fei et al., 2007; Mao et al., 1986). To achieve quasi-hydrostatic conditions, the cells were loaded with neon as the pressure-transmitting medium using the COMPRES/GSECARS gas-loading system (Rivers et al., 2008).
In run 1, high-pressure, single-crystal X-ray diffraction experiments were conducted at Beamline 13-BM-C of GSECARS (Sector 13) of the Advanced Photon Source (APS), Argonne National Laboratory (ANL). A monochromatic X-ray beam with wavelength 0.4340 Å was focused to a 15 × 15 μm2 spot, and the experimental details were described previously (Qin et al., 2017; Zhang et al., 2017). To obtain the adequate number of diffraction peaks of samples and increase the coverage of the reciprocal space, we collected data at four different detector positions. The diffraction images were analyzed using the ATREX/RSV software package (Dera et al., 2013).
In run 2, in-situ high-pressure single-crystal X-ray diffraction experiments on Beamline 13-ID-D used a monochromatic X-ray beam with a wavelength of 0.3344 Å and tightly focused to a 5 × 5 μm2 spot. XRD patterns were recorded with a MARCCD detector, and the exposure time was 10 s for each crystal diffraction pattern. DAC was continuously rotated from −10° to 10° (wide-scan mode) along the X-ray beam direction. The d spacings of independent diffraction peaks in single-crystal dioptase at various pressures were extracted by using the ATREX/RSV software package (Dera et al., 2013), and then the unit-cell parameters were refined using UnitCell software (Holland and Redfern, 1997). In order to maintain consistency, only the peaks appearing at all pressure steps were included for high-pressure lattice parameter refinements.
A fragment of the dioptase sample used in the XRD studies was also investigated with confocal micro-Raman spectroscopy at Northwestern University. High-pressure Raman spectroscopy was performed in a symmetric DAC with 300 μm culet ultralow fluorescence diamonds in a pressure medium of neon up to 22.5 GPa at room temperature. All analyses were performed in backscattering geometry using an Andor Shamrock 0.3 m spectrograph (1800 grooves/mm grating) coupled with an Andor Newton DU970 EM-CCD camera, an Olympus optical microscope and a long-working-distance Mitutoyo 20 × objective. The 458 nm line of a solid-state Melles Griot laser source with ∼300 mW output power was used for sample excitation. Laser intensity at the sample was ∼18 mW. Counting times were 20 s at 6 accumulations. The Raman peak positions were fitted using the software package PeakFit (Systat Software, Inc.).
3 Results and discussion
3.1 Structural variations of dioptase
In run 1, high-pressure single-crystal XRD data for natural dioptase were measured up to 26.0 GPa at room temperature. Fig. 2 (a, b and c) shows the single-crystal diffraction patterns at three selected pressures during compression (1.6, 14.8, and 26.0 GPa, respectively). Reflections from the dioptase crystal initially appear as sharp and round spots in the patterns and can be well indexed to the R structure. At 14.8 GPa, an abrupt change in the diffraction pattern was observed. Reflections from the crystal show diffuse scattering and appear as short streaks at pressures above 14.8 GPa. At higher angle, diffraction peaks become fainter with increasing pressure, making it difficult to determine the peak positions exactly (Fig. 2c). In run 2, high-pressure synchrotron XRD patterns for dioptase were collected up to 30.6 GPa at 300 K. Single-crystal diffraction patterns taken at 1.7 and 14.5 GPa in wide-scan mode are shown in Fig. 2d and 2e. The compression in run 2 duplicates the structural change observed in run 1. At 14.5 GPa, some new peaks become visible, adjacent to the main diffraction peaks (Fig. 2f). The d values of the new peaks are different from the characteristic peaks of dioptase, indicating that a structural modification of dioptase occurred.

Diffraction patterns of dioptase at selected pressures. Boxes are shown around the diffraction peaks that were used in the analysis. The expanded image of dioptase diffraction peaks at 14.5 GPa shown in (f) demonstrates the appearance of new peaks and the formation of a new phase. The very intense spots are from the diamond anvils. Diamond peaks and diffraction lines attributed to neon are not marked.
The integrated XRD patterns of dioptase in both runs are presented in Fig. 3. At the first pressure point, the diffraction peaks were sharp and distinct, and the volume can be comparable with those obtained at ambient conditions reported by Belov et al. (1978) using X-ray and neutron diffraction methods. With increasing pressure, all the diffraction peaks shift to larger 2θ values, as expected, and their peak intensities gradually weaken (Fig. 3). When the pressure exceeds ∼14 GPa, the most notable feature is the appearance of peak overlap and twin peaks at about 5.5°, 7.5°, and 15.0° (indicated by small arrow in Fig. 3), corresponding to the two-dimensional XRD patterns. The new peaks correspond to the dehydrated phase, black dioptase, Cu6Si6O18 (Breuer et al., 1989), thus we infer that green dioptase undergoes a pressure-induced dehydration phase transition at ∼14.5 GPa. With further compression to 30 GPa, no other phase transition was observed.
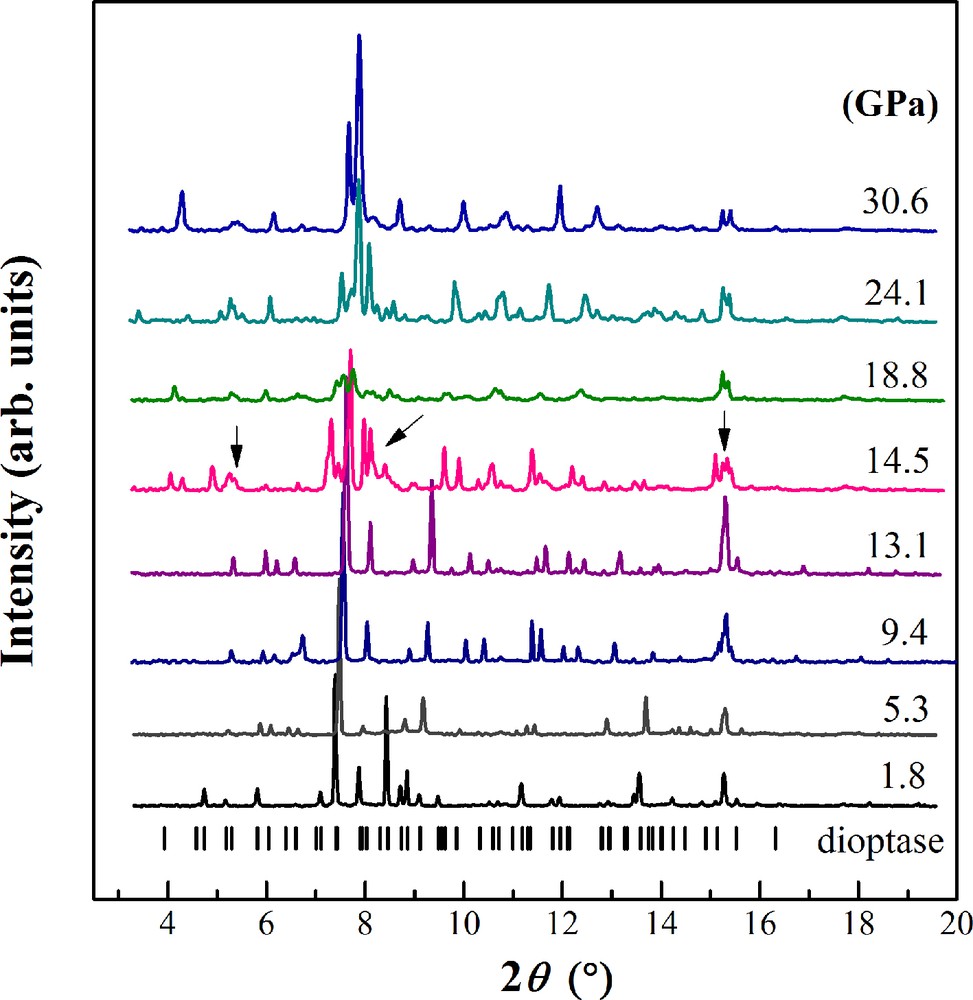
Integrated XRD patterns of dioptase at selected pressures in run 2. Backgrounds were subtracted from the original data. The calculated peak positions of dioptase are shown by small ticks.
3.2 Elastic behavior of dioptase
Lattice parameters and volume compression data for green dioptase from the two separate runs are combined in Fig. 4 and Table 1. The volume-pressure dataset up to 14.0 GPa were fitted to a third-order Birch–Murnaghan equation of state (BM3-EoS) using error-weighted least squares with EoSFit7c (Angel et al., 2014). The resulting BM3-EoS parameters are as follows: V0 = 1441(3) Å3, K0 = 103(9) GPa and K0’ = 4(1), which is about 0.8% larger than volume at ambient conditions (1429.9(5) Å3) measured by Belov et al. (1978) using X-ray and neutron diffraction methods, the difference in K0 is mainly due to the difference in experimental methods. We next performed BM2-EoS (K0’ = 4 implied) fit to the current dataset and yielding V0 = 1440(2) Å3 and K0 = 107(2) GPa. However, we could not determine the exact lattice constant of high-pressure phase dioptase above 14.5 GPa due to the limitations in quality of the diffraction peaks and limited angular access of the DAC. Furthermore, because of the structural similarity between green and black dioptase (dehydrated form), we could discern no significant difference in lattice constants.
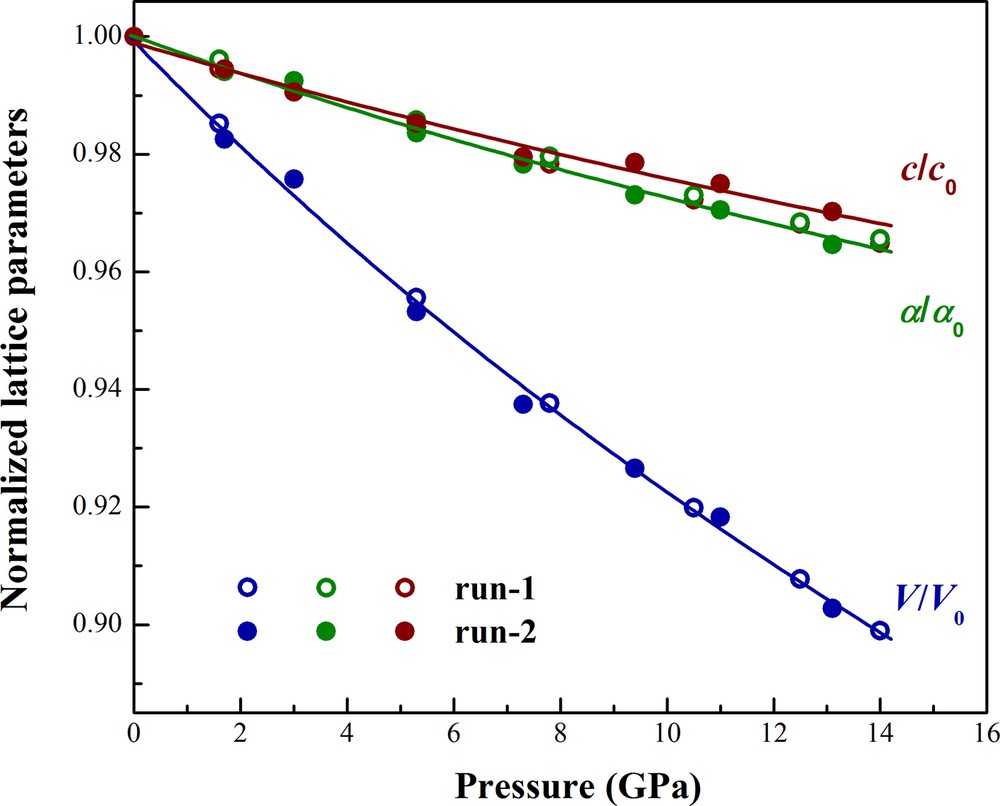
Normalized lattice parameters of dioptase as a function of pressure at room temperature. Second-order Birch–Murnaghan fits to the volume compression are shown by solid lines.
Lattice parameters of dioptase at various pressures.
| Pressure (GPa) | a (Å) | c (Å) | V (Å3) |
| 13BMC | |||
| 1.6 | 14.532(1) | 7.7649(7) | 1420.1(2) |
| 5.3 | 14.387(1) | 7.6837(7) | 1377.4(2) |
| 7.8 | 14.296(1) | 7.6363(6) | 1351.6(2) |
| 10.5 | 14.207(1) | 7.5855(6) | 1326.9(2) |
| 12.5 | 14.147(2) | 7.549(2) | 1308.4(4) |
| 14.0 | 14.099(1) | 7.527(1) | 1295.8(2) |
| 13IDD | |||
| 1.7 | 14.5246(6) | 7.7521(2) | 1416.3(1) |
| 3.2 | 14.5024(9) | 7.7217(3) | 1406.4(1) |
| 3.7 | 14.4919(9) | 7.7119(2) | 1402.6(1) |
| 5.3 | 14.3729(8) | 7.6799(2) | 1373.9(1) |
| 7.3 | 14.2951(9) | 7.6353(3) | 1351.2(1) |
| 9.4 | 14.2187(8) | 7.6283(2) | 1335.6(1) |
| 11.0 | 14.1807(8) | 7.6003(2) | 1323.6(1) |
| 13.1 | 14.0955(8) | 7.5628(2) | 1301.3(1) |
Axial compression data of green dioptase are plotted in Fig. 4. The axial compressibility of a and c in dioptase were fitted to a modified BM2-EoS, where in each axial dimension is cubed and treated as volume in the BM formulation (Angel et al., 2014; Xia et al., 1998). The zero-pressure axial compressibility of linear dimension l is defined as βl0 = −(l−1)(δl/δP)P = 0, which is related to the linear modulus (linear incompressibility) by Ml0 = (βl0)−1. Our fitted linear moduli to a and c are 306(11) and 340(19) GPa with an implied value for K0’ of 12, respectively, corresponding to axial compressibility values of βa = 3.3(2) × 10−3 and βc = 2.9(2) × 10−3 GPa−1 for dioptase. We find that the green dioptase exhibits anisotropy in axial compressibility with the a-axis appears more compressible than the c-axis (Fig. 4).
3.3 Raman spectroscopy
Raman spectroscopic data were obtained for the same natural dioptase sample up to a maximum pressure of 22.5 GPa. Raman spectra in the low-frequency (100–1100 cm−1) and high-frequency (3000–3700 cm−1) ranges are displayed in Fig. 5. Group theory analysis of green dioptase demonstrates that the total irreducible representation is Γ = 18Ag + 181Eg + 182Eg (Aroyo et al., 2006a, b). However, only a small number of active Raman modes could be observed due to the weak intensity, peak overlap and orientation dependence.
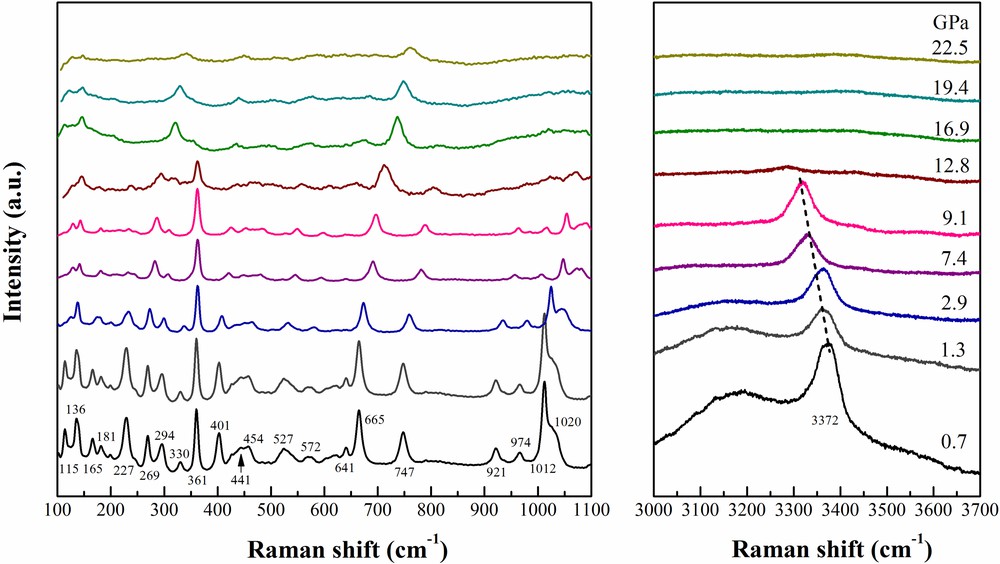
Selected Raman spectra of green dioptase at various pressures.
At 0.7 GPa, the Raman spectra are similar to those in the University of Arizona RRUFF database (Lafuente et al., 2015) #X050061. In the low-frequency region, all Raman modes show a continuous shift to higher frequency with increasing pressure (Fig. 5). Most of the modes resolved in this study are assigned to Si–O stretching or bending vibrations or ring distortions. The intense bands in the range of 200 − 500 cm−1 are assigned to the external vibrations of SiO4. Two strong peaks are located at 527 and 665 cm−1, which are attributed to the OSiO internal vibrations of SiO4. Four Raman modes observed at 748, 921, 974, 1012 cm−1 empirically arise from symmetric stretching of SiO. Notably, the vibration modes at 137, 165 and 181 cm−1 are assigned to Cu–O vibrations. The positions of these observed bands agree well with the infrared data reported by Goryainov (1996). Raman mode assignments are summarized in Table 2.
Results of linear regressions to the pressure dependence of observed vibrational modes (υi) in dioptase (green).
| Modes | ω0 (cm−1) | α (cm−1/GPa) | γ i | Assignment |
| υ1 | 116 | 1.4(2) | 1.29(2) | |
| υ2 | 136 | 0.78(5) | 0.61(4) | CuO |
| υ3 | 167 | 1.3(4) | 0.83(3) | CuO |
| υ4 | 180 | 4.1(7) | 2.44(4) | CuO |
| υ5 | 222 | 3.9(8) | 1.88(4) | SiO |
| υ6 | 267 | 2.09(4) | 0.84(3) | SiO |
| υ7 | 293 | 1.70(5) | 0.62(3) | SiO |
| υ8 | 333 | 0.54(6) | 0.17(3) | SiO |
| υ9 | 361 | 0.17(7) | 0.05(1) | SiO |
| υ10 | 399 | 2.90(5) | 0.78(1) | SiO |
| υ11 | 439 | 1.9(4) | 0.46(9) | |
| υ12 | 451 | 3.1(8) | 0.74(9) | SiO |
| υ13 | 525 | 2.67(7) | 0.54(4) | SiO |
| υ14 | 570 | 3.13(6) | 0.59(3) | SiO |
| υ15 | 638 | 0.9(5) | 0.15(1) | SiO |
| υ16 | 661 | 4.0(1) | 0.65(1) | SiO |
| υ17 | 744 | 4.9(2) | 0.70(1) | SiO |
| υ18 | 918 | 5.0(2) | 0.58(1) | SiO |
| υ19 | 966 | 4.9(5) | 0.54(1) | SiO |
| υ20 | 1010 | 4.3(5) | 0.46(1) | SiO |
| υ21 | 1024 | 4.8(9) | 0.50(1) | SiO |
| υ22 | 3378 | −8.0(10) | −0.25(2) | OH |
In the high-frequency range from 3000−3700 cm−1, there is an intense peak at 3372 cm−1 (FWHM: 58 cm−1), which is associated with the O–H stretching vibration of molecular H2O in the structure (Fig. 5). Previous infrared studies of dioptase reported the O–H band at ∼3363 cm−1 (Frost and Xi, 2013). Goryainov (1996) collected high-temperature infrared spectra, finding the O–H stretching vibration at 3420 cm−1 at 500–600 °C. In the current study, we observe the 3372 cm−1 band shifts to lower frequency with increasing pressure at a rate ∼4.3 cm−1/GPa and disappears abruptly between 12.8 and 16.9 GPa, indicating loss of H2O molecules in the structure.
With increasing pressure, the low-frequency Raman modes shift to higher frequencies and generally decrease in intensity (Fig. 5). Below ∼12 GPa, low-wavenumber region Raman modes remain sharp, except for the 665 and 750 cm−1 modes, which broaden significantly. Notably, the intense mode at ∼360 cm−1 has a slightly positive shift at a rate ∼0.2 cm−1/GPa under compression. The Raman spectra are significantly different at 16.8 GPa and higher, where many of the sharp modes have disappeared and the appearance of a new intense band at 320 cm−1 is observed. Between 16.8 and 22.5 GPa, the Raman spectra do not significantly change. Raman mode frequencies are plotted as a function of pressure in Fig. 6.
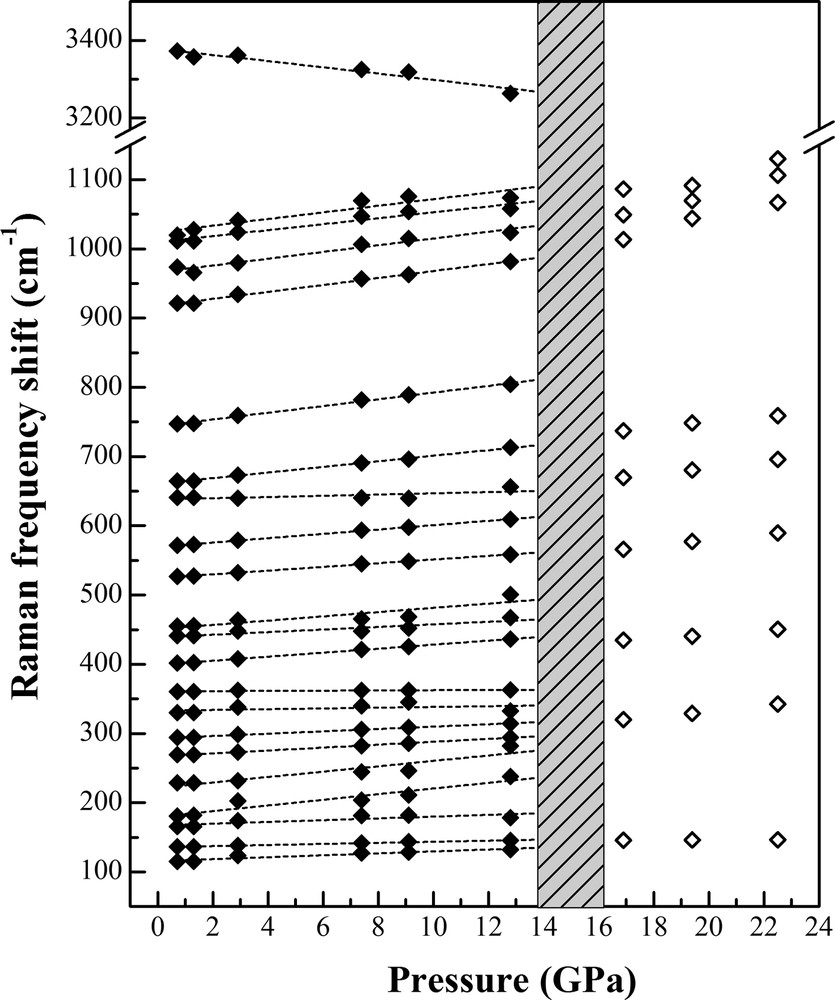
Pressure dependence of the observed vibrational frequency modes for dioptase. The grey-shaded region indicates the possible phase boundary between dioptase (green) and dehydrated dioptase (black). Solid lines were obtained using linear regressions, provided in Table 2.
4 Discussion
The high-pressure behavior of ring silicates has attracted interest due to their occurrence in subduction zone environments as well as their potential applications in having channeled structures. The compressibility of dioptase is compared with other hydrous cyclosilicates [Si6O18] in Fig. 7, including beryl (Al2Be3Si6O18), cordierite (Mg2Al3(AlSi5)O18), dioptase (Cu6[Si6O18]·6H2O) and tourmaline (NaMg3Al6Si6O18(BO3)3(OH)3F) (Fan et al., 2015; Miletich et al., 2014; Wang et al., 2015; Xu et al., 2016). Referring to Fig. 7, reported values of the bulk modulus K0 and pressure derivative K0′ of hydrous cyclosilicates range significantly, from 99 to 173 GPa for K0 and from 0.3 to 12 for K0′. The pressure derivative K0′ of dioptase found in this study is very close to 4 using the BM3-EoS fit, which is a typical value for silicates. There is a larger difference in K0 and K0′ between dioptase and other cyclosilicates, possibly due to the different incorporation mechanisms of H2O (e.g., H2O in dioptase and beryl, OH− in tourmaline) as well as different sizes of metal ions (CN = 6, Cu2+: 0.73 Å, Al3+: 0.535 Å and Mg2+: 0.72 Å) (Shannon, 1976). The ratio of zero-pressure axial compressibility in dioptase is 1.14:1.00 (βa: βc), which can be explained by the three-dimensional configuration of Si6O18 rings, Cu octahedra, and water molecules. The Si6O18 silicates and H2O rings form a vertical stack parallel to the c-axis, leading to a denser structure along the c-axis. In addition, the slightly higher compressibility along the a-axis may be caused by the configuration of water molecules and larger Cu2+ ions along the a-axis.
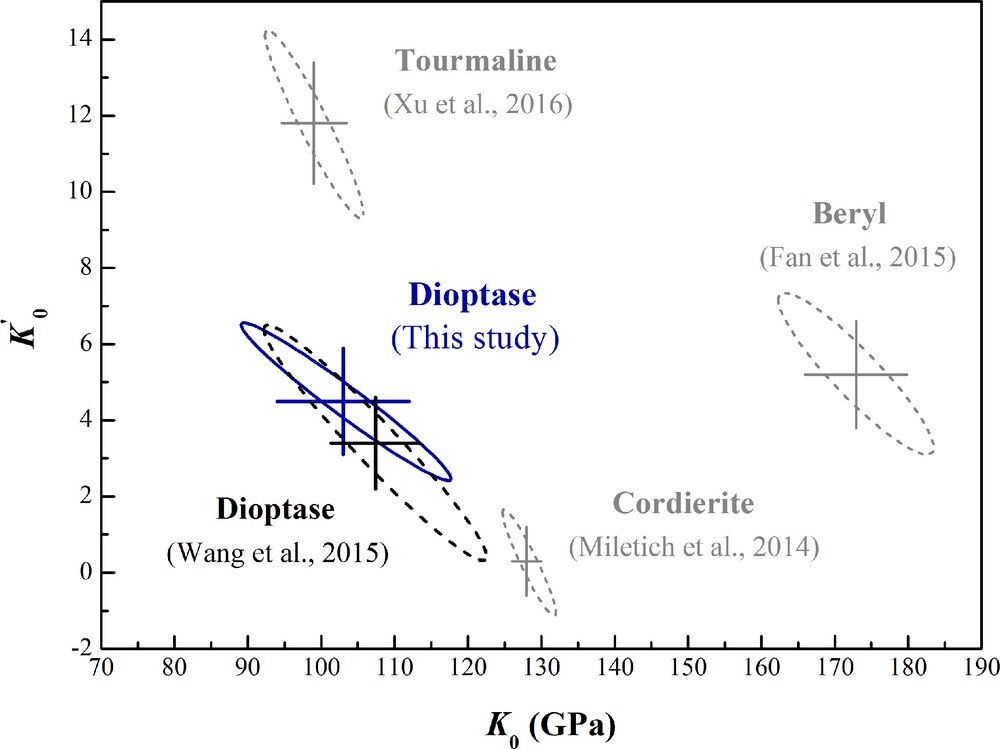
Isothermal bulk moduli and their pressure derivatives of some cyclosilicates, plotted as confidence ellipsoids at the 95.4% level.
Raman spectroscopy is a sensitive technique to probe the characteristics of cation–anion coordination groups. The pressure coefficients give quantitative comparisons for the changes of different vibration modes with pressure. Raman modes are assigned by comparing our results with previous studies, and the results are summarized in Table 2 (Goryainov, 1996). We observe about 22 vibrational mode frequencies (υi), compared with group theory calculations of 54 Raman-active modes. Mode frequencies were fitted linearly by ωi = ωi0 + αi × P, where ωi0 is the frequency of mode i at 0 GPa, αi is the linear pressure coefficient (∂ωi/∂P)P=0, and P is the pressure. Thus, the mode Grüneisen parameters (γi) can be calculated using γi0 = –∂(lnωi)/∂(lnV) = (KT0/ωi0)αi (Born and Huang, 1954). Here, K0 is the bulk modulus of dioptase, for which we used a value of 107(2) GPa from this study. The pressure coefficient values of the Cu–O bonds fall generally in the range from 0.78(5) to 4.1(7), which is attributed to the different vibration modes in the Cu2O4 polyhedron. The resulting average mode Grüneisen parameter of Cu–O bond is 1.29. Notably, as for the silicate-derived vibration in dioptase, the calculated γ is 0.61, which is a typical value for some hydrous silicates. The overall average mode Grüneisen parameter for the Raman bands is 0.67 (Table 2).
The single-crystal X-ray diffraction study of dioptase provides information on the evolution from green dioptase to its high-pressure phase (black or dehydrated dioptase). The transition pressure in this study was determined to be 14.5 ± 0.3 GPa and confirmed in two runs. Previous studies have found that natural green dioptase transforms to the black-colored (dehydrated) dioptase Cu6[Si6O18] between 400 and 800 °C (Breuer and Eysel, 1988; Breuer et al., 1989). In the present study, combined Raman spectroscopy and XRD data are used to infer a similar structural transition at high pressure. Additionally, Frost and Xi (2013) noted a two-stage mechanism for dioptase dehydration, which transformed into the blue polymorph first and then dehydrated to a black dioptase Cu6[Si6O18]. In this study, we found that the green dioptase transformed to the black dioptase at around 14.5 GPa and a mixed-phase region of green and black dioptase from 14.5 to 30.6 GPa was observed from the XRD results. However, we are not able to determine where and how hydrogen is located from the current methods, so the phase boundary between green, blue, and black dioptase is still unknown and requires further study.
The pressure-induced dehydration of dioptase likely contributes to the slightly unbending of Si6O18 ring silicate and shorter SiO bonds. The Cu–O distance could also be reduced, drawing the silicate rings together and closing the channels for water molecules (Goryainov, 1996). The evidence from density functional theory calculation also proved that the effect of pressure may lead to substantial reorganizations of the O–H network and modifications in the coordination environment as well (Brand et al., 2009). Similarly, it is expected that some hydrous minerals, may process the same appearance of dehydration at elevated pressures, such as kaersutite and gypsum (Comodi et al., 2012; Zhu et al., 2004). Since this phenomenon was induced by the departure of crystallization water in dioptase, and the probable removing water molecules may still exist in the sample chamber. Moreover, green-colored dioptase and black dioptase have attracted wide attention from the interplay between its crystallographic and magnetic properties. Two magnetic modes and prominent spin gap in green dioptase are consistent with the ground state of Cu moments coupled antiferromagnetically in spiral chains along the c-axis (Matsui et al., 2014; Podlesnyak et al., 2016). It can be expected that the transition from green dioptase to dehydrated black dioptase at high pressure also changes the magnetic properties of dioptase. Further studies of dioptase at high pressure are required to elucidate the pressure-induced dehydration mechanism and the black-dioptase structure at high pressure, as well as the associated physical properties.
5 Conclusions
In summary, a pressure-induced dehydration study of hydrous cyclosilicate dioptase was carried out using synchrotron-based XRD and Raman spectroscopy at pressures up to ∼30 GPa. The trigonal dioptase phase exhibits anisotropic compression with βa > βc. The overall average mode Grüneisen parameter for the Raman bands is 0.67. A high-pressure phase of dioptase was observed at around ∼14.5 GPa. From Raman spectroscopy, we infer that the structural variation is associated with a pressure-induced dehydration of dioptase to black dioptase, Cu6Si6O18. This study contributes to broadening our understanding of the high-pressure crystal chemistry of hydrous silicates containing water molecules.
Acknowledgement
This research was supported by the National Natural Science Foundation of China (41772034 and 41473056) and, in part, through a scholarship to F. Qin by the Chinese Scholarship Council. S.D. Jacobsen acknowledges support from the US National Science Foundation (NSF) through EAR-1452344 and the David and Lucile Packard Foundation. Work performed at GSECARS (sector 13) of the Advanced Photon Source (APS) is supported by the NSF EAR-1128799 and the Department of Energy (DOE) DE-FG02-94ER1446. The APS at Argonne National Laboratory is supported by the DOE, Office of Science, under Contract No. DE-AC02-06CH11357. Experiments at Sector 13-BM-C of the APS used the PX^2 facility, supported by COMPRES under NSF Cooperative Agreement EAR-1606856. We also thank S. Tkachev for gas loading the diamond cells.