

1 Introduction
Earth's upper mantle (i.e. the region between the Mohorovicic Discontinuity and the top of the transition zone) is primarily composed of olivine, garnets and pyroxenes (Ita and Stixrude, 1992; Ringwood, 1991). Within the transition zone (410–660 km), pyroxenes are dissolving into co-existing garnet producing majoritic garnet, and this continuous reaction, in turn, results in mantle densities and seismic velocities that steadily increase (e.g., Wood et al., 2013). However, in cold subducting slabs, pyroxenes may persist metastably due to remarkably slow rates of dissolution. Mierlo et al. (2013) found that at 1000 °C, it would take billions of years for pyroxene to dissolve into garnet, while at 1400 °C, it would take a few million years. Thus, most subducting slabs may contain a significant fraction of metastable pyroxenes within the transition zone. Metastable pyroxenes may add buoyancy to the slabs, slowing the rate of subduction, and trigger superdeep earthquakes (Agrusta et al., 2014; Hogrefe et al., 1994; King et al., 2015; Mierlo et al., 2013). Another process by which the mantle can vary in density is through structural changes of a phase at constant composition. Natural (Mg,Fe)SiO3 pyroxenes are typically found with orthorhombic symmetry, whereas monoclinic symmetry is thermodynamically stable at ambient pressures and temperatures (Angel and Hugh-Jones, 1994; Bowen, 1935; Burnham, 1971; Grover, 1972). With increasing pressure and temperature, (Mg,Fe)SiO3 pyroxenes undergo phase transitions to denser monoclinic and orthorhombic phases where the nature of these phase transitions depends on the composition. Sharp phase transitions in metastable pyroxenes may be responsible for seismic discontinuities, such as the Lehmann and “X” discontinuities (Deuss and Woodhouse, 2004; Li et al., 2014).
Woodland (1998) proposed that (Mg,Fe)SiO3 orthorhombic pyroxene undergoes a phase transition to a monoclinic structure at 300 km over an interval of 5–6 km, concluding that the phase transition occurs over a narrow enough depth interval to produce a seismic discontinuity. Li et al. (2014) investigated the relative stabilities of a variety of monoclinic MgSiO3 pyroxene phases at room temperature, finding that a Pbca to P21/c phase transition at 12 GPa results in a minor velocity increase (∼1.5%), while a Pbca to C2/c phase transition at 7.5 GPa results in a velocity jump of 2.8% and 4.5% for P and S waves, respectively. Zhang et al. (2013) conducted X-ray diffraction and nuclear resonant X-ray scattering experiments on (Mg0.87Fe0.13)SiO3, reporting a shear velocity decrease by ∼4% through the Pbca to P21/c phase transition between 10 and 12 GPa at room temperature. It is therefore important to characterize the pressure–temperature conditions of metastable phase transitions that occur in different mantle minerals due to their potential effect on mantle convection (Christensen, 1995; Schubert et al., 1975), rheological properties (Karato et al., 2001), and changes in the solubility of volatiles (Bercovici and Karato, 2003).
Although FeSiO3 pyroxene is unlikely to exist as a separate phase in subducting slabs, it can represent a significant component in natural pyroxenes, and thus characterizing its phase changes in pressure–temperature space provides insight into how pyroxene composition influences changes in pyroxene structure (and density) in subducting slabs. There have been several studies examining the high-pressure phase transitions in ferrosilite at room temperature. Hugh-Jones et al. (1994) observed that monoclinic FeSiO3 with space group P21/c transforms to a C2/c structure between 1.48 and 1.75 GPa. More recently, Pakhomova et al. (2017) observed a P21/c-to-C2/c phase transition in FeSiO3 between 1.3 and 3 GPa and another phase transition to a new P21/c phase between 30 and 36 GPa. There has been one high-pressure Mössbauer spectroscopy study examining the behavior of 57Fe in FeSiO3. McCammon and Tennant (1996) conducted conventional Mössbauer spectroscopy experiments on powdered monoclinic FeSiO3 ferrosilite to 4 GPa, observing a discontinuity in hyperfine parameters at about 1.5 GPa due to the P21/c-to-C2/c phase transition. In this study, we conducted single-crystal X-ray diffraction experiments up to ∼43 GPa and single-crystal time-domain Mössbauer spectroscopy experiments on monoclinic FeSiO3 ferrosilite up to 95 GPa. To distinguish the two P21/c phases, we adopt the nomenclature in Pakhomova et al. (2017) to denote the low-pressure and high-pressure structures as LP–P21/c and HP–P21/c, respectively.
2 Experimental methods
2.1 Sample synthesis
Monoclinic ferrosilite (“clinoferrosilite”) FeSiO3 was synthesized from a mixture of 57Fe2O3 (sourced from Isoflex) and SiO2 in a piston-cylinder apparatus. Puratronic SiO2 was ground using an agate mortar and pestle, and sieved to produce a size fraction of < 11 μm; both the fine-grained SiO2 and the 57Fe2O3 powder were dried at 125 °C in a vacuum oven for 2 h, weighed out to produce a mixture with a molar SiO2/57FeO value of ∼1.028, and ground by hand in an agate mortar under ethanol for ∼2 h (preliminary high-pressure experiments on a mixture with a molar SiO2/FeO ratio of ∼1.002 generated minor amounts of fayalite). The 57Fe2O3-SiO2 mixture was pressed into a 13 mm OD plug and reduced at 1100 °C and ∼2.9 log-units below the fayalite–magnetite–quartz buffer for ∼2 h in a Deltech gas-mixing furnace (the 57Fe2O3–SiO2 plug was placed on a pressed powder pellet of our earlier non-iron-enriched ferrosilite mix so as to avoid contact with the ceramic bucket). Following the reduction of 57Fe2O3 to 57FeO, the plug was lightly ground in an agate mortar and a split was loaded into a double capsule consisting of a high-purity-graphite inner crucible and a Pt outer capsule (0.15” OD, 0.005” wall). The loaded Pt capsule (with one end only partially closed) was dried for 3 h in a vacuum at 125 °C, after which the Pt capsule was welded shut. The 1.27-cm piston–cylinder assembly consisted of a CaF2 sleeve, straight-walled graphite furnace, and inner pieces of crushable MgO that had been dried at ∼1000 °C for 24 h. The temperature was monitored and controlled using a W97Re3/W75Re25 thermocouple encased in an Al2O3 ceramic sheath and no pressure correction was applied to the nominal emf. The top of the thermocouple ceramic was sealed with superglue and N2 gas was bled into the thermocouple plate during the experiment to prevent oxidation of the thermocouple wires within and just below the steel base plug. The assembly was pressurized to 3 GPa at room temperature and then heated to 1200 °C at ∼100 °C/min; the charge was held at 1200 °C for 16 h, at which point the temperature was increased to 1350 °C and held at this temperature for 128 h. Throughout the run, pressure was automatically controlled to within ±20 bars of the set point, and the experiment was quenched by turning off the power. After extracting the capsule from the assembly, it was sliced vertically using a wire saw, and one half was mounted in epoxy and polished for imaging and analysis. Based on SEM images and microprobe analyses of the sample (discussed below), the charge consists of crystals of ferrosilite (∼50–200 μm in length) with well-developed grain boundaries and trace amounts of a silica polymorph. The chemical composition of the synthesized ferrosilite was determined using Caltech's JEOL JXA-8200 electron microprobe. Analytical conditions were an accelerating voltage of 15 keV, a beam current of 400 nA, and counting times of 20 s on peak and 10 s on each background. Synthetic fayalite and forsterite were used as standards for Fe and Si, respectively, and the data were processed using a modified ZAF procedure (CITZAF; Armstrong, 1988). Based on an average of about 200 focused beam analyses, the composition of the ferrosilite is Fe1.98(1)Si2.04(3)O6 (here and throughout the text and tables, values in parentheses are one sigma in terms of the least units cited; e.g., 1.98 (1) represents 1.98 ± 0.01). Fayalite was not observed in scanning electron microscope images of the polished surface of the experimental charge, nor was it detected during the analytical microprobe session.
2.2 Single-crystal X-ray diffraction
A BX90 diamond-anvil cell (Kantor et al., 2012) with two beveled 250-μm culet Boehler-Almax diamonds mounted on Boehler–Almax-geometry seats (Boehler and De Hantsetters, 2004) was used in the single-crystal X-ray diffraction experiments. A sample chamber was created by drilling a 130-μm hole into a rhenium gasket that was pre-indented to a thickness of ∼50 μm. In order to load a high-quality crystal (i.e. a crystal that does not exhibit signs of stacking faults or twinning) into the diamond-anvil cell, we extracted several grains from the experimental charge and collected their X-ray diffraction patterns. A 15 × 20 μm2 ferrosilite crystal with a thickness of approximately 10 μm was selected and placed in the center of the sample chamber with two ∼10-μm ruby spheres. Helium was loaded into the sample chamber using the gas-loading system at the Advanced Light Source (ALS) of Lawrence Berkeley National Laboratory. After the sample chamber was loaded with helium, the gasket hole diameter decreased to ∼65 μm due to the high compressibility of He.
Single-crystal X-ray diffraction experiments were conducted at Beamline 12.2.2 at ALS as a function of pressure at room temperature. APEX 3 (Bruker, 2012a) was used for fitting diffraction peaks and refining lattice parameters and CELL_NOW (Bruker, 2012b) was used to index the unit cell. Dynamic masks were created using the program ECLIPSE (Parsons, 2010) to correct for regions on the detector that were shaded by the diamond-anvil cell. Absorption corrections were applied using the SADABS-2014/11 program and structures were solved using SHELXL (Sheldrick, 2008). A NIST ruby sphere was used to calibrate the detector position and these parameters were held fixed in the data processing. X-ray diffraction patterns were collected at 9 different pressures between 0 to 43 GPa, in intervals of about 5 GPa. The collection time for each measurement was approximately 1–1.5 h. Ruby pressures were determined from the pressure measurements immediately after collecting the X-ray diffraction patterns.
2.3 Single-crystal synchrotron Mössbauer spectroscopy
A standard Princeton-design symmetric diamond-anvil cell was used for the synchrotron Mössbauer spectroscopy (SMS) experiments. Two beveled diamonds with 250-μm culets on WC seats were used. A 50-μm thick pre-indented rhenium gasket with a 120-μm hole was used for the sample chamber. A 40 × 40 μm2 crystal with an approximate thickness of 10 μm was placed in the center of the sample chamber with two 10-μm rubies next to the sample. Helium was loaded into the sample chamber using the gas-loading system at GSECARS of the Advanced Photon Source (APS) of the Argonne National Laboratory. After the sample chamber was loaded with helium, the gasket hole diameter decreased to ∼70 μm.
Time-domain synchrotron Mössbauer spectroscopy measurements were conducted on the single crystal of ferrosilite at Sector 3-ID-B at the APS. The storage ring was operated in top–up mode with 24 bunches separated by 153 ns. A high-resolution monochromator was tuned to the 14.4125 keV nuclear transition energy of 57Fe with a FWHM of 1 meV (Toellner, 2000). The beam was focused to an area of 10 by 14 μm2 using a Kirkpatrick–Baez mirror system. The time spectra were measured with an avalanche photodiode detector, positioned ∼0.5 m downstream from the sample in the forward direction. A time window of 21 to 128 ns after excitation was used to observe nuclear resonant scattering and fit the data. Synchrotron Mössbauer spectra were collected between 0 and 95 GPa with an average pressure interval of 4.5 GPa. The average pressure drift during each SMS measurement was 0.8 GPa, determined from ruby fluorescence measurements taken before and after each spectrum was collected.
3 Results and Discussion
3.1 Single-crystal X-ray diffraction
3.1.1 Single-crystal X-ray diffraction results
The unit-cell parameters determined from single-crystal X-ray diffraction (XRD) experiments are reported in Table 1. We observe a phase transition from low-pressure (LP)-P21/c to C2/c between 0 and 1.67 (5) GPa and a phase transition from C2/c to high-pressure (HP)-P21/c between 29.1 (6) and 34.0 (6) GPa, where values in parentheses are one-sigma uncertainties in the last digit. The structures and phase transition pressures are consistent with those reported in Pakhomova et al. (2017). The ab and cb orientations of the structures are shown in Fig. 1 and the structural information is tabulated in Tables S1 and S2. The zero-pressure volume for the LP-P21/c structure is 436.62 (9) Å3, in good agreement with the zero-pressure volume of 437.70 (6) Å3 reported in Hugh-Jones et al. (1994), and slightly lower than the zero-pressure volume of 439.12 (4) Å3 given in Pakhomova et al. (2017). It is possible that the difference in zero-pressure volumes is due to different sample synthesis conditions and/or difference in Fe:Si ratio. The Fe:Si ratio reported in Pakhomova et al. (2017) is 1.93(3):2.03(3) while the Fe:Si ratio in this study is 1.98(1):2.04(3). Pakhomova et al. (2017) synthesized their ferrosilite crystals at 9.5 GPa and 1100 °C for 30 min, while Hugh-Jones et al. (1994) synthesized their ferrosilite crystals at 8.0 GPa and 1200 °C for 10.5 h. The ferrosilite crystals in this study were synthesized at 3 GPa at a temperature of 1200 °C for 16 h and 1350 °C for 128 h (see Section 2.1 for more details). It is possible that the pressure, temperature and duration of the synthesis has an effect on the Fe:Si ratio and the unit-cell volume. We note that our higher-pressure unit-cell data are also slightly and systematically offset below the values reported by Pakhomova et al. (2017) (Fig. 2).
Unit-cell parameters of FeSiO3 clinoferrosilite as a function of ruby pressure.
| P (GPa) | a (Å) | b (Å) | c (Å) | β (°) | V (Å3) | Space group |
| 0 | 9.692 (2) | 9.086 (2) | 5.2266 (4) | 108.429 (9) | 436.62 (9) | P21/c |
| 1.67 (5) | 9.559 (3) | 8.980 (3) | 5.0112 (5) | 103.14 (1) | 418.9 (1) | C2/c |
| 7.59 (5) | 9.412 (3) | 8.826 (3) | 4.9318 (7) | 101.81 (2) | 401.0 (1) | C2/c |
| 11.1 (4) | 9.346 (2) | 8.763 (2) | 4.8988 (6) | 101.42 (2) | 393.28 (9) | C2/c |
| 17.8 (3) | 9.256 (2) | 8.631 (2) | 4.8402 (6) | 100.88 (2) | 379.7 (9) | C2/c |
| 21.9 (2) | 9.210 (2) | 8.564 (2) | 4.8121 (5) | 100.66 (1) | 372.99 (7) | C2/c |
| 29.1 (6) | 9.149 (1) | 8.452 (1) | 4.7682 (3) | 100.420 (7) | 362.63 (4) | C2/c |
| 37.9 (5) | 9.171 (9) | 7.924 (8) | 4.604 (2) | 99.11 (5) | 330.4 (4) | P21/c |
| 43.1 (8) | 9.13 (1) | 7.82 (1) | 4.579 (3) | 98.81 (9) | 322.9 (5) | P21/c |
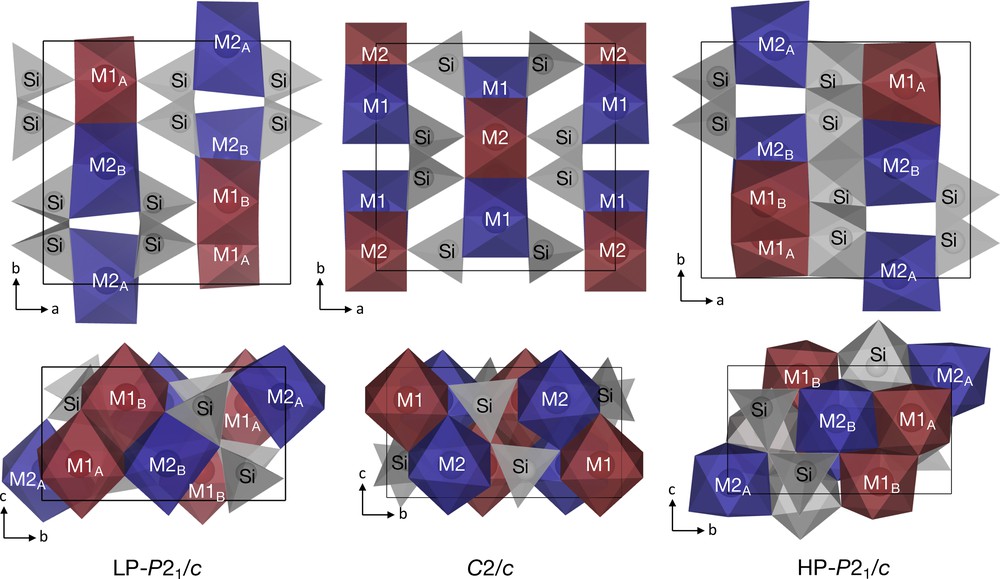
Crystal structures of the LP-P21/c, C2/c and HP-P21/c phases at 0, 17.8 (3) and 37.9 (5) GPa, respectively. FeO6 octahedra are represented by blue (M1) and red (M2) polyhedra, while SiO4 tetrahedra and SiO6 octahedra are represented by grey polyhedra. See Section 3.2 for details on nuclear sites, M1A, M1B, M2A and M2B.
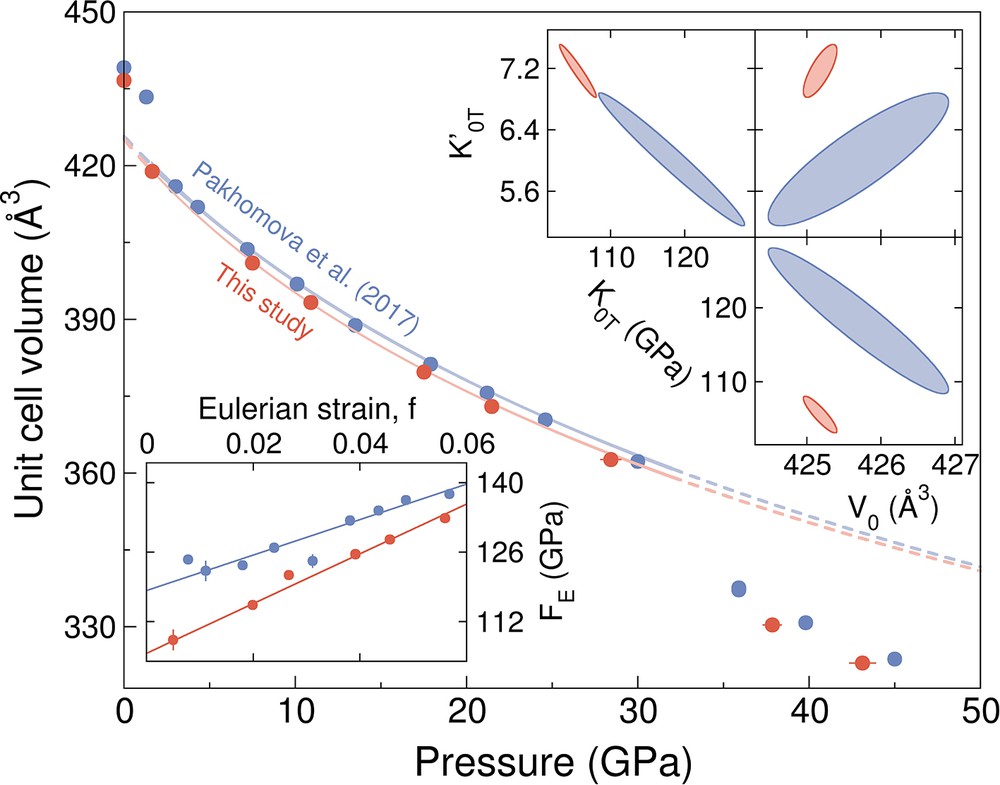
Main panel shows pressure–volume data for ferrosilite, FeSiO3 determined from single-crystal X-ray diffraction experiments in a helium-pressure medium using the Dewaele et al. (2008) ruby pressure scale (red symbols; this study). Ferrosilite has the LP-P21/c structure below about 1.5–1.7 GPa, the C2/c structure between 1.7 GPa and ∼32 GPa, and the HP-P21/c structure above ∼32 GPa. The ruby pressures in the Pakhomova et al. (2017) dataset were converted from the Mao et al. (1986) pressure scale to the Dewaele et al. (2008) pressure scale (blue symbols). A third-order Birch Murnaghan equation of state was fitted to the C2/c structure. Resulting error ellipses for the fitted equation of state parameters are shown in the top right insets. Bottom left inset shows the f–F plot with linear fits for the C2/c structure.
We fit a third-order Birch–Murnaghan equation of state (Birch, 1947) to our single-crystal XRD data for the C2/c structure with MINUTI 2.0.0 (Sturhahn, 2015); the results of the fit are shown in Fig. 2. We fitted the zero-pressure volume (V0), the zero-pressure isothermal bulk modulus (K0T), and the bulk modulus derivative (K′0T). The fitted zero-pressure isothermal bulk modulus (K0T) is 106 (2) GPa with a K′0T of 7.2 (2) and a unit-cell volume of 425.2 (2) Å3. Parameter correlations are reported in Tables S3 and S4. Error ellipses for V0 vs. K0T, V0 vs. K′0T and K0T vs. K′0T are shown as insets in Fig. 2. The F–f plot (i.e. normalized pressure (F) against Eulerian strain (f)) for the C2/c structure is also shown in the inset in Fig. 2. The F-f data can be fitted linearly with a nonzero slope, indicating that a third-order Birch–Murnaghan equation of state is appropriate. Consequently, the F-axis intercept corresponds to the fitted K0T, and a positive slope of the fitted line indicates that K′0T is larger than 4.
Pakhomova et al. (2017) used the gold and neon equations of state for three pressure measurements and the Mao et al. (1986) ruby scale for the remainder of the pressure measurements. In this study, we used the Dewaele et al. (2008) ruby scale for all our pressure measurements. For a systematic comparison, we converted the Mao et al. (1986) ruby pressures in Pakhomova et al. (2017) to Dewaele et al. (2008) pressures and refitted an equation of state to the pressure–volume data of ferrosilite with the C2/c structure from the single-crystal XRD study of Pakhomova et al. (2017). The resulting equation-of-state parameters are compared in Table 2. The fitted zero-pressure isothermal bulk modulus (K0T) is 118 (7) GPa with a K′0T of 6.0 (6) and a unit-cell volume of 425.7 (8) Å3. The difference in K0T may be a result of different synthesis conditions and/or pressure mediums. The larger K0T relative to our study is consistent with the observations made in a single-crystal study by Finkelstein et al. (2017) that a neon pressure medium may result in a larger K0T for the sample compared to experiments in a helium pressure medium.
Zero-pressure equation of state parameters for the C2/c ferrosilite, FeSiO3 phase.
| V0 (Å3) | K0T (GPa) | K’0T | |
| This study | 425.2 (2) | 106 (2) | 7.2 (2) |
| Pakhomova et al. (2017) | 425.7 (8) | 118 (7) | 6.0 (6) |
3.1.2 Phase transitions in (Mg,Fe)SiO3 pyroxenes
At ambient conditions, naturally-ocurring FeSiO3 exists as a P21/c monoclinic phase (Bowen, 1935; Burnham, 1971; Li et al., 2014) while (Mg,Fe)SiO3 pyroxenes with less than about 85-90 mol% FeSiO3 primarily exist in the orthorhombic phase with space group Pbca even though the P21/c phase is more thermodynamically stable (Grover, 1972; Angel and Hugh-Jones, 1994). At higher pressures, Mg–Fe pyroxenes undergo phase transitions to denser monoclinic and orthorhombic phases. The nature of these phase transitions and the pressures at which they occur depend on the iron concentration (Dera et al., 2013; Finkelstein et al., 2015). At 300 K, iron-free MgSiO3 with the orthorhombic (Pbca) symmetry was observed to undergo a phase transition to the C2/c structure at 13.4 GPa with Raman spectroscopy (Zhang et al., 2014) and to the P21/c structure at 12–14 GPa with powder X-ray diffraction (Li et al., 2014). Additional experiments on orthorhombic MgSiO3 are needed to resolve the discrepancy. Single-crystal X-ray diffraction experiments on monoclinic MgSiO3 with P21/c symmetry showed a phase transition to the C2/c structure at about 7–8 GPa upon compression and at about 5 GPa upon decompression (Angel et al., 1992). Room-temperature single-crystal X-ray diffraction experiments have demonstrated that orthorhombic (Mg,Fe)SiO3 with 8–10 mol% FeSiO3 undergoes a phase transition from the Pbca space group to a monoclinic structure with space group P21/c at about 12 GPa (Finkelstein et al., 2015; Zhang et al., 2012), and that, at about 30 GPa, the P21/c structure undergoes a phase transition to an orthorhombic structure with space group Pca21, which subsequently transforms to a third orthorhombic phase also with the Pca21 space group at about 40 GPa (Finkelstein et al., 2015). Orthorhombic (Mg,Fe)SiO3 with 82 mol% FeSiO3 undergoes a phase transition to the P21/c structure at 10 GPa, which transitions to a distinct orthorhombic phase with the space group Pbca at 12 GPa, persisting to at least 32 GPa (Dera et al., 2013). Pure FeSiO3 with both the monoclinic (P21/c) symmetry and orthorhombic (Pbca) symmetry undergoes a phase transition to a monoclinic phase with C2/c symmetry at about 1.5 and 4.2 GPa, respectively (Hugh-Jones et al., 1994, 1996; Pakhomova et al., 2017; this study). It should be noted that a phase transition in orthorhombic FeSiO3 was not observed up to ∼7 GPa with elasticity and Raman scattering measurements conducted by Kung and Li (2014). Monoclinic C2/c ferrosilite then undergoes a phase transition to a high-pressure monoclinic P21/c structure at about 32 GPa (Pakhomova et al., 2017; this study). See Fig. 3 for a summary of the room-temperature phase transitions in (Mg,Fe)SiO3 pyroxenes. Additional experiments are needed to determine how the pressures of the phase transitions are influenced by varying Fe concentrations.
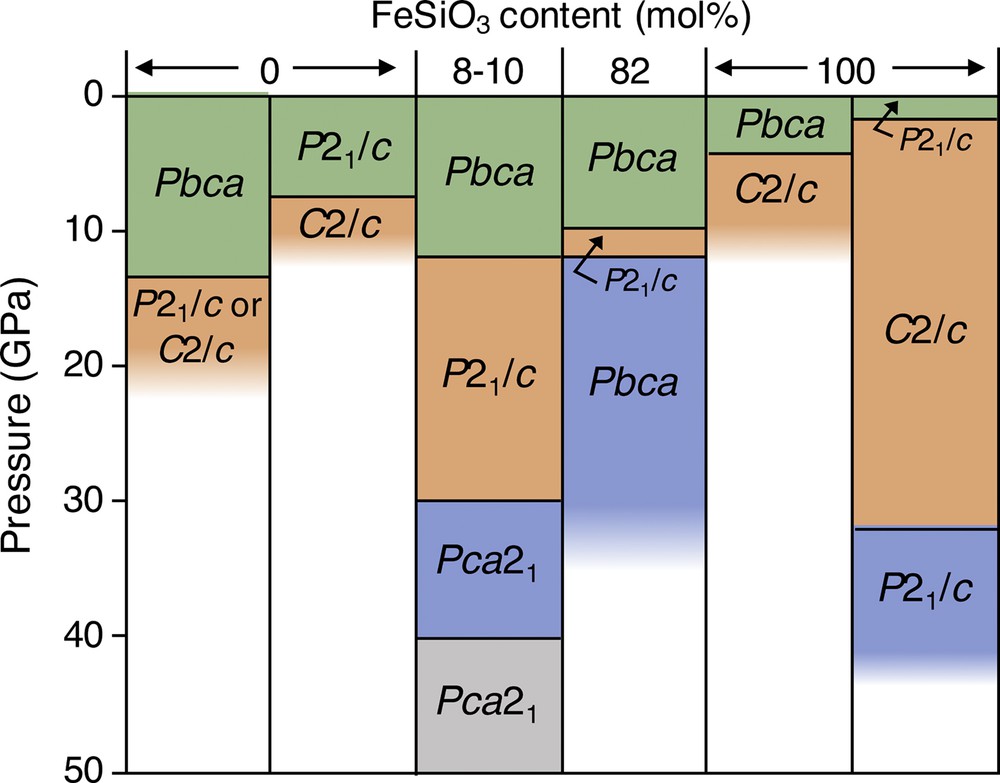
The effect of iron concentration on the phase transitions in (Mg,Fe)SiO3 at room temperature. The phase transitions in monoclinic MgSiO3 (Angel et al., 1992), orthorhombic (Mg,Fe)SiO3 with 8–10 mol% FeSiO3 (Finkelstein et al., 2015; Zhang et al., 2012), orthorhombic (Mg,Fe)SiO3 with 82 mol% FeSiO3 (Dera et al., 2013), orthorhombic FeSiO3 (Hugh-Jones et al., 1996) and monoclinic FeSiO3 (Hugh-Jones et al., 1994; Pakhomova et al., 2017; this study) were determined through single-crystal X-ray diffraction experiments. The phase transitions in orthorhombic MgSiO3 to monoclinic MgSiO3 with P21/c and C2/c symmetries were determined through powder X-ray diffraction (Li et al., 2014) and Raman spectroscopy (Zhang et al., 2014). A phase transition in orthorhombic FeSiO3 was not observed up to ∼7 GPa with elasticity and Raman scattering measurements (Kung and Li, 2014).
The effect of temperature on the phase transitions in ferrosilite has been explored up to about 8 GPa. At 300–1100 K, FeSiO3 with P21/c symmetry undergoes a phase transition to the C2/c structure between 2 and 5 GPa and at 1200–1600 K, orthorhombic FeSiO3 with Pbca symmetry undergoes a phase transition to the C2/c structure between 5 and 8 GPa (Woodland and Angel, 1997). Thus, the C2/c structure is favored above 2 GPa at 300 K and above 8 GPa at 1600 K. The subsequent phase transition of the C2/c structure to denser phases has not been investigated at high temperatures.
3.1.3 Structural changes in monoclinic FeSiO3 pyroxene
The LP-P21/c ferrosilite has the structure of low clinopyroxene (e.g., ferrohypersthene). It contains two types of FeO6 octahedra, one that is less distorted (the M1 site) and another that is more distorted (the M2 site) (Fig. 1). The M1 octahedra form edge-sharing chains parallel to corner-sharing chains of SiO4, while the M2 octahedra are situated within the kinks of the M1 chains. Furthermore, there are two types of symmetrically-distinct SiO4 chains. One chain shares only corners with the FeO6 octahedra while the other chain also shares an edge with the M2 FeO6 octahedra, further distorting the M2 octahedron. The LP-P21/c structure transitions to the C2/c structure between 1.5 and 1.7 GPa, where the pressure range has been constrained by our study combined with the studies of Hugh-Jones et al. (1994) and Pakhomova et al. (2017). Upon the phase transition, the two SiO4 chains become geometrically equivalent, such that none of the SiO4 tetrahedra share edges with the M2 octahedra, resulting in an increase in symmetry of the structure. At about 32 GPa, half of the SiO4 chains become octahedrally-coordinated, lowering the symmetry to P21/c. In the HP-P21/c structure, the M1 octahedra share one of their faces with SiO6 octahedra; as a result, the M1 octahedra are more distorted than the M2 octahedra. Additional structural information on the LP–P21/c and C2/c structures can be found in the studies of Hugh-Jones et al. (1994) and Thompson and Downs (2004), while a thorough description of the structural changes with pressure of the three phases can be found in the study of Pakhomova et al. (2017).
3.2 Single-crystal synchrotron Mössbauer spectroscopy
3.2.1 Single-crystal synchrotron Mössbauer results
The quadrupole splitting and isomer shift of the iron sites within ferrosilite were determined with time-domain synchrotron Mössbauer spectroscopy as a function of pressure. A quadrupole splitting results from an inhomogeneous electric field at the 57Fe nucleus. The electric field gradient is affected by an electron distribution in the valence shell and the long-range lattice environment with non-cubic symmetry. Thus, the quadrupole splitting yields information on local structure, valence, and spin state. An isomer shift arises from a difference in the s electron density at the nucleus in the sample relative to a reference material or a reference iron site within the sample. For single-crystal Mössbauer spectroscopy using synchrotron X-radiation, the orientation of the electric field gradient tensor of each iron site must be specified with respect to the direction and polarization of the X-rays using three Euler angles (α, β, and γ) according to the ZYZ convention of Rose (1957). The Euler angles were calculated using the CONUSS module, “kvzz” using the atomic positions and lattice parameters of each of the three ferrosilite structures, LP-P21/c, C2/c, and HP-P21/c. The canting angle (the angle between the X-ray polarization direction (σ) and the projection of the base vector [100] onto the surface of the crystal) defines the rotation of the crystal with respect to σ. The two crystallographic sites in ferrosilite are denoted as M1 and M2, corresponding to the smaller and larger octahedral volume, respectively. For LP-P21/c and HP-P21/c, the M1 and M2 sites produce a total of four nuclear sites distinguishable by their hyperfine fields, M1A, M1B, M2A, and M2B, due to two distinct orientations of each site. In the LP-P21/c and C2/c structures, the larger M2 sites are more distorted than the M1 sites. In the HP-P21/c structure, the larger M2 sites are slightly less distorted than the smaller M1 sites. The characteristics of iron's site environment, including size and distortion, are the primary determinants of the pressure at which it will undergo a high-spin-to-low-spin transition.
Synchrotron Mössbauer spectra collected on a single crystal of ferrosilite over a pressure range of 0 to 95 GPa are shown in Fig. 4 (the crystal was oriented with the (100) face perpendicular to the X-ray direction). The spectra were fitted with version 2.1 of the CONUSS software (Sturhahn, 2000), which uses a least-square algorithm to fit iron's hyperfine parameters (e.g., isomer shift, quadrupole splitting, and distribution of the quadrupole splitting expressed as the full width at half maximum) and the sample's material properties (e.g., effective thickness and relative weights of the crystallographic sites). The effective thickness is defined as the product of the volume density of the resonant nuclei, the nuclear resonant cross section, the Lamb–Mössbauer factor, and the sample thickness. The best-fit models are also shown in Fig. 4, and modeled energy-domain spectra for selected pressures are shown in Fig. 5.

Time-domain synchrotron Mössbauer spectra and the respective fits determined with the CONUSS software. The green spectrum corresponds to the LP-P21/c phase, the orange spectra correspond to the C2/c phase and the dark blue spectrum corresponds to the high-spin HP-P21/c phase. The light blue spectra correspond to the HP-P21/c phase with an increasing weight fraction of the low-spin iron site. Pressures and reduced χ2 are indicated to the right of each spectrum. Error bars for pressures and reduced χ2 are reported in Tables 5, 7 and 9.

Modeled energy-domain spectra using the best-fit parameters at selected pressures. The shaded and unshaded red curves are the high-spin M1A and M1B sites, respectively. The shaded and unshaded blue curves are the high-spin M2A and M2B sites, respectively. The shaded grey curve represents the low-spin iron site. Isomer shifts are relative to site M1A; the isomer shift of M1A has been centered at 1 mm/s for this figure.
At 0 GPa, the spectrum for LP-P21/c is fitted with four ferrous iron sites with equal proportions, where the quadrupole splitting values of the two M1 sites and the two M2 sites were set to be equivalent, resulting in two distinct quadrupole splittings, 2.589 (3) (M1A and M1B) and 1.977 (5) (M2A and M2B) (Table 3). The orientation of the electric field gradients of the two M1 and M2 sites will affect the relative line intensities. The Euler angles of the four sites are reported in Table 4. With increasing pressure, we observe several discontinuities of the features in the synchrotron Mössbauer spectra. The phase transition from LP-P21/c to C2/c, identified using single-crystal X-ray diffraction (Section 3.1.1), is observed between the compression points at 0 and 4.5 GPa. Between 4.5 and 31.0 GPa, the spectra of the C2/c phase show gradual changes. The C2/c phase requires three sites, M1A, M1B and M2, where M1A and M1B have identical quadrupole splittings with different isomer shifts (Table 5). Isomer shifts are reported relative to site M1A. The relative weight fraction of M1 to M2 sites was fixed to 50:50, while the ratio between M1A and M1B was fitted. The Euler angles for the electric field gradient of the two sites are reported in Table 6. All these sites have hyperfine fields characteristic of high-spin ferrous iron in octahedral coordination.
Best-fit hyperfine parameters for the low-pressure P21/c ferrosilite, FeSiO3 phase. The quadrupole splitting of the two M1 sites and the two M2 sites were set to be equivalent, whereas the isomer shifts are different. Isomer shifts are reported with respect to site M1A.
| Pressure (GPa) |
QS M1A (= QS M1B) (mm/s) |
QS M2A (= QS M2B) (mm/s) |
IS M1A – M1B (mm/s) |
IS M1A – M2A (mm/s) |
IS M1A – M2B (mm/s) |
Canting angle (°) |
Effective thickness |
Reduced χ2 |
| 0 (1 bar) | 2.589 (3) | 1.977 (5) | –0.11 (1) | –0.02 (1) | –0.04 (1) | 38.3 | 24.8 | 1.57 (9) |
Euler angles for the electric field gradient of ferrous iron sites in low-pressure P21/c ferrosilite.
| Fe2+ site | α (°) | β (°) | γ (°) |
| M1A | 359 | 81.9 | 101 |
| M1B | 0.88 | 81.9 | 79.1 |
| M2A | 330 | 17.0 | 299 |
| M2B | 29.7 | 17.0 | 241 |
Best-fit hyperfine parameters for the C2/c ferrosilite, FeSiO3 phase.
| Pressure (GPa) |
QS M1 (mm/s) |
QS M2 (mm/s) | IS M1A – M1B (mm/s) |
IS M1A – M2 (mm/s) |
Weight fraction, M1A/(M1A + M1B) |
Canting angle (°) | Effective thickness | Reduced χ2 |
| 4.5 (3) | 2.562 (5) | 2.555 (4) | –0.549 (3) | –0.169 (3) | 0.640 (5) | 70.5 (4) | 25.7 (2) | 2.5 (1) |
| 9.3 (5) | 2.613 (9) | 2.499 (7) | –0.473 (3) | –0.143 (5) | 0.727 (5) | 62.1 (6) | 29.4 (3) | 1.63 (9) |
| 13.7 (6) | 2.68 (1) | 2.427 (4) | –0.402 (4) | –0.065 (6) | 0.786 (6) | 52.2 (9) | 29.8 (2) | 1.53 (9) |
| 18.6 (3) | 2.63 (2) | 2.408 (7) | –0.420 (5) | –0.08 (1) | 0.813 (9) | 53 (1) | 29.8 (2) | 1.72 (9) |
| 24.0 (6) | 2.56 (1) | 2.396 (9) | –0.429 (7) | –0.122 (9) | 0.822 (7) | 58.7 (8) | 28.4 (3) | 1.56 (9) |
| 27.3 (5) | 2.55 (2) | 2.32 (1) | –0.428 (4) | –0.090 (8) | 0.792 (8) | 63.6 (9) | 25.9 (2) | 1.34 (8) |
| 31.0 (5) | 2.39 (1) | 2.330 (5) | –0.50 (1) | –0.009 (6) | 0.918 (3) | 56 (1) | 33.1 (2) | 1.60 (9) |
Euler angles for the electric field gradient of ferrous iron sites in the C2/c ferrosilite, FeSiO3 phase.
| Fe2+ site | α (°) | β (°) | γ (°) |
| M1 | 0.00 | 102 | 0.00 |
| M2 | 0.00 | 12.3 | 270 |
Between 31.0 and 35.1 GPa, ferrosilite undergoes a phase transition from C2/c to HP-P21/c. The high-spin HP-P21/c phase at 35.1 GPa required four high-spin ferrous iron sites to fit the data. The spectra of the HP-P21/c phase could no longer be fitted with the (100) orientation, and required the (110) orientation to produce a low reduced χ2. Above 35.1 GPa, a fifth iron site with hyperfine parameters corresponding to a low-spin ferrous iron site (i.e. one with zero quadrupole splitting) is required. The best-fit hyperfine parameters for the HP-P21/c structure are reported in Table 7, while the corresponding weight fractions and FWHMs are reported in Table 8. Between 40.3 and 73.5 GPa, the two smaller M1 sites gradually decrease in weight fraction as the low-spin ferrous site increases in weight fraction from 15 to 28%. The two larger M2 sites remain in the high-spin state up to 73.5 GPa. Between 73.5 and 78.7 GPa, the low-spin weight fraction sharply increases from 28 to 53% due to the spin transition in the M2 sites, where the weight fraction of each high-spin M2 site decreases from 25 to 14%. Between 78.7 and 95.1 GPa (the maximum pressure achieved), the total low-spin weight fraction gradually increases up to 67% and may be accompanied by another phase transition. The Euler angles for the electric field gradient of the four high-spin sites are reported in Table 9. The low-spin ferrous iron site is characterized by a symmetric electric field gradient and the Euler angles are not applicable.
Best-fit hyperfine parameters for the high-pressure P21/c ferrosilite, FeSiO3 phase.
| Pressure (GPa) | QS M1A (mm/s) | QS M1B (mm/s) | QS M2A (mm/s) | QS M2B (mm/s) | IS M1A–M1B (mm/s) |
IS M1A–M2A (mm/s) |
IS M1A–M2B (mm/s) |
IS M1A–LS (mm/s) |
Canting angle | Effective thickness | Reduced χ2 |
| 35.1 (7) | 2.35 (1) | 1.69 (2) | 2.23 (1) | 1.89 (4) | 0.35 (2) | 0.29 (1) | 0.33 (1) | – | 21.3 | 44.2 | 1.67 (9) |
| 40.3 (2) | 2.69 (3) | 1.14 (1) | 2.30 (3) | 1.53 (2) | 0.24 (2) | –0.12 (3) | 0.13 (2) | 0.94 (3) | 86.1 | 43.9 | 1.24 (8) |
| 43.8 (4) | 2.72 (2) | 0.95 (3) | 2.07 (3) | 1.68 (3) | 0.37 (2) | –0.03 (2) | 0.31 (1) | 0.94 (4) | 85.0 | 39.4 | 1.60 (9) |
| 48.0 (6) | 2.56 (6) | 1.40 (1) | 2.15 (1) | 1.66 (2) | 0.08 (1) | –0.22 (5) | –0.11 (2) | 1.00 (2) | 79.7 | 38.6 | 1.99 (1) |
| 52.0 (9) | 2.735 (7) | 1.48 (1) | 1.94 (4) | 1.67 (1) | 0.17 (3) | 0.05 (2) | 0.01 (2) | 0.98 (1) | 79.2 | 43.9 | 1.88 (9) |
| 57 (1) | 2.74 (1) | 1.34 (1) | 2.0 (2) | 1.74 (2) | 0.14 (9) | 0.14 (2) | 0.03 (2) | 0.96 (4) | 84.7 | 40.7 | 2.0 (1) |
| 61.8 (2) | 2.776 (7) | 1.34 (1) | 2.00 (6) | 1.85 (4) | 0.17 (7) | 0.11 (3) | 0.03 (3) | 0.893 (9) | 84.9 | 36.2 | 2.0 (1) |
| 64.7 (5) | 2.76 (2) | 1.34 (1) | 2.04 (5) | 1.83 (4) | 0.15 (4) | 0.12 (6) | –0.01 (2) | 0.858 (9) | 86.6 | 35.8 | 1.57 (9) |
| 69.4 (3) | 2.75 (2) | 1.36 (4) | 2.1 (1) | 1.7 (2) | 0.01 (4) | –0.02 (4) | 0.01 (2) | 0.72 (3) | 87.7 | 40.9 | 1.9 (1) |
| 73.5 (6) | 2.73 (1) | 1.29 (2) | 2.100 (9) | 1.76 (2) | 0.03 (1) | –0.02 (1) | –0.024 (4) | 0.75 (2) | 85.8 | 37.5 | 2.7 (1) |
| 78.7 (5) | 2.933 (9) | 1.11 (2) | 1.971 (5) | 1.16 (1) | –0.03 (2) | –0.05 (2) | –0.04 (3) | –0.02 (1) | 84.9 | 67.0 | 1.20 (8) |
| 83.3 (6) | 2.94 (1) | 1.06 (3) | 2.026 (7) | 1.12 (3) | 0.02 (1) | 0.005 (8) | –0.05 (1) | 0.07 (1) | 84.9 | 63.8 | 0.97 (7) |
| 88.8 (5) | 3.108 (9) | 1.09 (8) | 2.096 (7) | 1.24 (1) | –0.020 (4) | 0.076 (4) | –0.046 (6) | –0.013 (6) | 74.5 | 53.9 | 1.51 (9) |
| 95.1 (1) | 3.21 (3) | 1.1 (1) | 2.125 (9) | 1.36 (3) | 0.1 (2) | –0.1 (2) | –0.0 (2) | 0.1 (1) | 84.1 | 49.4 | 2.1 (1) |
Weight fraction and full width at half maximum (FWHM) of the quadrupole splitting determined from Monte Carlo searches for the high-pressure P21/c ferrosilite, FeSiO3 phase.
| Pressure (GPa) | M1A weight fraction (%) | M1A FWHM (mm/s) | M1B weight fraction (%) | M1B FWHM (mm/s) | M2A weight fraction (%) | M2A FWHM (mm/s) | M2B weight fraction (%) | M2B FWHM (mm/s) | LS weight fraction (%) | LS FWHM (mm/s) |
| 35.1 (7) | 25 | 0.01 | 25 | 0.01 | 25 | 0.01 | 25 | 0.01 | 0 | – |
| 40.3 (2) | 24.5 | 0.03 | 10.9 | 0.04 | 25 | 0.03 | 25 | 0.03 | 14.6 | 0.06 |
| 43.8 (4) | 22.7 | 0.04 | 10.4 | 0.06 | 25 | 0.06 | 25 | 0.05 | 16.9 | 0.11 |
| 48.0 (6) | 20.0 | 0.18 | 9.9 | 0.04 | 25 | 0.10 | 25 | 0.19 | 20.2 | 0.08 |
| 52.0 (9) | 17.9 | 0.21 | 7.2 | 0.05 | 25 | 0.31 | 25 | 0.17 | 25.0 | 0.05 |
| 57 (1) | 17.5 | 0.15 | 7.8 | 0.06 | 25 | 0.17 | 25 | 0.09 | 24.7 | 0.09 |
| 61.8 (2) | 18.2 | 0.09 | 8.0 | 0.05 | 25 | 0.17 | 25 | 0.05 | 23.9 | 0.08 |
| 64.7 (5) | 17.2 | 0.09 | 8.0 | 0.04 | 25 | 0.19 | 25 | 0.04 | 24.8 | 0.08 |
| 69.4 (3) | 16.3 | 0.04 | 6.8 | 0.02 | 25 | 0.10 | 25 | 0.05 | 27.0 | 0.16 |
| 73.5 (6) | 15.5 | 0.07 | 6.8 | 0.03 | 25 | 0.09 | 25 | 0.06 | 27.7 | 0.18 |
| 78.7 (5) | 15.5 | 0.02 | 3.1 | 0.12 | 14.3 | 0.10 | 14.3 | 0.12 | 52.9 | 0.04 |
| 83.3 (6) | 14.5 | 0.04 | 3.1 | 0.08 | 12.6 | 0.04 | 12.6 | 0.15 | 56.5 | 0.04 |
| 88.8 (5) | 12.7 | 0.12 | 2.5 | 0.09 | 12.1 | 0.11 | 12.1 | 0.23 | 60.3 | 0.14 |
| 95.1 (1) | 15.2 | 0.05 | 1.6 | 0.11 | 7.4 | 0.06 | 7.4 | 0.08 | 67.1 | 0.07 |
Euler angles for the electric field gradient of ferrous iron sites in the high-pressure P21/c ferrosilite, FeSiO3 phase.
| Fe2+ site | α (°) | β (°) | γ (°) |
| M1A | 4.79 | 67.4 | 19.8 |
| M1B | 355 | 67.4 | 340 |
| M2A | 52.4 | 52.1 | 122 |
| M2B | 308 | 52.1 | 57.6 |
The fitted quadrupole splitting values for the LP-P21/c, C2/c and HP-P21/c structures are shown in Fig. 6 as a function of pressure. The weight fraction of the high-spin and low-spin sites are shown in Fig. 7, demonstrating a discontinuous increase in low-spin population at about 38 and 76 GPa. The correlation matrices for the fitted hyperfine parameters for the LP-P21/c, C2/c and HP-P21/c structures are reported in Tables S5, S6, and S7, respectively. Due to the smaller number of iron sites, and thus, hyperfine parameters for the C2/c structure, it was possible to fit the effective thickness (Table 5), whereas in the P21/c structures, the effective thickness was determined through Monte Carlo searches.
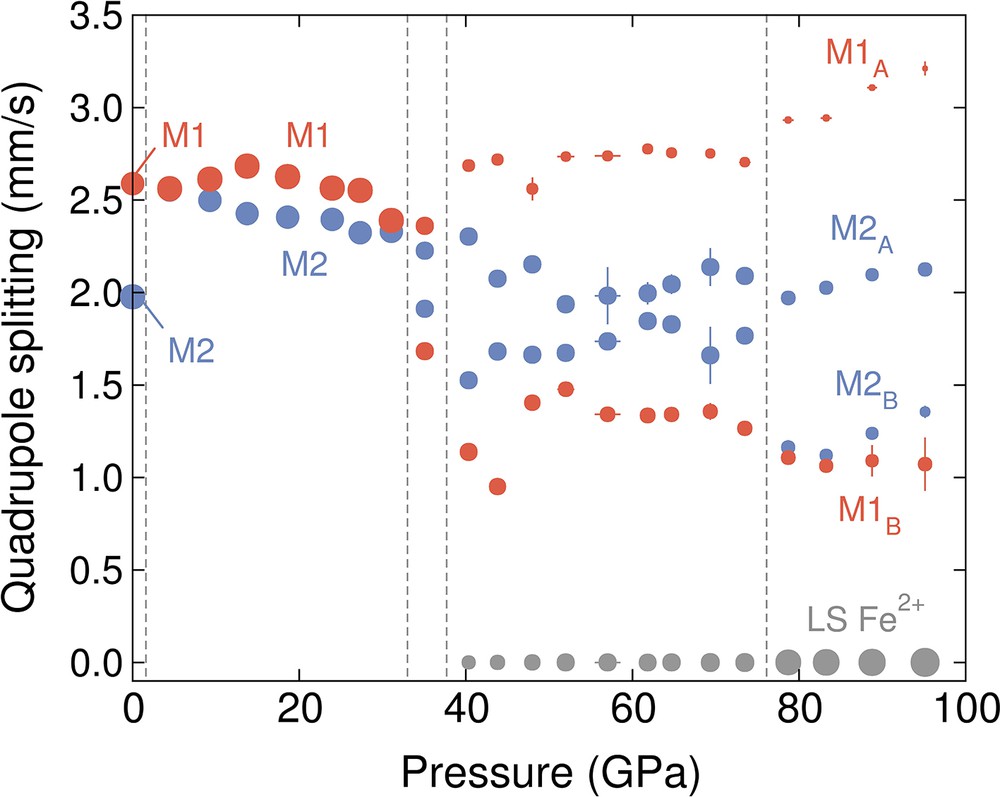
Quadrupole splitting as a function of pressure. The red symbols correspond to high-spin M1A and M1B sites, the blue symbols correspond to high-spin M2A and M2B sites, and the grey symbols correspond to low-spin iron.
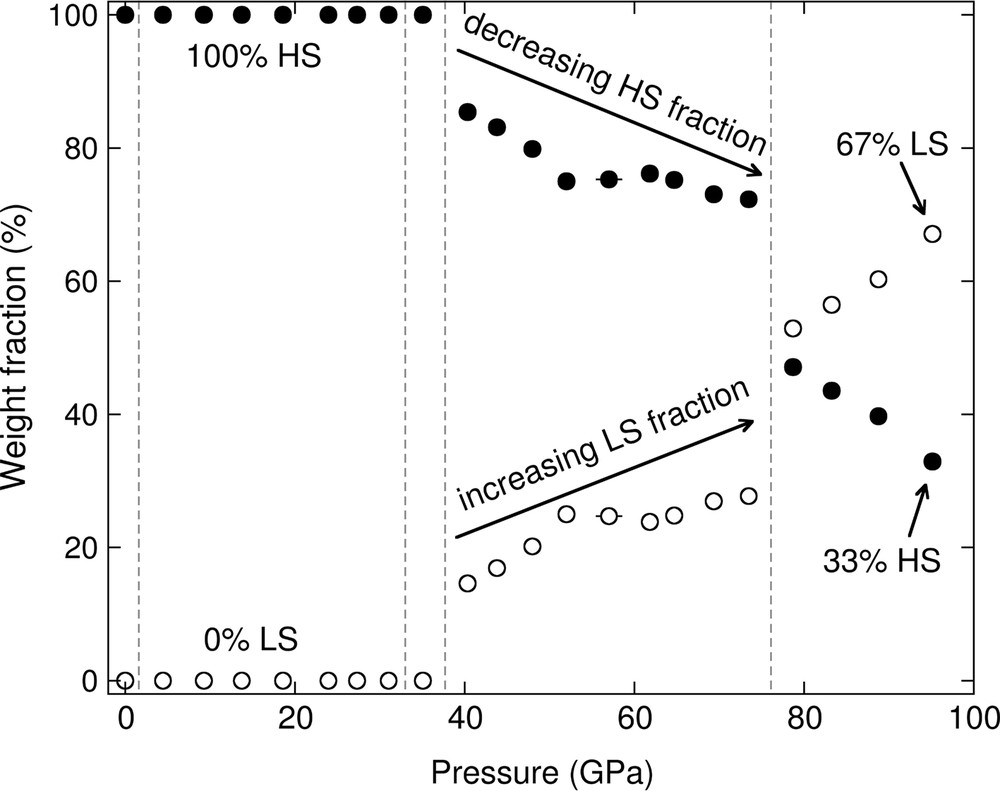
Weight fraction of the sum of the high-spin sites (filled circles) and low-spin sites (open circles) as a function of pressure.
3.2.2 Comparison to previous Mössbauer spectroscopy studies
There have been two high-pressure Mössbauer spectroscopy studies examining the behavior of 57Fe in (Mg,Fe)SiO3. McCammon and Tennant (1996) conducted conventional Mössbauer spectroscopy experiments on powdered monoclinic ferrosilite up to about 4 GPa, observing a discontinuity in hyperfine fields around 1.5 GPa, associated with a P21/c-to-C2/c phase transition. Zhang et al. (2011) conducted synchrotron Mössbauer spectroscopy experiments on powdered orthorhombic enstatite with the chemical formula (Mg0.87Fe0.13)SiO3 to 14.5 GPa, observing a discontinuity in hyperfine parameters at about 11–12 GPa, likely due to a Pbca to P21/c phase transition (Zhang et al., 2012; Zhang et al., 2013).
We conducted single-crystal time-domain synchrotron Mössbauer spectroscopy experiments on monoclinic ferrosilite to higher pressures than in previous studies of (Mg,Fe)SiO3 pyroxenes. In Fig. 8, we compare the quadrupole splitting values determined in this single-crystal study to the previous powder studies on FeSiO3 up to about 4 GPa (Dowty and Lindsley, 1973; McCammon and Tennant, 1996) and (Mg0.98Fe0.02)M1(Mg0.76Fe0.24)M2Si2O6 up to 28 GPa (Zhang et al., 2011). The magnitude of the quadrupole splitting values determined from this study are generally between the maxima and minima of the quadrupole splitting values in the previous studies. There could be several reasons for this in the case of FeSiO3. In our study, we used a single crystal that had a relatively long synthesis time (about 5 days) and conducted the experiments in a helium pressure medium. Thus, the difference could be explained by potential differences in iron's environment caused by a difference in heating cycles/duration of the synthesis, inhomogeneity of iron-distribution across or within grains, and/or non-hydrostatic conditions (e.g., Zhang et al., 2011).
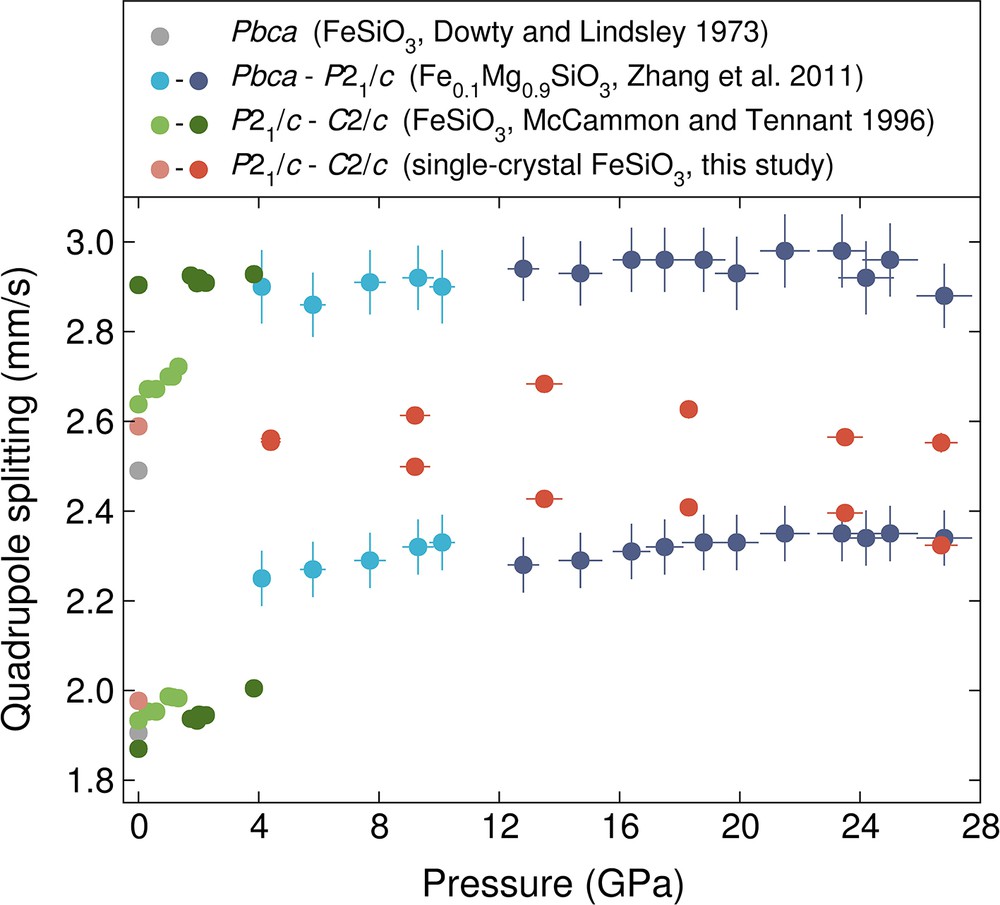
A comparison of the quadrupole splitting values determined in this single-crystal study for the low-pressure P21/c and C2/c structures compared to previous studies (Dowty and Lindsley, 1973; McCammon and Tennant, 1996; Zhang et al., 2011) on powder Mg–Fe pyroxenes up to 28 GPa. McCammon and Tennant (1996) and Zhang et al. (2011) used a 4:1 ethanol:methanol mixture and neon as pressure-transmitting mediums, respectively.
3.2.3 Spin transition behavior
At high pressure, iron may undergo a high-spin-to-low-spin transition in mantle minerals (e.g., Badro, 2014). For example, a ∼8% decrease in the octahedral volume of ferrous iron occurs in (Mg1–xFex)O (for x < 0.2) across the high-spin-to-low-spin transition (Tsuchiya et al., 2006). Spin transitions in iron-bearing lower-mantle phases are of particular importance due to their effect on seismically-relevant properties, such as sound velocities and density (Antonangeli et al., 2011; Jackson et al., 2006; Marquardt et al., 2009). The spin transition behavior of ferrosilite is compared to those of ferropericlase, siderite, and silicate glasses in Fig. 9. Siderite (FeCO3) undergoes a sharp spin transition, observed through a 9% volume drop at about 42 GPa from X-ray diffraction experiments (Lavina et al., 2009; Liu et al., 2015). Ferropericlase with 48 mol% FeO undergoes a gradual high-spin-to-low-spin transition between about 40 and 95 GPa, as determined from powder X-ray diffraction and time-domain synchrotron Mössbauer spectroscopy (Solomatova et al., 2016). Unlike ferropericlase and siderite, basaltic and rhyolitic glasses do not experience a spin transition up to core-mantle boundary pressures at room temperature, determined with time-domain synchrotron Mössbauer spectroscopy (Solomatova et al., 2017). The spin transition behavior in ferrosilite occurs in at least two steps due to the presence of two crystallographically-distinct iron sites: at about 38 and 76 GPa, the M1 and M2 sites begin to undergo a spin transition, respectively. The total high-spin weight fraction in ferrosilite drops from 100% to 85% at ∼37 GPa and from 72% to 47% at ∼76 GPa. At 95 GPa, about a third of the iron sites remain in the high-spin state.
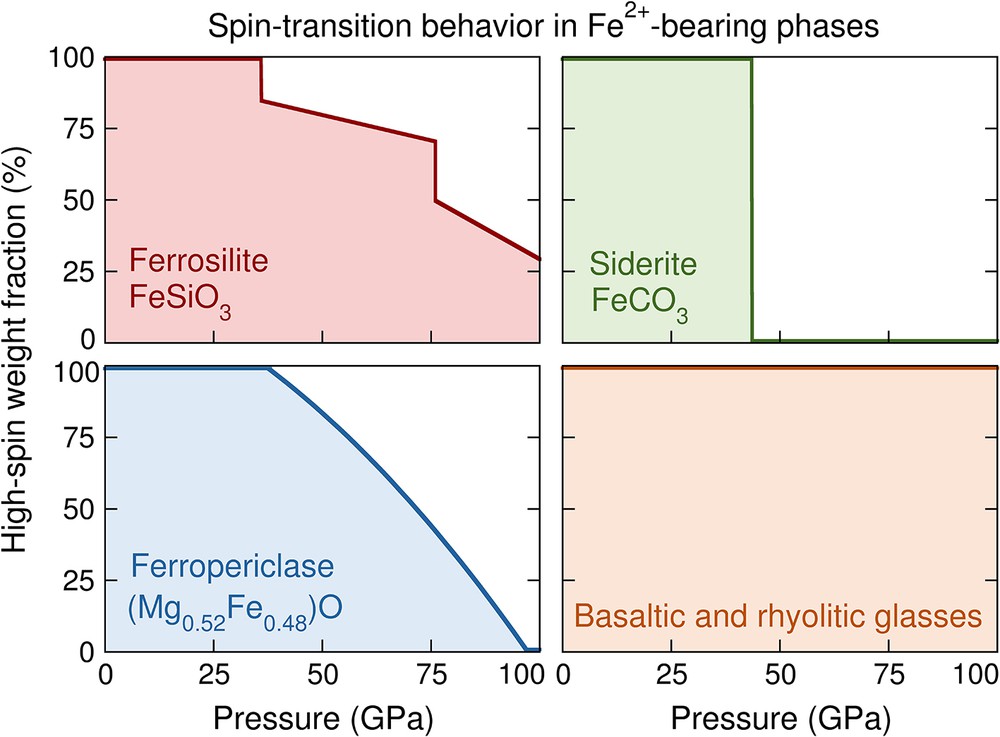
High-spin ferrous iron weight fraction as a function of pressure up to 100 GPa at 300 K for four phases: single-crystal ferrosilite, FeSiO3 (this study); single-crystal siderite, FeCO3 (Lavina et al., 2009; Liu et al., 2015); powdered ferropericlase, (Mg0.52Fe0.48)O (Solomatova et al., 2016); and silicate glasses (Solomatova et al., 2017). In this study, we have determined that ferrosilite undergoes a two-stage spin transition: at about 37 and 76 GPa, the M1 and M2 sites begin to undergo a spin transition, respectively. The total high-spin weight fraction in ferrosilite drops from 100% to 85% at ∼37 GPa and from 72% to 47% at ∼76 GPa. At 100 GPa, about a third of the iron sites remain in the high-spin state. The step-wise spin-transition behavior in ferrosilite is unique in comparison to the other phases. Siderite undergoes a sharp spin transition at about 42 GPa, while ferropericlase undergoes a gradual high-spin-to-low-spin transition, completing the spin transition by about 95 GPa. The silicate glasses do not undergo a spin transition up to at least 100 GPa. The weight fraction of high-spin atoms in ferropericlase within the mixed-state region was fitted with a polynomial curve while for ferrosilite, the three segments (0–37 GPa, 37–76 GPa, and 37–100 GPa) were fitted linearly.
3.3 Implications for subducting slabs
Cold subducting slabs could contain about 20% pyroxene by volume (Xu et al., 2008), and a significant fraction of it could be metastable (Mg,Fe)SiO3 pyroxenes due to the slow rate of dissolution of pyroxenes into garnet (Mierlo et al., 2013). We observed that ferrosilite undergoes two relatively sharp phase transitions at about 1.6 and 32 GPa, in agreement with Pakhomova et al. (2017), and experiences two sharp changes in the weight fraction of high-spin iron at about 38 and 76 GPa. The increase in density as a result of phase and spin transitions may be seismically observable. Furthermore, phase transitions in metastable pyroxenes may trigger super-deep earthquakes (Hogrefe et al., 1994) and have the effect of slowing slab subduction (Agrusta et al., 2014). Characterizing endmember compositions in the (Mg,Fe)SiO3 binary is therefore an important step towards understanding the complex polymorphism in pyroxenes and quantifying the effect of composition on phase transition pressures.
At lower mantle pressures and temperatures, FeSiO3 pyroxene will most likely decompose into FeO + SiO2 (Fujino et al., 2009; Ming and Bassett, 1975; Pakhomova et al., 2017), while MgSiO3 polymorphs may undergo phase transitions to “post-pyroxene” structures (Finkelstein et al., 2015) or directly into ilmenite (Agrusta et al., 2014; Hogrefe et al., 1994), which transforms to bridgmanite at about 660 km (D’Arco et al., 1994; Ono et al., 2001). Ismailova et al. (2016) synthesized (Fe2+0.64Fe3+0.24)SiO3 with a structure similar to that of bridgmanite at pressures between ∼45 and 110 GPa and temperatures ranging from 2200 to 3100 K, supporting the possibility that iron-rich silicates may be stable in regions of the lower mantle. The effect of iron concentration on the phase transition behavior and/or decomposition of (Mg,Fe)SiO3 polymorphs has not been thoroughly investigated. In order to determine whether a decomposition reaction would occur in (Mg,Fe)SiO3with different mol% of FeSiO3, the polymorphs need to be well-characterized for the entire solid solution.
4 Conclusions
We conducted single-crystal X-ray diffraction and time-domain synchrotron Mössbauer spectroscopy on a synthetic monoclinic ferrosilite, FeSiO3, up to lower-mantle pressures at room temperature in a helium pressure medium. With single-crystal X-ray diffraction, we observed a P21/c-to-C2/c phase transition between 1.5 and 1.7 GPa and a phase transition from C2/c to a new P21/c structure between 30 and 34 GPa. A third-order Birch-Murnaghan equation of state was fitted to the pressure–volume data of the C2/c structure, resulting in equation-of-state parameters, V0 = 425.2 (2), K0T = 106 (2) GPa and K′0T = 7.2 (2). With synchrotron Mössbauer spectroscopy, we determined the hyperfine parameters up to 95 GPa. The P21/c-to-C2/c and C2/c-to-P21/c phase transitions were correlated with discontinuities in the Mössbauer spectral features, requiring a different set of hyperfine parameters to fit the spectra. A gradual high-spin-to-low-spin transition was observed in the M1 ferrous iron site of the high-pressure P21/c structure between 40.3 and 73.5 GPa, after which the M2 ferrous iron site started to undergo a spin transition. At the maximum pressure of 95 GPa, the total low-spin weight fraction was 67%. We compared the spin transition behavior in ferrosilite to those of other Fe2+-bearing phases, demonstrating that the presence of two crystallographically-distinct ferrous iron sites will likely result in a stepwise spin transition behavior, thus adding to the potential diversity of spin pairing transitions in mantle phases. Although pure FeSiO3 is unlikely to exist in subducting slabs, it is important to characterize endmember phases of the (Mg,Fe)SiO3 solid-solution series to offer constraints on the effect of composition on the behavior of metastable pyroxenes in subducting slabs and in thermodynamic modeling of multi-component systems.
Acknowledgments
We are thankful to NSF–CSEDI–EAR–1161046, the W.M. Keck Institute for Space Studies, and COMPRES, which partially supports operations at Sector 3 (APS) and Beamline 12.2.2 (ALS). Microprobe analyses at Caltech were partially funded by MRSEX Program of the NSF under DMR-0080065. We would like to thank L. Henling and M.K. Takase for their help with data post-processing at the X-Ray Crystallography Facility in the Beckman Institute of Caltech. Ruby fluorescence measurements for the SMS experiments were conducted at GSECARS. Use of the Advanced Photon Source is supported by the U.S. DOE, Office of Science (DE-AC02-06CH11357). The Advanced Light Source is supported by the U.S. DOE, Office of Science (DE-AC02-05CH11231).