

1 Introduction
The North Armorican Cadomian belt consists of the remnants of a Late Proterozoic mountain chain dated back to between 620 and 540 Ma (Chantraine et al., 2001) and now eroded. Several studies, starting more than 50 years ago, were performed to understand the geological history of these oldest basement rocks in western Europe (Auvray and Maillet, 1977; Balé and Brun, 1983; Chantraine et al., 1988, 2001; Cogné, 1972; Graviou et al., 1988). More recently, the ARMOR I project allowed significant advances in the knowledge of Cadomian tectonism by the combined use of geological and geophysical surveys, including seismic (Bitri et al., 2001; Brun et al., 2001), gravimetry (Truffert et al., 2001), magnetism (Aïfa and Lefort, 2001; Cauvin-Cayet et al., 2001; Galdeano et al., 2001), and petrophysical measurements (Bosch et al., 2001; Cauvin-Cayet et al., 2001; Truffert et al., 2001). The ARMOR I project thus provides a new geological map, a land-sea seismic transect and 3-D geometrical models of the Cadomian domain of northern Brittany. Together, they give a regional crustal-scale overview of the area, confirming a southwestward thrusting of volcanic arc and back-arc series onto a sedimentary margin (Brun et al., 2001).
Apart from low-altitude aeromagnetic surveys that cover both onshore and offshore parts of the Gulf of Saint-Malo (Galdeano et al., 2001), a deep marine seismic reflection profile crossing the northern part of the Cadomian domain (Bois et al., 1991) and the coastal mapping of the rocky substratum in the Bay of Saint-Brieuc (Augris and Hamon, 1996), previous studies have suffered from poor knowledge of the marine area, in particular of the Gulf of Saint-Malo, where a lot of information on the geological history of the Cadomian domain is hidden. For the first time, this article describes high-resolution marine magnetic data extracted from the geophysical database of the SHOM (the French Hydrographic and Oceanographic Service). It focuses on their acquisition, processing, and interpretation, and shows how they can contribute to a better understanding of the geology of the region.
2 Geological setting
Only a short geological description of the area of interest is proposed here, as the geology of the North Armorican Cadomian belt was extensively studied and described in the scientific literature (e.g., Brun et al., 2001 or Chantraine et al., 2001).
The study area is located in the western part of the Cadomian belt, in the Gulf of Saint-Malo, between Paimpol and the Cotentin Peninsula (Fig. 1). It mainly concerns the Domnonean or orogenic domain as defined by Cogné (1972), Chantraine et al. (1988), and Graviou et al. (1988). This domain is interpreted as an active continental margin with thinned crust, intruded by voluminous igneous bodies (Chantraine et al., 2001).
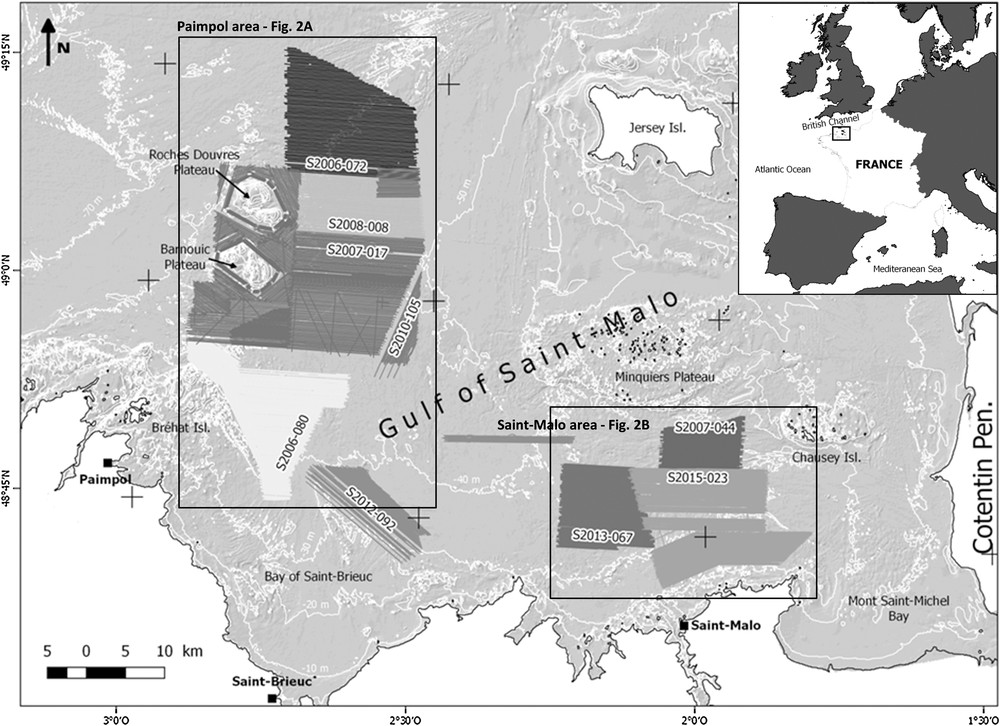
Location of areas of interest in the Gulf of Saint-Malo (Brittany, France) and of the marine datasets used in the study. A shaded image computed from the 100-m-gridded HOMONIM bathymetric Digital Elevation Model (SHOM, 2015) is illustrated as a base map. The bathymetry contour interval is 10 m. The inset shows the location of the Gulf of Saint-Malo in western Europe.
Though the offshore Cadomian domain is still poorly understood, its onshore geology is now well mapped. From the northwest to the southeast, five geological units (named Trégor, Guimgamp, Saint-Brieuc, Saint-Malo, and Fougères Units) are separated by four major faults (the Trégor, Plouagat–Coëtmieux, Erquy–Légué Faults and the Cancale Shear Zone; figure 2 in Brun et al., 2001). These units are mainly composed of plutonic, volcanic and metamorphic terrains.
The Cadomian domain, and in particular the Guingamp, Saint-Malo, and Fougères Units, is cross-cut by several north–south-trending dolerite dykes dated back to ca. 360 Ma (Le Gall, 1999; Pochon et al., 2016). Interpretation of aeromagnetic maps shows that the dyke swarm has a clear offshore prolongation far as 30 to 40 km off the coastline. It is affected by some major N60° sinistral transcurrent faults (Aïfa and Lefort, 2001; Galdeano et al., 2001).
3 Data acquisition and processing
Between 2005 and 2015, high-resolution marine geophysical data were acquired in the Gulf of Saint-Malo, to the northeast of Paimpol and to the north of Saint-Malo, during nine surveys on board the hydrographic vessels Borda, Lapérouse, and Laplace (Fig. 1 and Table 1). Marine surveys were conducted by the “Groupe hydrographique de l’Atlantique” (GHA) of the SHOM. The present study focusses on marine magnetic data, but it should be noted that multi-beam bathymetry was also measured during the selected surveys. High-resolution bathymetric data are not presented in detail here, but they were used to support the magnetic interpretation. Magnetic data were measured using Overhauser towed-magnetometers (Thomson SMMII or Marine Magnetics SeaSPY for post-2012 surveys). The main lines were mainly done along an east–west direction, with an average spacing of 50 m. Tie-lines were also performed for most surveys.
Main characteristics of marine magnetic data used in the study. Data uncertainty is given by the standard deviation of differences at crossing points. The uncertainty of S2006-072 data is overestimated due to a lack of crossing points.
| Survey identifier | Acquisition year | Magnetic sensor | Vessel | Number of measurements | Reference observatory | Data uncertainty (in nT) | Number of crossing points |
| S2007-017 | 2005 | SMMIIa | HV Borda | 914,399 | CLFc | 14.35 | 1435 |
| S2006-072 | 2006 | SMMII | HV Lapérouse | 291,379 | CLF | 1.23 | 6 |
| S2006-080 | 2006 | SMMII | HV Laplace | 566,258 | CLF | 15.90 | 2250 |
| S2007-044 | 2006 | SMMII | HV Lapérouse | 241,591 | CLF | 3.30 | 38 |
| S2008-008 | 2007 | SMMII | HV Borda | 205,627 | CLF | 12.35 | 251 |
| S2010-105 | 2010 | SMMII | HV Lapérouse | 80,863 | FURd | 5.68 | 132 |
| S2012-092 | 2012 | SMMII | HV Lapérouse | 246,004 | CLF | 1.95 | 107 |
| S2013-067 | 2013 | SeaSpyb | HV Lapérouse | 504,877 | CLF | 1.49 | 114 |
| S2015-023 | 2015 | SeaSpy | HV Lapérouse | 728,859 | DOUe | 6.22 | 636 |
a Thomson SMMII.
b Marine Magnetics SeaSpy.
c French observatory of Chambon-la-Forêt.
d German observatory of Furstenfeldbruck.
e Belgian observatory of Dourbes.
Magnetic data are processed following SHOM's methodology (SHOM, 2007). Besides shift to sensor position, layback adjustments, removal of spikes and gyrations or noise filtering, processing was aimed at calculating raw and total magnetic anomalies. Conventionally, raw magnetic anomalies are obtained by correcting measurements of the total magnetic field from the main theoretical field given by the International Geomagnetic Reference Field (IGRF) model (Thébault et al., 2015). Different versions of the IGRF model (from 2005 to 2015) were used here, depending on their availability at the time of data processing. If static and continuous magnetic measurements from a reference station are available, raw anomalies can be corrected from external low-frequency diurnal and high-frequency agitation variations of the Earth's magnetic field to obtain the total magnetic anomalies. In SHOM's methodology, low-frequency diurnal variations are obtained by (1) filtering the total field measured at a reference station with a low-pass Gaussian filter that only keeps signals with periods of over five hours, (2) removing the IGRF's main field at the station, and (3) removing a constant local magnetic response estimated by averaging the residual signal over a relatively long period of time (1 to 6 months). Marine data are corrected from diurnal variations with the assumption that the latter are comparable for two locations close enough in latitude at a same solar time. The diurnal effect is consequently shifted in time before correction, considering the difference in longitude between the reference station and marine data. High-frequency agitation variations are calculated by subtracting the previous diurnal variations from the total field measured at the reference station. Marine data are directly corrected from agitation variations, assuming that the latter are similar at two locations close enough in distance.
The processed data used here consist of total magnetic anomalies. Reference data are from permanent observatories chosen close enough from marine surveys and provided through INTERMAGNET (see details in Table 1). Data uncertainty, given by the standard deviation of differences at crossing points, varies from less than 6.2 nT for post-2010 surveys and up to 15.9 nT for pre-2007 surveys (Table 1). These relatively high values for the older surveys can mainly be explained by issues related to the positioning of the magnetometer. Residual processing artefacts, line effects or bias are also still observed in datasets. These defaults have to be kept in mind when interpreting magnetic anomalies.
The whole dataset was interpolated without levelling to compute an anomaly grid with a cell size of 50 m, applying the method of adjustable tension continuous curvature splines developed by Smith and Wessel (1990) in the Generic Mapping Tools (http://www.gmt.soest.hawaii.edu). A reduction to the pole was computed using Geosoft Oasis Montaj™ software in order to relocate the anomalies above their geological sources. The same parameters as in Galdeano et al. (2001) for the reduced-to-the-pole aeromagnetic map of the Gulf of Saint-Malo were used. Only induced magnetization was taken into account, with 60° for inclination and −4.5° for declination. The effect of remnant magnetization was considered negligible in the study area following the works of Cauvin-Cayet et al. (2001). Although these values differ from those that could be estimated at the date of the surveys with the current IGRF model, it allows us to use the map of Galdeano et al. (2001) as a reference for comparisons. Upward continuations to 300 and 1000 m in altitude and Euler deconvolution operations were also performed with Geosoft Oasis Montaj™ to give an estimation of depth sources. Upward continuation acts as a low-pass filter. The higher the altitude is, the more the resulting grid only keeps the long-wave deeply-rooted geological signal. Upward continuation therefore gives a qualitative indication of depth sources. The altitude of 300 m was chosen to be comparable with that of the map of Galdeano et al. (2001). Euler deconvolution is also used for locating the sources and quantifying their depths (Augris, 2005; Reid et al., 1990; Thompson, 1982). The method is based on the resolution of Euler's homogeneity equation, which takes into account horizontal and vertical gradients and a structural index that characterizes the source type. The structural index is here set to 1 to focus on the determination of dyke depth. The window size used to calculate the Euler solutions is set to 12 pixels (e.g., about 600 m). The average uncertainty on depths is about 10% of the estimated value. To distinguish between superficial and deep sources, the analysis is performed from the 50-m-gridded and reduced to the pole magnetic anomaly model taken at the sea level and upward continued to an altitude of 300 m. Euler deconvolution is known for producing a large quantity of invalid solutions and results should be critically assessed (Chen et al., 2014; Hsu, 2002; Yao et al., 2004). A broad cluster of solutions thus clearly correspond to artefacts of magnetic data (trackline effects). However, most solutions give valuable information related to dykes. Results are corrected from water depth by using the 100-m-gridded HOMONIM bathymetric Digital Elevation Model (SHOM, 2015) to give estimated depths from the seafloor.
4 General description and interpretation of marine magnetic maps
The Paimpol and Saint-Malo areas (Figs. 1 and 2) are described and interpreted separately, as they exhibit contrasted magnetic signatures. They should belong geographically and structurally to different geological units of the North Armorican Cadomian belt: the Trégor Unit, on the one hand, the Saint-Brieuc and Saint-Malo Units, on the other hand (Figure 2 in Brun et al., 2001).
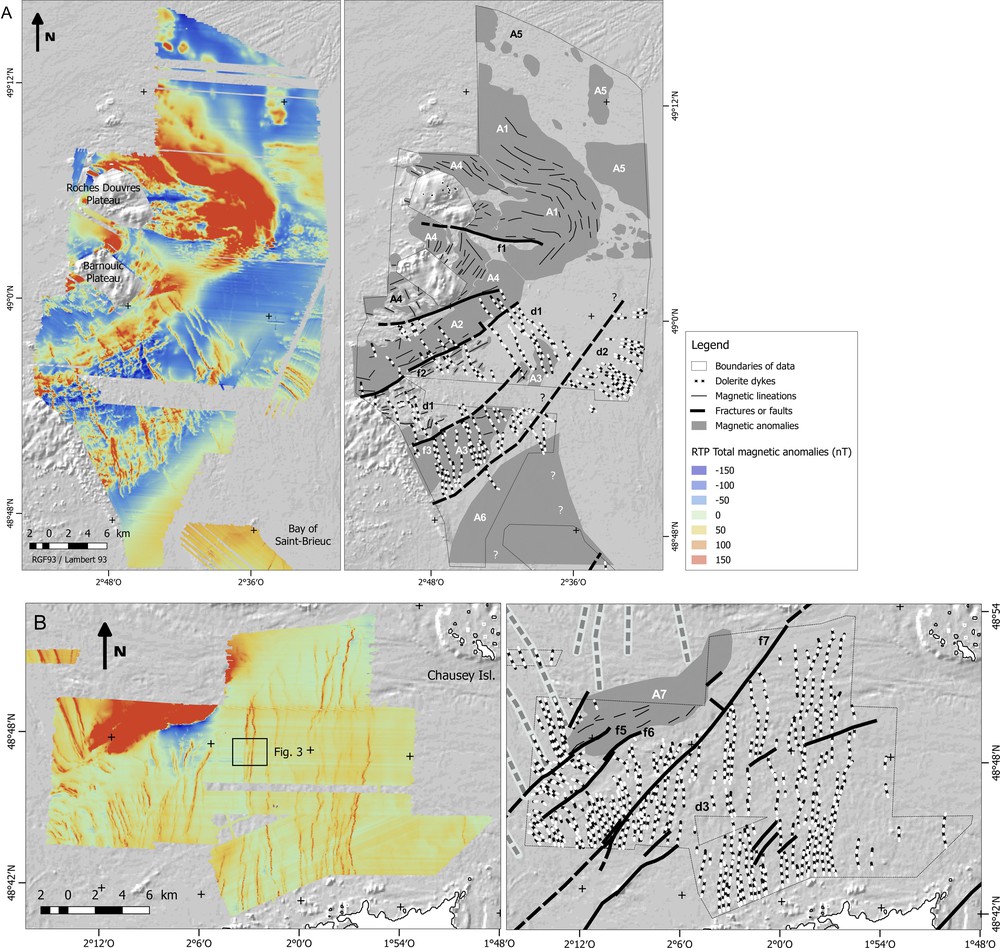
Interpretation of marine magnetic data in the Paimpol (A) and Saint-Malo (B) areas. Coloured image computed from the 50-m-gridded and reduced to the pole magnetic anomaly model (left). Sketch of the geological and structural interpretation (right). Location is drawn in Fig. 1. Same notations for the base map as in Fig. 1.
4.1 Paimpol area
The Paimpol area covers about 1200 km2 to the northeast of Paimpol and Bréhat Island and directly to the east of the Roches Douvres and Barnouic Plateaux (Figs. 1 and 2A).
The area's main anomaly (named A1, see Fig. 2A) is located between 5 and 12 km from the north to the east of the Roches Douvres Plateau. Roughly, it consists of an about 15-km-long, 8-km-wide and N315°-oriented anomaly. In detail, A1 presents a vortex-shaped structure. Magnetic lineaments progressively change in direction from N315° to N45°, from the northwest to the southeast. The southern edge of A1 is sharply interrupted, suggesting fault activity (f1). Multi-beam bathymetry confirms the existence and the prolongation to the west of this fault directly to the south of the Roches Douvres Plateau. Average anomaly intensity is estimated at 400 nT at sea level and with maximum values greater than 1000 nT. It is still measured at more than 250 nT at an altitude of 1000 m. These observations lead to the conclusion that the geological formations that gave rise to A1 underwent strong deformations and fracturing and are deeply rooted. A1 is undoubtedly associated with the Metamorphic Gneissic Complex of Roches Douvres and Barnouic Plateaus, as described by Boillot and Lefort (1974) on the geological map of the English Channel.
Two major parallel anomalies (A2 and A3) extend to the south of the Barnouic Plateau, approximately 20 km in length and 4 km in width with a similar N55° orientation. Their average intensities are approximately 50 nT at sea level, with maximum values between 100 and 150 nT. At an altitude of 1000 m, the magnetic signal has nearly disappeared, suggesting relatively superficial sources. The area between A2 and A3 does not show a significant anomaly, only some N55–60°-oriented lineations. A2 and A3 are located in the prolongation of the geological formations of the Trégor Unit mapped on land by several authors (Brun et al., 2001; Chantraine et al., 2001) and are undoubtedly associated with the latter.
The southern part of the Paimpol area is crossed by several 100- to 150-m-wide magnetic stripes with an overall N330° orientation and average anomaly intensities of about 200 nT at sea level (d1). They can reach lengths in excess of 5 km. They appear, however, to be confined to A2 and A3. They are often discontinuous and shifted on more than several hundred metres. These lineations are interpreted as the magnetic signature of dolerite dykes, well-mapped onshore (Boillot and Lefort, 1974; Brun et al., 2001) and also identified offshore (Aïfa and Lefort, 2001; Galdeano et al., 2001). We can infer from the magnetic response that dykes were impacted by various degrees of fracturing and faulting. In particular, their brutal interruption at the southern edge of A2 suggests the presence of a fault (f2), also seen by bathymetry. Another fracture or fault (f3) is suspected from magnetism on the northern edge of A3. Only its western part, however, is clearly identified by bathymetry. Dykes are relatively superficial, as the amplitude of anomalies significantly decreases as much as a 300 m upward continuation is performed. To the east of the Paimpol area, magnetic lineations (d2) are also associated with dolerite dykes. The dyke swarm is only partially imaged. It presents, however, a different signature and organization than the previous dykes crossing A2 and A3. The density of lineations is higher, with sources every 300 to 400 m. They display an arcuate geometry with changes in orientation from N90° to N315°, from west to south. Finally, this family of dykes can clearly be followed on bathymetric data and is probably more superficial.
Relatively significant magnetic anomalies are measured directly around the Roches Douvres and Barnouic Plateaux (A4), to the north and to the south of the Paimpol area (A5 and A6). A4 anomalies only extend to circa several square kilometres. They can, however, be high in amplitude up to 350 nT at sea level. They generally exhibit lineations with a radial direction from the Roches Douvres and Barnouic Plateaux and are clearly associated with their formation. The anomaly mapped to the east of the Barnouic Plateau is sharply cut by an abnormal contact interpreted as a fault (f4). This fault also corresponds to the northern edge of A2 and can easily be followed by bathymetry south of the Barnouic Plateau. A5 are potato-shaped anomalies located to the north of the area. Their intensity and extent can be high (up to 200 nT at sea level and at least 25 km2 for the easternmost body), but their interpretation is difficult with the available data. We can only infer that their sources are relatively superficial as the anomalies have nearly disappeared after 300 m upward continuation. To the southeast, A6 is partially covered. The aeromagnetic map of Galdeano et al. (2001) shows that A6 could extend over more than 25 km to the east. This observation is supported by the long-wavelength magnetic signal measured on the S2012-92 survey (see location in Fig. 1). A6 is crossed by a few isolated lineations interpreted as dolerite dykes. The source of A6 is still undetermined, even though the long-wavelength magnetic signature suggests a deep origin.
4.2 Saint-Malo area
The Saint-Malo area covers approximately 500 km2 directly to the north of Saint-Malo and to the south of the Chausey Islands and the Minquiers Plateau (Figs. 1 and 2B). The magnetic anomaly map mainly shows a strong anomaly (named A7, see Fig. 2B) in the northwest and an exceptional zebra pattern of magnetic anomalies (d3) that cross the entire area of interest.
A7 is a 14-km-long, 4-km-wide and N50°-oriented prominent anomaly. The average intensity of the anomalies is estimated at 300 nT at sea level with maximum values of more than 700 nT. At an altitude of 1000 m, the magnetic signal persists with values in excess of 200 nT. Moreover, no clear bathymetric structure is correlated with A7. Consequently, the formations giving rise to A7 are deeply rooted. A7 exhibits, in its southern part, a clear reverse anomaly representing perhaps a remaining dipole, even after the reduction to the pole. The assumption that the remnant magnetization is negligible for A7 is therefore questionable. Galdeano et al. (2001) suggest that A7 is genetically linked with the intense anomalies of the Saint-Brieuc Unit, mainly due to metagabbros and metavolcanics (Chantraine et al., 2001). According to the authors, local heat accompanying the genesis of the dykes was sufficient to erase the magnetization between the Saint-Brieuc on-land formations and A7. This hypothesis is supported by marine data, as A7 exhibits a compatible N50° structure and magnetic lineations with the same direction. Moreover, A7 is marked by several sharp N50°-oriented contacts, suggesting fracturing and faulting (faults f5 and f6).
The Saint-Malo area is cross-cut by a high density of magnetic stripes (d3), from the south to the north, over a distance of up to 18 km. More than three hundred lineations are mapped, generally 100 to 250 m in width, and are separated by only several hundred metres depending on the area (Figs. 2B and 3A). Average intensities are circa 50 nT at sea level, but the maximum values can reach 100 to 150 nT. The Saint-Malo area thus offers an exceptional showcase of the dolerite dyke swarm already identified and studied in the region (Aïfa and Lefort, 2001; Boillot and Lefort, 1974; Brun et al., 2001; Galdeano et al., 2001). The dyke swarm exhibits a complex geometry reflecting a no less complex geological and structural history. Dykes are discontinuous, shifted on more than several hundreds of metres, deformed and brutally interrupted. Abnormal contacts allow the location of multiple faults with N45°-N50° orientation, i.e. the main fault direction of the Saint-Brieuc and Saint-Malo Units (Brun et al., 2001). From the magnetic signature of the dykes, we infer that the main fault f7, that runs obliquely through the area over more than 20 km should be a sinistral strike-slip fault. f7 is also clearly followed by high-resolution bathymetry. Conversely, faults f5 and f6 seem to shift and deform dykes with dextral strike-slip motions.
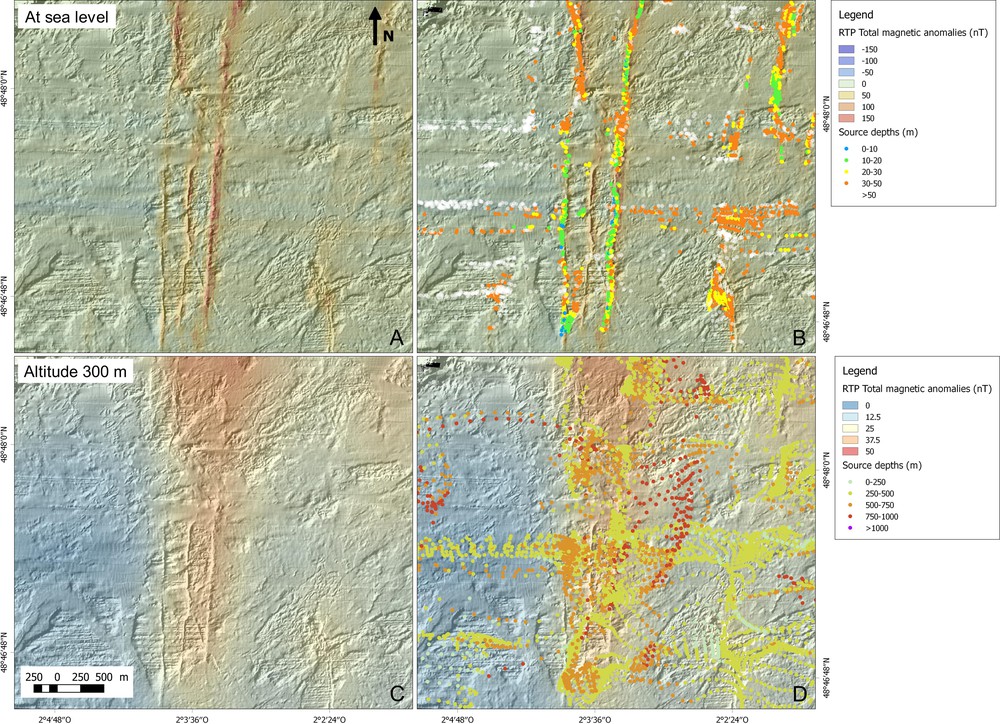
Bathymetric and magnetic signatures of typical dolerite dykes crossing the Saint-Malo area and estimation of their depth sources at two different altitudes from the Euler deconvolution method with a structural index equal to 1 (dykes) and a window size set to 12 pixels (e.g., about 600 m). The base map is a shaded image computed from high-resolution 5-m-gridded multi-beam bathymetry. Coloured images of the 50-m-gridded and reduced to the pole magnetic anomaly model taken at the sea level (A and B) or upward continued to an altitude of 300 m (C and D) are superimposed with transparency. The results are corrected for water depth. The location is drawn in Fig. 2B. Masquer
Bathymetric and magnetic signatures of typical dolerite dykes crossing the Saint-Malo area and estimation of their depth sources at two different altitudes from the Euler deconvolution method with a structural index equal to 1 (dykes) and a window size set ... Lire la suite
5 Discussion
5.1 Regional interpretation of information inferred from marine magnetics
The analysis of marine magnetic data acquired in the Gulf of Saint-Malo provides additional geological and structural information that could enhance the previous regional model proposed for the North Armorican Cadomian belt. We propose here a new land and sea interpretation of the available knowledge in the area, with additional information inferred from marine magnetics (Fig. 4).
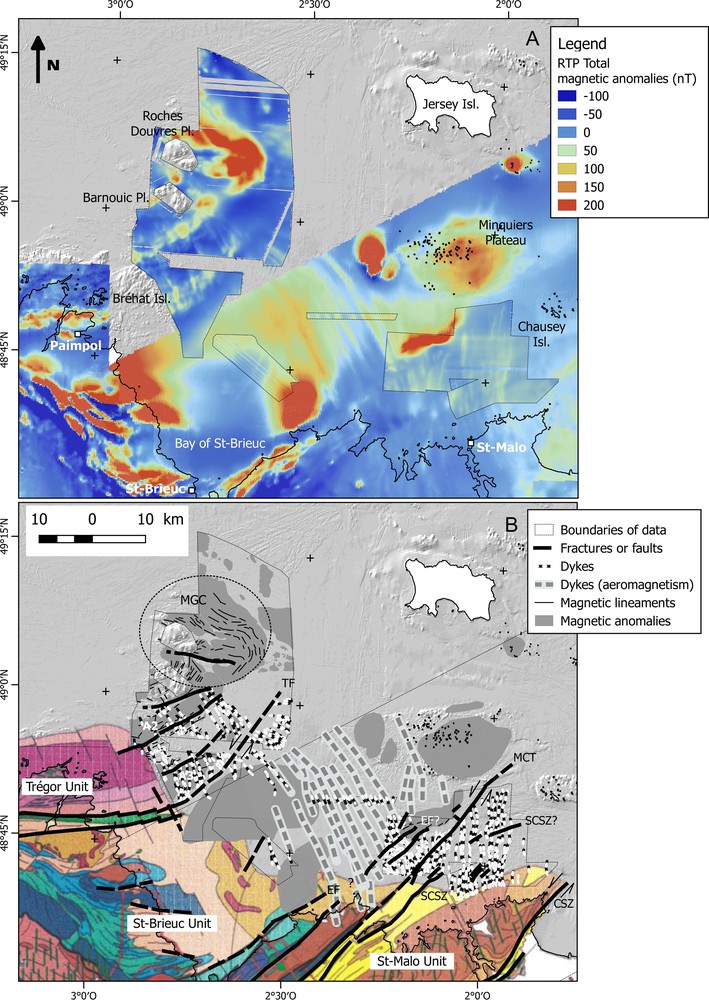
Regional geological and structural interpretation of marine and aeromagnetic data in the Gulf of Saint-Malo. A. Coloured superimposed images of reduced to the pole magnetic models. The 50-m-gridded marine magnetic model was upward continued to an altitude of 300 m to be comparable with 250-m-gridded aeromagnetic models (Saint-Malo-92 published by Galdeano et al., 2001 and Bretagne-98 surveys) provided by the French Geological Survey (BRGM). B. Interpretative sketch compared with a scanned georeferenced clip of the geological map of Brun et al. (2001). MGC: Metamorphic Gneissic Complex, TF: Trégor Fault, EF: Erquy–Légué Fault, Main Cadomian Thrust (MCT), SCSZ: St-Cast Shear Zone, CSZ: Cancale Shear Zone. CSZ is a sinistral fault according to Brun et al. (2001). Same notations for the base map as in Fig. 1. Masquer
Regional geological and structural interpretation of marine and aeromagnetic data in the Gulf of Saint-Malo. A. Coloured superimposed images of reduced to the pole magnetic models. The 50-m-gridded marine magnetic model was upward continued to an altitude of 300 m to be ... Lire la suite
Taken separately, the Paimpol and Saint-Malo areas provide some answers concerning the local structural geology in the near-shore area.
Marine magnetics confirm the existence of the Metamorphic Gneissic Complex (MGC on Fig. 4B) mapped by Boillot and Lefort (1974). The main body is deeply rooted and located about 15 km to the east of the Roches Douvres Plateau.
Magnetic anomalies identified in the southern part of Paimpol area are located in the direct prolongation of geological units mapped onshore and recognized as belonging to the Trégor Unit (Fig. 4B). In detail, the weakly magnetized area between A2 and A3 appears to be geographically correlated with the North Trégor granitic batholith, which is consistent with the relative absence of signature obtained by Galdeano et al. (2001) from aeromagnetism. To the north, the contrasted response of A2 supports the distinction of two different units inside the Trégor batholith as proposed by Brun et al. (2001). Finally, A3 probably corresponds to Tréguier volcanics mapped by Augris and Hamon (1996) and Chantraine et al. (2001). Foreseen f2 and f3 faults from magnetic and bathymetric data (Fig. 2A) are in the prolongation of N60°-oriented secondary fractures proposed by Brun et al. (2001) and thus validate their structural map in this area.
According to the interpretation of Brun et al. (2001), the well-known onshore Trégor Fault (TF in Fig. 4B) continues offshore to the east and directly along the southern edge of A3. We therefore suspect that the Trégor Fault goes farther east and progressively changes direction to the northeast. This arcuate geometry is consistent with the whole N55°–60° orientation of A2 and A3. It also suggests that the entire Trégor Unit also follows this orientation offshore. Finally, it could explain why dolerite dykes (d2 and d3 on Fig. 2A) are possibly shifted following a sinistral strike-slip over more than 10 km, or why two families of dykes (i.e. d1 and d2) exist across this fault line.
The impressive dyke swarm of the Saint-Malo area is the direct prolongation of the dykes mapped onshore in the Saint-Malo Unit (Aïfa and Lefort, 2001; Brun et al., 2001; Galdeano et al., 2001).
N50°-oriented and parallel to f5, the f6 and f7 faults could be seen as the offshore imprints of several faults well recognized onshore. f7 probably corresponds to the prolongation to the northeast of the sinistral Main Cadomian Thrust (MCT on Fig. 4B) drawn by Brun et al. (2002) on their geological map. Similarly, we propose that f5 and f6 could be linked to the Erquy–Légué Fault (EF) and that some abnormal contacts in the eastern part of the Saint-Malo area could be the expression of the Saint-Cast Shear Zone (SCSZ).
The isolated S2012-92 marine survey (Fig. 1) and mainly the aeromagnetic surveys from Galdeano et al. (2001) provide information on the uncovered zone between the Paimpol and Saint-Malo areas. Cross-analysis of marine and airborne magnetic data shows that the dyke swarm identified on the aeromagnetic map propagate offshore over more than 50 km, with an arcuate geometry. The direction changes from near N0° on the coast to N270° to the east of the Paimpol area. The dyke swarm would thus be interrupted by the foreseen offshore prolongation of the Trégor Fault.
5.2 Estimation of depth sources
In the Paimpol and Saint-Malo areas, high-resolution bathymetry clearly highlights outcropping veins on the seabed. They cross the bedrock and are correlated with magnetic lineations (Fig. 3A). These veins obviously correspond to dolerite dykes. Their depth sources are numerically obtained through Euler deconvolution. Depth values vary along dykes and are estimated from the magnetic model at sea level from a few metres to more than 50 m (Fig. 3B). At a height of 300 m, they are estimated from about 250 m to less than 1 km (Fig. 3D). These observations show that even if dykes have a bathymetric surface expression, the main magnetic signature is due to more deeply rooted bodies. Marine magnetic data thus suggest a dendritic propagation of the magma with a succession of igneous sources from depth to the surface. The hypothesis of deep super dykes, already proposed by Galdeano et al. (2001), is also supported by the following additional arguments: (1) magnetic lineations as seen on marine data are two to three times wider than structures imaged by multi-beam bathymetry (Fig. 3A); (2) several packages of superficial dykes are superimposed with deep anomalies mapped by Aïfa and Lefort (2001) from the aeromagnetic map of Galdeano et al. (2001).
Galdeano et al. (2001) applied both Euler deconvolution and analytic signal methods to determine depth sources of magnetic anomalies in the Saint-Malo area from airborne data. The authors conclude that the analytic signal shows some alignments of relatively deep solutions for the dykes with values of the same order of magnitude than our results, whereas the Euler deconvolution method does not give solutions for dyke sources (fig. 9 in Galdeano et al., 2001). We show here that the Euler deconvolution method is more efficient to estimate depth sources for the dykes from a high-resolution model referenced to the sea level, that is to say 300 m closer to sources compared with airborne data.
6 Conclusions
Even though they provide a piecemeal coverage of the magnetic offshore environment, marine magnetic data acquired in the Gulf of Saint-Malo and extracted from the SHOM's geophysical database are a rich source of information for a better understanding of the regional geology, and in particular of the western part of the North Armorican Cadomian belt.
Cross-analysis and interpretation of available geological and geophysical knowledge led to the following main results.
The offshore area exhibits an intense magnetic signature that can be correlated with magnetic anomalies identified from aeromagnetism (Galdeano et al., 2001) and mainly due to plutonic, volcanic and metamorphic formations or to the large Metamorphic Gneissic Complex (Boillot and Lefort, 1974), located to the east of the Roches Douvres Plateau.
Geological formations and main faults mapped onshore (Brun et al., 2001; Chantraine et al., 2001) continue offshore over more than 30 km. In the Paimpol area, the Trégor Unit progressively changes direction from N90° to N55°. The submarine prolongation of the Trégor fault could follow a similar orientation toward the northeast. Faults bordering the Saint-Malo Unit to the north (i.e. the Erquy–Légué Fault and the Main Cadomian Thrust) could continue offshore in almost the same direction.
The impressive and dense dolerite dyke swarm, previously identified north of Saint-Malo, is mapped offshore over more than 50 km. It presents an arcuate geometry from N0° onshore to N270° in the vicinity of the inferred location of the Trégor Fault that interrupts the dyke swarm. It is difficult to know from the available data whether the dolerite dykes identified in the southern part of the Paimpol area belong to the same family of dykes or not. Dykes are characterized by both surface and deep signatures. This suggests the existence of deeply rooted super dykes to which individual small-scale structures are connected.
Acknowledgements
The authors would like to thank Yann Moysan, Sylvain Lucas, and the whole Department of Marine Geophysics of the SHOM for their efforts in processing marine magnetic data. This work would not have been possible without crews from the “Groupe hydrographique de l’Atlantique” (GHA), who collected and made marine magnetic data available. This study was supported by funding from the French Defence Procurement Agency (DGA) through project “EA ENVGEO”. The results presented in this paper rely on data collected at magnetic observatories. We thank the national institutes that support them and INTERMAGNET for promoting high standards of magnetic observatory practice (http://www.intermagnet.org). Magnetic models from the Saint-Malo-92 and Bretagne-98 airborne surveys were provided by the French Geological Survey (BRGM) (Licence Agreement No. 2017/017). The paper benefited from helpful reviews and comments from Marc Munschy and Tahar Aifa.