

1 Introduction
Recently, high-pressure experimental techniques using a diamond anvil cell (DAC) have significantly progressed, and phase relationships of Fe and Fe-light element systems have been investigated under pressure conditions corresponding to the center of the Earth (e.g., Tateno et al., 2010, 2015). Although such experiments have been successfully performed, the interpretation of their results strongly depends on the chosen pressure scale. Sakai et al. (2014) reported that the equations of state (EOS) of hcp Fe gave different pressures depending on how they were established, and that the difference was as large as 25 GPa at 300 GPa. Therefore, well-determined pressure scales are crucial for accurate determination of experimental pressures. To calibrate a pressure scale precisely enough, one needs a precisely determined pressure standard.
Platinum (Pt) is used to determine pressure in high-pressure Earth science because it has a simple face centered cubic crystal structure and does not react easily with most Earth materials (e.g., oxides, silicates) except for metals, hydrogen, carbonates, and carbides. In addition, Pt can act as a laser absorber during laser-heated DAC experiments. Therefore, Pt conveniently enables us to heat a sample and determine the pressure at the same time. Because of its usefulness, equations of state (EOSs) of Pt as a pressure scale have been proposed based on shock (e.g., Holmes et al., 1989; Jamieson et al., 1982; Matsui et al., 2009; Yokoo et al., 2009) or static compression (e.g., Dewaele et al., 2004; Dorfman et al., 2012; Fei et al., 2007).
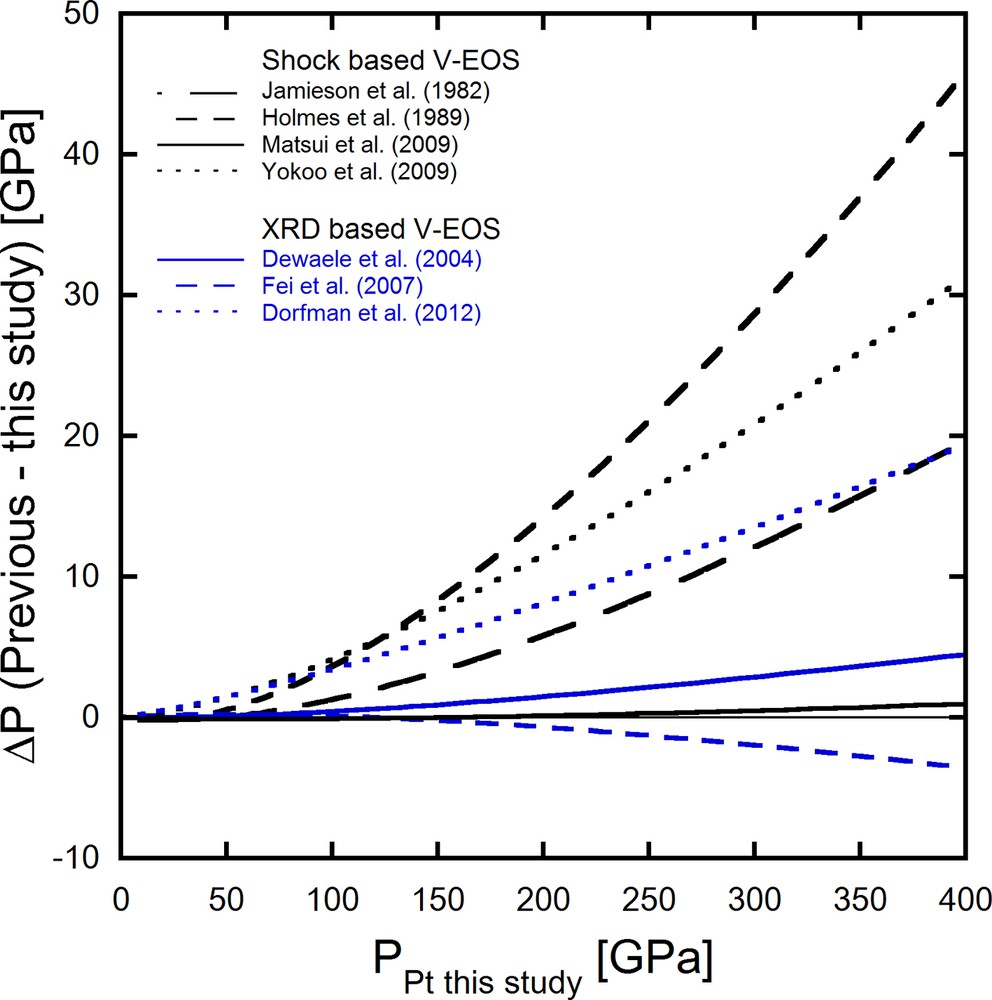
We summarize the previously determined pressure scales of Pt to clarify the uncertainty. Fig. 1 illustrates pressure differences at room temperature between the Pt scale by Matsui et al. (2009) and other scales. The Pt scale by Matsui is chosen as a comparison standard in Fig. 1 because their scale was based on shock compression data independent of any other pressure scales and the scale was in good agreement with static compression results. Black and blue lines in Fig. 1 represent pressures based on shock compression data and static compression data, respectively. Pressures based on Holmes et al. (1989) tend to show up to 10% higher pressures compared to the Matsui scale. Other scales based on shock compression data also give pressures higher than those obtained by Matsui et al. (2009). On the other hand, the Dewaele and Fei scales based on static compression are in good agreement with the Matsui scale. Pressures obtained by the Dorfman and Jamieson scales are similar to each other, and are higher than the Matsui scale and other scales based on the static compression data. As a result of mismatches among different Pt scales shown above, EOSs of an investigated material established using different EOSs of Pt are likely to give different pressures.
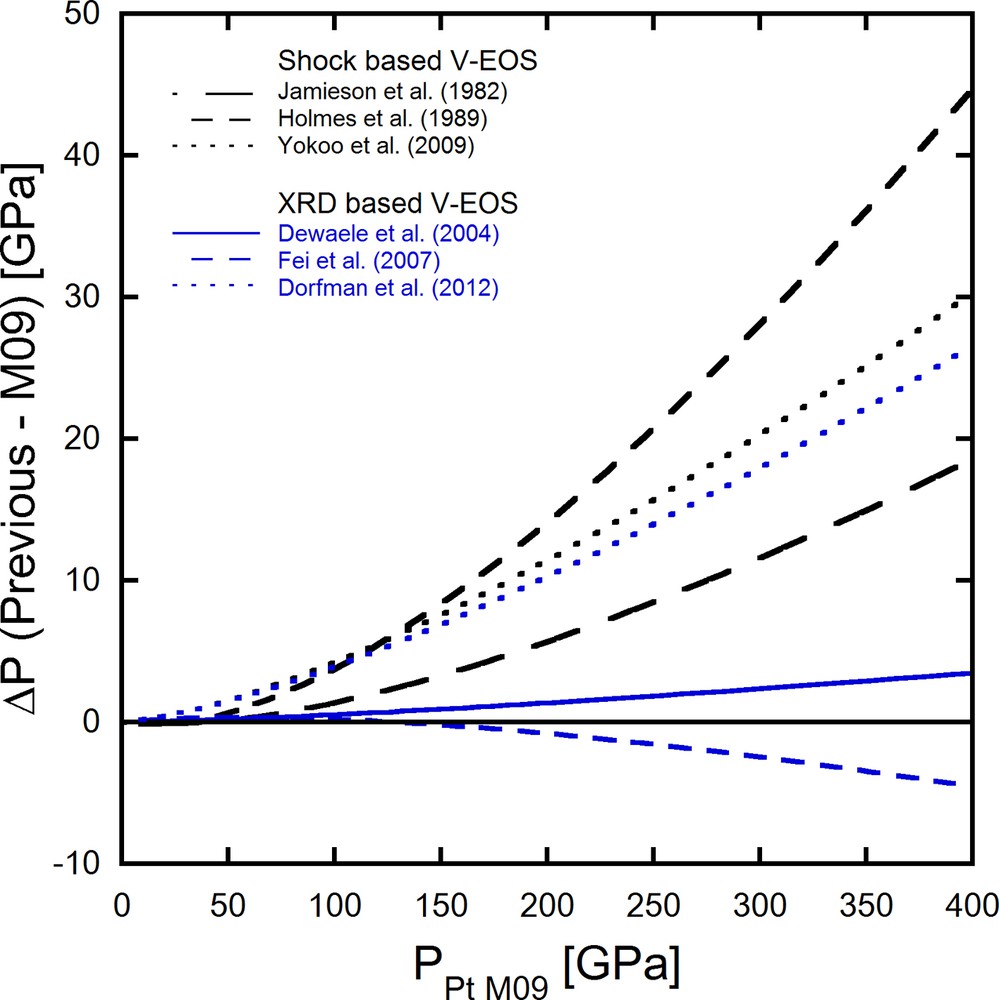
Comparison of the pressure scales. Pressure differences between Matsui et al. (2009) (M09) and other scales are plotted against pressures based on Matsui et al. (2009). Black and blue lines represent scales based on shock and static compression data, respectively.
Both shock and static experiments have advantages and disadvantages with respect to the accuracy of experimental pressure determination, which may result in the discrepancy between previous studies. As Hugoniot pressures can be determined without using any pressure scales, many pressure scales of various materials were established using shock compression data (Marsh, 1980). However, it is difficult to obtain isothermal pressure–volume relations due to the treatment of thermodynamics based on the Mie–Grüneisen–Debye model, a pressure dependence of the Grüneisen parameter, and an electron effect (e.g., Holmes et al., 1989; Jamieson et al., 1982; Matsui et al., 2009; Tsuchiya and Kawamura (2002); Yokoo et al., 2009). On the other hand, it is opposite for static compression experiments, since isothermal measurements can be easily performed, but they require other primary pressure standards in most of the cases.
It has been previously shown that measuring sound velocities as well as volumes or densities allows us to avoid the thermodynamic difficulty and establish an independent EOS (e.g., Yoneda et al., 2017; Zha et al., 2000). Taking this into account, we measured sound velocities and volumes of a Pt single crystal under high pressures based on inelastic X-ray scattering (IXS).
2 Methods
2.1 Experiment
The sample utilized for all IXS measurements in the present study was made from a piece of a Pt single crystal commercially purchased from MaTeck Co. The piece was cut using a focused ion beam system to the size of 20 × 20 μm2 with a thickness of ∼8 μm. A diamond anvil cell with a culet size of 400 μm was used for generating high pressures. The sample was set in a sample chamber with ruby chips as the [001] direction was normal to the culet's surface. Reference pressures were measured before and after each IXS measurement based on the Ruby scale (Zha et al., 2000). Pressure media of helium gas were loaded into the sample chamber using the gas loading system at SPring-8.
IXS measurements were performed at BL35XU of SPring-8 (Baron et al., 2000) for six different pressure points from ambient pressure to 20 GPa. The measurement at ambient pressure was performed before loading He gas into the sample chamber. Energies of incident beams were 17.794 and 21.747 keV using the Si(9 9 9) and (11 11 11), respectively. The incident beams were focused using a KB mirror setting (Ishikawa et al., 2013). The energy resolutions and beam sizes were ∼3.0 meV and 13 × 19 μm2 for 17.794 keV, and ∼1.5 meV and 12 × 17 μm2 for 21.747 keV. We used 17.794 keV for ambient pressure measurements and 21.747 keV for high-pressure measurements. We determined orientation matrix of Pt using (2 −2 0) and (2 0 0) reflections at ambient pressure, (2 −2 0), (2 0 0), and (3 −1 −1) reflections at high pressures, which were observed before, between, and after IXS measurements. Full widths at half maximum (FWHM) of rocking curves were less than 0.12 degrees in most of the measurements, while, at the highest pressure point, values of FWHM were at most 0.34 degrees. This indicates that the single crystal's quality was preserved up to the highest pressure in this study.
In general, one IXS spectrum has at most three pairs of lines, composed of Stokes and anti-Stokes excitation of a mode, from a single crystal in addition to the elastic line. The three pairs represent one longitudinal and two transverse modes. Fig. 2 shows the typical IXS spectra obtained at highest pressure using the 12-analyzer array (Baron, 2016). The peaks were fitted using the pseudo-Voigt function and the resulting peak energies were then corrected based on the effect of finite dq values (Fukui et al., 2008). The three independent elastic constants (C11, C12, and C44) for Pt at each experimental pressure were determined using Christoffel's equation as follows (Fukui et al., 2008):
| (1) |

Typical IXS spectra at 20 GPa. The lower right panel showed no data because of a wiring trouble at the beamline. The total momentum transfer in reciprocal lattice units is given above each spectrum. The black circles represent the observed data points with statistic errors, and the black solid curves are results of the total peak fitting.
2.2 First principles calculation
We also conducted first-principles calculations of the elastic constants for platinum. The Kohn-Sham equation was solved by means of the exact muffin-tin orbitals (EMTO) methods (Vitos et al., 2001). The local density approximation (LDA) or the generalized gradient approximation (GGA) was adopted for the exchange correlation function (Perdew and Wang, 1992; Perdew et al., 1996). The EMTO basis set included s, p, d, and f orbitals. The relativistic effects are taken into account within the scalar relativistic approximations. The total energy was calculated as a function of volume, and the calculation results were fitted to the third-order Birch–Murnaghan EOS to determine pressure and bulk modulus. The elastic constants can be obtained from the energy changes upon small strains (Vitos, 2007). The orthorhombic deformation was applied to calculate the tetragonal shear modulus C’ = (C11–C12)/2. The C11 and C12 elastic constants were then obtained from C’ and the bulk modulus K = (C11 + 2 C12)/3. Similarly, monoclinic distortion was used to calculate C44.
3 Results and discussion
The experimental conditions and crystal parameters of Pt are summarized in Table 1 and obtained elastic constants are summarized in Table 2. As we observed that pressures based on the ruby scale were different before and after IXS measurements (see Table 1), experimental volumes obtained using Bragg reflections measured before, between, and after IXS scans were considered to be representative during IXS measurements. Cijs obtained in this study are shown in Table 2 and observed and calculated sound velocities at ambient conditions are summarized in Table S1 in supplementary information. Experimental and calculated Cijs in this study were plotted versus pressure in Fig. 3 together with those in previous studies (Macfarlane et al., 1965; Menéndez-Proupin and Singh, 2007). The present Cijs increase monotonically with pressure as it can be easily seen from Fig. 3. The values of C11 and C44 are in good agreement with those obtained in previous studies. While values of C12 are slightly smaller between 5 and 15 GPa than those in the previous studies, they are generally consistent. The calculated Cijs based on LDA show similar values to those of Macfarlane et al. (1965) obtained based on an ultrasonic method, and Menéndez-Proupin and Singh (2007) that also adopted LDA. On the other hand, the Cijs calculated based on GGA are smaller than the previous studies, probably because the GGA method tends to underestimate elastic moduli as was pointed out by Dewaele et al. (2004). The present study gives the first experimental results of Cij under pressure, which reasonably agree with the LDA calculations.
Experimental conditions with crystal parameters and densities.
| Run # | λbefore/λafter | Pabefore/Paafter | P | a | V | ρ |
| [nm] | [GPa] | [GPa] | [Å] | [Å3] | [g/cm3] | |
| Pt001 | 0.0001 | 0.0001 | 3.92268(4) | 60.360(2) | 21.468(1) | |
| Pt002 | 694.63/694.62 | 0.96/0.93 | 0.95(2) | 3.9188(3) | 60.179(12) | 21.532(4) |
| Pt003 | 696.44/696.44 | 5.99/5.99 | 5.99(–) | 3.8956(3) | 59.117(14) | 21.919(5) |
| Pt004 | 697.96/697.81 | 10.27/9.85 | 10.06(30) | 3.8808(6) | 58.449(26) | 22.169(10) |
| Pt005 | 699.92/699.11 | 15.90/13.56 | 14.7(17) | 3.8609(6) | 57.551(25) | 22.516(10) |
| Pt006 | 702.14/701.46 | 22.39/20.39 | 21.4(14) | 3.8360(6) | 56.447(27) | 22.956(11) |
a Pressures were measured before and after IXS measurements based on a ruby scale with λ0 = 694.28 nm (Zha et al., 2000).
Obtained elastic constants (Cij, KS, KT, and G).
| Run # | C 11 | C 12 | C 44 | K S | K T a | G VRH |
| [GPa] | [GPa] | [GPa] | [GPa] | [GPa] | [GPa] | |
| Pt001 | 348.7(13) | 245.8(13) | 73.4(2) | 280.1(9) | 274.1(9) | 63.7(5) |
| Pt002 | 361.4(26) | 261.2(26) | 74.9(4) | 294.6(20) | 288.3(19) | 63.7(11) |
| Pt003 | 382.7(49) | 269.3(49) | 86.3(10) | 307.1(36) | 300.6(36) | 72.9(21) |
| Pt004 | 393.2(102) | 284.3(101) | 89.0(44) | 320.6(75) | 313.8(74) | 73.1(46) |
| Pt005 | 426.2(65) | 308.4(65) | 100.8(14) | 347.6(49) | 340.3(48) | 81.2(29) |
| Pt006 | 496.2(62) | 371.5(62) | 118.6(10) | 413.1(46) | 404.5(46) | 91.6(28) |
a KT values were calculated using α of 2.685(150)·10−5 (Gschneidner, 1964), γ of 2.72(3) (Fei et al., 2007), and 300 K.
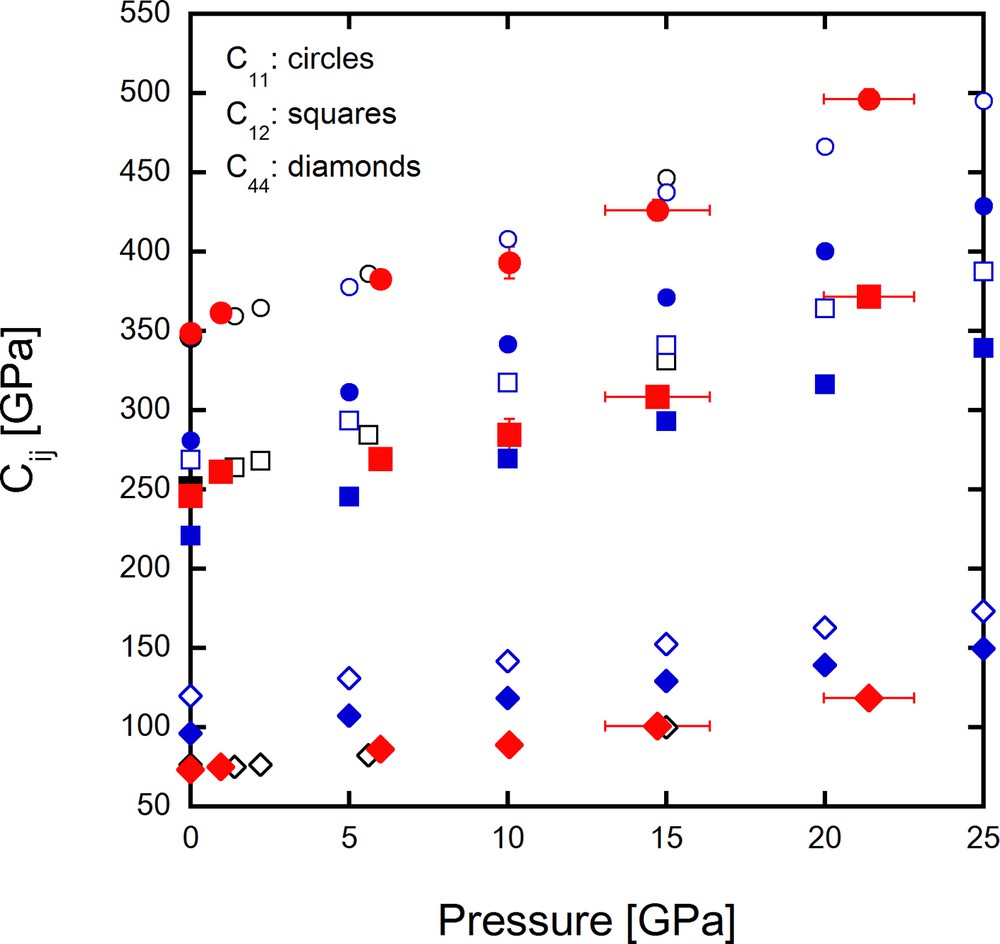
Values of Cij obtained in this study compared with previous studies. Circles, squares, and diamonds represent C11, C12, and C44, respectively. Red symbols are Cijs based on IXS, and blue open and solid symbols are those by theoretical calculation with LDA and GGA methods in this study, respectively. The black solid and the open symbols are from Macfarlane et al. (1965) and Menéndez-Proupin and Singh (2007), respectively. Macfarlane et al. (1965) obtained Cij values at ambient pressure based on an ultrasonic method. On the other hand, Menéndez-Proupin and Singh (2007) obtained Cij values by theoretical calculations.
Fig. 4 shows adiabatic bulk moduli (KS) and shear moduli (G) calculated using the Cijs obtained in the present study. As can be seen from Fig. 4, KS and G increase monotonically with pressure. Isothermal bulk moduli (KT), also plotted in Fig. 4, were obtained using the thermodynamic relation as follows:
| (2) |
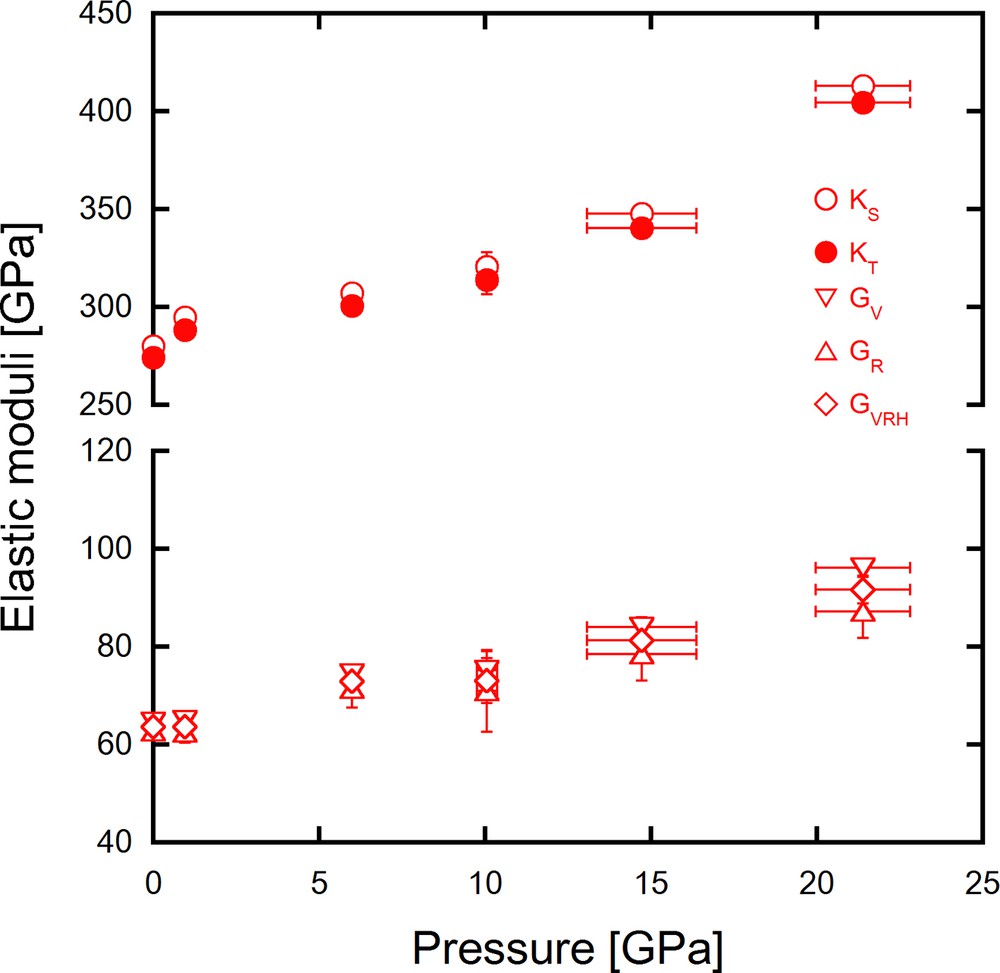
Adiabatic and isothermal bulk moduli (KT and KS) and shear moduli (G) as a function of a pressure. Shear moduli (GV, GR, GVRH) were calculated by Voigt, Reuss, and Voigt–Reuss–Hill averages.
where α, γ, and T represent the thermal expansion coefficient, the Grüneisen parameter, and the absolute temperature, respectively. In this study, we assumed α to be independent of pressure and equal to 2.685(150)·10−5 [K−1] (Gschneidner, 1964) and γ = γ0(V/V0)q = 2.72(3) × (V/V0)0.5(5) (Fei et al., 2007). Errors of KT were calculated using errors of α, γ, and KS. In order to calculate pressures, we used the definition of isothermal bulk modulus as follows:
| (3) |
where KT and P are isothermal bulk modulus and pressure, respectively. V is the volume at a given pressure. By integrating Eq. (3), experimental pressures can be calculated without any pressure scale. The pressures in this study were calculated using Eq. (4) and the trapezoidal rule as follows:
| (4) |
where i represents a certain experimental condition. The calculated pressures are summarized in Table 3, which also includes the pressures acquired using the ruby scale and the previously reported EOSs of Pt. Fig. 5 displays the difference between experimental pressures determined based on Eq. (4) with KT in the present study and those of other pressure scales (Pt), which are shown as a function of the normalized volume. Pressures acquired in this study are in good agreement with other pressure scales, as shown in Fig. 5.
Volumes and pressures of Pt with pressures based on previous pressure scales.
| Run # | V [Å3] | P a | PBM (J82) | PV (J82) | PV (H89) | PV (D04) | PV (F07) | PBM (F07) | PV (M09) |
| Pt001 | 60.360(2) | 0.0001 | 0 | 0 | 0 | 0 | 0 | 0 | 0 |
| Pt002 | 60.179(12) | 0.84(6) | 0.82 | 0.81 | 0.8 | 0.83 | 0.84 | 0.84 | 0.83 |
| Pt003 | 59.117(14) | 6.09(10) | 5.94 | 5.92 | 5.88 | 6.01 | 6.08 | 6.07 | 6 |
| Pt004 | 58.449(26) | 9.58(16) | 9.46 | 9.44 | 9.39 | 9.57 | 9.67 | 9.65 | 9.55 |
| Pt005 | 57.551(25) | 14.65(21) | 14.6 | 14.59 | 14.55 | 14.76 | 14.89 | 14.86 | 14.72 |
| Pt006 | 56.447(27) | 21.86(24) | 21.61 | 21.62 | 21.62 | 21.81 | 21.98 | 21.92 | 21.75 |
a Pressures in this study were calculated with calculated KS = (1 + α γ T) KT.
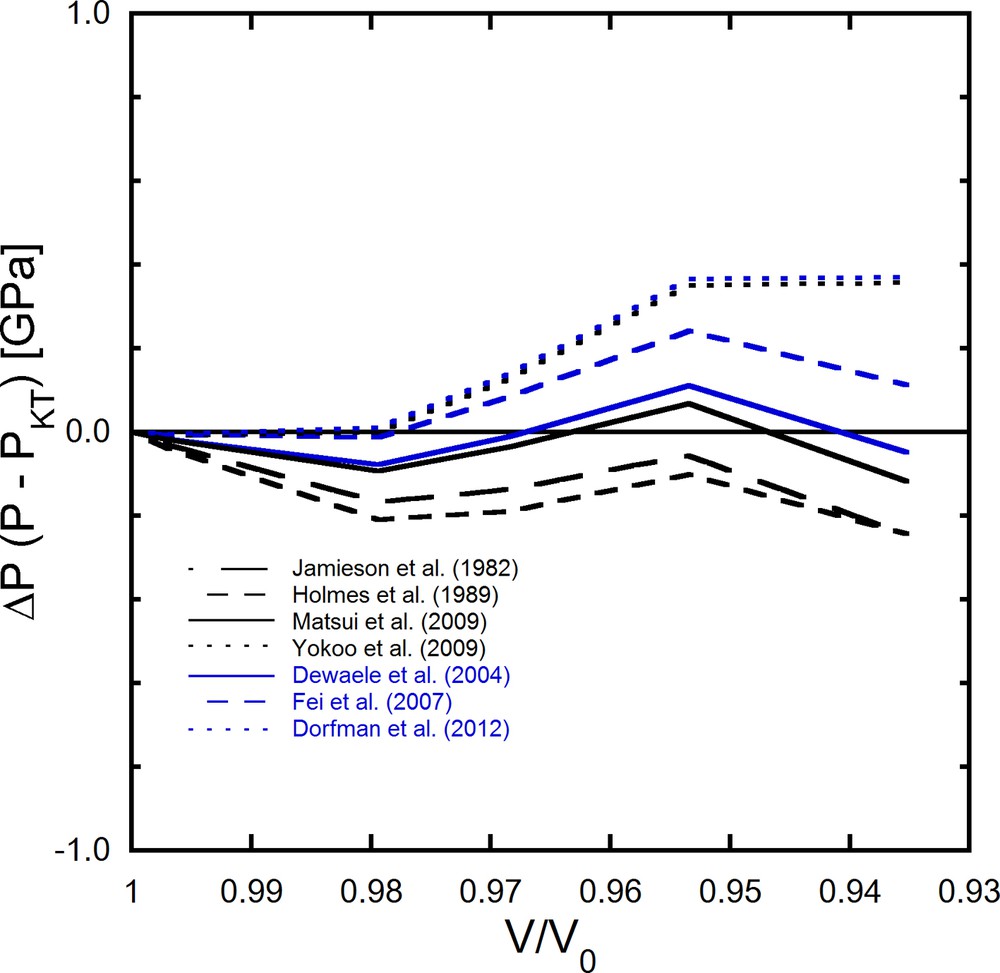
Pressure differences between primary pressures in this study based on KT and other scales.
In order to establish a primary pressure scale, we fitted third-order Birch–Murnaghan EOS (3BM) and Vinet EOS (V-EOS) to the P–V data (Birch, 1952; Vinet et al., 1987). The EOSs are expressed as follows, respectively:
| (5) |
| (6) |
where KT0, K’, and V0 represent the isothermal bulk modulus at 0 GPa, the pressure derivative of the bulk modulus at 0 GPa, and the volume at 0 GPa. P and V are the pressure and volume of Pt at the pressure. The fitting parameters of KT0, K’, and V0 are summarized in Table 4, with previous studies. The fitting results of this dataset with fixing V0 show that KT0 of 273(3) GPa is in good agreement with the KT0 value of 274(1) GPa obtained from the KS value at ambient pressure through the IXS measurements in this study and the previously reported value of 277 GPa based on ultrasonic measurements (Macfarlane et al., 1965). Fig. 6 illustrates the pressure differences between the present pressure scale based on V-EOS, with KT = 274.1 GPa and K’ = 5.17 and the previously reported V-EOSs up to 400 GPa. Our pressure scale is excellently consistent with that of Matsui et al. (2009) based on shock experiment data and is in good agreement with the Fei and Dewaele scales. At the same time, pressures of the Dorfman, Holems, Jameison, and Yokoo scales are considerably higher than ours over the whole range, up to 400 GPa.
Parameters for the equation of state.
| V 0 | K T | K’ | EOS type | Ref. |
| 60.366(13) | 271.7(45) | 5.35(47) | 3BM | This study |
| 60.367(13) | 271.4(45) | 5.43(47) | VEOS | This study |
| 60.360(2)* | 273.3(27) | 5.23(35) | 3BM | This study |
| 60.360(2)* | 273.0(28) | 5.30(36) | VEOS | This study |
| 60.360(2)* | 274.1† | 5.12(8) | 3BM | This study |
| 60.360(2)* | 274.1† | 5.17(8) | VEOS | This study |
| 60.38* | 268.2(30) | 5.63(40) | 3BM | This study |
| 60.38* | 268.0(30) | 5.70(39) | VEOS | This study |
| 60.38* | 270.3(1) | 5.267(4) | 3BM | Jamieson et al. (1982) a |
| 60.38* | 268.9(2) | 5.48(1) | VEOS | Jamieson et al. (1982) a |
| 60.38* | 266 | 5.81 | VEOS | Holmes et al. (1989) |
| 60.38* | 273.6(20) | 5.23(8) | VEOS | Dewaele et al. (2004) |
| 60.38* | 277 | 4.95(2) | 3BM | Fei et al. (2007) |
| 60.38* | 277 | 5.08(2) | VEOS | Fei et al. (2007) |
| 60.38* | 276.07 | 5.3 | VEOS | Dorogokupets and Oganov (2007) |
| 60.38* | 272.8(22) | 5.22(10) | VEOS | Zha et al. (2008) b |
| 60.38* | 273 | 5.2 | VEOS | Matsui et al. (2009) |
| 60.55 | 276.4 | 5.48 | VEOS | Yokoo et al. (2009) |
| 60.38* | 277 | 5.43(2) | VEOS | Dorfman et al. (2012) |
| 60.38* | 275.3 | 5.28 | VEOS | Sokolova et al. (2013) |
* V0 was fixed during the EOS fitting.
† KT was fixed at a value obtained from KS in ambient conditions.
a EOSs were re-fitted based on their PV data.
b EOS was re-fitted based on their PV data with Fei et al. (2007) and Dewaele et al. (2004).
Pressure differences between the Pt scale in this study and previous studies. The pressures based on our study were calculated using Vinet EOSs with V0 = 60.360 Å3, KT = 274.1 GPa, and K’ = 5.17. Parameters of Vinet EOSs for previous studies are summarized in Table 4.
4 Conclusion
We measured the IXS spectra of a single crystal of Pt from 1 bar to 20 GPa. The volumes of the sample were also measured using Bragg reflections before, between, and after IXS scans at each pressure point. The sound velocities of Pt were calculated using the sine dispersion relation. The parameters qmax for longitudinal and transversal modes were determined by fitting all peak energies of longitudinal or transversal modes to a single sine function between momentum transfers of 1.5 and 5.5 nm−1. The qmax values were fixed during Cij optimization. The Cijs acquired using the sine relation are consistent with those based on the ultrasonic method and the calculation with LDA. As an implication, we established the primary pressure scale for Pt. Our pressure scale showed excellent agreement with the pressure scale suggested by Matsui et al. (2009) and is consistent with those by Dewaele et al. (2004) and Fei et al. (2004, 2007). On the other hand, pressure scales by Jamieson et al. (1982), Holmes et al. (1989), Yokoo et al. (2009), and Dorfman et al. (2012) are significantly higher than the scale of the present work.
Acknowledgments
This work was supported by JSPS KAKENHI Grant Number 15H02128 to A.Y. S.K. was partly supported by JSPS KAKENHI Grant Numbers 26247089, 15H05831, and 16K13902. S.K. thanks M. Polovinka for editing the English text. The experiments were conducted under a contract at SPring-8 (proposal numbers 2016B1313 and 2017A1266). We appreciated discussions with Prof. Mashimo on VP and VS at ambient pressure.