

1 Introduction
Subduction refers to sliding process of one tectonic plate under another. During this process, the hydrous fluids ejected from subducting slab react with surrounding ultramafic rocks to produce serpentinites (Hyndman and Peacock, 2003; Peacock and Wang, 1999). The deeply formed serpentine and other hydrous silicates (amphibole, talc, chlorite, mica, talc) destabilize when increasing pressure and temperature and release water at different depths in subduction zones (Hacker et al., 2003). Serpentine minerals that have unique physical properties compared with nominally anhydrous mantle minerals (Escartín et al., 1997; Hilairet et al., 2007) can hold an average of 13 wt.% of water (Ulmer and Trommsdorff, 1995. Wunder and Schreyer, 1997), while the other hydrous minerals bring water in less important quantity (Hacker et al., 2003; Schmidt and Poli, 1998). The upward flow from these silicates and in-situ hydration in the mantle wedge contribute to the accumulation of large bodies of serpentinites, which are detected by seismic tomography (DeShon and Schwartz, 2004; Hyndman and Peacock, 2003), and to the exhumation of high-pressure rocks (Guillot et al., 2009). These reactions, hydration/dehydration, in the mantle wedge and slab of subduction zones significantly modify the physical and mechanical properties of the altered rocks by lowering their melting temperature, viscosity, and density (Karato and Wu, 1993; Kushiro et al., 1968; Schmidt and Poli, 1998). This effect can influence the style of deformation at the lithosphere scale (Christensen, 1978; Escartín et al., 2001; Hirth and Guillot, 2013), and have a strong impact on the evolution of active tectonic zones (Guillot et al., 2015).
Seismic anisotropy, correlated with mineral preferred orientation (MPO) and also with crystal preferred orientation (CPO) and lattice preferred orientation (LPO), is considered as a powerful tool for interpreting flow kinematics and dynamics in the mantle and subduction zones (Fouch and Rondenay, 2006; Long and Silver, 2008; Long and Van der Hilst, 2006; Nakajima and Hasegawa, 2004; Nicolas and Christensen, 1987; Park and Levin, 2002; Savage, 1999). For subduction zones, we talk about trench-parallel seismic anisotropy caused by one of the following factors: mantle flow parallel to the trench associated with slab rollback (Long and Silver, 2008; Russo and Silver, 1994), crystal-preferred orientation (CPO) of wet olivine (Kneller et al., 2007, 2008), or hydration of subvertical fault zones in subducting oceanic plates (Faccenda et al., 2008).
Generally, the knowledge of the seismic anisotropy of serpentine minerals is essential to unravel the lithosphere dynamics (Bostock et al., 2002; Jung, 2009; Mookherjee and Capitani, 2011). Several authors have studied the seismic anisotropy of natural serpentine minerals collected from various ophiolite points within the world – for instance, Cuba, Greece, Omane, China, etc. (see Bezacier et al., 2010; Dewandel et al., 2003; Horen et al., 1996; Schmitt et al., 2007). Furthermore, other authors have focused on the seismic anisotropy of experimental serpentine minerals (see Katayama et al., 2009). These studies have emphasized the relationship between P-compressional and S-shear wave velocities (Vp and Vs) and the crystal preferred orientation (CPO) of serpentine minerals. Commonly, the CPO is controlled by the serpentinization degree. However, thus far, no study has investigated the seismic velocities and anisotropy of the serpentinite of the Bou Azzer ophiolite (Morocco).
Practically, CPO of serpentine minerals has been measured by Ultrasonic Pulse Transmission (UPT) technique (Kern, 1982; Kern et al., 1997), and most recently by Brillouin spectroscopy (Bezacier et al., 2010) and Electron Backscatter Diffraction (EBSD) (Jung et al., 2006; Van de Moortele et al., 2010).
In this paper, we present the first results of seismic velocities and anisotropy of two serpentinite samples collected from the Ait Ahmane fault zone of the Bou Azzer ophiolite, central Anti-Atlas of Morocco, using EBSD. The mineralogical analyses were investigated based on microscopic observations and Raman spectroscopy data to confirm the most dominant mineral phases of the studied serpentinite.
2 Samples and analytical method
2.1 Samples
Two serpentinite samples collected from the Ait Ahmane fault zone of the Bou Azzer ophiolite, central Anti-Atlas of Morocco, were studied (Fig. 1). Sample AABH4 (30.480°N 6.603°W) contains the lowest serpentine content 30%, while sample AABH9 (30.474°N 6.598°W) contains the highest serpentine content 85% (Table 1). For both samples, the mineral phases mainly consist of antigorite and small amounts of magnetite (Table 1).
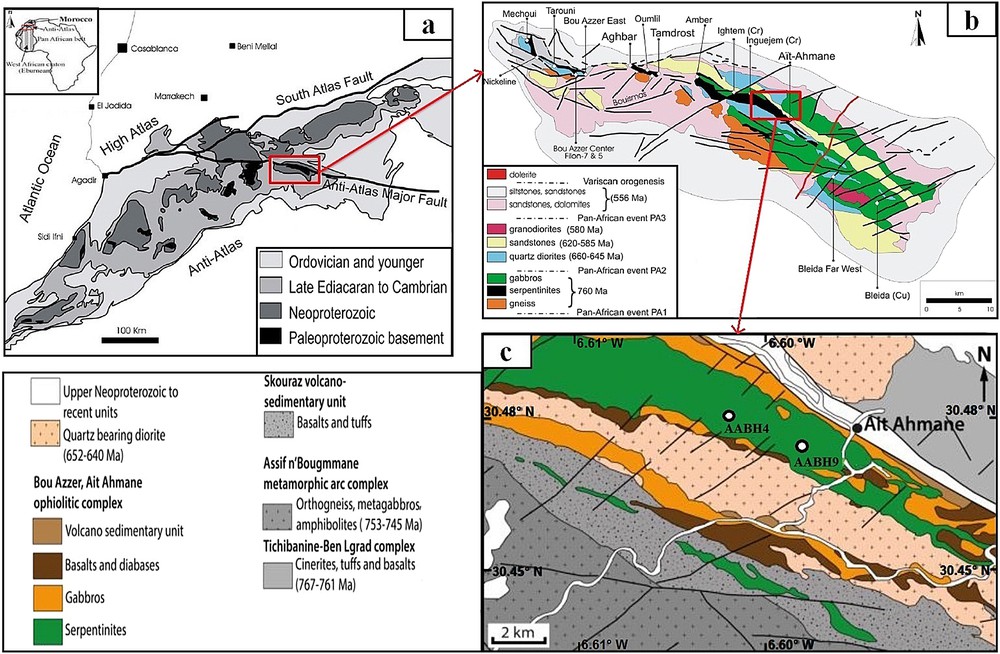
Serpentinite samples location: a) map of the Anti-Atlas belt (Gasquet et al., 2008), b) geological map of the Bou-Azzer district (modified by Oberthur et al., 2009 after Leblanc, 1981), c) simplified map of the Ait Ahmane area, from the geological map of Admou et al. (2013), modified after Hodel et al. (2017).
Samples description. Ant: antigorite, Mgt: magnetite.
| Sample | AABH9 | AABH4 |
| Location | Ait Ahmane | Ait Ahmane |
| Ant (%) | 85 | 30 |
| Mg (%) | 8 | 12 |
2.2 Analytical method
The seismic features can be calculated from the orientation data (foliation and lineation) of such mineral by using a specific instrument and software program (Mainprice, 1990).
Commonly, for the serpentinite samples, the foliation has been determined from the compositional layering and elongation of serpentine, while the lineation has been determined from the elongation of serpentine and diopside by performing a grain-shape analysis of digitized lines in a plane (Panozzo, 1984). Furthermore, according to Bezacier et al. (2010), it is necessary to ignore the minor phases such as diopside and magnetite in order to calculate the seismic anisotropy of serpentinite.
In this work, the crystal preferred orientation (CPO) was measured on individual antigorite grains of the total rock (sample) using the Electron Backscatter Diffraction (EBSD) technique. This technique is based on the analysis of diffraction patterns (Kikuchi bands) generated by the interaction between an electron beam and the crystalline surface. First, the samples were cut parallel to the lineation (x) and perpendicular to the foliation (z) for microstructure analysis.
The EBSD patterns were measured using SEM JEOL 6380 device of the Earth and Environmental Sciences School at the Seoul National University and were analyzed using HKL Channel 5 software. Channel 5 software uses a Hough transform for automated band detection (Day, 2008; Krieger Lassen, 1998). An accelerating voltage of 20 kV at a working distance of 15 mm was employed for the SEM. At each point, the EBSD patterns were indexed manually so as to ensure an accurate solution. EBSD data were collected simultaneously during mapping and were used to ensure proper indexation of patterns. A matching unit for EBSD patterns indexation of antigorite was created from the structural data in Capitani and Mellini (2004). A maximum of seven bands were detected and between 50 and 70 reflectors were used for indexation.
3 Results and discussion
3.1 Mineralogical features of serpentinite
The petrographic analysis reveals that the antigorite is the dominant serpentine mineral in the studied serpentinite (Fig. 2). In addition, we have detected a considerable amount of lizardite and chrysotile (Fig. 2), and a subordinate amount of dolomite, calcite, and magnesite (Fig. 3). Moreover, we have identified a small amount of fine blebs and grains of scattered sulfides (Fig. 3). The opaque minerals are mainly represented by chromite and magnetite (Fig. 3). The brucite is quite common in samples, which appears as inclusions in serpentine.
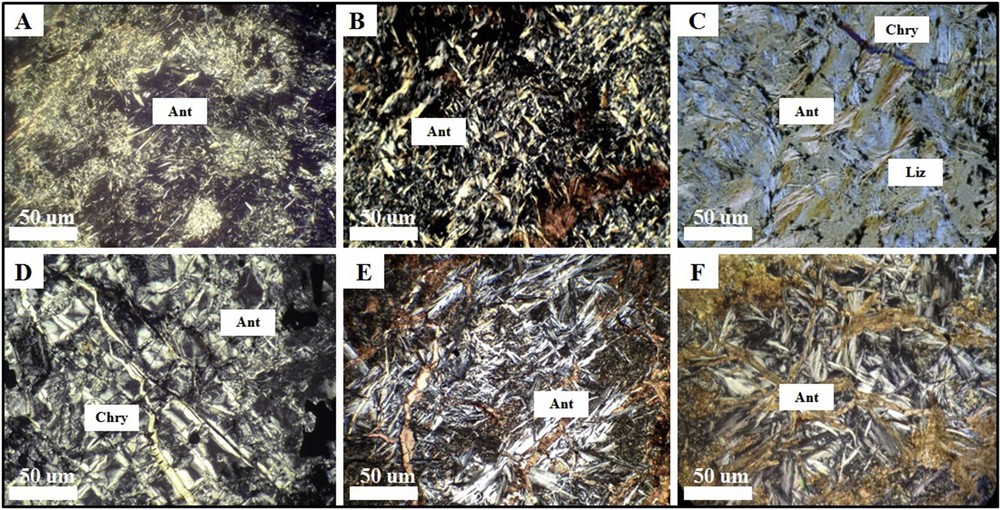
Optical photomicrographs of the studied serpentinite: A) nucleation of very fine raw fibers in antigorite, B and C) development of antigorite, D) pseudomorphic texture (hourglass texture), E and F) plumose and paillette texture. Ant: antigorite, Chry: chrysotile, Liz: lizardite.
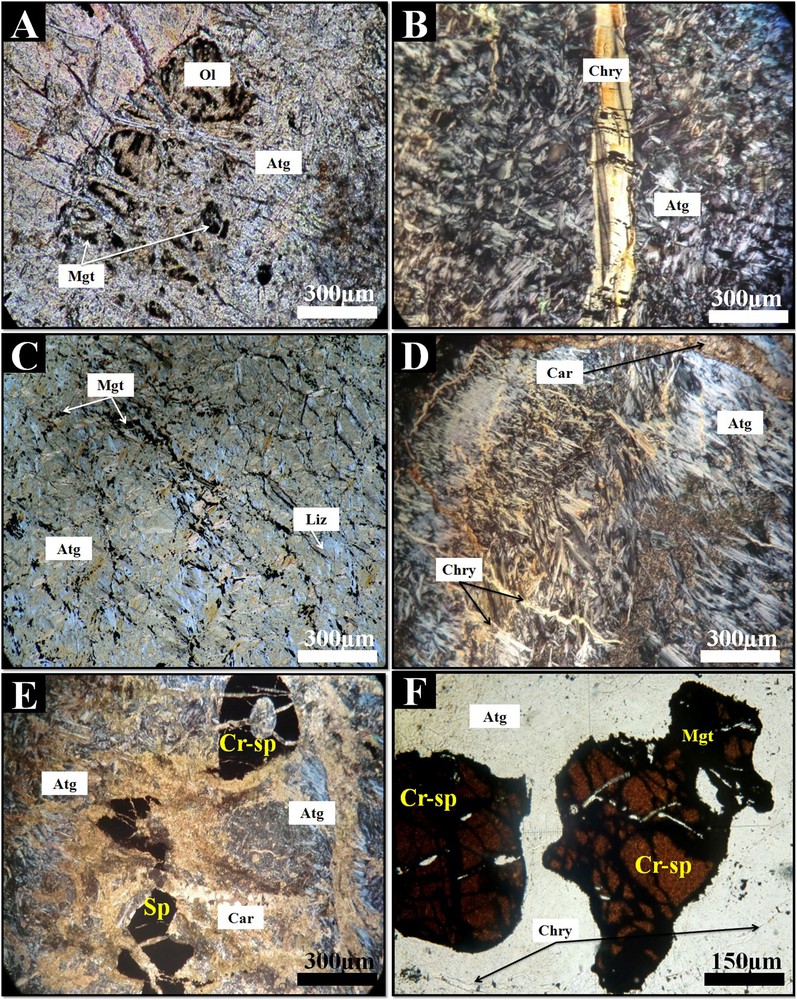
Textures of studied serpentinite; A) mesh texture, B) hourglass texture, C and D) plumose and paillette textures, E and F) Cr-spinel with unaltered core and altered magnetite rim. Ol: olivine, Ant: Antigorite, Chry: chrysotile, Liz: lizardite, Mgt: magnetite, Cr–sp: chromian spinel.
The occurrence of serpentine minerals was confirmed by Raman spectroscopy analysis (Fig. 4). The spectra of antigorite mineral appears at peaks 370 cm−1, 1043.6 cm−1, 1044 cm−1, and 3700 cm−1, and between peaks 3670 cm−1 and 3680 cm−1. The spectra of lizardite occurs at peaks ∼390 cm−1, 3650 cm−1, and 3700 cm−1, and between peaks 1060 and 1162 cm−1. The mixed lizardite/antigorite spectra are also observed. The spectra of chrysotile mineral appears at peaks 235 cm−1, 390 cm−1, 690 cm−1, 1110 cm−1, 3649 cm−1, 3690 cm−1, 3699 cm−1, and 3700 cm−1.
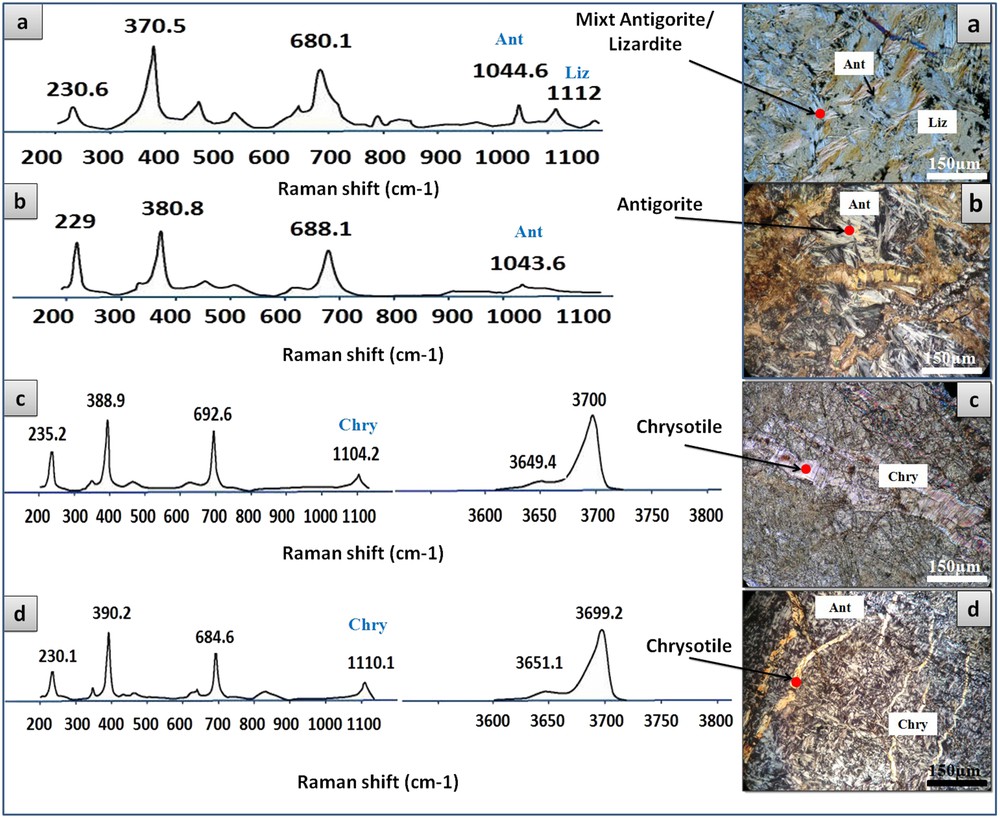
Raman spectra of studied serpentinite.
The identified serpentine minerals usually occur as non-pseudomorphic texture (Fig. 3B,C,D). The serpentine minerals also appear as pseudomorphic bastite texture after pyroxene and as mesh texture after the initial olivine grains (Fig. 3A). These textures reveal the presence of three different types of veins that fill open tension fractures in the Ait Ahmane zone. These veins contain a subordinate amount of secondary magnetite and sulfides. These latter occupied any penetrative way of rock and show a very large pellet texture interspersed by chrysotile and carbonates veins.
Chrysotile occurs as large serrate veins, irregular fibrous, parallel bands or as mesh core texture (Fig. 3B). Commonly, the chrysolite textures appear more in tectonized fields (Alansari et al., 2015). Carbonate minerals include magnesite and dolomite, and calcite appears as anhedral grains in irregular aggregates (Fig. 3E) and in a vein-cutting matrix. Spinel is represented by chromian spinel. It forms blood-red anhedral grains, usually zoned with light gray core and altered to secondary magnetite at its peripheries (Fig. 3F). Magnetite exists as anhedral fine grains disseminate throughout the rock as show Scanning Transmission Electron Microscope (STEM) photos (Fig. 5). Talc mainly occurs in carbonate–antigorite serpentinites as fine fibrous or dense scaly aggregates.
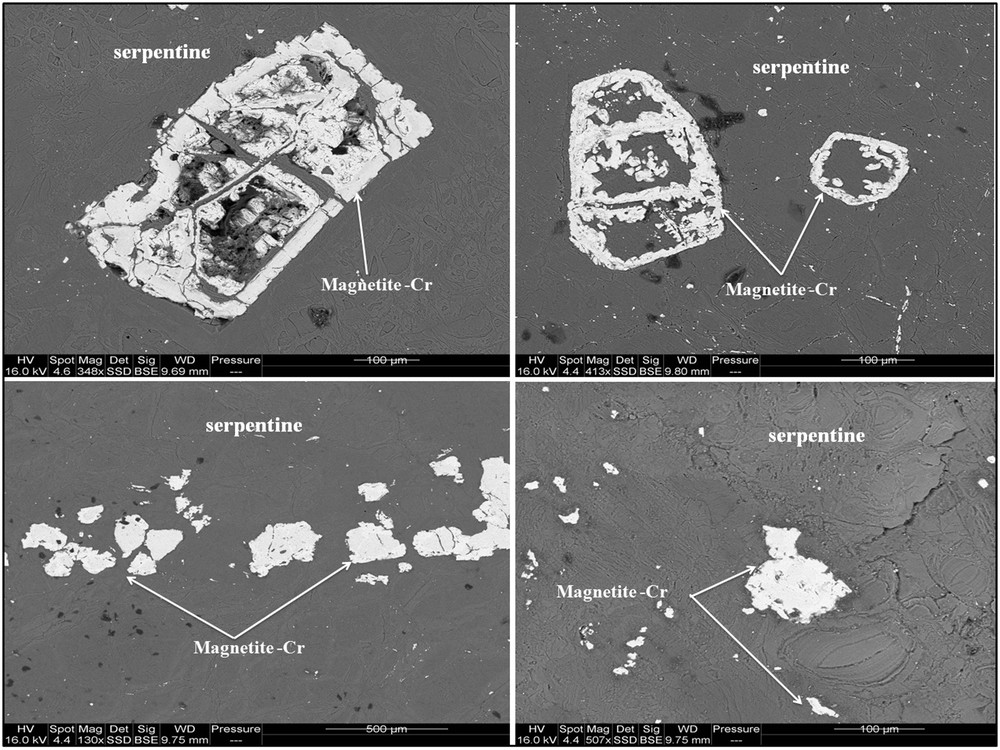
SEM observations showing magnetite in serpentinite.
In the literature, it is proposed that the mode of formation of serpentine minerals (chrysotile, lizardite, and antigorite) depends on P–T conditions and metamorphic processes (Evans, 2004; Schwartz et al., 2013). Schwartz et al. (2013) studied the phase changes in natural samples collected from the Alpine paleo-accretionary wedge. They emphasized that: (i) lizardite and chrysotile are the only thermodynamically stable compounds under 320 °C; (ii) lizardite and antigorite coexist, and antigorite develops at the expense of lizardite in the 320 °C-390 °C range; (iii) above 390 °C and 12 kbar, antigorite is the only stable phase; (iv) above 460 °C, antigorite begins to destabilize into olivine. Evans’ (2004) investigations indicate that the crystallization of antigorite at the expense of chrysotile or lizardite is made by dissolution–precipitation processes.
Whatever the occurrence of the three serpentine minerals in the investigated serpentinite rocks, which may be made by the sluggish growth kinetics of the antigorite (Evans, 2004), the antigorite is the dominant species. Moreover, the abundance of antigorite, on the one hand, and the association of serpentinites with subduction facies, on the other one, indicated that mantle serpentinization has occurred in subduction context in the studied region.
3.2 Seismic features of serpentinite
3.2.1 Crystal preferred orientation (CPO) of antigorite
Seismic properties (seismic velocity and anisotropy) are essential for deformation interpretation (Reynard, 2013). The seismicity of minerals or rocks is described by symmetrical fourth-rank tensors, embodying the elastic or other properties of crystalline anisotropic of the mineral (Nye, 1957) depending on crystal-preferred orientation (CPO) (Reynard, 2013).
Serpentine CPO can arise from a range of processes, including those related to deformation, such as dislocation glide and grain rotation, and to crystal growth, such as topotaxy or growth by void-filling (Bezacier et al., 2010). Brownlee et al. (2013) have studied the crystallographic relationships between olivine (ol) and antigorite (atg). They argued that the (010)atg axis is always parallel to the (001)ol axis, and the (001)atg axis is dominantly parallel to the (100)ol axis or secondarily parallel to the (010)ol axis (Fig. 6). Additionally, they summarized that the identification of serpentine CPO can be investigated to explain trench-parallel seismic anisotropy in order to infer the dominant slip system that causes the deformation of the Earth's crust and upper mantle.
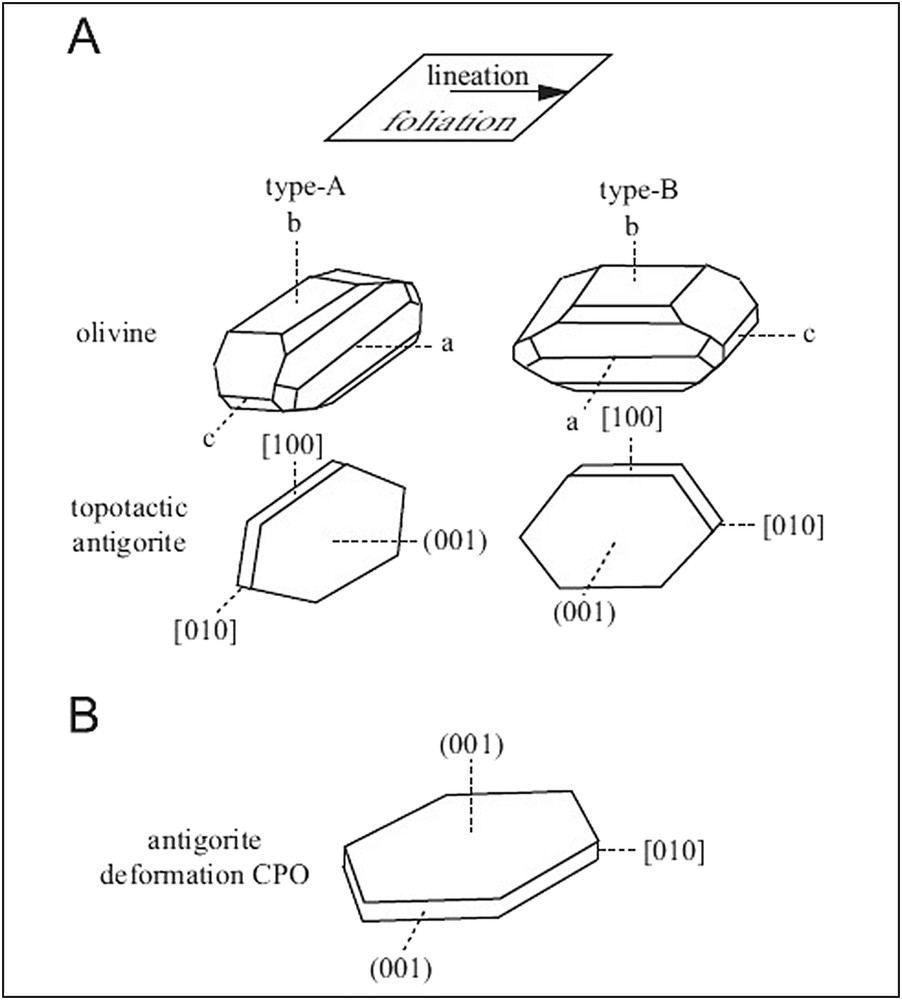
Scheme illustrating the expected orientations of olivine and antigorite for; A) topotaxy on olivine type-A and type-B CPO, and B) antigorite deformation-induced CPO (Brownlee et al., 2013).
The CPO of natural serpentine of Ait Ahman (Bou Azzer ophiolite) is shown in pole and inverse pole figures (Fig. 7). The sample AABH9 shows that the serpentine [001] axis is aligned normal to the foliation and the [010] axis is aligned subparallel to the lineation, indicating that the dominant slip system of antigorite of Bou Azzer ophiolite is (001)[010]. These results are significantly different from those achieved experimentally by Katayama et al. (2009). Katayama et al. (2009) confirmed that the [100] axis is strongly aligned subparallel to the lineation, and concluded that the serpentine deformed by a dominant slip system of (001)[100]. Furthermore, the sample AABH4 shows that the serpentine [001] axis is aligned normal to the foliation, while both axes [100] and [010] are aligned subparallel to the lineation, revealing a mixed slip system of (001) [010] and (001) [100]. Consequently, the difference in the CPO results for both samples is probably due to the high magnetite amount in sample AABH4.
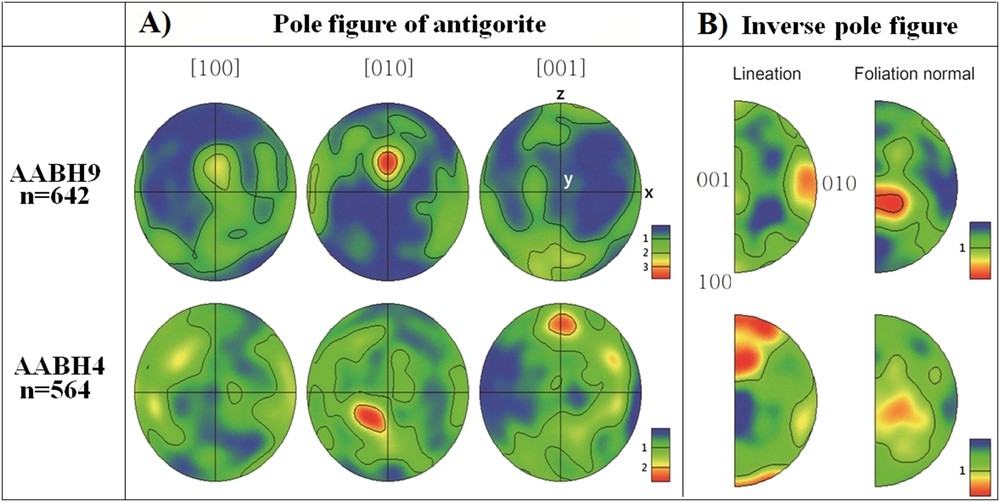
Pole figures and inverse pole figures of serpentine. The color coding represents the density of the data points. The contours correspond to multiples of a uniform distribution.
3.2.2 Seismic velocity and anisotropy of antigorite
The seismic anisotropy caused by the antigorite CPO of both samples collected from the Bou Azzer ophiolite (AABH9 and AABH4) is presented in Fig. 8. The seismic anisotropy is plotted in such a way that the center of the pole figure (z) corresponds to the normal direction to the horizontal plane (foliation), and the east–west direction corresponds to the flow direction (lineation, X). The P-wave velocity is the fastest in the direction subparallel to lineation (X: flow direction). The P-wave velocity is slow near the center of the plot where the slowest serpentine [001] axis is aligned subnormal to foliation. Commonly, for all specimens, the polarization direction of the fast shear wave (Vs1) is oriented nearly normal to the flow direction, which is shown in the center of the pole figure for Vs1 polarization.
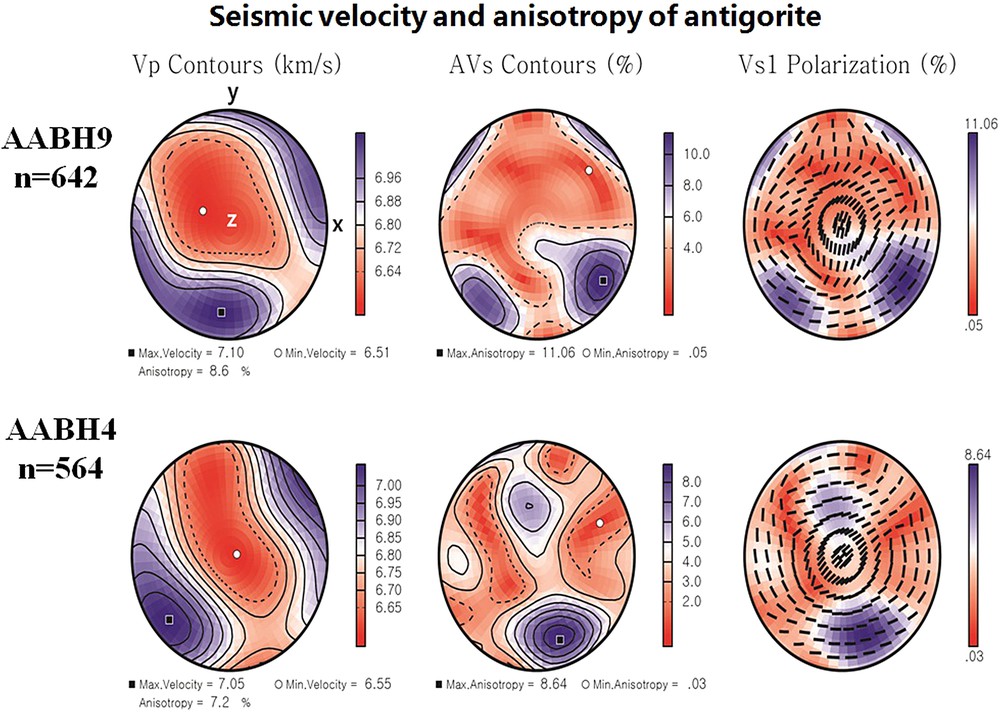
Seismic anisotropy of the studied serpentine. The effects of the degree of serpentinization and composition on seismic anisotropy are shown in equal area and lower hemisphere projections. The center of the stereo net corresponds to vertical propagation.
The effect of the serpentinization degree on the magnitude of seismic anisotropy is also shown in Fig. 9 and summarized in Table 2. The sample with the lowest serpentine content (30%, sample AABH4) shows the lowest P- and S-wave anisotropy (Vp = 7.2% and AVs = 6.55%), while the sample with the highest serpentine content (85%, sample AABH9) shows the highest P- and S-wave anisotropies (Vp = 8.6% and AVs = 11.06%). These results confirm that the seismic anisotropy magnitude increases with increasing the serpentine content in the studied samples.
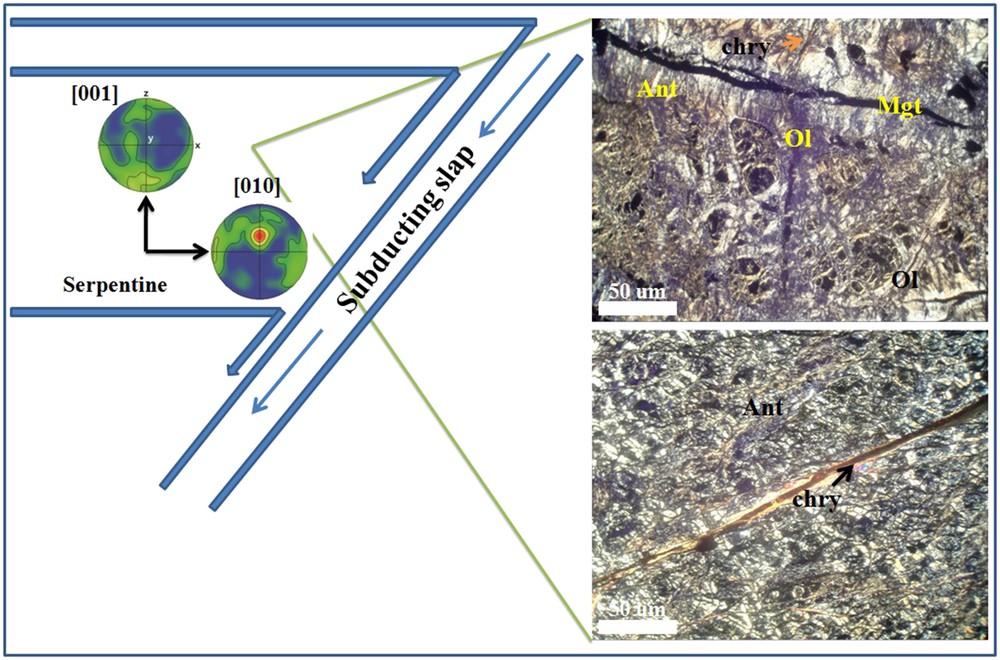
Simplified scheme of the flow model of material circulation in the mantle wedge due to serpentinization. Ant: antigorite, Chry: chrysotile, Ol: olivine, and Mgt: magnetite.
Antigorite CPO, and P-wave (Vp) and S-wave (AVs) anisotropy of the studied samples.
| Sample | AABH9 | AABH4 |
| CPO of antigorite | [001] ⊥ F | [001] ⊥ F |
| [010]//L | [010] and [100]//L | |
| Max. Vp (%) anisotropy | 8,6 | 11,06 |
| Max. AVs (%) anisotropy | 7,2 | 6,55 |
The positions of the maximum P-wave velocity and of the Vs1 polarization change with increasing the serpentine dipping angle (θ) (Jung, 2011). For the vertical propagation of seismic waves shown at the center of the stereonet, the polarization direction of the fast shear wave (Vs1) is nearly normal to the lineation (flow direction, x) for low dipping angles (θ = 0–10°) (sample AABH4) and subparallel to the flow direction for intermediate dipping angles (θ ≅ 30–45°) (sample AABH9). These results reveal that the trench-parallel seismic anisotropy in the subduction zones can be attributed to the serpentine's CPO deformed at both angles greater than 45° from the surface and low angle such as in horizontal shear (Guillot et al., 2015; Jung, 2011).
According to the obtained seismic results and based on the corner flow field model in the mantle wedge (Kneller et al., 2008; Long et al., 2007), we suggest that the serpentine flow of the Bou Azzer ophiolite may be developed above the subducting slabs (Fig. 9).
4 Conclusions
The mineralogical and seismic analyses of the natural serpentine of the Ait Ahmane fault zone of the Bou Azzer ophiolite, central Anti-Atlas of Morocco, allow us to conclude that:
- (1) the serpentinization process in this area produces characteristic structures that record mineralogical change history. The investigated serpentinite rocks reveal the presence of non-pseudomorphic and pseudomorphic textures. The pseudomorphic textures indicate a complete replacement of original mineral (a mesh texture replaces olivine and bastite replaces pyroxenes), which confirms that the harzburgites are pre-serpentinized rock;
- (2) the investigated rocks suffer from a variable degree of serpentinization and the dominant variety of serpentine mineral is antigorite. Furthermore, the abundance of the antigorite mineral and its association with subduction facies in the studied samples reveal that the serpentinization process occurred in subduction context;
- (3) the crystal preferred orientation (CPO) of the antigorite mineral are represented by the [010] axis aligned parallel to the lineation and to the [001] axis aligned normal to the foliation, indicating that serpentine has been deformed by a dominant slip system (001)[010];
- (4) the magnitude of seismic anisotropy caused by the CPO of the antigorite mineral strongly depends on the serpentinization degree;
- (5) the serpentine flow in the Bou Azzer ophiolite zone was developed above subducting slabs.
Acknowledgments
We would like to thank Dr. Haemyeong Jung from the Earth and Environmental Sciences School of the National University of Seoul for providing us the EBSD analysis. Also, we wish to thank the Managem Mining Company (SA) for supporting us during fieldworks.