

1 Introduction
Samos lies in mid-eastern Aegean Sea at the western edge of a zone of intense earthquakes and seismic faulting (Fig. 1), along the Greater Menderes River (Saroglu et al., 1992; Stiros et al., 2000). Since the 19th century, the island of Samos has been struck by numerous earthquakes of magnitude higher than 6, i.e. at least six earthquakes during the 19th century, of which one in 1904 and one in 1955, with magnitudes of 6.8 and 6.9, respectively (Guidoboni et al., 1994; Papazachos and Papazachou, 1997; Stiros, 1995). Multiple evidence of uplift have been reported in the literature at the northwestern coast of the island (see triangles in Fig. 1) in the form of notches and benches, which might correspond to co-seismic uplifts occurring approximately 500, 1500 and 3600–3900 years ago (Stiros et al., 2000). Conversely, subsidence has been noted on the southeastern coast of the island (see archaeological locations in Fig. 1), as indicated by the presence of submerged ancient remains (e.g., Simosi, 1991; Stiros, 1998; Stiros et al., 2000). However, no geomorphological studies have taken place to better elucidate the late Holocene palaeogeographical evolution of this area.
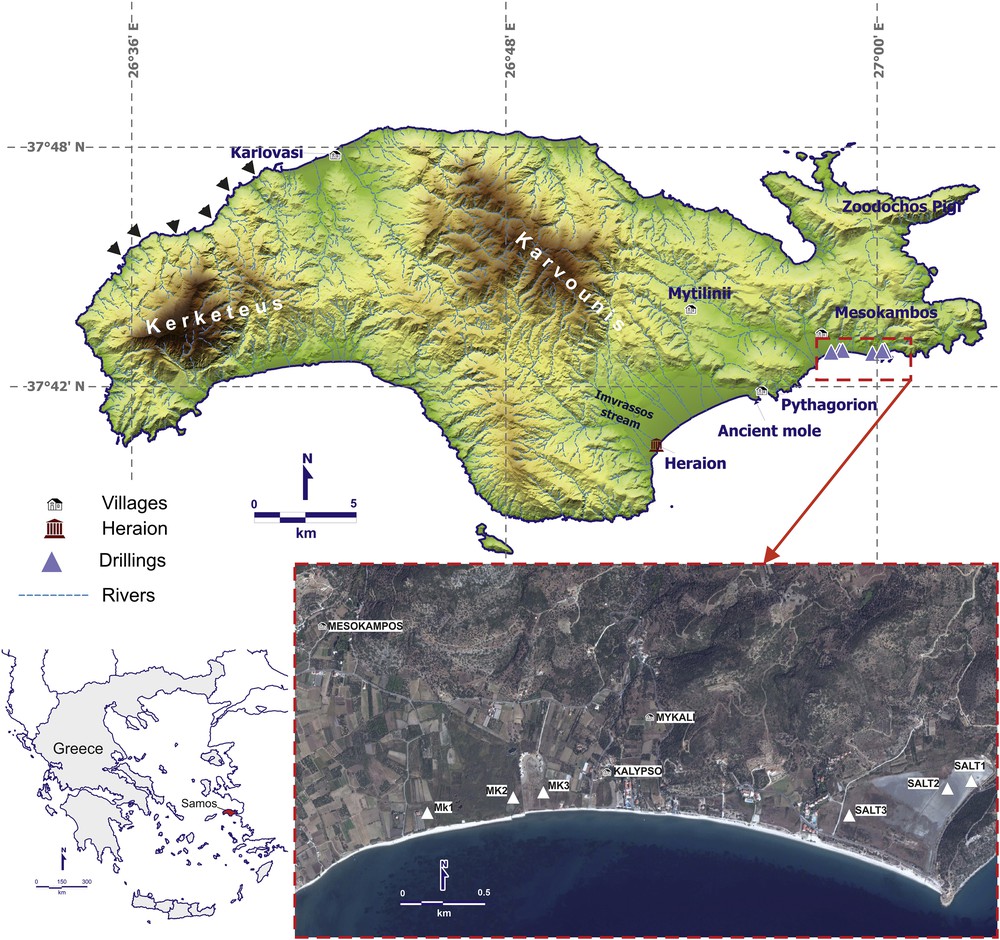
Study area. In the upper part of the figure (the island of Samos), the black triangles show coastal uplift sites (from Stiros et al., 2000). The bottom right figure shows the location of the boreholes (white triangles).
Palaeoenvironmental and palaeogeographic reconstructions based on a multi-proxy approach are particularly useful in environmental settings where sedimentary processes are strongly affected by different variables such as riverine supply, sea level fluctuations, local and regional tectonics, etc. (Brew et al., 2015; Ghilardi et al., 2014; Girone et al., 2013; Marriner et al., 2014; Vacchi et al., 2017). Such parameters have a primary control on the nature, source and distribution of sediments, and thus on the palaeogeographic evolution of the area. Therefore, different proxies such as archaeological, sedimentological, biological, etc., are to be utilised in order to gain a wider overview of such processes. Multiproxy investigations are also fundamental to better assess the regional sea-level evolution of the Mediterranean (e.g., Fontana et al., 2017; Melis et al., 2018).
Along the Mediterranean coasts, the sophistication of human constructions has led to a number of archaeological remains, useful in the identification of relative sea-level changes. Since the Mediterranean is characterized by a small tidal range (less than 20 cm in the Aegean Sea (Tsimplis and Blackman, 1997); tide amplitudes of ±0.23 m for the Tyrrhenian Sea and ±0.60 m for the Adriatic Sea (Auriemma and Solinas, 2009), it offers the potential to reconstruct detailed late Holocene sea-level histories.
The study of Holocene shoreline changes and coastal evolution of archaeologically-rich sectors has been the subject of extensive research in the North Aegean (e.g., Ghilardi et al., 2008a, 2008b, 2010, 2012; Kraft et al., 1977; Pavlopoulos et al., 2013; Seeliger et al., 2017; Stock et al., 2016; Syrides et al., 2009; Vacchi et al., 2014; Vouvalidis et al., 2010) and the Cyclades (e.g., Evelpidou et al., 2010, 2012, 2014; Karkani et al., 2018, 2019; Pavlopoulos et al., 2010, 2012).
Palaeoenvironmental reconstructions may significantly improve our understanding of past human–environment interactions and the impact of relative sea-level changes on the coastal environment (e.g., Brückner et al., 2010; Chelli et al., 2017; Fontana et al., 2017; Morhange et al., 2000; Rossi et al., 2015, among many others).
In this context, we investigated the coastal evolution and palaeoshoreline changes of the southeastern part of Samos during the late Holocene using a multiproxy approach with archaeological records, geomorphological, sedimentological, stratigraphical, and palaeontological data. Additionally, this work attempts to provide new RSL (relative sea level) data obtained by sediment cores in order to contribute to a better understanding of RSL evolution in this sector of the Aegean Sea.
2 Regional setting
2.1 Geographical, geological, and geomorphological setting
Samos is located in the mid-eastern Aegean Sea (Fig. 1), at a distance of less than 1.5 km from the West Anatolian coasts. It lies on a shallow plateau extending from the Mt. Samsun Dağı peninsula, to which it was connected during the Pliocene and most of the Pleistocene (Higgins and Higgins, 1996). It is a mountainous island, about 45 km long, covering a surface area of 478 km2. It is located at the western edge of the tectonically active zone of the Greater Menderes River Graben, in western Turkey (Saroglu et al., 1992).
While the northwestern part of Samos is mountainous with steep cliffs and highly incised streams, the gradient of the topography decreases to the east. In the southeastern part of Samos, in particular, the morphology is characterized by a low, smooth relief with lagoons and extensive sand-gravel beaches developing along the coastal swamps.
According to Chatzipetros et al. (2013), the coastline of Samos is partly controlled by faulting (Fig. 2), with the main coastal and offshore faults forming rather linear coastlines along the same strike. The main geomorphological features are generally aligned in a WNW–ESE direction, coinciding with the main fault zones. The offshore North Samos fault (see Fig. 2) is a long structure of ∼25 km, forming a submarine depression at a depth of more than 1000 m (Chatzipetros et al., 2013). This fault demarcates two different geomorphological regions, the island and the deep Samos depression (Fig. 2), reaching depths of more than 1000 m (Chatzipetros et al., 2013).
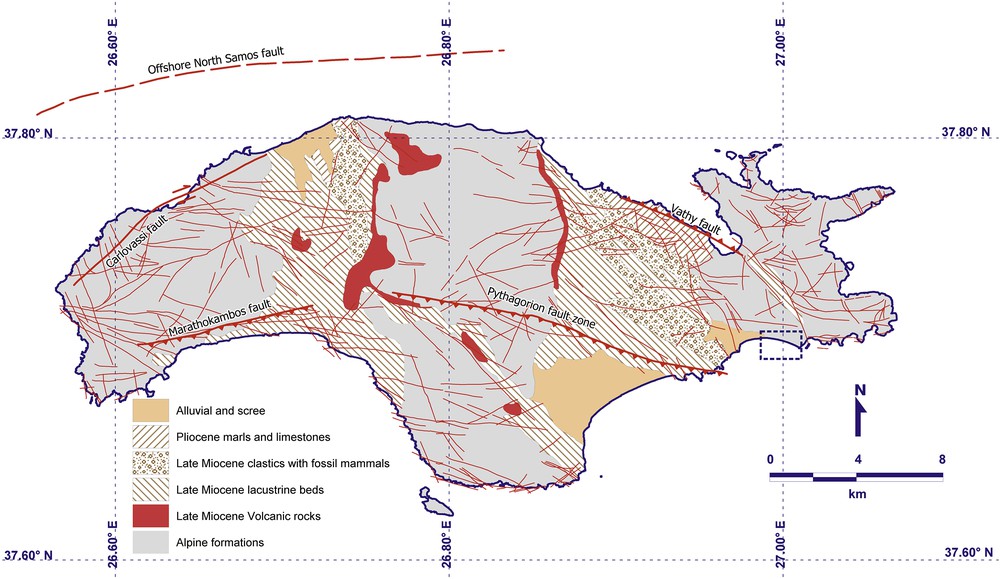
Lithology along with major and minor faults of the island of Samos (based on Chatzipetros et al. (2013) and Theodoropoulos (1979). The blue dashed rectangle highlights the study area.
The main basin of the island (SE), along with smaller valleys and the corresponding drainage system are aligned in a WNW–ESE direction, following the main fault zones. The Pythagorion fault zone is the most predominant structure on the island, controlling the morphology of the area (Fig. 2). The fault is normal, striking WNW–ESE, dipping south at 45°, which manifests in various outcrops where slickenlines are preserved (Chatzipetros et al., 2013).
In the area west of Pythagorion, a rather distinctive tectonic landscape is formed (Fig. 1), where fault scarps clearly delineate two dissimilar areas: the hilly footwall to the north and the flat Pythagorion plain to the south.
2.2 Archaeological setting
The island of Samos is of great archaeological importance; it hosts one of the most important sanctuaries of ancient Greece, Heraion, and the famous aqueduct ‘Eupalinous Tunnel’.
The Heraion archaeological site is situated in a swampy plain formed by sediments deposited mostly by Imvrassos stream, at a distance of 7 km from Pythagorion, 100–200 m from the coast, at an elevation of 1–2 m above sea level. A sacred road used to connect Heraion with the ancient town of Samos (modern Pythagorion). Remains of the Road were excavated recently at the archaeological site close to modern Pythagorion.
A submerged ancient mole was constructed in the middle of the 6th century B.C. in order to protect the harbor of Samos from the strong southerly winds (Herodotus III, 60). Ruins of this mole were noted by western travelers in Greece in recent centuries; it has been identified along with a submerged structure clearly seen, parallel to the modern mole, a 19th-century construction. An underwater archaeological survey, however, revealed that the surviving submerged structure corresponds to a mole of the Hellenistic period (300 B.C. or even later). Its base is at depths of 5–10.5 m, while its surviving top is at a depth of 1.8–3.2 m. No clear top, paved surface has been identified offshore, but the surviving top surface is quite regular (Simosi, 1991).
Ιt is important to identify the ‘‘functional height’’ of any archaeological indicator, which is the elevation of specific architectural parts of an archaeological structure in relation to the mean sea level during the period of their use (Morhange and Marriner, 2015). The functional height depends on the structure type, its use and the local tide range. It also defines the minimum elevation of the structure in relation to the local high tides. For example, Antonioli et al. (2007) have stated that the pavements at the top of piers were in the range of 0.5/1.0 m above sea level.
3 Material and methods
The study area is situated in the southeastern part of the island, in the area of Mesokampos (Fig. 1). In order to reconstruct the palaeogeographic evolution of the study area, two sets of boreholes were carried out: one set at Mykali (MK), with three drillings, and one at Psili Ammos (SALT), with three drillings. The boreholes at shallow depths were drilled with a portable vibracoring sampler (Cobra TT) with a diameter of 50 mm. The deepest borehole (MK1’) reached 8.93 m in depth, MK2 4.65 m and MK3 4.0 m. SALT1 reached 3.0 m, SALT2 6.0 m, while SALT3 reached 5.0 m in depth (Figs. 3 and 4).
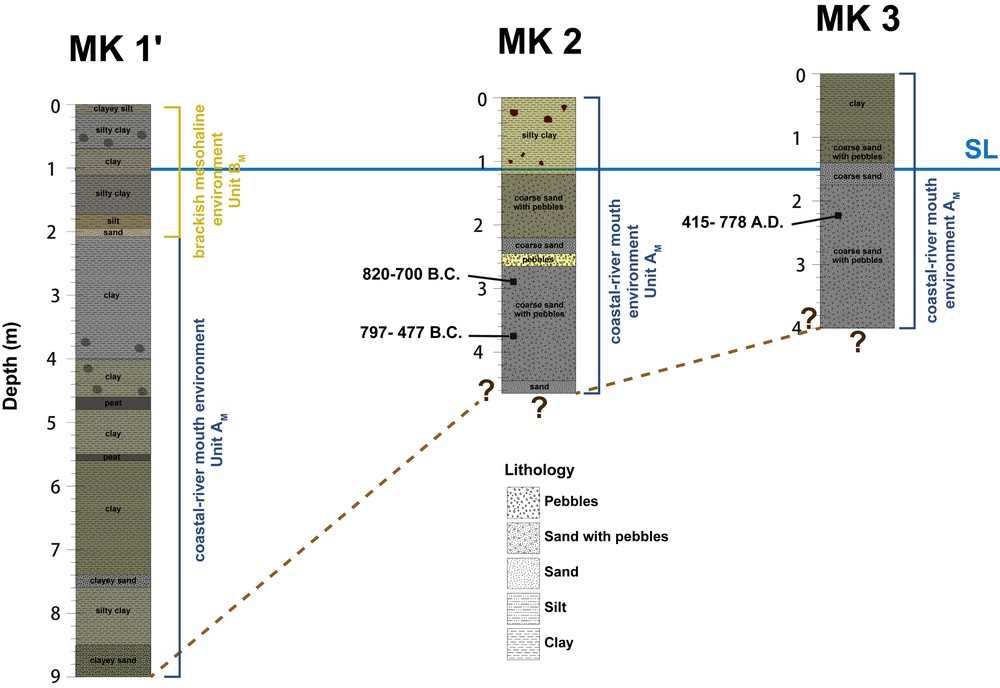
Stratigraphical columns of MK cores. The brown lines indicate the correlation of environments.
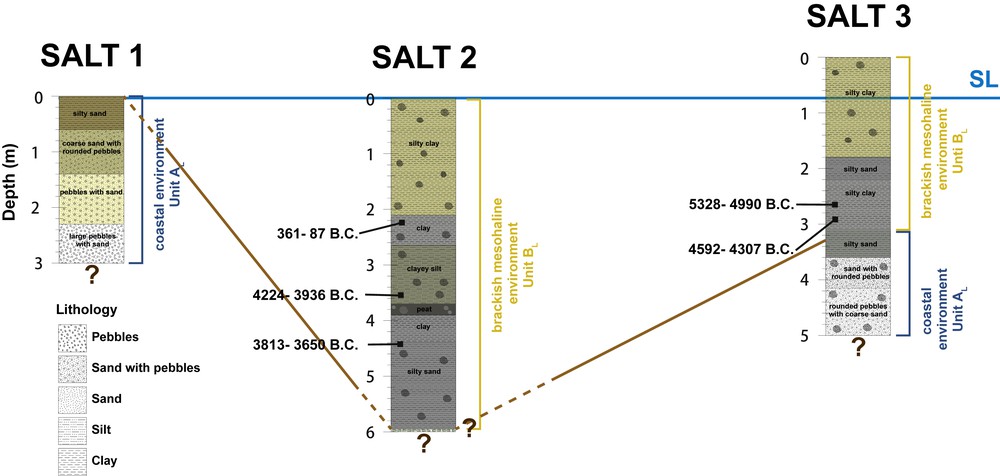
Stratigraphical columns of SALT cores. The brown lines indicate the correlation of environments.
These boreholes provided useful information on depositional phases. The chronostratigraphy of the cores was determined by a series of eight AMS radiocarbon datings on plant, shell, charcoal, and sand with organic material. Radiocarbon dating was carried out at CEntro di DAtazione e Diagnostica (CEDAD), in Lecce, Italy. Radiocarbon ages were calibrated through the online software Calib 7.10 (Stuiver et al., 2017), using the INTCAL13 atmospheric data set for terrestrial samples and the MARINE13 curve for marine samples (Reimer et al., 2013) with a ΔR value of 154 ± 52 estimated for the Aegean Sea (Reimer and McCormac, 2002).
The stratigraphic analysis was accomplished by studying sedimentary sequences through visual inspection of the sediments. The stratigraphy of the late Holocene sediments was studied in detail and analyzed using micropaleontological techniques. Each sample (10 g dry weight) was treated with H2O2 to remove the organic matter, washed through 125-μm sieves, and oven-dried at 70 °C. A subset of each sample was obtained using an Otto microsplitter until aliquots of at least 200 benthic foraminifers were collected. Foraminiferal assemblages are expressed in percentages. The microfauna was identified using a Leica APO S8 stereoscope. A scanning electron microscope analyser (SEM Jeol JSM 6360, Department of Historical Geology-Paleontology, Athens, Greece) was used for taxonomical purposes. The taxonomy of the benthic foraminifers identified in this paper is based on Loeblich and Tappan (1988, 1994) and on Bronnimann et al. (1992).
4 Results
4.1 Boreholes lithostratigraphy, faunal evidence and depositional environment
4.1.1 Mykali cores
Based on sedimentological and faunal evidence, two depositional environments were identified, represented by units AM and BM (Figs. 3 and 4). In MK1’, unit AM is dominated by clay, with alternations of clayey sand and silty clay. In MK2 and MK3, unit ΑΜ is represented mainly by coarse sand deposits (Fig. 3). Unit AM is devoid of foraminiferal specimens, except for a few sporadic fragments. Numerous mollusk fragments are present, probably indicating a coastal-river mouth environment. In MK2, the lower part of unit AM was dated to 477–820 B.C., while in MK2 the middle of unit AM was dated to 415–778 A.D. (see Table 1).
Calibrated radiocarbon ages for dated samples from cores of the Mesokambos area.
| Νο | Sample code | Lab code | Depth below m.s.l. (m) | Material | Conventional R/C age (yr BP) | 2σ calibrated age |
| 1. | MK2/2.88 | LTL3755A | 1.77 | Sand with organic material | 2566 ± 50 | 820–700 B.C. |
| 2. | MK2/3.73 | LTL3754A | 2.62 | Charcoal | 2508 ± 50 | 797–477 B.C. |
| 3. | MK3/1.23 | LTL3756A | 0.72 | Plant remains | 1411 ± 100 | 415–778 A.D. |
| 4. | SALT2/2.225 | LTL3750A | 2.22 | Charcoal | 2156 ± 50 | 361–87 B.C. |
| 5. | SALT2/3.53 | LTL3749A | 3.53 | Shell 2 valves cerastoderma | 5767 ± 35 | 4224–3936 B.C. |
| 6. | SALT2/4.41 | LTL3748A | 4.40 | Plant remains | 4971 ± 50 | 3813–3650 B.C. |
| 7. | SALT3/2.65 | LTL3751A | 1.90 | Shell 2 valves | 6759 ± 50 | 5328–4990 B.C. |
| 8. | SALT3/2.92 | LTL3752A | 2.17 | Shell | 6121 ± 40 | 4592–4307 B.C. |
Unit BM was only identified in MK1’ core. It consists of alternations of clay, silt, clayey silt, and silty clay. The first 50 cm of this unit are barren of foraminiferal content; however, the sporadic presence of charophytes indicates at least a temporary aquatic influence. The interval in-between 50 and 200 cm is characterized by the presence of small-sized Ammonia spp. (namely Ammonia tepida) and a prominent peak of Haynesina germanica (Fig. A.1), indicating a shallow brackish environment, practically a closed lagoon (e.g., Koukousioura et al., 2012).
4.1.2 Psili Ammos cores
Two depositional environments were identified based on sedimentological and faunal evidence, represented by units AL and BL (Fig. 4, Figs. A.2, A.3). Unit AL consists of silty sand, followed by coarse sand and rounded pebbles; it was identified in cores SALT1 and SALT3 (Fig. 4).
Macrofauna remains were noted in SALT3 core with shells such as Cerastoderma edule, Hydrobia spp., Abra spp., Cerithium spp., Potamides spp. Foraminifera in unit AL were only noted in SALT3, featured by large-sized Ammonia spp. (namely Ammonia beccarii) and several marine epiphytic foraminiferal indicators such as Quinqueloculina spp., Elphidium spp., Neoconorbina sp., indicating a shallow marine environment with algal vegetation (Fig. A.3).
Unit BL consists of silty clay, clay and silty sand, and was identified in SALT2 and SALT3. The macrofauna of unit BL consists of Abra spp., C. Edule, P. spp., H. spp., Trochus spp., Cyclope spp., Bithium spp. and C. spp. In terms of microfauna (Figs. A.2, A.3), the first 320 cm of SALT2 and the first 285 cm of SALT3 cores are featured by the intense presence of small-sized A. tepida and H. germanica, indicating a shallow brackish environment, practically a closed lagoon (Koukousioura et al., 2012). The rest of unit BL (SALT2, SALT3) displays abundant large-sized Ammonia spp. (namely A. beccarii), followed by several marine epiphytic foraminiferal indicators such as Rosalina bradyi, Cibicides spp., Q. spp., Planorbulina mediterranensis, E. spp., Neoconorbina sp., indicating a shallow marine environment with algal vegetation (see electronic supplement). The low abundances of small-sized Ammonia spp. suggest brackish influence in an open lagoon (Koukousioura et al., 2012).
Charcoal, shell of Cerastoderma with two valves, and plant remains from core SALT2 (unit BL) found at absolute depths of 2.22 m, 3.53 m, and 4.41 m below mean sea level (msl), were dated to 361- 87 B.C., 4224- 3936 B.C. and 3813- 3650 B.C. respectively (Table 1). From core SALT3, the base of unit BL was dated between 5328 and 4990 B.C. and 4592- 4307 B.C., based on a shell with two valves found at an absolute depth of 1.90 m below msl along with a shell found at an absolute depth of 2.17 m msl (Table 1).
5 Discussion
5.1 Relative sea-level changes based on archaeological remains
The archaeological data (see paragraph 2.2) in the southern part of the island of Samos, found below modern sea level, suggest that the area is subsiding (e.g., Stiros, 1998). The submerged Hellenistic mole, parallel to the modern one in the Pythagorion area, lacks a preserved top surface; as a consequence, no precise estimate of relative sea level can be obtained. According to Stiros (1998), a sea-level rise of 2.5 m is likely if one assumes that the original top surface was constructed at least 1 m above the water and corresponds to a surface currently at a depth of 1.5 m. East of the 19th-century fortress, the floor of a 6th-century B.C. sewer is currently a few tens of centimeters below sea level (Stiros, 1998). In order to be functional, its lower level was obviously built above the highest water level in antiquity. It may only testify to a minimum relative sea level rise of 1 m in 1700–2500 years (Stiros, 1998). A prehistoric settlement dated to 2500 B.C., close to the Heraion temple, is currently about 0.4 m above the water (Stiros, 1998). A sea-level rise may be inferred, assuming that this settlement was originally established on a coastal low hill bordered by two branches of the Imbrassos River, flowing in an area free of swamps (Stiros, 1998). The Heraion was always close to the coast (Kyrieleis, 1983), which suggests that the shape of the coast has not changed much since Antiquity. About 1 m of alluvium was deposited on the Sacred Road since its Roman phase, while the surface level of the prehistoric settlement (circa 2000 B.C.) is about 2 m below the ground level of the classical temple (500 B.C.). A number of underground cisterns or wells were constructed in this area, exploiting the surface aquifers of the period; they were at a substantial level beneath the present-day ones, suggesting a RSL rise. The coeval destruction of at least one other temple nearby supports the possibility of a destructive earthquake at circa 530 B.C. (Stiros, 1998).
All the aforementioned archaeological evidence suggests a relative sea-level rise for the study area; however its quantification encompasses many uncertainties. When the structures and their functionality are not directly linked to sea level, they are only indicative of the general direction of sea level. In addition, it is highly likely that antiquities, found today underwater, may have undergone significant erosion, due to storms and wave action (de Graauw, 2014).
5.2 Reconstruction of RSL from sediment corings
We produced a new suite of RSL index points following the protocol developed by Vacchi et al. (2016), which has been used in a number of recent Mediterranean studies (Fontana et al., 2017; Karkani et al., 2017, 2019; Melis et al., 2017, 2018; Vacchi et al., 2018). For samples deposited in a general brackish environment (i.e. LTL3750A, LTL3749A, LTL3748A, LTL3751A, LTL3752A), we considered an indicative range of ±0.5 m (Pavlopoulos et al., 2012; Vacchi et al., 2016). Samples LTL3755A, LTL3754A and LTL3756A were found in a coastal-river mouth environment, representative of the swash zone; therefore, we consider that they were most likely deposited at ±1 m within a former MSL. The vertical error further includes a tidal error of ±0.15 m (HNHS, 2012), a ±0.10 m for the precision of the samples’ altitude and an additional ±0.15 m for core stretching/shortening errors (Hijma et al., 2015; Vacchi et al., 2016).
Archaeological remains in our study area consist of coastal and terrestrial structures and difficulties arise in establishing a relationship with a former mean sea level. For this reason, we used the available archaeological data as terrestrial limiting points (see Vacchi et al., 2016). RSL index points should fall below terrestrial limiting points (Vacchi et al., 2016). Most data fit well with the RSL curve of Lambeck and Purcell (2005) and the RSL curve from Poulos et al. (2009) with the notable exception of three shell samples (LTL3751A, LTL3752A, LTL3749A) and the prehistoric settlement (Fig. 5). The age result from sample LTL3749A (at −3.53 m from MSL; 4224–3936 cal yr B.C.) does not appear in stratigraphic order in relation to the other samples of SALT2 borehole. This sample suggests a likely age reversal probably due to a storm event. In a similar manner, samples LTL3751A (at −1.9 m from MSL; 5328–4990 cal yr B.C.) and LTL3752A (−2.17 from SL; 4592–4307 cal yr B.C.) provide an older age in relation to the neighboring boreholes. Although we may consider that the adjacent borehole data could be underestimated, most likely the aforementioned samples are outliers, considering that they appear overestimated in relation to all other dated samples. The apparently older dates, from core SALT3, could also be due to manmade activities, as the lagoon had been used for salt production activities until relatively recently.
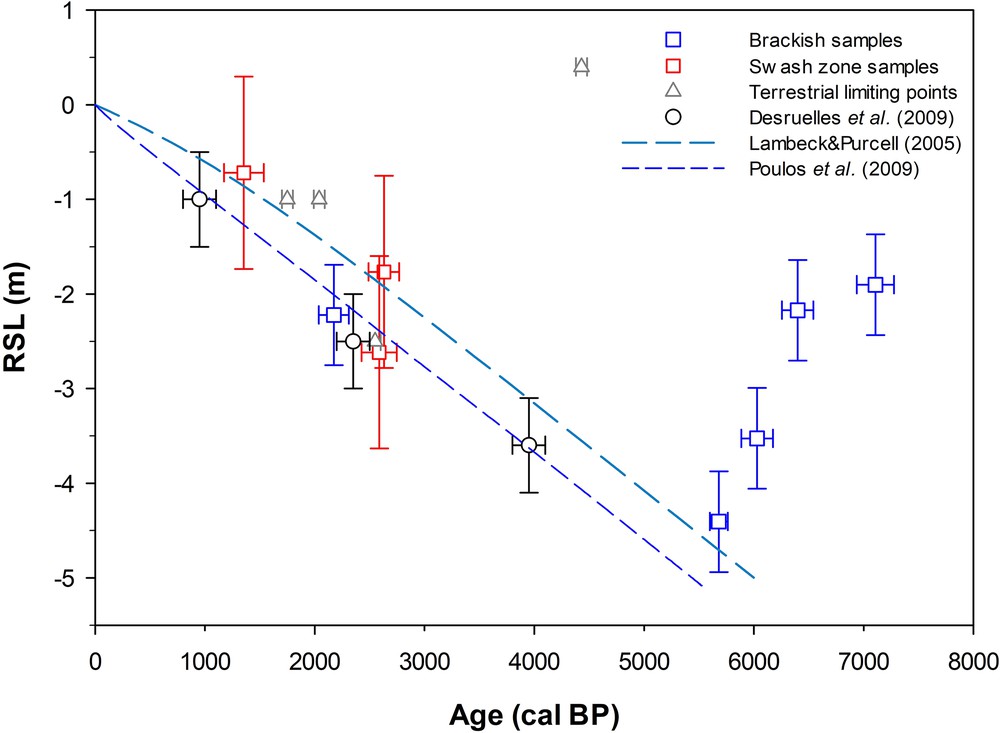
RSL data produced from this study. The plot shows the samples of this study, in comparison with the RSL reconstruction from Desruelles et al., 2009, Poulos et al. (2009), and the curve predicted by the glacio-hydro-isostatic model (Lambeck and Purcell, 2005). The archaeological data (i.e. ancient mole, cemetery, ancient sewer and prehistoric settlement) were used as terrestrial limiting points.
It seems that the area of Mykali from at least 797–477 cal yr B.C. used to be a coastal-river mouth environment, as indicated by the numerous mollusk fragments. It should be noted that Unit AM in core MK1′ is composed of finer sediments in relation to MK2 and MK3 (coarser), which could be owed to the location of the cores, in relation to the river network. MK2 and MK3 are located close to a first-order stream, providing material from directly upstream. MK1’ on the other hand could have been supplied by the two third- and second-order streams, located on its western part, by the longshore current, which has a general direction from west to east. The area of Mykali progressively turned into a shallow brackish environment, practically a closed lagoon, which gradually dried; however, it was aquatically influenced at least temporarily. The schema of Fig. A4a depicts the palaeogeographical evolution of the Mykali area.
The area at Psili Ammos used to be a closed lagoon from about 4224 to 3936 cal yr B.C. Before that and until at least 4592–4307 cal yr B.C., the area used to be a shallow marine environment with algal vegetation, and in fact the low abundances of small-sized Ammonia spp. indicate brackish influence in an open lagoon. The Psili Ammos existing configuration appears to have recorded the continuous shoreline transgression and the relocation of the sandy spit towards the SW to its present location. The schema of Fig. A4b depicts the palaeogeographical evolution of the Psili Ammos area.
The 14C dating from organic material and shells was used to reconstruct the relative sea-level changes of Samos utilizing complementary archaeological data (Fig. 5). In order to better assess the results obtained, we compared our data with RSL reconstructions from the Cyclades (Desruelles et al., 2009; Poulos et al., 2009), an area characterized by relatively low seismicity and the absence of large earthquakes (Sakellariou and Galanidou, 2015; Vamvakaris et al., 2016). According to Desruelles et al., 2009, RSL in the northern Cyclades (Mykonos, Delos and Rhenia Islands) was at −3.6 ± 0.5 m at ∼ 2000 B.C., at −2.5 ± 0.5 m at ∼400 B.C., and at −1.0 ± 0.5 m at ∼1000 A.D. (Fig. 5). We further plotted the RSL curve produced by Poulos et al. (2009) for the Cycladic area (central Aegean Sea). Based on our findings, an average rate of RSL rise of 0.8 ± 0.2 mm/yr may be estimated since ∼5700 years cal BP. For comparison, the average rate of RSL rise in the northern Cyclades, based on the findings of Desruelles et al., 2009, may be estimated at ∼1 mm/yr, while Poulos et al. (2009) have estimated a RSL rise of 0.9 mm/yr for the last 5000 years in the Cyclades. Although the resolution of our data does not allow us to discriminate small differences, it seems likely that the RSL rise trend in our study area is smaller compared to the Cyclades.
5.3 Neotectonic implications
The compilation of our RSL data in comparison with previously available data in the central Aegean (Cyclades) suggests that the southeastern part of Samos is characterized by a RSL rise. There is a general agreement between our results and the published RSL reconstructions from the Cyclades, and similarities are observed in the late Holocene RSL evolution. A tectonic subsidence trend in the Cyclades has been noted by various authors (e.g., Desruelles et al., 2009; Evelpidou et al., 2012; Karkani et al., 2017, 2019; Sakellariou and Galanidou, 2015). Comparable rates of RSL rise are found in our study, when comparing our data with those of the Cyclades.
The two most significant features in the study area are the two main active normal faults: the Pythagorion fault zone and the Vathy fault (see Fig. 2), striking WNW–ESE (Chatzipetros et al., 2013). In fact, the corings are located relatively near the footwall of the Pythagorion fault, which is the most prominent structure of the island of Samos dominating the morphology in this sector of the island (Chatzipetros et al., 2013). According to Pavlides et al. (2009), the Pythagorion fault has an earthquake potential magnitude in the order of 6.6.
However, according to the results of our study, the study area is characterized by a RSL rise trend, at least during the Holocene. This may suggest that the expected vertical displacements related with the major faults of the area were canceled out by other faults dipping in the opposite direction, as some of those indicated in Fig. 2. Stiros et al. (2000) has reported earthquakes being responsible for coastal uplift in the NW of Samos, which would have been extremely strong, especially close to the raised shorelines (northwestern Samos). According to Pavlides et al. (2009), the Karlovassi fault on the NW coast of Samos has an earthquake potential magnitude of 6.5, while Chatzipetros et al. (2013) note a maximum magnitude of 6.4. The raised shorelines were assigned to three earthquakes that occurred approximately 500, possibly 1500 and 3600–3900 years ago (Stiros et al., 2000). Such an earthquake may have been the cause for the offset of the drums of the Heraion (6th c. B.C.) monumental temple in Samos (Stiros, 1996; Stiros et al., 2000). At the nearby island of Ikaria, an unregistered earthquake after 950–1150 A.D. uplifted the NE coast of the island by about 1 m (Stiros et al., 2011). According to Stiros et al. (2000), the topography and bathymetry gradients of the NW part of Samos and of the NE part of the adjacent Ikaria Island seem to be controlled by a major normal fault or a normal fault zone. The uplifted shorelines at Samos are, however, confined to a geographically limited area, about 10 km wide.
Based on the evidence presented above, it becomes clear that local-scale tectonics is responsible for the evolution of the coastal zone of Samos. The present stress regime, which began in the Pliocene–Quaternary, is related to the NNE–SSW trending extension of the Aegean Sea (Chatzipetros et al., 2013; Mountrakis et al., 2003).
6 Conclusions
The palaeogeographic reconstruction of the southeastern part of the island of Samos provided new insights on the coastal evolution of the study area as well as on the RSL evolution in the mid-eastern Aegean Sea during the late Holocene. Previously published archaeological data from the study area suggested a subsidence regime. Our study has shown that the southeastern part of Samos is indeed under a RSL rise trend, at an average rate of ∼0.8 ± 0.2 mm/yr since ∼5700 cal BP, as suggested by the comparison of our results with previously published sea-level data. Taking into account that evidence of uplift has been reported on the northwestern part of the island, it appears that local-scale tectonics has shaped the present-day coastal zone of the island.
Acknowledgments
Authors would like to thank Mr. Mouzos Vassilis for his help on all topographical issues. We also thank an anonymous reviewer and the associate editor Isabelle Manighetti, whose constructive comments and suggestions improved an earlier version of this paper.