


 CC-BY 4.0
1. Introduction
Water dissolved in magmas has been a longstanding topic of interest because of its critical influence on their properties, including viscosity [e.g., Leonteva 1940; Saucier 1952; Friedman et al. 1963; Dingwell et al. 1996; Richet et al. 1996], density [e.g., Ochs and Lange 1999; Richet et al. 2000; Malfait et al. 2014b, a] and melting phase relations [e.g., Kushiro et al. 1968a, b]. In volcanic systems, water is recognized as being the engine of many types of volcanic eruptions [e.g., Gonnermann 2015]. Such influence also extends back in time, such as for the formation of the first continents [Campbell and Taylor 1983]. These observations have led to a number of experimental studies on the behavior of H2O in melts to be undertaken using many different spectroscopic and/or modeling methods [e.g., Burnham 1975; Stolen and Walrafen 1976; Stolper 1982; McMillan et al. 1986; Mysen and Virgo 1986a, b; Farnan et al. 1987; Silver et al. 1990; Behrens et al. 1996; Davis and Tomozawa 1996; Holtz et al. 1996; Mysen and Wheeler 2000; Behrens et al. 2001; Xue and Kanzaki 2004, 2006; Cody et al. 2005; Mysen and Cody 2005; Behrens and Yamashita 2008; Yamashita et al. 2008; Xue 2009; Bouyer et al. 2010; Malfait and Xue 2010; Malfait 2014; Mysen 2014; Chertkova and Yamashita 2015; Le Losq et al. 2015c, 2017; Balzer et al. 2020; Cody et al. 2020].
Most of the existing data were obtained from the study of glasses quenched from melts equilibrated at high temperature and high pressure. In such glasses, water is supposed to be in a structural state representative of that in the melt at the glass transition, as suggested by infrared (IR) spectroscopy studies [e.g., Nowak and Behrens 1995]. Few studies report in situ observations of the effect of water on the structure of alkali aluminosilicate melts at high pressure and high temperature [e.g., Mysen 2009, 2010, 2014; Mysen and Yamashita 2010; Chertkova and Yamashita 2015]. The latter studies used hydrothermal diamond anvil cells [HDAC, Bassett et al. 1994, 1996] to perform optical as well as Raman/IR spectroscopy observations of melts and fluids at high temperature and high pressure. Except for the mentioned alkali aluminosilicate compositions, there is a general lack of in situ spectroscopic data for a broad range of melt compositions. This situation is unfortunate because (i) while water speciation derived from IR spectroscopy analysis appears frozen-in at the glass transition, the environment of H may change between high temperature (HT)–high pressure (HP) conditions and room T–room P (RT–RP) conditions, even in the glassy state; and (ii) the case of alkaline-earth compositions, very important for the magmatism of accretion and subduction zones, has been largely overlooked. Regarding (i), Le Losq et al. [2017] recently reported that the Raman O–H stretching signals of hydrous sodium silicate and aluminosilicate glasses appears very different if observed at room temperature or at 500 °C and ∼200–500 MPa. This followed older reports of changes of the proton environment in glasses between the glass transition temperature and room temperature [Holtz et al. 1996; Le Losq et al. 2013], which result from large changes in hydrogen bonding in undercooled melts and glasses. Regarding (ii), the high liquidus of alkaline-earth aluminosilicate compositions results in difficult experimental conditions, explaining the lack of in situ studies focused on such compositions. As a result, there is currently a clear lack of integrated in and ex situ study of alkaline-earth aluminosilicate melts.
To help tackle this problem and provide new data pertinent for calc-alkaline and tholeiitic compositions important for the volcanism at accretion and subduction zones, we present here new in and ex situ data on melts and glasses of the ambient pressure eutectic quartz–anorthite–wollastonite composition. This composition in molten form has a degree of polymerization similar to typical andesite magmas (Number of Non-Bridging Oxygens per Tetrahedra, NBO/T = 0.41). In situ Raman spectroscopy data were acquired with the Ca aluminosilicate melt equilibrated with aqueous fluids in a HDAC. The high frequency part (OH stretching signals) of the Raman spectra acquired during those HDAC experiments were already reported in a previous publication [Le Losq et al. 2017]. Here, we focus on the interpretation of the low frequency part of the Raman data, where the signature of the silicate network is observed. To help this analysis, we studied through polarized Raman spectroscopy, the structure of hydrous Ca aluminosilicate glasses, quenched from melts equilibrated at high pressure and high temperature in a piston–cylinder apparatus. To help our interpretation of the HDAC Raman spectroscopy data, we also determined the water solubility in the Ca aluminosilicate melt up to 2 GPa, extending the original P–T space covered by the study of McMillan et al. [1986]. The new data stress that, at conditions representative of those of the Earth’s interior, the structure of hydrous magmas is far from that usually inferred from glass data.
2. Methods
2.1. Material synthesis
Two batches of anhydrous Ca aluminosilicate (CA2 and CA3) glasses with a quartz–anorthite–wollastonite composition (64.84 mol% SiO2, 9.06 mol% Al2O3, 26.11 mol% CaO, NBO/T = 0.41) were synthesized from dried reagent-grade CaCO3, Al2O3 and SiO2 powders. The powders were crushed for 1 h in a mechanical agate mortar, and placed in a Pt crucible. The starting materials were heated at a rate of 1 °C⋅min−1 in order to ensure a slow decarbonation process, to finally reach a temperature of 1400 °C. The melts were quenched into glass in air. After the initial melting, the glasses were crushed for 1 h in an agate mortar, and re-fused at 1400 °C. This was repeated three times, in order to ensure homogeneous glass starting materials. Analysis of the chemical composition of the glasses was performed through energy-dispersive X-ray spectrometry (EDS), with using a JEOL field-emission scanning electron microprobe (FE-SEM) equipped with an Oxford silicon drift detector. A 15 kV accelerating voltage and a 1.00 nA current were used. Measurements were performed scanning 25 by 25 μm areas. The EDS results were calibrated using the following standards: cossyrite for Na, pyrope for O and Si, ENAL20 for Al, and diopside for Ca. Calibration was based on a set of glass standards. The EDS results are within error of standards analyzed as unknowns (see Table 1).
Chemical composition of anhydrous glasses
| SiO2 | Al2O3 | CaO | NBO/T | ||
|---|---|---|---|---|---|
| Nominal values | Nom. mol% | 64.84 | 9.06 | 26.11 | 0.41 |
| Nom. wt% | 62.00 | 14.70 | 23.30 | ||
| Batch CA2 | Meas. wt% | 61.9(4) | 14.7(1) | 23.4(1) | |
| Batch CA3 | Meas. wt% | 62.2(4) | 14.7(1) | 23.1(2) |
Nom. mol%, Nom. wt% and Meas. wt% refer respectively to the nominal compositions in mol and wt%, and to the measured composition in wt%. Errors are given at the 1𝜎 confidence interval in brackets; values and associated errors were rounded to the first significant digit.
2.2. Hydrous glasses synthesis
Hydrous glasses were obtained by hydration of melts at HT and HP in a piston–cylinder apparatus [Boyd and England 1960]. Powder of the starting glass was placed in Pt capsules with the appropriate amount of water. The exact amount of added water was determined by weighing the capsules. For glasses with a low water concentration (<10 wt%), we used ∼10 mm long by 5 mm diameter capsules. For glasses with [H2O] > 10 wt%, aimed at testing the water solubility in the Ca aluminosilicate composition (see Section 2.8), small capsules of ∼8 mm long by 3 mm diameter were used. Around 160 mg of hydrous glass can be produced with using the large capsules, whereas the small ones allow retrieving ∼30 mg of glass. Using small capsules ensures a higher quenching rate, which avoids crystallisation of fluid-saturated melt and limits the formation of quench bubbles upon quench. The loaded and sealed capsules were placed in 3∕4 inch diameter furnace assemblies based on the design of Kushiro [1976], and subjected to the desired pressure and temperature (see Tables 2 and 3) for 120 min in a piston–cylinder. Temperatures were measured with type S thermocouples with no correction for pressure on their emf, which may be as much as 10 °C [Mao et al. 1971]. Pressure was calibrated against the melting point of NaCl and the calcite-aragonite transformation [Bohlen 1984]. Estimated uncertainties are ∼10 °C and ∼0.1 GPa, respectively.
Water concentration in wt% and relative density of hydrous CA2 and CA3 glasses
| Glass | Nom. [H2OTOT] | T–P | [OH]IR | [H2Omol]IR | [H2OTOT]IR | [H2OTOT]Raman | Relative density |
|---|---|---|---|---|---|---|---|
| CA3-DR | 0.00 | — | — | — | — | 2.68(4) | |
| CA2-1 | 1.00 | 0.96(6) | 0.12(2) | 1.08(7) | 1.14(5) | n.m. | |
| CA2-2 | 2.00 | 1.3(1) | 0.55(9) | 1.8(2) | 2.1(1) | 2.67(3) | |
| CA3-3-1 | 3.00 | 2.1(1) | 1.09(5) | 3.2(1) | 3.1(1) | 2.60(6) | |
| 1500 °C | |||||||
| CA2-4 | 4.00 | 2.4(20) | 1.8(20) | 4.2(3) | 3.8(1) | 2.61(3) | |
| 1.5 GPa | |||||||
| CA3-6-1 | 6.00 | 2.5(1) | 3.6(2) | 6.1(2) | 5.9(1) | 2.49(4) | |
| CA2-8 | 8.00 | 2.6(2) | 5.4(4) | 8.0(4) | 7.9(1) | 2.47(2) | |
| CA2-9.5 | 9.5 | — | — | — | 9.7(1) | — |
CA3-DR is an anhydrous densified glass that was prepared in the piston–cylinder, so that its density is comparable to other hydrous glasses prepared at the same pressure. Nom. [H2OTOT] refers to the nominal total water concentrations. IR and Raman: measurements made with using Infrared and Raman spectroscopy, respectively. Errors are given at the 1𝜎 confidence interval in brackets; values and associated errors were rounded to the first significant digit.
Water solubility in the CAS melts
| Pressure (MPa) | Temperature (°C) | Water content (wt%) |
|---|---|---|
| 1000 | 1000 | 11.0(2) |
| 1000 | 1100 | 10.8(6) |
| 1000 | 1200 | 11.4(5) |
| 1100 | 1200 | 14.1(5) |
| 1200 | 1200 | 15.6(9) |
Errors are given at the 1𝜎 confidence interval in brackets; values and associated errors were rounded to the first significant digit.
2.3. Infrared spectroscopy
Transmission infrared spectra of the hydrous glasses were recorded using a Jasco® IMV-4000 multi-channel infrared spectrometer with a 10× objective, an MCT detector and the standard light source, a 100 μm aperture, and 1000 acquisitions. The glasses were double-polished to a thickness in the 50–200 μm range by using oil in order to avoid any reaction of their surfaces with water. The glass samples were placed on BaF2 windows during measurements. After collection of each spectrum, the sample was moved aside and a background spectrum was recorded at the same spot. Division of sample spectra by background spectra gave the final absorbance spectra, which were normalized to samples thicknesses.
2.4. Raman spectroscopy
Raman spectra of various materials were recorded using two systems. Unpolarized Raman spectra of glasses and melts/fluids during in situ experiments were recorded at the Earth Planets laboratory using a Jasco NRS 3100 spectrometer, equipped with holographic gratings, a single monochromator, and a 1024 × 128 Andor DV401-F1 CCD Peltier-cooled detector operating at −70 °C. A 490 nm line of a Coherent solid state laser was used for sample excitation, with a power of ∼33 mW on samples. The laser was focused on samples through a 50× Olympus lens. The Raman spectra of the glasses were recorded using a groove-density of the gratings of 2400 lines/mm, which results in an accuracy better than 3 cm−1 and a precision better than 1 cm−1. During hydrothermal diamond anvil cell experiments, the Raman spectra of the different melts, fluid and crystal phases were recorded with using a groove-density of the gratings of 1200 lines/mm. The Raman spectra of the 13C diamonds together with a Ne reference line, used for pressure estimates, were acquired with using a 532 nm laser line, and a 2400 grooves/mm grating to ensure the best Raman shift accuracy. Alignment of the Raman spectrometer was tested against the 520.7 cm−1 Raman peak of pure Si.
Polarised Raman spectra of the glasses were recorded at IPGP using a Horiba HR Evolution Raman spectrometer. This spectrometer is equipped with a single monochromator, and a Symphony OE Peltier-cooled detector operating at −60 °C. A 487.77 nm line of a Coherent solid state laser was used for sample excitation, with a power of ∼25 mW on samples. The laser was focused on samples through a 100× Olympus lens. The Raman spectra of the glasses were recorded using a groove-density of the gratings of 1800 lines/mm and a confocal hole aperture set at 50, which results in an accuracy of ∼1.2 cm−1 and a precision better than 1.0 cm−1. Alignment of the Raman spectrometer was tested against the reference 546.07 nm line of room Neon lights as well as the 520.7 cm−1 Raman peak of a monocrystalline Si wafer.
2.5. Solid-state NMR spectroscopy
29Si solid-state NMR experiments were carried out with a Chemagnetics CMX Infinity 300 solid-state NMR spectrometer, with a magnetostatic field strength of ∼7.05 T. This implies a 29Si Larmor frequency of 59.6 MHz. 29Si Magic Angle Spinning (MAS) NMR spectra were acquired by spinning the samples at 4 kHz. 29Si excitation pulse widths of 1.3 μs were performed at a 30° tip angle, with a pulse delay of 200 s. The spectral width was of 20 kHz. The number of acquisitions was 400, requiring 1 day per sample.
2.6. Density measurements
The density of the hydrous glasses (Table 2) was measured with using the Archimedes method, by immersion in toluene. The weights of dry and immersed glass pieces were measured using a Berman balance at the Earth Planets laboratory. From these measurements, it is possible to calculate the density of the glass pieces because the toluene density and its variations with temperature are precisely known. This method has an accuracy of 0.001 [e.g., Richet et al. 2000]. In the present case, the available Berman system resulted in a larger error, equal to 0.04. The obtained values are in good agreement with those reported by Silver et al. [1990] for the same composition.
2.7. Water concentration and speciation in hydrous Ca aluminosilicate glasses
The 4500 and 5200 cm−1 IR absorption bands, respectively assigned to combination modes of vibrations from OH groups and H2Omol species [Stolper 1982], were used to determine the concentration and speciation of water in the hydrous CA2 and CA3 glasses (Table 2). A 6th order polynomial function was used to subtract the background below the IR absorption bands. The concentration of OH groups and H2Omol species were obtained with using the absorption coefficients from Silver et al. [1990].
2.8. Solubility measurements
Solubility measurements for the present eutectic Ca aluminosilicate composition have been reported by McMillan et al. [1986] and Silver et al. [1990]. However, at temperatures below 1200 °C (the limit of the hydrothermal diamond anvil cell setup), only solubility measurements up to 500 MPa have been reported [McMillan et al. 1986]. To address this issue, phase equilibria and Raman spectroscopy measurements were used to determine the solubility of water in the Ca aluminosilicate melt above 1 GPa at 1200 °C. The H2O solubility in the melt at any temperature and pressure is defined by the univariant equilibrium melt ↔ melt + fluid [Burnham and Jahns 1962; Mysen and Acton 1999]. Experiments with different amounts of water were performed at given T and P, embracing the univariant equilibrium. Experiments in which the melts were saturated with water, fluid vesicles were observed, allowing us to estimate the location of the univariant equilibrium boundary. Uncertainties affecting the phase equilibria method range between 0.5 to 2%, depending on the spacing of the different experiments that were performed. An independent confirmation was obtained through Raman spectroscopy. This was possible because the high (∼1 μm) spatial resolution of Raman spectroscopy allows avoiding fluid vesicles and quench bubbles, and, hence, observing only O–H stretching signals from water dissolved in the glasses. A calibration relating the total glass water content to the ratio of the Raman signals assigned to O–H stretching vibration and silicate vibration in the glass [see Le Losq et al. 2012, and references cited therein] was established with using the CA2 and CA3 glasses with 1 to 8 wt% water as standards (Table 2). The Raman spectra were treated following the protocol described in Le Losq et al. [2012], using the rameau() function implemented in the rampy Python library [Le Losq 2018].
2.9. Hydrothermal diamond anvil cell (HDAC) experiments
Results of the in situ experiments carried out in an externally heated HDAC [Bassett et al. 1994, 1996] with 1 mm diamond cutlets were reported in Le Losq et al. [2017]. Chips of the glasses and 13C diamond were loaded together with distilled water into the sample chamber. A “double gasket” setup, with outer Re and inner Pt rings, was used as it does not deform at temperatures above 800 °C. The experimental chamber was of ∼300 μm diameter by ∼100 μm height. The temperature in the HDAC was controlled to within 1 °C with chromel–alumel thermocouples that were in contact with the surface of the upper and lower diamond anvils. The accuracy of the temperature measurements is better than 3 °C [Bassett et al. 2000]. The pressure inside the cell is governed by the PVT relationship of the pressure-generating aqueous fluid: at fixed volume, increasing temperature results in increasing pressure. Pressure was estimated by using the pressure-/temperature-dependent one-phonon Raman shift of the synthetic 13C diamond. This shift has been calibrated in the 0.1–1500 MPa and 25–800 °C ranges by Mysen and Yamashita [2010]. The Ne emission lines, recorded together with the Raman spectra of the 13C diamond, were used as references to determine the exact Raman shift of the 13C diamond Raman peak, which results in a ±0.1 cm−1 uncertainty. This frequency uncertainty results in pressure precision of ±40 MPa. By taking the uncertainty in the calibration of the Raman shift into consideration, total pressure uncertainty in the experiments was ±110 MPa.
The pressure and temperature conditions, the visual observations as well as the 2700–4000 cm−1 portion of Raman spectra are provided in Le Losq et al. [2017]. Here, we focused on treating the 600–1300 cm−1portion of Raman spectra acquired during those experiments. In this frequency range, the Raman spectra are affected by the nearby presence of the strong ∼1332 cm−1 diamond signal from the anvils. To remove its effect on the spectra, we acquired a Raman spectrum of the diamond anvil, pointing the laser on the gasket without changing its optical focus, right after the acquisition of a sample Raman spectrum. The 1220–1270 and 1340–2499 cm−1portions of the Raman spectra, where no signal from the sample is expected, were used to adjust the signal intensity from the Diamond spectrum to that of the diamond signal in the Sample spectrum, following a protocol similar to the one performed for removing the 2nd order Diamond signals from the D–O stretching signals in Dalou et al. [2015a]. A least square routine corrects the Diamond and Sample spectra from any shift in frequency and then adjusts the diamond signal from the Diamond spectrum to that in the Sample spectrum. Then, the adjusted diamond signal is removed from the Sample spectrum. This results in a diamond-corrected sample Raman spectrum in the 600–1250 cm−1 Raman shift range. After this treatment, the Raman signals were corrected from temperature and excitation line effects [see Le Losq et al. 2012, and references reported therein], using the tlcorrection() function implemented in the rampy library. The intensity in the corrected spectra has been normalized to the total integrated intensity measured between 600 and 1250 cm−1 by trapezoidal integration.
3. Results
3.1. Raman spectra of glasses
Polarized, raw Raman spectra of the hydrous glasses are shown in Figure 1. In the 0–2000 cm−1 portion of the spectra, broad bands centered near 80 cm−1, 500 cm−1 and 1050 cm−1 are visible. The 80 cm−1 band is called the Boson peak, and is a low frequency vibrational signature of amorphous materials. Its origin remains controversial. It is a localized vibration that can be assigned to collective transverse acoustic vibrational modes [Shintani and Tanaka 2008], which in silicate glasses are promoted by cooperative inter-tetrahedral librations [Bucheneau et al. 1986; Chumakov et al. 2011]. Its intensity is sensitive to the glass fictive temperature [Malinovsky and Sokolov 1986], while its frequency is affected by the mean atomic volume [Nakamura et al. 2013]. Here, the Boson peak intensity (BPI) increases by a factor 2 with increasing the glass water content from 0 to 9.5 wt% (Figure 2a). This reflects the effect of the expected decrease in glass transition temperature with water addition [see Deubener et al. 2003, and references cited therein]. In parallel, the Boson peak frequency (BPF) decreases slightly (by 6 cm−1). Such change is more difficult to interpret, and remains in any case small.
Polarized Raman spectra of the hydrous CAS glasses. The numbers indicate the nominal water content of the glasses in wt%. The sharp peaks indicated by stars are signals from surface impurities or atmosphere. Intensity was normalized to the maximum of the 800–1300 cm−1 band observed on VV spectra.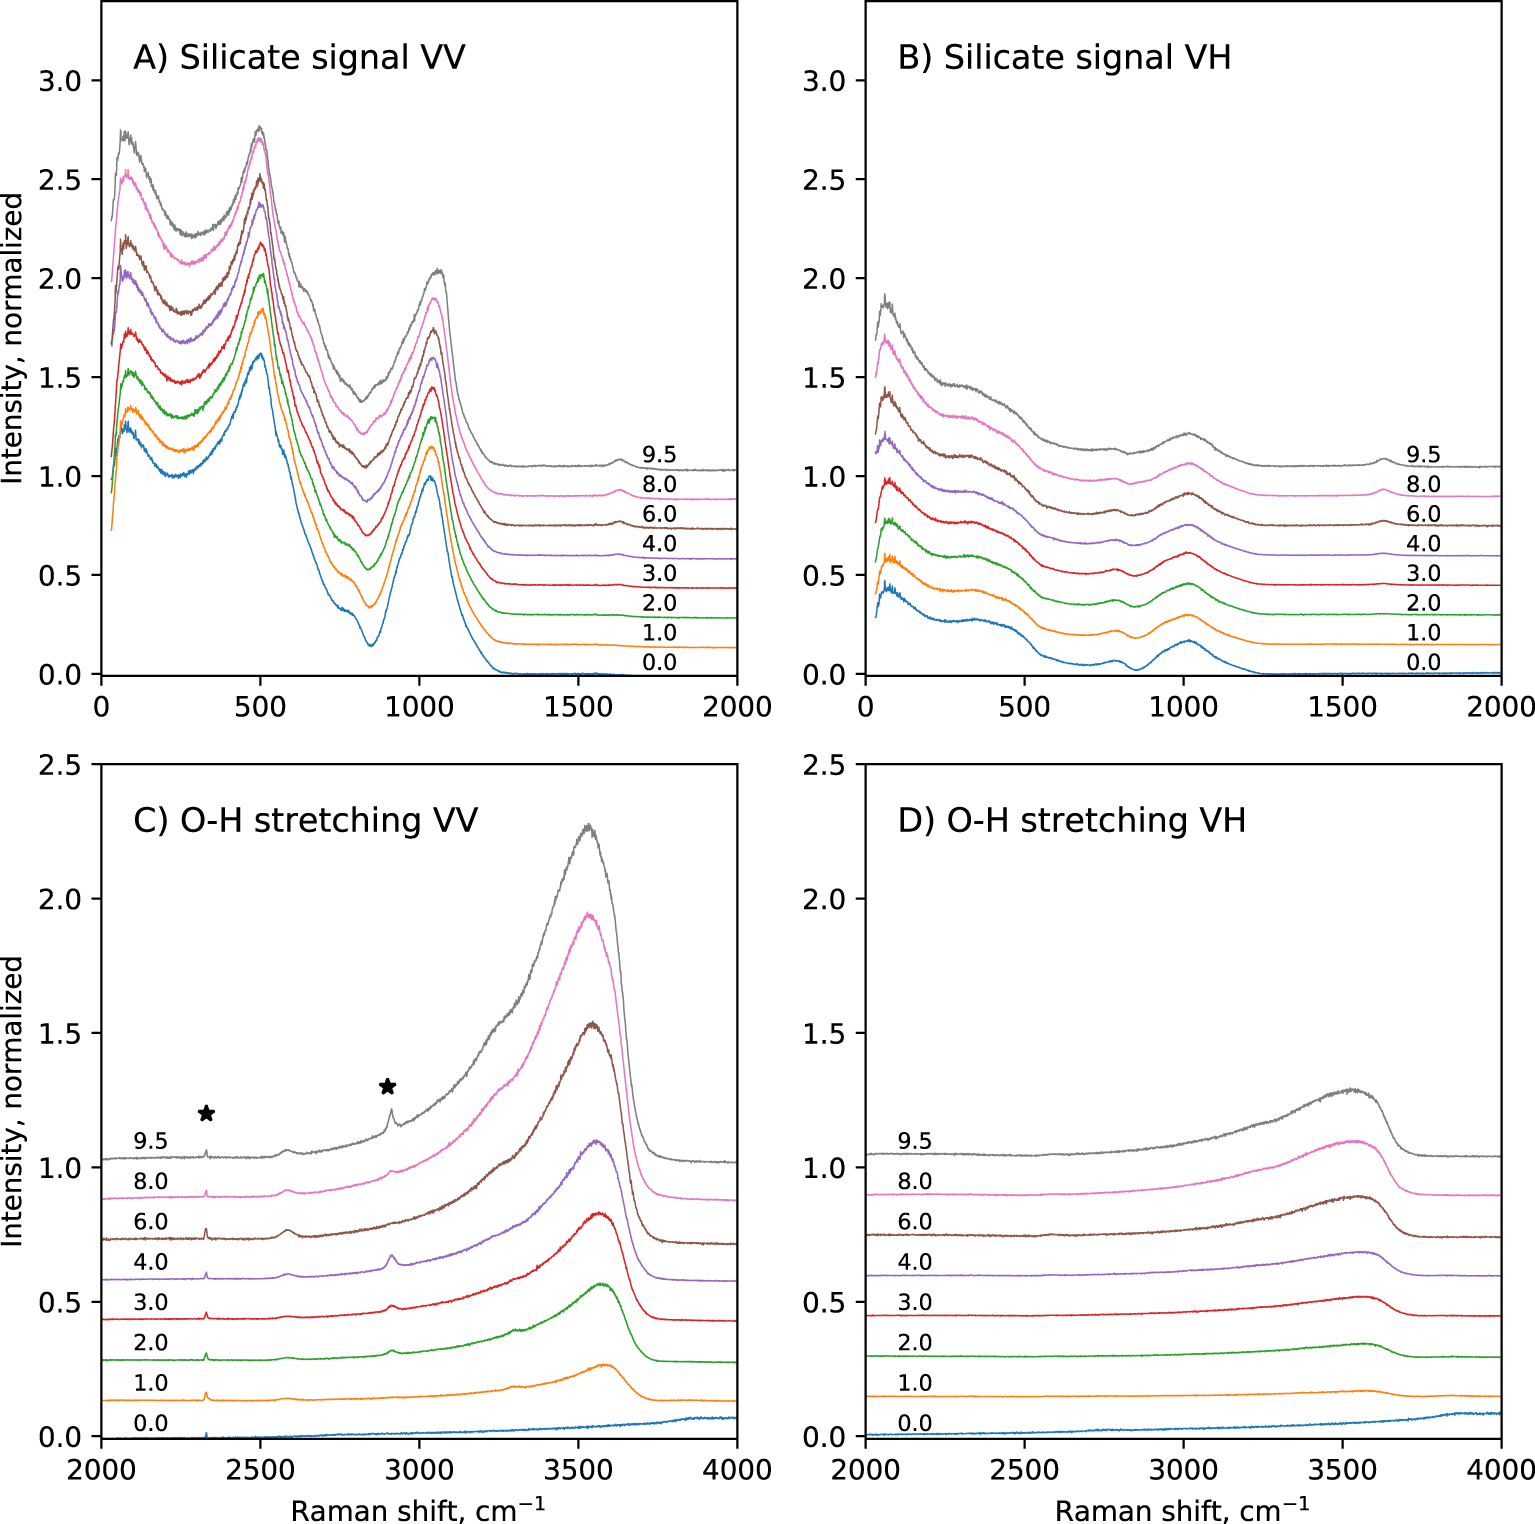
Boson Peak Intensity (BPI, filled blue squares) and Boson Peak Frequency (BPF, open black circles) measured on the VH spectra presented in Figure 1. BPI and BPF were determined from the fit of the 0–130 cm−1 portion of VH spectra with a log normal function; in this restrained frequency range, the Boson peak maximum is well fitted by such a function. Lines are guides for the eyes.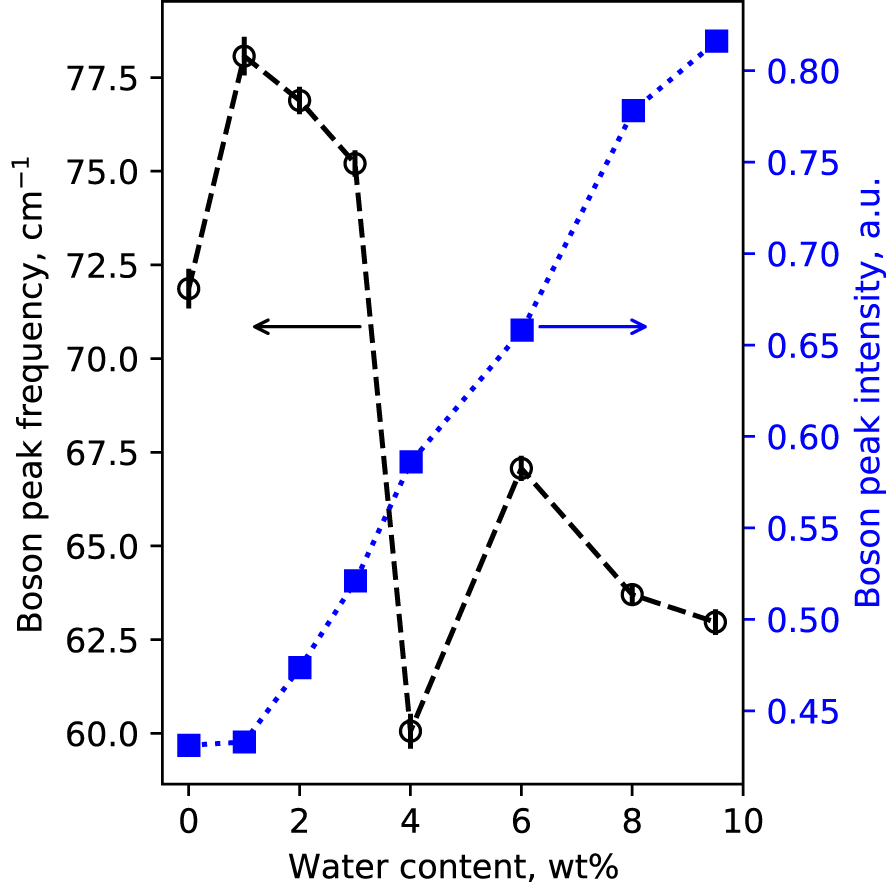
A strong, polarized band near ∼500 cm−1 is observed (Figure 1). Its intensity is not affected by glass water content. Small shoulders near 575 and 650 cm−1 are also present. The intensity of those contributions depends on the water content of the glasses. All those signals arise from the bending/breathing modes of Si–O–Si bonds that link Qn units [e.g., see Bell et al. 1968; Sen and Thorpe 1977; Furukawa and White 1980; Furukawa et al. 1981; McMillan 1984]. From the model of Furukawa et al. [1981], the main 500 cm−1 band may be assigned to T–O–T vibrations involving Q3 and Q4 units (Qn designates a tetrahedral cation [Si,Al] in four-fold coordination surrounded by n bridging oxygens, and carrying 4-n non-bridging oxygens). The 575 cm−1 shoulder can be assigned to T–O–T vibrations involving Q2 units. The origin of the 650 cm−1 peak is more difficult to decipher and probably involves complex Qn–Qn vibrations, probably with n = 2 or 3 given that the present glasses have NBO/T values lower than 1 (see discussion).
A shoulder near 795 cm−1 is visible in the VV spectra (Figure 1A). It actually is a depolarized band, visible in the VH spectra at ∼785 cm−1 (Figure 1B). Observed in the VH spectra, this band is asymmetric and presents a shoulder near ∼815 cm−1, and the band intensity decreases with increasing the glass water content. In the VV spectra, the ∼795 cm−1 shoulder disappears with increasing the glass water content. This signal may be assigned to vibrations involving the motion of Si in its oxygen cage [McMillan 1984], possibly related to the threefold—degenerate “rigid cage” vibrational mode of SiO2 tetrahedra [Sen and Thorpe 1977; Galeener 1979]. Another possible attribution would be Si–O stretching in Q0 units [Mysen et al. 1982; McMillan 1984], but here the NBO/T of the hydrous glass always remain below 1, so Q0 units with a NBO/T of 4 are not expected to be present.
In the 800–1300 cm−1 portion of spectra, a broad band is observed (Figure 1A,B). In the VV spectra, its maximum is located near 1040 cm−1, a shoulder near 941 cm−1 is visible, and another one near 860 cm−1 grows with increasing the glass water content (Figure 3A). A slope break is also visible on the high frequency side of this band, near 1180 cm−1. The position of the maximum in the VV spectra slightly shifts to higher frequencies with increasing glass water content: it is at ∼1032 cm−1 in the anhydrous CA glass, and at ∼1058 cm−1 in the glass with 9.5 wt% water. In the VH spectra, the ∼860 cm−1 and ∼940 cm−1 shoulders are also visible, but with much lower intensities (Figure 3B). The slope break near 1180 cm−1 is also visible. The maximum of the broad band is not at ∼1040 cm−1 anymore, but is located at ∼1014 cm−1. This position remains constant regardless of the glass water content. According to literature [e.g., Brawer and White 1975, 1977; Furukawa and White 1980; Mysen et al. 1982; McMillan 1984; Neuville 2006; Malfait 2009a, b; Le Losq et al. 2015c], the 860 cm−1 signal can be assigned to vibrations from T–OH groups (T = Si, Al), the 940 cm−1 shoulder to Si–O stretching in Q2 units, and the 1040–1050 cm−1 band to Si–O stretching in Q3 units. The high frequency shoulder near 1180 cm−1 can be assigned to T–O stretching in Q4 units (T = Si, Al). The shift in frequency of the intensity maximum of the 800–1300 cm−1spectral envelop from ∼1040–1060 cm−1 in the VV spectra down to 1014 cm−1 in the VH spectra indicates that the Q3 unit signal is highly polarized, and that a less polarized signal exists near 1000–1020 cm−1. The latter probably is the signal reported by various authors in peak fitting models of spectra of aluminosilicate glasses, assigned to (i) Si–BO stretching [Mysen et al. 1982], (ii) asymmetric stretching of Qn units [Spiekermann et al. 2012; Le Losq et al. 2014] or (iii) additional Q3 signals [You et al. 2005; Nesbitt et al. 2019]. The hypothesis (iii) is difficult to reconcile with the fact that the 1040–1060 cm−1 band is more polarized that the signal near 1014 cm−1. Indeed, as the depolarization ratio depends on the symmetry of the vibration (the higher it is, the lower the ratio), it should be quite constant for a given vibrational mode like the symmetric T–O vibration in Q3 units. Furthermore, the hypothesis (iii) does not agree with studies using linear decompositions of Raman spectra [Zakaznova-Herzog et al. 2007; Malfait 2009a; Herzog and Zakaznova-Herzog 2011] as well as molecular dynamics [Zotov et al. 1999; Spiekermann et al. 2012, 2013], which point to the existence of additional vibrational contributions from all Qn units in the 1000–1060 cm−1 frequency range. This is corroborated by the analysis of Raman spectra of fully polymerized silica and tectosilicate glasses, all showing a peak in the 1000–1060 cm−1 frequency range [Seifert et al. 1982; Neuville and Mysen 1996; Le Losq and Neuville 2013; Le Losq et al. 2014; Novikov et al. 2017]. Given the existing vibrational and simulation data on silica and aluminosilicate glasses, the most plausible hypothesis for the origin of the signal near 1014 cm−1 in the present glasses is T–O asymmetric stretching in Qn units (T2s vibrational mode) [see discussion in Le Losq and Neuville 2013; Le Losq et al. 2014, and references therein].
Zoom on the 800–1300 cm−1 and the 1500–1750 cm−1 portions of VV (A, C) and VH (B, D) Raman spectra of the hydrous CAS glasses. Signals assigned to T–OH vibrations (with T = Si, Al) as well as T–O vibrations in Q2, Q3 and Q4 units are materialized by vertical lines in (A). The ∼1630 cm−1 peak assigned to H2Omol bending, which grows with glass water content, is clearly visible in the spectra (arrow in C, D). The sharp peaks indicated by stars are signals from surface impurities or atmosphere.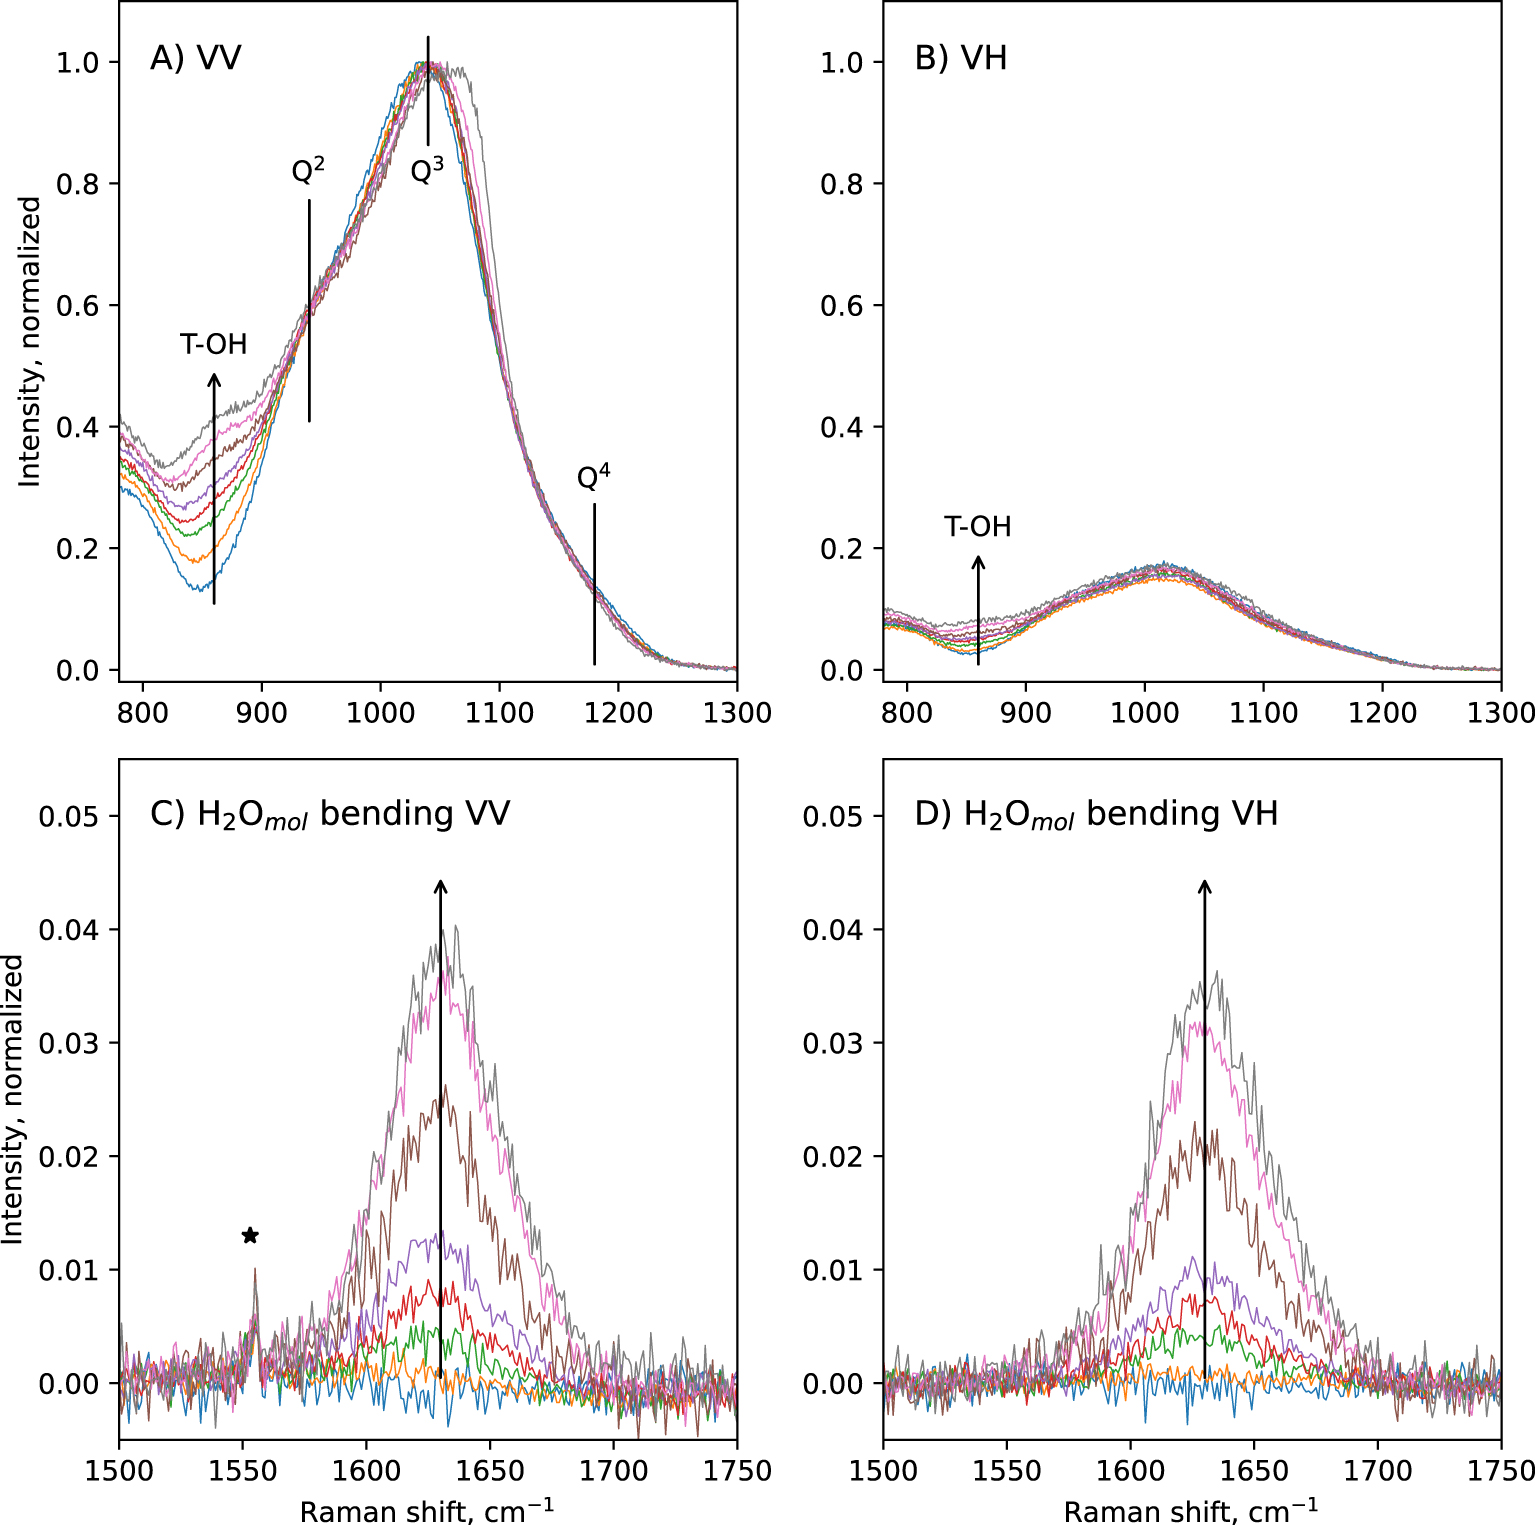
Above 1300 cm−1, a sharp band at ∼1630 cm−1 appears in hydrous glasses (Figures 1, 3). Its intensity increases with increasing glass water content. This band is depolarized: the depolarization ratio VH/VV is nearly equal to 1 (Figure 3C,D). As asymmetric molecules tend to present depolarized signals, this indicates that the molecule and its vibration yielding this signal are asymmetric. This agrees with the assignment of this band to bending vibrations of water molecules [e.g., Walrafen 1964]. This band can thus be assigned to vibrations from molecular water H2Omol being dissolved in the glass.
In the 2000–4000 cm−1 portion of the Raman spectra, we observe that increasing the glass water content leads to the appearance and growth of a broad, asymmetric band with a maximum centered near 3550 cm−1 (Figure 1C,D). At high water content, shoulders at ∼3240 cm−1 and ∼3615 cm−1 are visible. The position of the maximum intensity of this broad band decreases with increasing the glass water content. In the VV spectra, it is at ∼3581 cm−1 in the glass with 1.0 wt% H2O, and ∼3532 cm−1 in the glass with 9.5 wt% H2O. This band can be assigned to O–H stretching from water species dissolved in the glasses [Walrafen 1964, 1975; Stolen and Walrafen 1976; Walrafen and Samantha 1978; McMillan and Remmele 1986; Mysen and Virgo 1986a].
3.2. Raman signals related to water species in the glasses
In the above Raman spectra, three different signals are assigned to vibrations of water molecules (H2Omol) at ∼1630 cm−1, of T–OH hydroxyl groups at ∼860 cm−1, and of O–H stretching in water molecules and hydroxyl groups in the glasses at ∼3580 cm−1. The integrated intensity (a.k.a. area under the curve) of the later signal varies linearly with the nominal water content of the glasses (Figure 4A). This allows actually obtaining a linear calibration that links the water content of the glasses to the area under the 2500–4000 cm−1 O–H stretching band [Thomas 2000; Behrens et al. 2006; Le Losq et al. 2012; Schiavi et al. 2018]. This calibration was used to determine the water content in water-saturated samples obtained during the solubility experiments (see Section 3.3).
(A) Integrated intensity (a.k.a. area under the curve) below the ∼3600 cm−1 O–H stretching band, measured on the VV spectra. (B) Intensity of the ∼1630 cm−1 H2Omol bending band, measured on the VH spectra. (C) Intensity at 860 cm−1, measured by difference to that in the anhydrous glass Raman spectrum. All VV and VH Raman intensities were normalized to the maximum intensity in the 800–1300 cm−1 portion of the VV Raman spectra prior to any calculation. Lines are guides for the eyes. Errors bar are smaller than symbol size.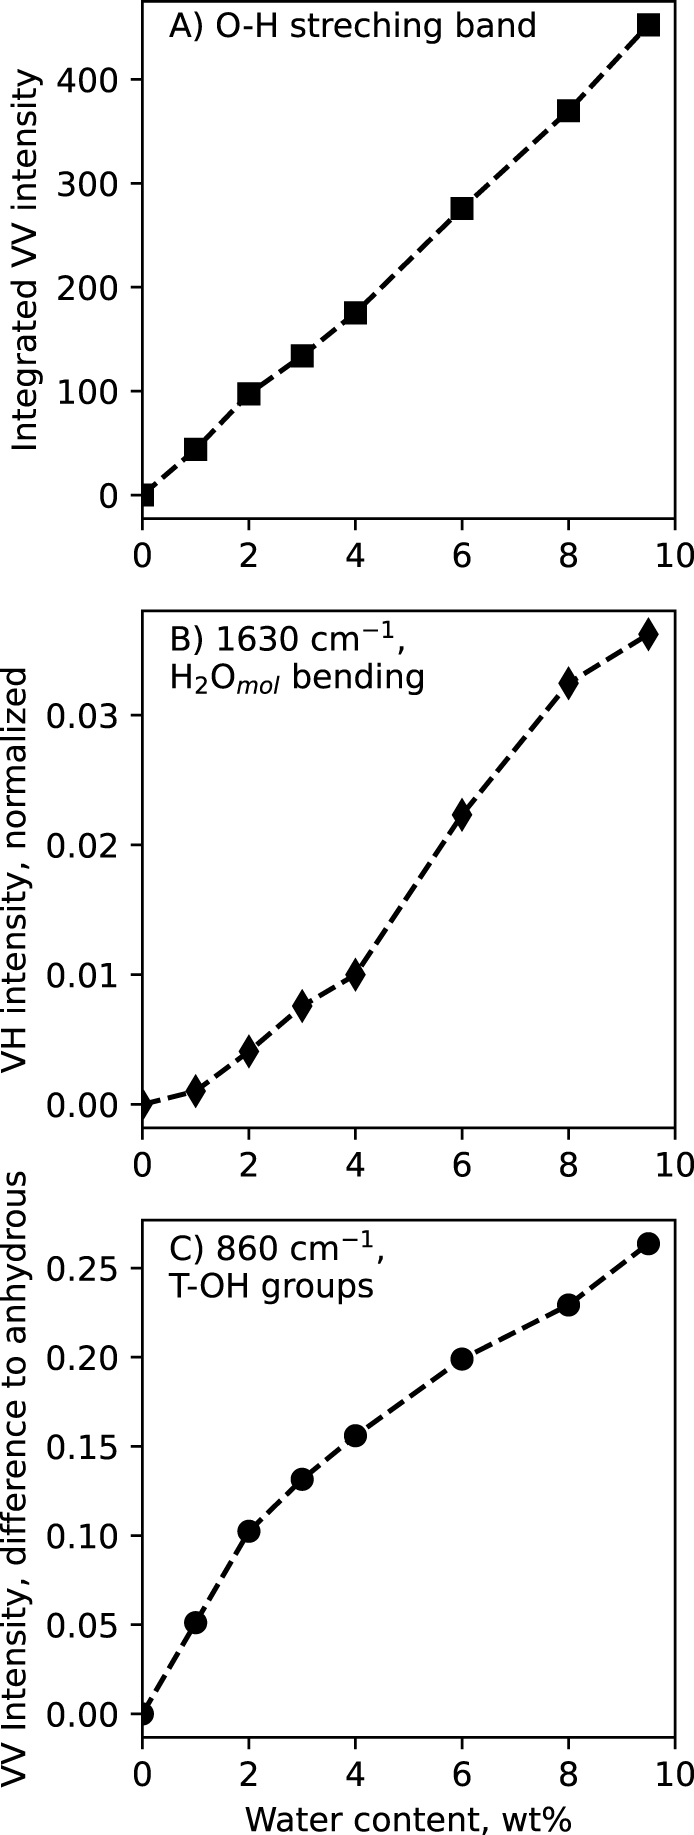
The H2Omol 1630 cm−1 signal intensity varies non-linearly with the glass water content (Figure 4B). The intensity shown in Figure 4B was actually measured on the VH spectra, because it is less affected by the surrounding background in VH spectra than in VV spectra (see Figure 3C,D). The H2Omol 1630 cm−1 signal VH intensity shows a concave upward variation with glass water content, indicating that more and more H2Omol species are present as glass water content increases. This observation differs from that on the 860 cm−1 shoulder assigned to T–OH. In Figure 4C, the relative intensity of this signal was measured at 860 cm−1 on the VV spectra by difference with that on the VV Raman spectrum of the anhydrous glass; this relative intensity shows a concave downward variation with glass water content.
From the variation of the Raman signals assigned to T–OH hydroxyl groups and water molecules, we propose a method to determine the water speciation from the VV and VH Raman spectra of glasses in which the M–OH content (with M a metal cation, like Ca) can be considered as negligible. Therefore, we assume that cOH ≈ cT–OH, with cOH and cT–OH the concentrations of total OH groups and T–OH groups, respectively. This assumption is reasonable in the present case because, given the NMR study of Xue and Kanzaki [2008] on diopside–anorthite glasses, we expect a maximum of 6% (relative to total H) of M–OH groups in CaO–MgO–Al2O3–SiO2 glasses with anhydrous NBO/T lower than 0.5. As a first approximation, the fraction of M–OH groups can thus be considered as negligible in our glass composition, with an anhydrous NBO/T of 0.41. We thus have
| (1) |
| (2) |
| (3) |
| (4) |
Figure 5 shows the versus plot for the present data. Prior to measurement, each VV and VH spectra were normalized to the VV integrated intensity measured between 800 and 1300 cm−1. To only get signals from T–OH vibrations, was corrected from the intensity at 860 cm−1 in the Raman spectrum of the anhydrous glass. The correlation between and is good and allows calculating and .
Relationship between and , as expected from (4). The intersections on this plot allows calculating the Raman cross sections of the OH and H2Omol species (see text and (1) to (4)). Errors bar are smaller than symbol size.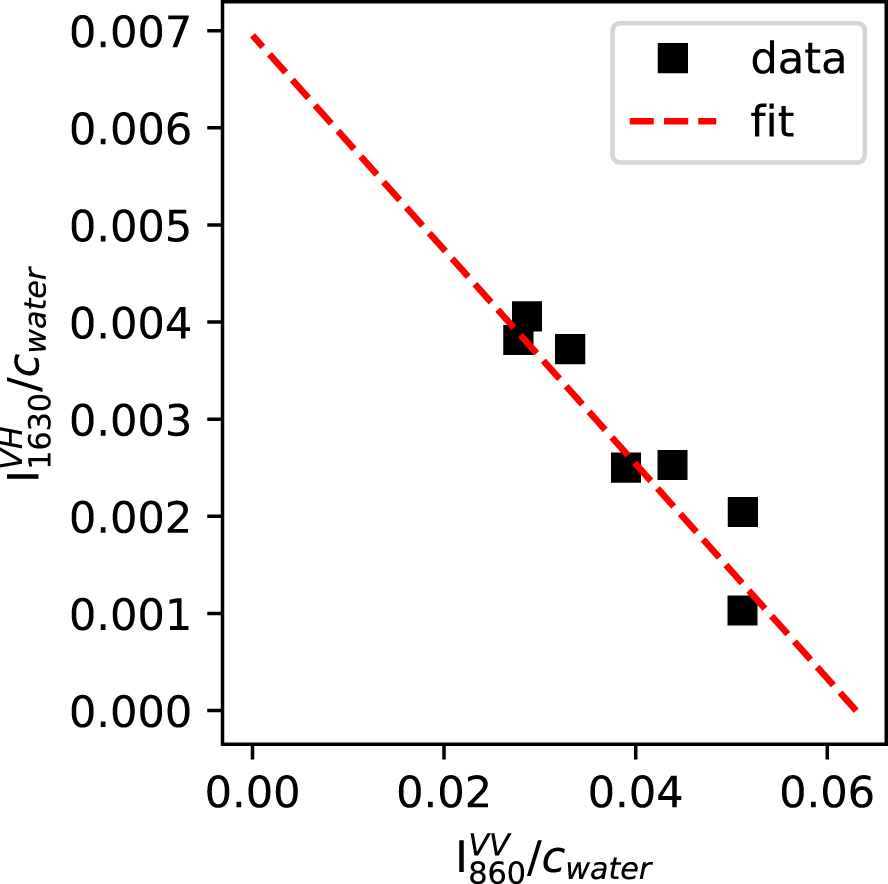
Using (2) and (3), it is now possible to directly determine the water speciation from the Raman spectra (VV and VH) of the hydrous glasses. This only requires knowledge of the glass water content, which can be measured by Raman spectroscopy using the intensity of the broad O–H stretching band for instance (e.g., Figure 4A). Figure 6 shows the result of such a calculation. A good agreement between the Raman-determined and IR-determined OH and H2Omol species is observed up to cwater = ∼5 wt%. Raman spectroscopy returns cOH values higher than IR spectroscopy, and cH 2Omol values lower. Relative error bars affecting cOH and cH 2Omol determination by Raman spectroscopy are of ∼6 and ∼9%, respectively. They are similar to those affecting values determined from IR spectroscopy. Given those error bars, the disagreement between Raman-determined and IR-determined cOH and cH 2Omol values above cwater = ∼5 wt% is significant. Its origin will be discussed in Section 4.1.
Concentration in OH and H2Omol species of the hydrous CAS glasses as a function of total water content, as measured independently by infrared IR spectroscopy (open diamonds) and Raman spectroscopy (closed diamonds). Lines are guides for the eyes. If not visible, errors bar are smaller than symbol size.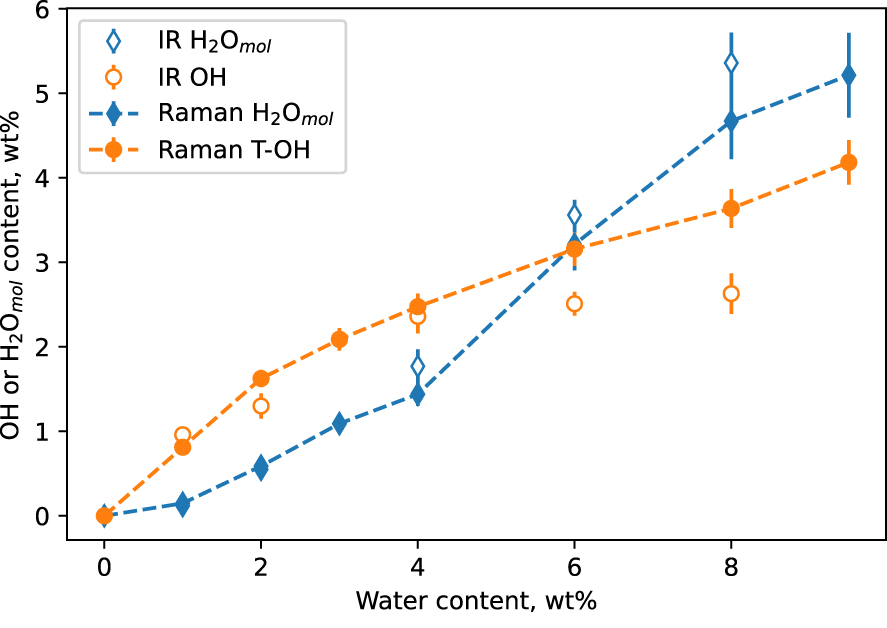
3.3. Qn speciation from Raman data
To extract information about glass polymerization in terms of Qn units, it is possible to model the 800–1300 cm−1 portion of spectra with a sum of peaks assigned to (Si,Al)–O stretching signals in different Qn units. However, in the present glasses, usual least-square methods tend to fail because of the important overlap of several contributions in a narrow spectral region. Indeed, from existing studies and the observation of spectra (see Section 3.1 and references cited therein), we expect (i) a peak near 860 cm−1 assigned to OH group vibrations, (ii) a peak near 950 cm−1 assigned to T–O stretching in Q2 units, (iii) a peak near 1000–1050 cm−1 assigned to asymmetric T–O stretching in Qn units, (iv) a signal near 1050–1100 cm−1 assigned to T–O stretching in Q3 units, and (v) one peak (or possibly two in highly polymerized glasses) between 1100 and 1250 cm−1 assigned to T–O stretching in Q4 units. We do not expect to see strong signals from Q0 or Q1 units because, even considering the most hydrous glasses, the estimated NBO/T of the present glass series remains well below 1 (see below), and the main units at play should be the Q2, Q3 and Q4 ones. Of course, this does not rule out the presence of those units because other factors like T or composition affect the 2Qn = Qn−1 + Qn+1 equilibria, but there is no clear indication of their presence in the glass spectra. However, before going further, it is necessary to take into account the Al/Si ratio in the Qn units, which causes the frequency of the bands to shift to lower values [Seifert et al. 1982; Neuville and Mysen 1996; Neuville et al. 2004]. We do expect the peaks assigned to vibrations in Qn units to be shifted to frequencies lower than those reported for Al-free silicate glasses, and this should be taken into account to initialize the peak-fitting models. The peak(s) assigned to Q4 units should be more affected by this effect, because Al preferentially substitutes Si in Q4 units [Mysen et al. 2003], particularly in Ca-bearing compositions with more than 45 mol% SiO2 as indicated by 27Al MQ-MAS NMR data [Neuville et al. 2006]. Therefore, from existing data recording the effect of the Si/Al ratio on the frequency of Qn units in CaO–Al2O3–SiO2 glasses [Neuville et al. 2004, 2008], the Q4 signal should be located near 1135 cm−1, the Q3 signal near 1050 cm−1, and the T2S signal near 1020 cm−1. This expected position of the Q3 signal agrees with the maxima observed in VV spectra, near 1050 cm−1. Similarly, the expected position for the T2S signal agrees with the maximum observed near ∼1114 cm−1 in VH spectra. The frequency of the Q2 signal is not expected to be significantly affected by the Al/Si substitution because 27Al MQ-MAS NMR data indicate that Al is not present in Q2 units in Ca aluminosilicate glasses with more than 45 mol% SiO2 [Neuville et al. 2006]. This agrees with the position of the Q2 shoulder near 950 cm−1 in the present VV and VH spectra, a frequency that agrees with previous literature reports [e.g., Furukawa et al. 1981; Mysen et al. 1982; Matson et al. 1983; McMillan 1984].
Previous studies reported that the shape of peaks assigned to Qn units is mostly Gaussian in aluminosilicate glasses [Mysen et al. 1982; Seifert et al. 1982; Neuville and Mysen 1996; Le Losq et al. 2014]. Recent studies in Cs silicate glasses suggest peaks for Q3 and Q2 units with important Lorentzian contributions [Bancroft et al. 2018; Nesbitt et al. 2019]. However, other studies of the Raman spectra of Ca, Na and K silicate glasses also point to Gaussian peak shapes [e.g., Mysen 1990; Zotov et al. 1998; Neuville 2006; Le Losq et al. 2015c]. To check this for the present Ca aluminosilicate glasses, we tested models with Gaussian, Lorentzian and pseudo-Voigt peak shapes. The model with Lorentzian peaks did not converge. The model with pseudo-Voigt peaks converged but with very high Gaussian to Lorentzian ratios. The choice of Gaussian peaks thus is appropriate in the present case. In any case, the adopted peak shape is only an approximation, as the true shape of T–O stretching in Qn units may be more complex, as shown by results from simulations [e.g., Zotov et al. 1999; Spiekermann et al. 2012, 2013] and linear spectral decomposition [Zakaznova-Herzog et al. 2007; Malfait 2009a; Herzog and Zakaznova-Herzog 2011]. From existing studies in Ca silicate compositions [e.g., Neuville 2006], the half width at half maximum of the Gaussian peaks should be comprised between 25 and 35 cm−1, approximately.
For peak fitting the spectra, we thus have information from previous studies. To use such pieces of information in the mathematical modeling of the spectra, a Bayesian approach is adopted. This approach differs from the traditional statistical peak-fitting methods in several ways: (i) first, we are not searching for the “best” model but we sample a range of plausible models given the data we have at hand, each model being associated with a probability; (ii) we can use the information we have from previous studies to guide the model sampling; (iii) given a sufficiently large set of sampled models, errors on the model parameters can be robustly evaluated without any assumption regarding their statistical distribution. All this relies on the use of the Bayes theorem, which states that the log posterior probability of a model is obtained from the sum of its log likelihood and its log prior. The log likelihood is the joint probability of the data given the model parameters. The log prior encodes the known information about the model. With expressions for those two terms, we can sample models that reconstruct the data given different sets of parameters, calculate their probabilities, and obtain a good picture of the models landscape.
To construct the log likelihood expression, we will compare how a model reconstructs both the VV and VH spectra simultaneously. The VV part of the model, GVV, is thus a sum of k Gaussian peaks of amplitude a, Raman shifts 𝜔0, and half width at half maximum l:
| (5) |
| (6) |
| (7) |
Now that we have an expression for the log likelihood, we need an expression for the log prior. Here, we use four multivariate Gaussian distributions to encode the existing pieces of information about the positions 𝜔0, amplitude a, width l and depolarization ratio dr of the various peaks. For 𝜔0, we can use the previously estimated positions of the peaks as means of the prior distribution on 𝜔0, . We also can use the observed spectral intensities at those positions as means of the prior distribution on a, . For the prior distribution on l, means were selected given previous publications on similar glass compositions [e.g., Mysen et al. 1982; Seifert et al. 1982; Neuville 2006] as . Given the average depolarization ratio of the 800–1300 cm−1 portion of the Raman spectra, we also used (all peaks) for the prior distributions on dr. The standard deviations of those prior distributions were adjusted depending on the estimated knowledge and model instability: we favored high standard deviations to avoid constraining too much the model, but a balance has to be found because too vague priors tend to result in convergence failure. Finally, the Gaussian prior distributions were truncated to exclude the negative domain, as all parameters should be real positive numbers. In practice, we calculated the log prior as the sum of the truncated Gaussian distributions of 𝜔0, a, l and dr.
With expressions for the log likelihood and the log prior, one can calculate the posterior probability of a model given the data. Now, our aim is to sample a subset of models representative of the model posterior probability distribution, and then to draw conclusions regarding our problem from the analysis of this sample of models. To perform the sampling step, the usual approach is to use random-walk algorithms, such as the Metropolis–Hasting algorithm. In this study, we used the No-U-TurnS (NUTS) sampler [Hoffman and Gelman 2014] implemented in the Python PyMC3 library. This sampler is based on the Hamiltonian Monte Carlo (HMC) algorithm [Neal 2011]. It samples the model space via a random walk guided by Hamiltonian dynamics, using the information from the gradients to ensuring a more efficient sampling strategy than a traditional random Metropolis–Hasting algorithm for instance. Compared to vanilla HMC, NUTS is an extension with no hand-tuning at all, very easy to use with libraries such as PyMC3 [Salvatier et al. 2016]. After sampling one thousand models (initialization advi-map, 200,000 init steps, 2000 tuning steps), statistics on the different model parameters were estimated; as their distributions followed a Gaussian statistics, we make use of the means and standard deviations in the following. All calculations performed with model parameters (e.g., for calculating peak areas, Qn unit fractions, etc.) were done using the full sample of models, such that reported results following those calculations are the means values and standard deviations characterizing the distributions of calculated values.
Figure 7 shows a set of VV/VH spectra together with a random sub-sample of 100 possible models, for the anhydrous glass as well as for that with 6 wt% water. The VV and VH spectra are well reproduced. The models retrieve well all the peaks inferred from literature knowledge and the observation of the spectra. The joint VV/VH modeling strategy is thus very powerful. It leverages the information from both signals and allows further constraining peak parameters. The observed mean depolarization ratios are: 0.13 ± 0.04 for the ∼860 cm−1 peak, 0.200 ± 0.009 for the ∼950 cm−1 Q2 peak, 0.20 ± 0.02 for the ∼1014 cm−1 T2S peak, 0.09 ± 0.01 for the ∼1060 cm−1 Q3 peak, and 0.21 ± 0.01 for the ∼1120 cm−1 Q4 peak. We note that the present modeling helps confirming the presence of the T2S peak in the Raman spectra of aluminosilicate glasses. Indeed, for glasses with M/Al > 1 (with M an alkali or alkaline-earth cation), this peak usually does not appear clearly in unpolarized Raman spectra [e.g., see spectra in Mysen and Toplis 2007; Le Losq et al. 2014; Dalou et al. 2015b; Bechgaard et al. 2017] or in VV spectra (Figure 3a). Here, the joint modeling of the VV and VH spectra clearly resolves the presence of this peak (Figure 7).
Example of Bayesian modeling of the 800–1300 cm−1 portion of the VV and VH Raman spectra (black lines) of a CAS glass with 6 wt% water. A subset of 100 posterior models, obtained by NUTS sampling (see text), are represented overlapping. The curves are affected by a transparency coefficients, so that a more intense color means a higher density of models, so a higher probability. For one model, the sum of its Gaussian components (grey, cyan, blue, green, purple and orange lines) yields the global model (red line).
Using the sample of possible models, we can follow how the signals in the 800–1300 cm−1 portion of the Raman spectra change with the glass water content (Figure 8a). Changes are very limited. The main variation is that of the 860 cm−1 peak assigned to T–OH group vibrations, which increases in intensity with increasing glass water concentration. The parameters of the other peaks change only slightly with water content, inducing very little changes in the areas of the peaks assigned to Qn units. This observation is surprising, given an expected change in NBO/T (𝛥NBO/T = NBO/Thyd −NBO∕Tanh) of ∼0.28 with the addition of 9.5 wt% water, calculated from both Raman and infrared water speciation data under the assumption that all OH groups are bonded to tetrahedral cations. Using the areas of the Q2 and Q3 peaks and the relative method presented in Le Losq et al. [2015c], it is possible to calculate 𝛥NBO/T variations with glass water content (Figure 8b). Those are much too limited (grey squares in Figure 8b) compared to those estimated from the fractions of T–OH groups determined from Raman or IR spectroscopy (solid and open diamonds in Figure 8b, respectively).
(A) Area of the Gaussian bands assigned to T–O stretching vibrations in Q2 (blue stars), Q3 (purple diamonds), and Q4 units (orange circles), to T–OH group vibrations (cyan squares), and T2s asymmetric stretching vibrations in Qn units (green triangles). (B) Comparison between the change in glass NBO/T with water content calculated from IR (empty orange circles) and Raman (solid blue circles) water speciation data (Figure 6), assuming all OH groups interacting with Si or Al, or calculated from the variations in the peak areas (grey triangles). Lines are guides for the eyes. If not visible, errors bar are smaller than symbol size.
3.4. 29Si SP MAS NMR spectra
To try understanding the Raman observations, we acquired the 29Si SP MAS NMR spectra of the glasses with 0, 3 and 6 wt% water. Very small, if not negligible differences are observed between the 29Si SP MAS NMR spectra of those glasses (Figure 9), which mostly consist of a broad symmetric band centered near −105 ppm. More precisely, the chemical shift of the band is at ∼−104.4 ppm in the anhydrous glass, and at ∼−104.6 ppm in the glass with 6 wt% water. The width at half maximum of the spectra barely varies with water content. It is at ∼11 ppm for all glasses. A change in Qn speciation implies significant variations in the shape of the 29Si NMR spectra, as observed when adding alkali into silica [e.g., Maekawa et al. 1991] or when adding water in silicate glasses [e.g., Cody et al. 2005; Le Losq et al. 2015c]. Here, within the resolution of the present 1D 29Si NMR spectra, there is no significant changes (Figure 9), in agreement with the Raman results (Section 3.3 and Figure 8). Both datasets actually indicate that the Si speciation in Qn units barely changes with water addition into the glasses, at least up to 6 wt%. We note that such result agrees with the 29Si NMR data of Cody et al. [2020] on hydrous sodium aluminosilicate glasses with 0, 5, and 10 wt% H2O, which showed only limited differences between the NMR spectra of the glasses with 0 and 5 wt% H2O; larger differences were observed between the 29Si NMR spectra of the glasses with 0 and 10 wt%.
(A) 29Si MAS NMR spectra of the glasses containing 0 wt% (anh.), 3 wt% and 6 wt% water. (B) difference between the 29Si MAS NMR spectra of the anhydrous and 6 wt% water glasses.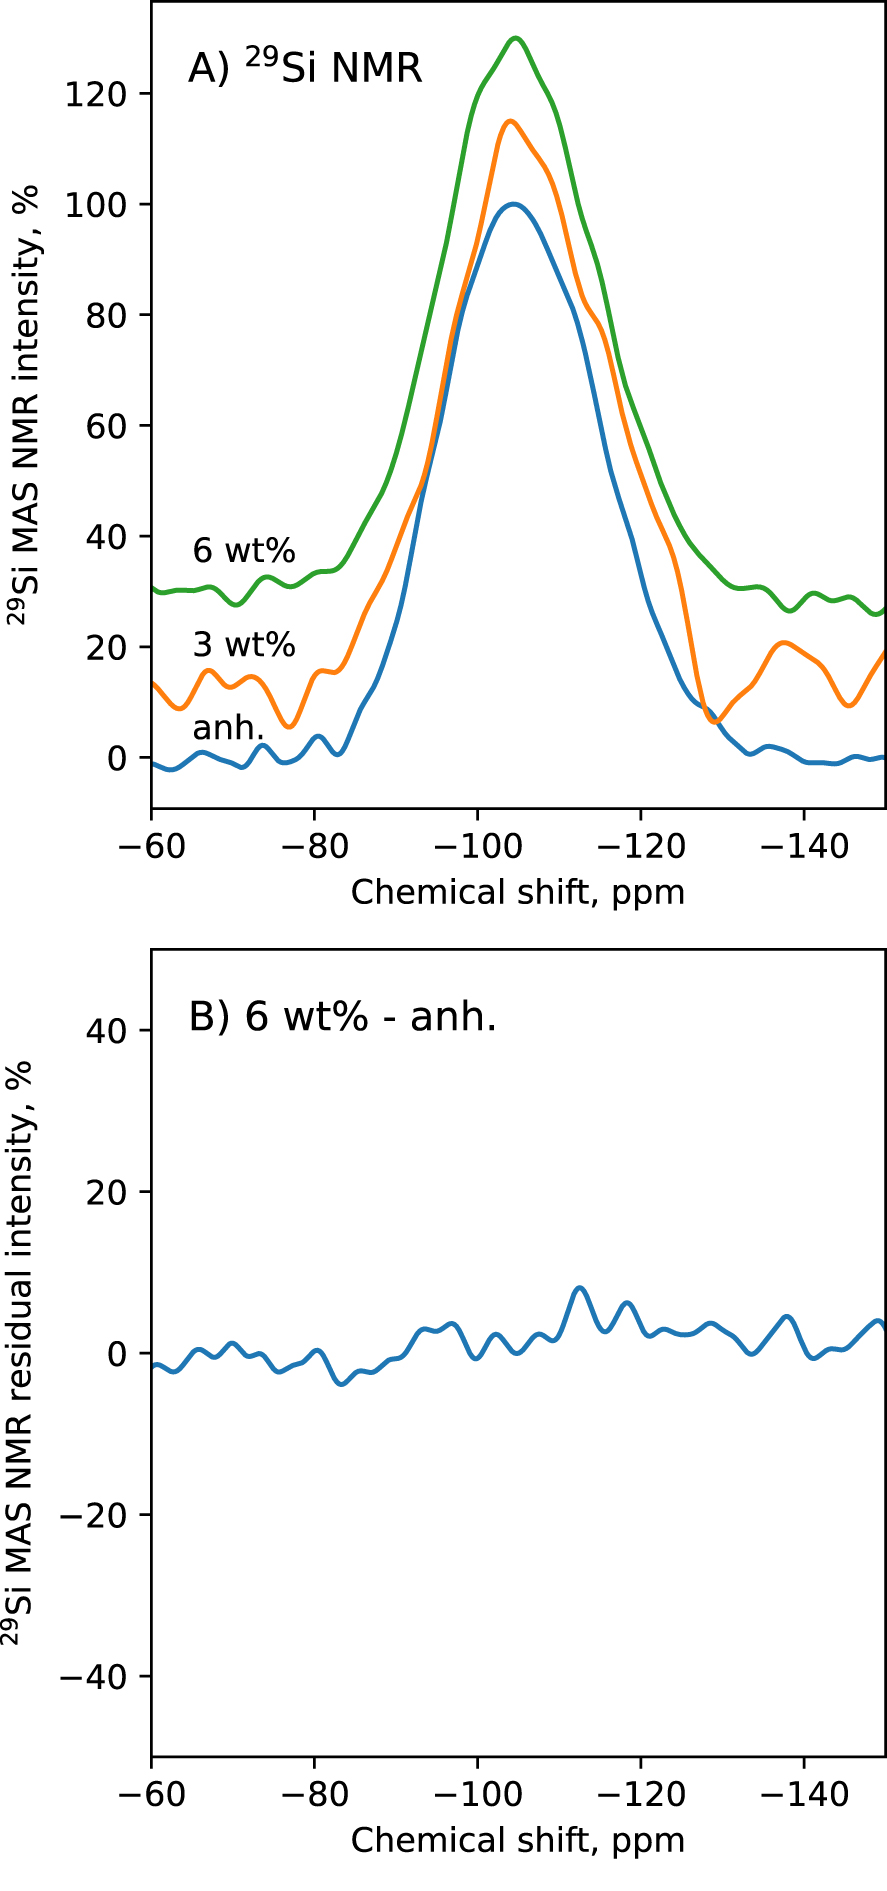
3.5. Water solubility
Using the linear relationship observed in Figure 4A, it is possible to recover the glass water content from its Raman spectra [e.g., see original publications of Thomas 2000; Chabiron et al. 2004; Zajacz et al. 2005; Behrens et al. 2006; Di Muro et al. 2006]. Raman spectra thus allowed measurement of the glass water content in samples equilibrated in the piston–cylinder at high pressure and high temperature, under and over-saturated with water. For example, Figure 10A shows how the water content determined from the Raman spectra of the samples changes as a function of the nominal water content in the Pt capsule, for a run at 1200 °C and 1.0 GPa. We observed that, below saturation, samples were bubble-free and Raman-determined water contents are close or below the nominal values. Above saturation, vesicles appear and Raman-determined water contents are systematically below the nominal values. In Figure 10A, glasses obtained from capsules with nominal water contents from 12 to 22 wt% present water contents ranging from 10.8 ± 0.2 wt% to 11.6 ± 0.7 wt% (standard deviations are calculated from the analysis of 5 to 10 Raman spectra). This yields a solubility limit at 11.4 ± 0.5 wt%.
Water solubility in the eutectic anorthite-quartz-wollastonite CAS glasses. (A) Example of the determination of the water content at saturation of a melt equilibrated with and without excess water at 1.0 GPa and 1200 °C. Below 11 wt%, no large vesicles are observed; above, large fluid vesicules are observed, and Raman-determined water contents all range around 11.4 ± 0.5 wt%. Each symbol is calculated from the mean of 5–10 different Raman measurements. (B) Water solubility at 1200 °C as a function of pressure. Data from McMillan et al. [1986], abbrev. M1986 in the caption, are also shown. Good agreement is observed with our data, which complement the dataset up to 2 GPa. The dashed orange and red lines materialize the expected water contents of the melts during the HDAC runs at 920 and 950 °C, respectively, given the observed water versus pressure relationship in this figure. A fit (dashed grey line) was performed for easy interpolation. If not visible, errors bar are smaller than symbol size.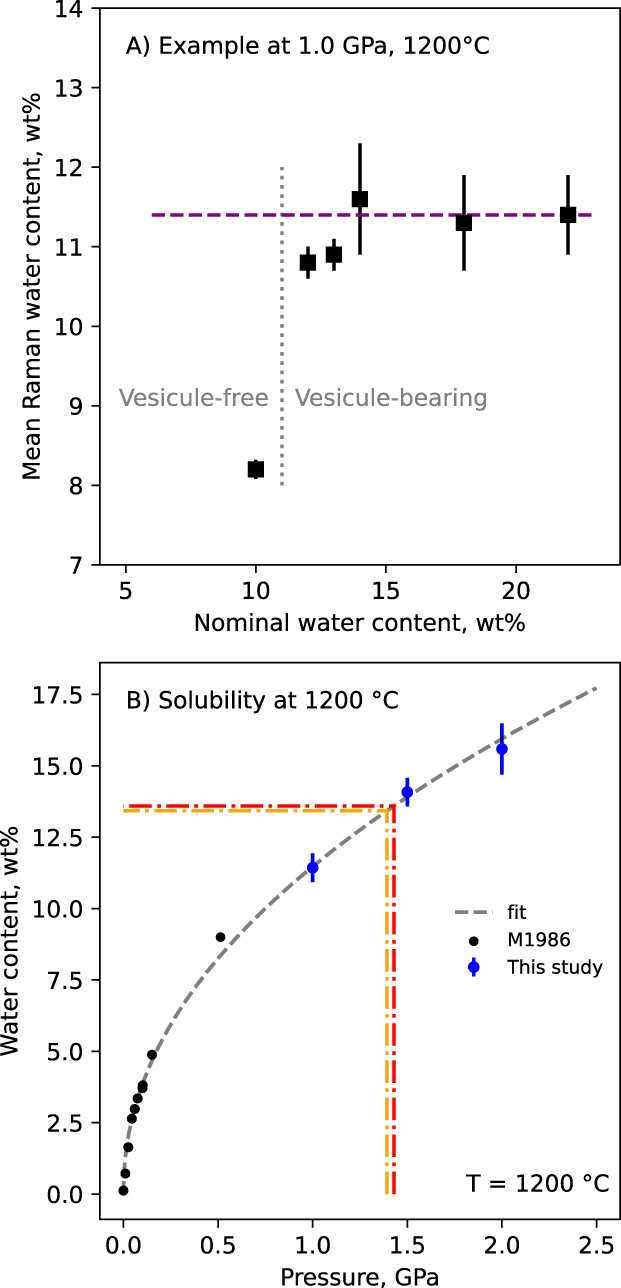
Using the protocol described previously, we determined the water solution as a function of pressure at 1200 °C, and as a function of temperature at 1.0 GPa. The three measurements made at 1.0, 1.5 and 2.0 GPa and 1200 °C are plotted together with the data of McMillan et al. [1986] (Figure 10B). The present data confirm the well-known effect of pressure on water solubility [Burnham and Jahns 1962; Burnham 1975; McMillan et al. 1986; McMillan and Holloway 1987; Mysen and Acton 1999; Bouyer et al. 2010]. Temperature has a much smaller effect, difficult to detect within the errors of Raman measurements. Changing T from 1000 to 1200 °C results in no visible change in water solubility at 1 GPa (Table 3).
3.6. 700–1300 cm−1 portion of Raman spectra from melts in HDAC experiments
From the experiments performed in HDAC cells, previously reported in Le Losq et al. [2017], crystal-free Raman signals of the melt were obtained at ∼1.4 GPa and two different temperature conditions: 920 °C and 950 °C. At other conditions [see Table 2 in Le Losq et al. 2017], the 700–1300 cm−1 portion of the Raman spectra are mixtures of signals from melts and crystals, such that no quantitative information can be extracted from such spectra.
From melts at 920 °C and 950 °C and ∼1.4 GPa, in addition to the O–H stretching signals reported in Le Losq et al. [2017], Raman spectra were also acquired in the 400–1300 cm−1 frequency range. Figure 11 shows the spectra corrected from temperature and excitation line effects (see Methods). Neglecting the effect of temperature on water solubility as it appears limited (see Table 3 and Section 3.5), Figure 10B allows estimating that the melts had ∼13.4–13.6 wt% dissolved water. For comparison, a spectrum of a glass with 13.6 wt% dissolved water (from one of the solubility experiment) is also reported in Figure 11.
400–1200 cm−1 portion of the unpolarized Raman spectra of the melts at 920 and 950 °C. Pressure at those temperature was of ∼1.4 GPa. For comparison, the unpolarized Raman spectrum of a glass with ∼13.6 wt% is shown; this glass was obtained during the solubility experiments.
Spectra of the melts present similar features compared to those of glasses, but the intensity of the bands are very different, as well as their width as expected from thermal broadening effects. Compared to a glass with a similar water concentration, we observe that (Figure 11):
- the main band near 500 cm−1 is now a shoulder on the left side of the 575 cm−1 band, which was assigned to T–O–T vibrations involving Q2 units;
- accordingly, a large increase in intensity is observed at 940 cm−1, at the frequency assigned to T–O stretching in Q2 units;
- the 860 cm−1 shoulder is not clearly visible, but it is clear that there is important contributions at this frequency in the melt spectra;
- the shoulders near 650 and 780 cm−1 are not visible in the spectra of the melt;
- the maximum intensity of the 800–1300 cm−1 envelop shifts to slightly lower frequency.
Measuring in the reduced Raman spectra and using , OH contents are equal to 11.9 ± 0.7 and 10.6 ± 0.7 wt% at 920 and 950 °C, respectively. Within error bars, they can be considered as comparable, as expected from the small temperature difference. This means that most of the water is dissolved as hydroxyl groups in the melts, while in the glass with the same water content (synthesized at 1.0 GPa and 1200 °C), most of the water is dissolved as H2Omol. As a result, there is a strong difference in the aluminosilicate structure of the glass and melt. This is particularly visible when looking at the Raman signal of Q2 units, significantly smaller in Raman spectra of glasses than in those of melts (Figure 11).
4. Discussion
4.1. Raman versus infrared water speciation
Previous attempts to retrieve water speciation in glasses from peak-fitting of the O–H stretching band were done but led to inconclusive results [e.g. Chabiron et al. 2004; Behrens et al. 2006]. A recent study from Helo et al. [2020] also propose to perform a linear decomposition of the O–H stretching band for rhyolite glasses, to retrieve the OH and H2Omol speciation. The use of the O–H stretching band to retrieve water speciation, from peak fitting or linear decomposition, presents a main problem: this idea starts from the assumption that H2Omol and OH groups have distinct O–H stretching signals. Data indicate that this assumption can be challenged. First, the O–H stretching signal is strongly affected by hydrogen bonding, which can change significantly as a function of temperature [Walrafen et al. 1986; Frantz et al. 1993; Holtz et al. 1996] as well as glass composition [e.g., Mysen and Virgo 1986a; Le Losq et al. 2015a]. Then, a principal component analysis of the OH stretching band from the present CAS glass Raman spectra reveals that one component explain 99.5% of the variance of the data. 99.9% of the variance is explained by two components. This indicates that the O–H stretching signals from OH groups and H2Omol species are quite similar. Small differences may exist, as shown by the partial O–H stretching signals determined by Helo et al. [2020]. However, planning on using those differences to retrieve water speciation is challenging, as shown by the variable success of previous studies. Furthermore, the use of the Raman O–H stretching band requires a calibration against previously measured OH and H2Omol species concentrations, through infrared spectroscopy for instance. As such, methods based on the use of the Raman O–H stretching band are relative methods. Contrary to this, the approach presented in this study is an absolute method, based on the calculation of apparent Raman cross sections for signals assigned to H2Omol and T–OH groups. The present approach thus offers another way to determine water speciation, independently of infrared data. As such, this is an important step as it will allow comparing water speciation data obtained from different ways. However, one potential problem will occur for glasses rich in M–OH species. Indeed, the band near 860 cm−1 is assigned to T–OH vibrations. Accordingly, its frequency varies with the glass Si/Al ratio [Malfait 2009b]. Therefore, this band does not appear to record contributions from M–OH groups. As a consequence, the present method may not work for glasses containing a significant fraction of M–OH groups, like for example the diopside or lithium trisilicate compositions [Xue and Kanzaki 2008; Le Losq et al. 2015c].
The comparison of water speciation values from FTIR and Raman spectroscopy corroborates the good precision of the present Raman determinations (Figure 6). Raman-determined OH and H2Omol concentrations compare well with infrared-determined values, except above ∼5 wt% water where the Raman method systematically yields higher OH contents (Figure 6). The discrepancy above ∼5–6 wt% water can be assigned to (hypothesis 1) the different errors affecting the Raman and IR methods, or (hypothesis 2) to a point where IR spectroscopy begins to fail. Hypothesis 1 is difficult to reconcile with the fact that IR and Raman data agree very well for glasses containing moderate to low water concentrations. Why errors affecting both methods would systematically bias the values they return after a given water concentration?
Hypothesis 2 is more plausible for several reasons. As a starting point, 1H NMR data do not always support the water speciation retrieved from IR spectroscopy for aluminosilicate glasses, as discussed by Cody et al. [2020]. It actually appears that there can be significant discrepancies between both methods. Studying hydrous albite (NaAlSi3O8) glasses, Cody et al. [2020] reviewed and rejected multiple possible sources of errors and misinterpretation of 1H NMR data. From this, they conclude that 1H NMR data are robust, this leading to the conclusion that the use of 4500 and 5200 cm−1 IR bands to retrieve water speciation in such aluminosilicate glasses may actually fail. Now, such failure is not necessarily surprising because the 4500 cm−1 IR band used to determine the concentration of OH groups in glasses can be complex. For instance, Le Losq et al. [2015b] reported that the 4500 cm−1 IR band becomes unresolved in potassium silicate glasses, because of a broad O–H stretching signal that extends down to 2000 cm−1, which, therefore, would shift the presumed combination band at 4500 cm−1 to frequencies underneath the 3600 cm−1 envelope. As the 4500 cm−1 is a combination mode of the signal from T–OH groups near 900 cm−1 and the O–H stretching signal near 3600 cm−1, any broadening in those signals can affect the resolution of the 4500 cm−1 peak. This is reinforced by the overlapping of the 4500 cm−1 band with a contribution near 4000 cm−1, which remains not clearly assigned but depends on the total water content in the glass [see review in Cody et al. 2020]. In the case of the present CAS glasses, the 4000 and 4500 cm−1 signals overlap at water contents higher than ∼5–6 wt%. In Figure 12, we clearly observe this when looking at the infrared spectra of four glasses with nominal water contents ranging from 2 to 8 wt%. The 4500 cm−1 band is well resolved in the glasses with 2 and 4 wt% water (Figure 12). However, in glasses containing 6 and 8 wt% water, it is not clearly separated from the 4000 cm−1 IR band because the latter and probably the tail of the broad and very intense 3600 cm−1 IR O–H stretching signal both contribute some signal near 4300 cm−1. As a result, this probably explains why IR spectroscopy tends to underestimate the concentration of OH groups at water content higher than 5 wt% in the present case (Figure 6). Therefore, at high water content, values for the speciation of water determined from Raman spectra probably are more robust than those estimated from IR data because they rely on the use of the ∼860 cm−1 Raman band assigned to T–OH vibrations, which shape and frequency are not affected by increasing total water content (Figure 7). This result participates in building the hypothesis than OH concentrations determined through IR spectroscopy may be underestimated in the case of water-rich glasses. This finding is not identical but still in agreement with findings of Cody et al. [2020] for fully polymerized albite glasses. Those authors concluded, from 1H NMR spectroscopy, that IR spectroscopy for albite hydrous glasses was (i) overestimating the concentration of OH groups below ∼5 wt% H2O and (ii) underestimating it above ∼5 wt% H2O. This suggests that the true water speciation in glasses may depend on their composition in a way more complex than previously envisioned.
3800–5500 cm−1 portion of IR spectra of four different hydrous CAS glasses, with 2 to 8 wt% dissolved water. The bands near 4500 and 5200 cm−1 are assigned to vibrational combination modes of OH groups and H2Omol species, respectively (see text). The band near 3900 cm−1 broadens with increasing the glass water content, so that the limit between this band and the 4500 cm−1 signal becomes difficult to distinguish at water contents above 5–6 wt%. This may explain why IR spectroscopy underestimates the OH contents of the glasses above a total water content of 5 wt%, in comparison to Raman spectroscopy (Figure 6).
4.2. Water effect on glass polymerization
In the present Ca aluminosilicate glasses, the structural modifications resulting from the addition of water in the glass remains limited (Figures 8, 9). This is not the first time that such limited changes in 29Si NMR or Raman spectra are reported for aluminosilicate compositions. Kohn et al. [1989, 1992, 1998] reported only limited changes in the polymerization of sodium aluminosilicate glasses upon hydration, leading those authors to propose a mechanism of protonation of T–O–T bridges instead of depolymerization. However, recent multinuclear NMR data point to depolymerization rather than protonation [Malfait and Xue 2010, 2014]. Furthermore, the lack of changes in the Raman and 29Si NMR spectra cannot be assigned to a compensation of the depolymerization mechanism accompanying formation of T–OH groups by the joint formation of Ca–OH groups [e.g., see Moretti et al. 2014], because in our compositional domain the fraction of Ca–OH groups should be very limited as discussed in Section 3.2. Therefore, it is difficult to reconcile the lack of changes in the Raman and 29Si NMR spectra with the still important fraction of T–OH groups that appear to be present in the glass (Figure 8b). This problem affects our data but also previous studies. For instance, Raman spectra of hydrous silica glass with 5 wt% water display the absence of a ∼1100 cm−1 Q3 Raman signal despite the clear presence of an Si–OH signal [Mysen and Virgo 1986a]. It thus appears that further analysis are necessary to find the origin of this discrepancy.
4.3. Melt versus glass
The problem discussed in Section 4.2 may not be extremely important if we actually are interested in melts rather than glasses. Indeed, the HDAC data (Figure 11) show clear and important changes in the Raman spectra, supporting depolymerization of the melt. Results shown in Figure 11 thus indicate that the data from the observation of glasses are not appropriate for making inferences about the effect of water on melt polymerization. First, for anhydrous compositions, small differences already exists between the Raman spectra of glasses and melts. They translate a shift of the equilibria 2Qn = Qn−1 + Qn+1 to the right-hand side as temperature is increased [Mysen and Frantz 1993, 1994; Mysen 1995, 1996, 1999; Kalampounias et al. 2006; Bechgaard et al. 2017]. The large differences observed in this study (Figure 11) may partly arise from such effect, but principally originate from the strong effect of temperature on water speciation [e.g., Nowak and Behrens 1995; Sowerby and Keppler 1999; Behrens and Yamashita 2008; Yamashita et al. 2008; Le Losq et al. 2013; Chertkova and Yamashita 2015]: increasing T favors the reaction of H2Omol with T–O–T bonds and the formation of OH groups, leading to the disruption of Q3 − Q4 units and the formation of depolymerized Q2 units (Figure 11).
This has important geochemical implications: water speciation data from glasses cannot be used to make inference about processes occurring in melts at high temperature, and vice-versa. Similarly, observations of the effect of water on the structure of glasses, which actually appear to be affected by some unknown bias, cannot directly be used to make inference about the polymerization of hydrous melts, an important parameter that controls melt mobility and thermodynamic properties, the diffusion of volatile elements including water and CO2, and even mineral partition coefficients. For instance, for the calculation of water diffusion toward bubbles in magmatic mushes in fluid dynamic models [Gonnermann and Manga 2007, 2013], it should be necessary to consider the effect of temperature on water speciation and its consequence on melt polymerization. Without such consideration, results will be affected by important bias because the diffusivities of H2Omol and OH groups are different [see Zhang et al. 2010, and references therein].
5. Conclusion
This study extends our knowledge on the solution mechanisms of water in calc-alkaline melts. Polarized Raman spectroscopy data on the glasses allowed retrieving water speciation in the glasses through a new, absolute method. It is now possible to use the intensity of the Raman peaks at ∼860–900 cm−1 and 1630 cm−1 to retrieve the concentration of T–OH and H2Omol species in hydrous glasses. We applied the method to the present CAS glass composition with a very good success. Results compares very well with the IR-determined values, except at high water contents where IR results appeared biased. Indeed, above ∼5 wt% dissolved water, the OH content retrieved from IR spectra appears underestimated due to a broadening and decrease in resolution of the 4500 cm−1 IR band that may influence the determination in OH group concentration. This corroborates previous results from 1H NMR spectroscopy on albite glass compositions [Cody et al. 2020].
The analysis of the silicate signals in the Raman spectra as well as of the 29Si MAS NMR of the hydrous CAS glasses reveal limited changes with water addition in the Raman bands assigned to vibrations in Qn tetrahedral units. However, from melt Raman spectra, it also is found that melt polymerization differs strongly from that of a glass with a similar content as shown by Raman spectra (Figure 11), due to much higher OH contents. Such differences should be considered, for instance in models of water diffusion in magmas.
Conflicts of interest
Authors have no conflicts of interest to declare.
Acknowledgements
CLL acknowledges funding from a Chaire d’Excellence IDEX19C627X/FD070/D110 from the ANR IdEX Université de Paris 18-IDEX-0001 as well as from a Postdoctoral Fellowship of the Carnegie Institution for Science during the realization of this project. CLL acknowledges the use of the PARI Raman facility. We also gratefully acknowledge the W. M. Keck foundation, the National Science Foundation and the Carnegie Institution for support of the W. M. Keck Solid State NMR and the FTIR facilities.