


 CC-BY 4.0
1. Introduction
Seismicity usually accompanies volcanic activity. For this reason, it is often used to monitor volcanoes to assess or predict their activity [Chouet and Matoza 2013] and to anticipate the onset of an eruption [e.g., in Piton de la Fournaise, Peltier et al. 2009]. On remote or inaccessible volcanoes [e.g. Axial seamount Wilcock et al. 2016], seismic signals provide one of the few continuous sources of information directly related to volcano behavior. In Mayotte, the volcanic eruption was first indicated through a strong episode of seismicity [Cesca et al. 2020; Lemoine et al. 2020].
Mayotte is one island of the Comoros archipelago, situated between Africa and Madagascar (Figure 1a). While the origin of the archipelago was associated with a hotspot, recent studies define the area as a shear zone separating the Somalia and Lwandle plates [Famin et al. 2020; Dofal et al. 2021]. Before 2018, the seismicity of the archipelago was moderate [Bertil and Regnoult 1998; Bertil et al. 2021]. The only volcano known to be active was Karthala, located on Grande Comore, the westernmost island of the archipelago [Bachèlery et al. 2016]. The strong burst of seismicity east of Mayotte that started on May 10th, 2018, with the largest event (magnitude Mw 5.9) on May 15th [Cesca et al. 2020; Lemoine et al. 2020], surprised the inhabitants of the island, the authorities, and the scientific community. A month later, strong deformation signals were observed on a permanent Global Navigation Satellite System (GNSS) station, indicating a likely deformation source to the east of the island [Briole et al. 2018]. Finally, in May, 2019, a new active volcano was discovered 50 km east of Mayotte during a scientific campaign [Mayobs1, Deplus et al. 2019; Feuillet et al. 2021]. The erupted volume and duration [about 6 km3 and over two years, REVOSIMA-IPGP 2021] of this underwater eruption is unprecedented in the recent history and is second only to the 1783 Laki eruption that lasted eight months and produced 14.7 ± 1.0 km3 of basaltic lava flows [Thordarson and Self 1993]. The underwater volcanic edifice reached a height of 800 m in one year [REVOSIMA-IPGP 2021].
(a) Map of Mayotte with the land stations used in this study (orange triangles). The new volcano is represented with the red triangle. The see-through black dots represent the 50,512 earthquakes located in our study. (b) Days processed for the detection for each station (orange). (c) Total number of stations processed over the period.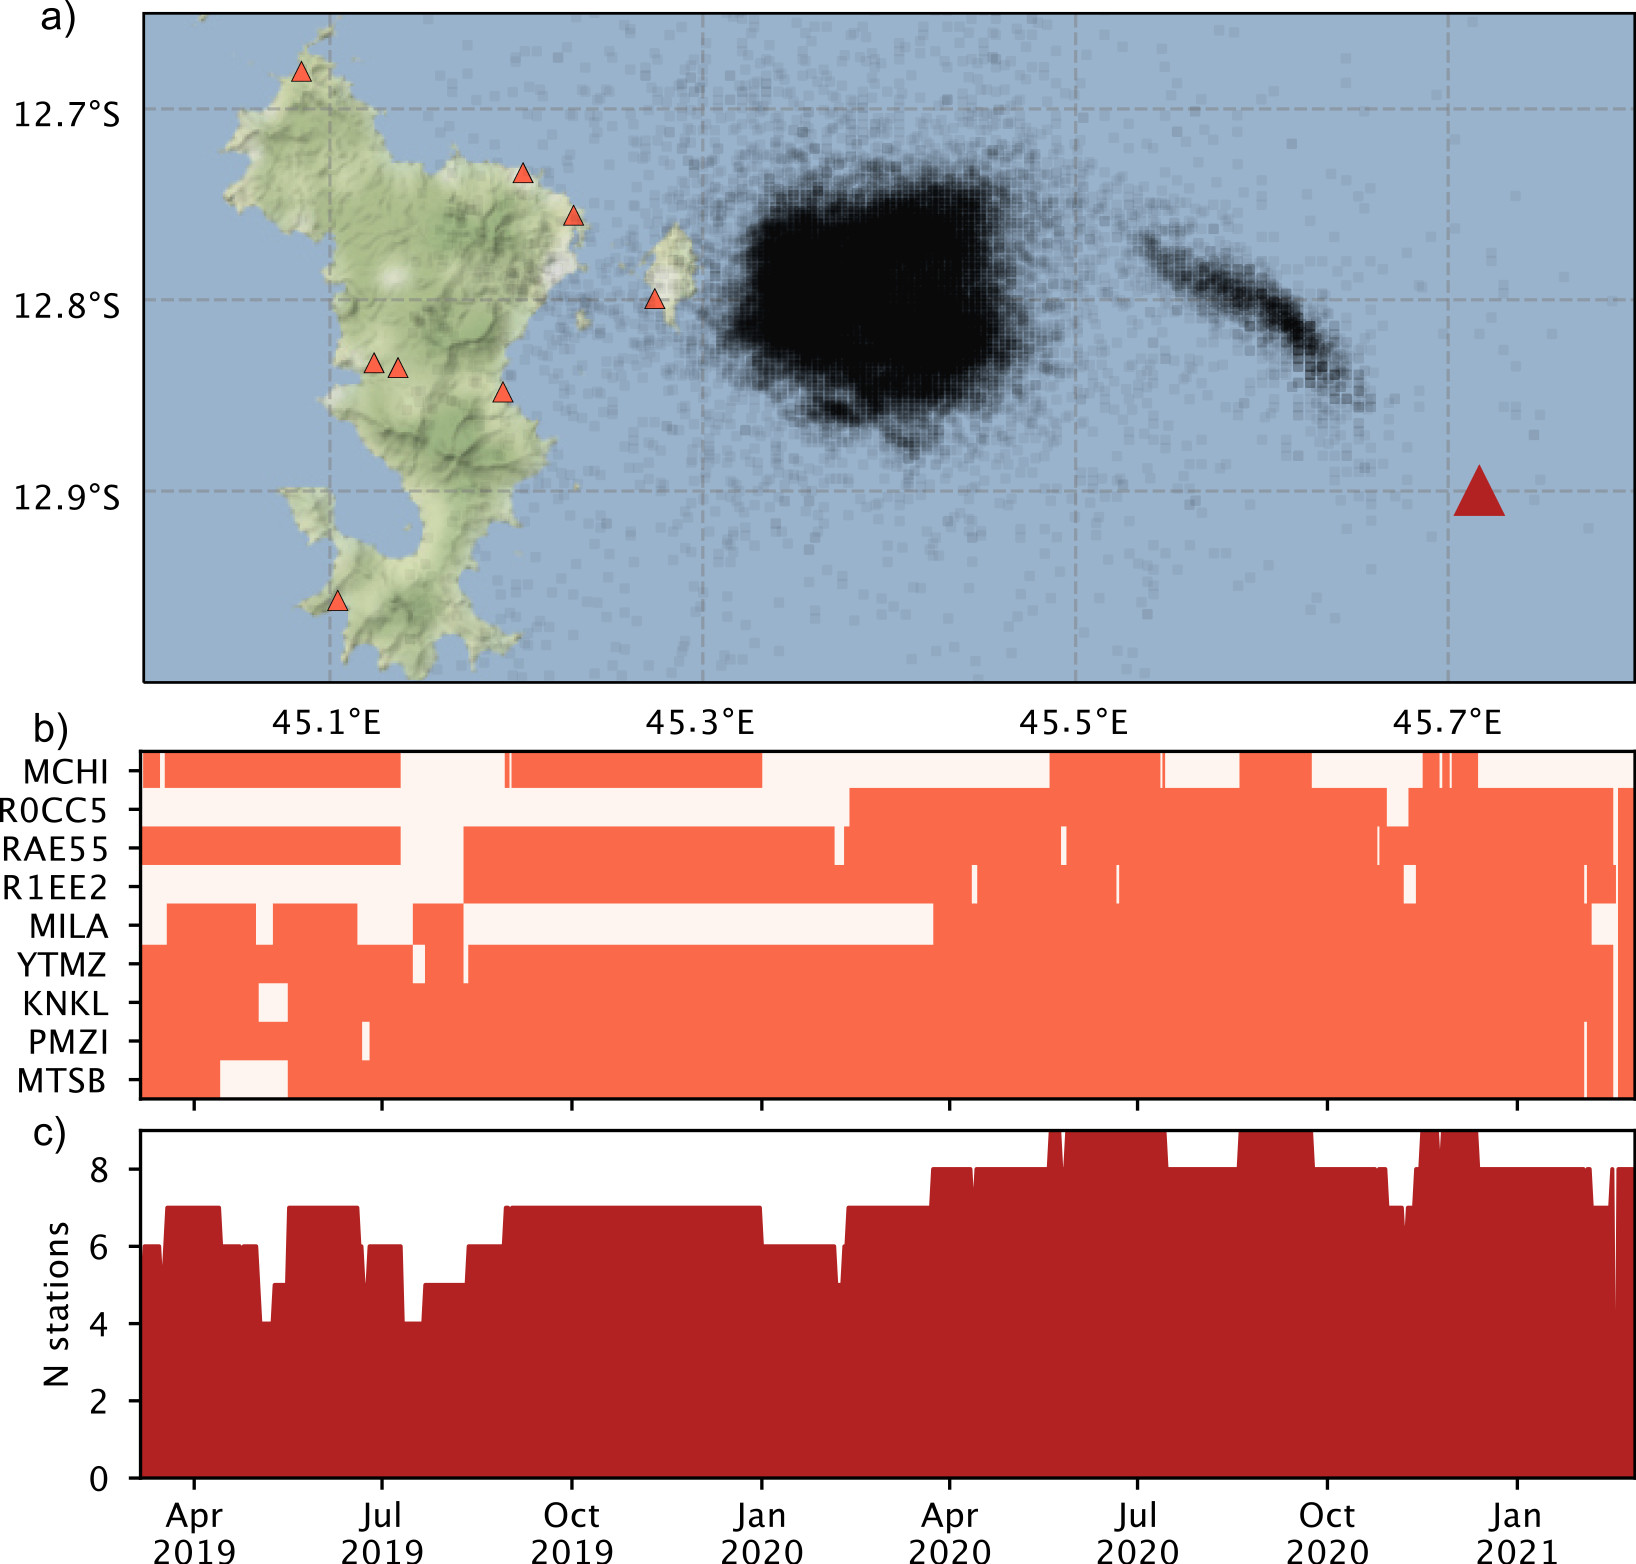
The Mayotte submarine eruption was first suspected through the intensity of the seismicity crisis that began on May 10th, 2018. The seismicity is on-going and indicates continuing activity of the system. Studying this seismicity is crucial for understanding this dynamic process and its future evolution. Because no strong seismicity episode or volcanic activity was expected, no seismic monitoring network or monitoring procedures were in place in 2018 and only one permanent seismic station was maintained on the island by the BRGM [RESIF 1995, Bureau de recherches géologiques et minières]. French scientific institutions organized to monitor the activity with an improved land network and through campaigns at sea, which lead to the creation of the REVOSIMA (Réseau de surveillance volcanologique et sismologique de Mayotte) in 2019. Thanks to this effort, several seismic stations were installed on land and on the ocean bottom to better characterize the seismicity [Saurel et al. 2022]. Before this work and its operational implementation [Retailleau et al. 2022], the seismicity was identified and located mostly manually, which limited catalogs to the strongest activity [usually events greater than M 3; Saurel et al. 2022].
Automatic picking procedures are widely used to analyse large, continuous datasets that can not be easily analysed though hand picking. Automated methods have been extremely useful for real-time detection, when it is not possible for an analyst to continuously pick events, and for reanalysis of long time series. Different automatic detection methods have been used for earthquake detection, ranging from short term/long term amplitude ratios [e.g. STA/LTA, Allen 1978] to template matching [Shelly et al. 2007; Ross et al. 2019]. While the former is efficient, it may not be effective for detecting small events, especially under noisy conditions. Template matching, on the other hand, can detect very small events (with magnitudes less than 1). However, it is computer-intensive and requires prior information in the form of template waveforms, which limits its ability to detect seismicity changes. We use the machine learning method PhaseNet [Zhu and Beroza 2019], which allows fast picking of phases while being able to pick small events without prior information. It also identifies both P and S waves, which is crucial for more accurate automatic location.
A wide range of seismic signals are generated by active volcanoes, and they reflect the diversity of source mechanisms [Chouet and Matoza 2013]. Volcano-Tectonic earthquakes (VT), the most common events, are discrete events with a broad frequency band (2–40 Hz) that are linked to shear failure due to the destabilization of the volcanic edifice. Another common type of seismicity is Long Period earthquakes (LP) which have a narrower and lower frequency band than VT events (0.5–5 Hz). LP earthquakes are usually attributed to resonance in fluid-filled conduit excited by magmatic motion [Chouet 1996]. Several authors [Shapiro et al. 2017; White and McCausland 2019] have shown that deep LP events may be precursors of eruptions, making their analysis crucial. In this paper our interest was to detect comprehensively the seismicity and to discriminate between these two main types of events. We analyse their characteristics in the Mayotte system with a focus on LP behavior. We also note the observation of Very Long Period events [VLP or VLF, Cesca et al. 2020; Lemoine et al. 2020; Feuillet et al. 2021; Laurent et al. 2020]. These events have monochromatic signatures and do not have common earthquake characteristics. For this reason, PhaseNet does not detect VLP events, and we do not present their analysis; however, we discuss their observation and their links to other events.
We analyze two years of continuous data recorded by the stations installed on the island of Mayotte using the machine learning-based method PhaseNet [Zhu and Beroza 2019]. We assess the robustness of P- and S-phase arrival picking by comparing with manual picks from two different catalogs. We associate events when enough phases are detected, and then proceed to locate them. We separate the VT and LP earthquakes through their frequency characteristics and compare their locations and timing.
2. Seismicity identification
We detail in this section the event detection process through phase arrival, automatic picking, and event association.
2.1. Automatic detection in continuous time series with PhaseNet
Only one seismic station was installed on the island of Mayotte before the seismic crisis started [RA.YTMZ RESIF 1995]; however, the seismic network was progressively extended on the island to record a more extensive dataset, improve the detection level, and increase the location precision of earthquakes [Saurel et al. 2022]. To monitor the early part of the crisis, the regional stations on Grande Comore and Madagascar islands had to be used to locate events, which did not allow precise locations [Lemoine et al. 2020]. Since March 2019, the permanent continuous real-time seismic network has been extended with 2 accelerometers, 4 broadband stations (flat response down to 20 or 120 s), and 2 short-period low-cost stations (flat response down to 1 Hz). Since then, the network aperture has been wide enough to allow stable and robust automatic detection and location of the seismicity with at least 4 stations. Figure 1a shows the stations used on the island of Mayotte for this study and Figure 1b shows data availability for each station throughout the period of interest. The number of stations for which data is available with time is summarized on Figure 1c. Except for a few weeks in June and August 2019, there are always at least 6 stations available. All stations but one feature 3-component sensors with a sample rate higher than 50 Hz.
We use the PhaseNet algorithm to identify P- and S-phase arrivals on the continuous archived data. PhaseNet is a deep-neural-network-based method trained on numerous earthquakes in northern California to pick and identify phases on 3-component seismograms [Zhu and Beroza 2019]. It generalizes well enough to have been successfully used in diverse tectonic contexts, including: the Ridgecrest earthquake sequence [Liu et al. 2020], induced seismicity in Arkansas [Park et al. 2020], and a year of seismicity in the Appenines [Tan et al. 2021].
We first filter the data with a 0.4–45 Hz frequency band filter, remove the instrument response, then resample at 100 Hz and split into 30 s windows with a 50% overlap. Finally, this data is sent to PhaseNet for pick estimation. For the vertical-only station (AM.RAE55), we add two 0-filled vectors of data as dummy horizontal channels before sending the data to PhaseNet.
We extract all the picks of the different stations. An event is declared when at least 10 P and S picks are within the expected time window for events in the area (2 s time window after the first arrival for the P waves and 8 s time window starting 4.5 s after the first P arrival for the S waves).
2.2. Pick quality estimated from manual catalogs
PhaseNet was trained on tectonic events. To test how well it generalizes for events that occur in a volcanic environment, we compare its arrival time measurements to reference arrival time measurements performed by skilled analysts. In principle, such a comparison between several observations quantifies uncertainties of arrival-time determination of hand-picked data [Diehl et al. 2012]. It has also been used for performance assessment of various automatic picking procedures [Dai and MacBeth 1995; Leonard 2000; Di Stefano et al. 2006].
For their analysis of the Mayotte seismo-volcanic crisis, Cesca et al. [2020] and Lemoine et al. [2020] built seismic catalogues through manual picking using the local station YTMZ. Consequently, we have access to a dataset of events with two independent reference manual estimations of P and S onsets besides PhaseNet picks on YTMZ data. The first catalog of manual picks (from BRGM) contains 1347 P onsets and 1326 S onsets hand-picked by several expert analysts for events of magnitudes above M 3.5 detected between May 10th, 2018 and December 5th, 2019 [Lemoine et al. 2020]. The second catalog (from GFZ institute, GeoForschungsZentrum, Germany) contains 5999 P and 5999 S hand-picked onsets realized by a single expert analyst for events occurring between May 10th, 2018 and February 28th, 2019 [Cesca et al. 2020].
We assess PhaseNet’s performance and accuracy by comparing the arrival times automatically picked on YTMZ continuous data by PhaseNet from the beginning of the seismic crisis with the manually picked arrival times for the events of the two manual catalogs. PhaseNet identifies the correct arrival for 99.6% of P onsets and 98.4% of S onsets from the BRGM catalog, forming a comparative dataset of 1342 common P-picks and 1305 common S-picks. Similarly, PhaseNet identifies 97.7% of P onsets and 98.8% of S onsets from the GFZ catalog, forming a comparative dataset of 5858 common P picks and 5924 common S picks. Figure 2 show the time differences between the 3 catalogs and their statistical distributions, for the P-picks and S-picks, excluding outliers. We estimate that two picks are consistent if the difference in arrival-time between them is less than 0.5 s for P phases and less than 0.8 s for S phases. Outliers above the defined threshold mainly result from event or phase mis-identifications. Among the 1342 P and 1305 S arrivals in common with BRGM, 22 (1.6%) and 102 arrivals (7.8%) are outliers, respectively. Among the 5858 P and 5924 S arrivals in common with GFZ, 277 (4.7%) and 506 arrivals (8.5%) are outliers, respectively. The two manual catalogs have 915 common P arrivals, including 21 (2.3%) outliers; and 904 common S arrivals, including 23 outliers (2.5%). Hence, manually hand-picked datasets show less incoherent picks for S arrivals.
(a) P-pick time differences (left, for each event; right, distribution for all events). From top to bottom: comparison between PhaseNet and BRGM catalogs, comparison between PhaseNet and GFZ catalogs, comparison between GFZ and BRGM catalogs. Outliers are not represented. (b) Same as (a) for S-picks.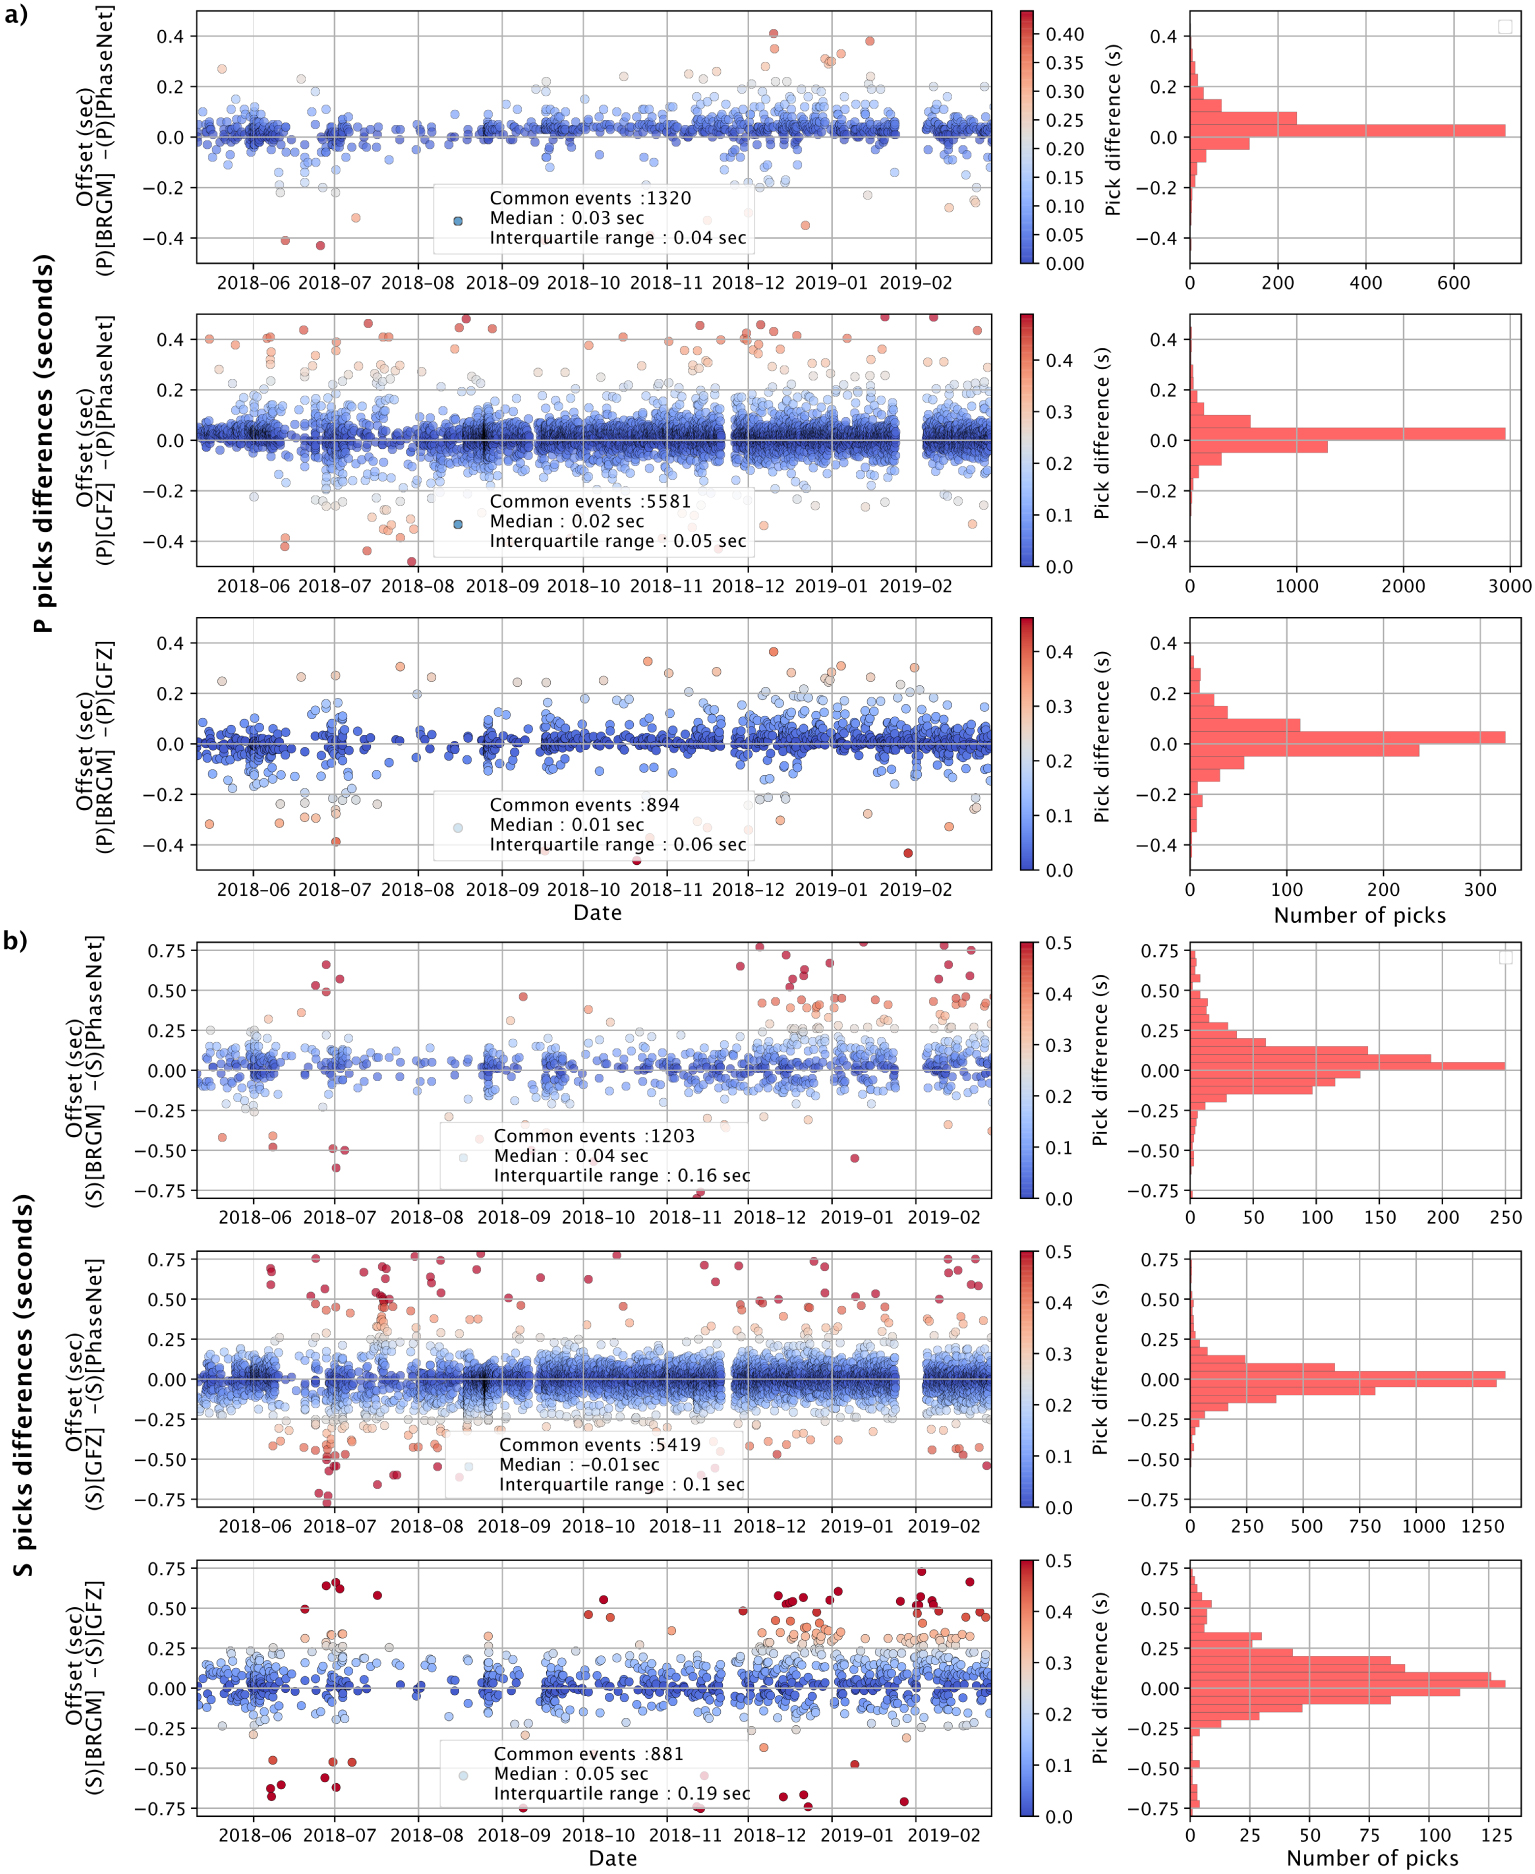
In the following analysis, we only consider the arrival time differences that have not been flagged as outliers according to our criteria. Arrival-time differences between independently hand-picked data display a non-Gaussian distribution of pick time differences. To assess the dispersion of pick time differences, we compare the median value and the interquartile range (i.e, containing the closest 25% of the distribution around the median) as it is more suitable for describing non-Gaussian distributions. For the two manual catalogs, the median of manual P pick time differences is 0.01 s and the interquartile range is 0.06 s (Figure 2a, bottom panel). Similarly, the median and the interquartile range for manual S picks time differences is 0.05 s and 0.19 s, respectively (Figure 2b, bottom panel). These values are close to the few values found in the scientific literature for manual picks [Leonard 2000; Di Stefano et al. 2006]. It supports the common observation that the onset time for P phases are less difficult to measure in a seismic signal than for S phases. In comparison, the median and the interquartile range of the 1320 P pick time differences between the BRGM catalog and PhaseNet is 0.03 s and 0.04 s (Figure 2a, top panel). The median and the interquartile range of 5581 P pick time differences between the GFZ and PhaseNet catalogs is 0.02 s and 0.05 s (Figure 2a, middle panel). These values are close to those obtained between the two manual catalogs even though the statistical population is larger. The precision of PhaseNet thus competes with the precision reached by expert analysts. More precisely, on average, PhaseNet automatic P picks arrive a few milliseconds sooner than the corresponding manual pick, which suggests a greater sensitivity of the neural network to detect an early subtle change in the signal at the true P onset. Regarding S pick time differences, the median and the interquartile range of the 1203 S picks time differences between the BRGM and PhaseNet catalogs is 0.04 s and 0.16 s (Figure 2b, top panel). The median and the interquartile range of 5419 S picks time differences between GFZ and PhaseNet catalogs is 0.01 s and 0.1 s (Figure 2b, middle panel). These values are smaller than the pick time differences observed between the two manual catalogs. PhaseNet S picks are more consistent with the manual picks from GFZ, even though this catalog eventuates smaller magnitudes and presents a larger population. On average, GFZ S picks arrive a few milliseconds sooner than BRGM picks. Similarly, PhaseNet S picks arrive a few milliseconds sooner than BRGM picks but a few milliseconds after GFZ S picks. These results are a representation of the picking precision among the different methods when a phase is correctly identified.
The distribution of arrival differences for S onsets without removing outliers above 0.8 s shows a recurrence of a systematic picking difference at +1.2 s for approximately 44 picks (3%) for the first comparative dataset BRGM-PhaseNet and 188 picks (3%) for the second GFZ-PhaseNet comparative dataset (Supplementary Figure 9). Such a large pick difference suggests a misidentification of the S onset with a precursory seismic arrival. Indeed, the Mayotte seismic sequence occurs within a complex volcanic and underwater environment, which may generate complex seismic waveforms, including P-to-S or a S-to-P phase conversion which are actually expected to arrive approximately one second before the S phase arrival time [Garmany 1989]. Here, PhaseNet automatic S picks are confused a few times with those precursory arrivals but the confusion has also been seen on some S picks in the catalogs picked manually by expert analysts. It is also possible that the manual training data contained misidentified picks, thus generating these erroneous picks. Further neural training could possibly help correct the confusion between a precursory arrival and an S pick that sometimes happens with PhaseNet.
2.3. Event location
An advantage of PhaseNet over other auto-picking algorithms is its ability to pick and identify both P and S waves, when picking methods usually only identify the P-wave arrivals. The addition of S waves allows much more precise locations and event depth constraints, which is crucial for accurate hazard assessment. In Mayotte, stations have a limited azimuthal coverage, which makes earthquake location, and particularly depth resolution, particularly challenging.
Each declared event with a set of P and S picks is located with NonLinLoc [Lomax 2008] using a local 1D velocity model for the east of Mayotte [Lavayssière et al. 2022]. This model was developed with the code VELEST [Kissling et al. 1995] using the 813 most robust earthquake locations (i.e., events with at least 30 phases recorded, azimuthal gap < 180°; horizontal error < 2 km and vertical error < 5 km). Lavayssière et al. [2022] selected this subset from events recorded in Mayotte between February 2019 and May 2020 and located manually [Saurel et al. 2022]. The VELEST inversion used picks made both on the land-stations and on Ocean Bottom Seismometers (OBS) to get the most complete set of data and the most well-constrained locations. The goal of this model was to improve the daily monitoring by having more accurate locations of the events using only the land stations, which are all located to the west of the seismicity.
VELEST simultaneously estimates hypocenters and a best-fit velocity model by minimizing the misfit between the arrival times and model predictions using both P- and S-wave arrival time data. In addition to the velocity model, Lavayssière et al. [2022] estimated station corrections to account for lateral heterogeneity and variations in the velocity structure at shallow depth beneath the stations. The velocity model and station corrections obtained hence represent the best 1D approximation of the 3D subsurface structures of the region, which is essential for accurate earthquake location.
Using the P- and S-arrival times identified by PhaseNet with the new velocity model and station corrections, we locate the events using the nonlinear probabilistic earthquake-location program NonLinLoc [Lomax 2008], which calculates a maximum-likelihood hypocenter that represents a global minimum misfit for the spatial location and the origin time of each event.
We represent in Figure 1a the 50,512 events we detected and located accurately. We only keep the events with a final RMS lower than 0.2 s. As shown by Saurel et al. [2022], the seismicity is located in two clusters east of Mayotte: the proximal cluster with a round shape close to the island and the distal cluster with an elongated shape towards the new volcanic edifice.
With this automatic detection and location process, we were able to provide a more complete image of the seismicity, particularly for the distal cluster. Indeed, the catalog of seismicity built through the monitoring work of RENASS (Réseau national de surveillance sismique) and REVOSIMA and made available by RENASS (http://renass.unistra.fr) contains 6508 events for the same period, about 8 times less compared to our new catalog. Furthermore, this method also allowed us to process two different types of seismicity: VT and LP earthquakes.
3. Comparative analysis between the VT and LP events
Both VT and LP events are recorded by the seismic stations installed in Mayotte. In this section we detail how we separate them from each other and compare their behavior.
3.1. Event separation
VT events are commonly observed on volcanoes. These events have a broad frequency range, from 1 Hz to 40 Hz. They are called Volcano-Tectonic earthquakes because their signature is difficult to distinguish from regular tectonic earthquakes as they are associated with shear failure driven by magmatic processes.
Most of the seismicity recorded daily by the stations installed in Mayotte are VT earthquakes. However, LP events are also recorded.
Different definitions have been proposed for LP events [Chouet and Matoza 2013]. They range from long-period monochromatic signals to signals similar to VT events but with lower frequency content. The events we refer to as LP in Mayotte are similar to VT events, with distinct P- and S-waves, but they have a lower and narrower frequency band. Before our frequency analysis, we filter each signal in a 0.4–45 Hz frequency band, we remove the instrumental response and convert to displacement. Figure 3 shows the resulting signals and spectra of a VT and an LP event recorded by the three component stations on May 21st, 2019, and March 11th, 2019, respectively. The signals (Figure 3a,c) show clearly the difference between the two types of events recorded in Mayotte. The P wave of the VT event has a clear and impulsive onset, while the emergent arrival is very difficult to discern for the LP earthquake. The signal of the S wave can be identified on the horizontal components for both the VT and LP events with a lower dominant frequency for the LP event. Similarly, the spectra shows that the VT event has a broader frequency range than the LP event.
Signals (a,c) and spectra (b,d) of a VT earthquake (on May 21, 2019) (a,b) and a LP earthquake (on March 11, 2019) (c,d) recorded by the 3-component stations deployed on Mayotte.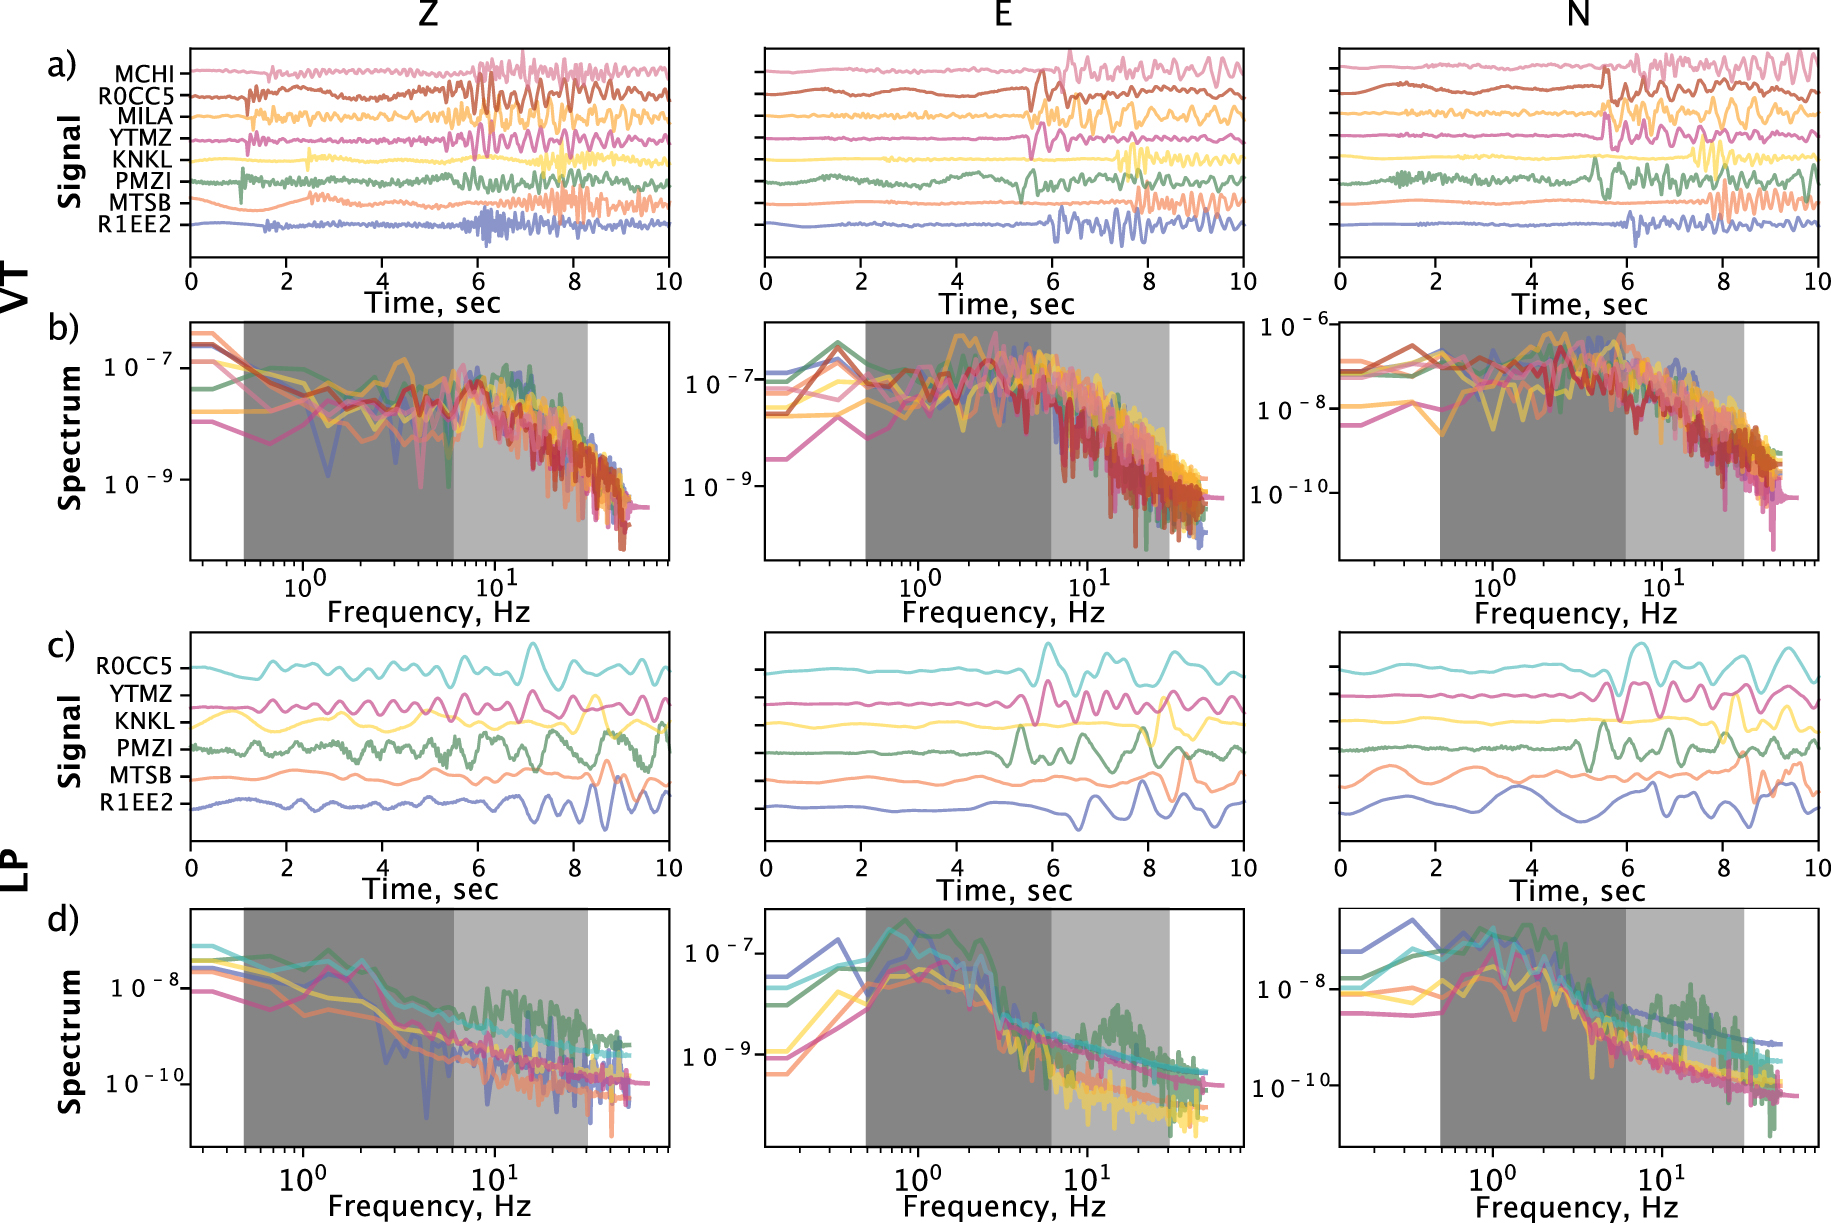
We use this frequency content difference to discriminate between VT and LP events. Our approach is similar to the Frequency Index (FI) proposed by Buurman and West [2010] and Matoza et al. [2014], however, we process the P- and S-waves separately.
For each event, we compute the amplitude ratio of the mean spectrum in two frequency bands (a narrow one at 0.5–6 Hz and a broad one at 0.5–30 Hz) for both the P wave and the S wave on each station. The LP events have a dominant frequency lower than 6 Hz. If the 0.5–6 Hz spectra is strong compared to the broader 0.5–30 Hz spectra, the ratio between the two is large and indicates an LP earthquake. On the other hand, if the event has a broad frequency band, the 0.5–6 Hz over 0.5–30 Hz spectra ratio is small, indicating a VT earthquake. We compute the ratios for all events, using the vertical component for the P wave and an average of the horizontal components for the S wave. Those ratios are then averaged over all the stations for each event to limit the potential bias of event-to-station path effect [discussed in Matoza et al. 2014].
Figure 4 shows the resulting amplitude ratio distribution for all the events already manually classified. To correctly separate the VT earthquakes from the LP earthquakes, we use the identifications made by the analysts from Observatoire Volcanologique du Piton de la Fournaise (OVPF), one of the Institut de Physique du Globe de Paris (IPGP) French overseas volcano observatories. The earthquakes recorded in Mayotte are identified daily by the analysts of OVPF since February 2020. The color of the dot in Figure 4 shows if the event was manually identified as a VT earthquake (green) or an LP earthquake (yellow). Unsurprisingly, the VT and LP earthquakes separate in two distinct zones. Events of high P and S spectral amplitude ratios are usually LP earthquakes because the high ratios mean that the dominant frequency band is shorter and lower (the 0.5–6 Hz amplitude spectrum is high compared to the broad 0.5–30 Hz amplitude spectrum). From these identifications we separate the spectral ratio diagram in two areas for VT and LP events (green and yellow color respectively in Figure 4). The events are then automatically identified as VT or LP earthquakes depending on where their P and S spectra land on the ratio diagram. Figure 5 represents the vertical component of station KNKL for a few VT and LP earthquakes that have been categorized through our process.
Ratios between the 0.5–6 Hz spectrum and the 0.5–30 Hz spectrum averaged over the different 3-component stations for each event. The color of the dot shows how the event was manually classified by the OVPF analysts. The colored domains represent the resulting VT/LP separation criteria chosen. The black dots represent regional events.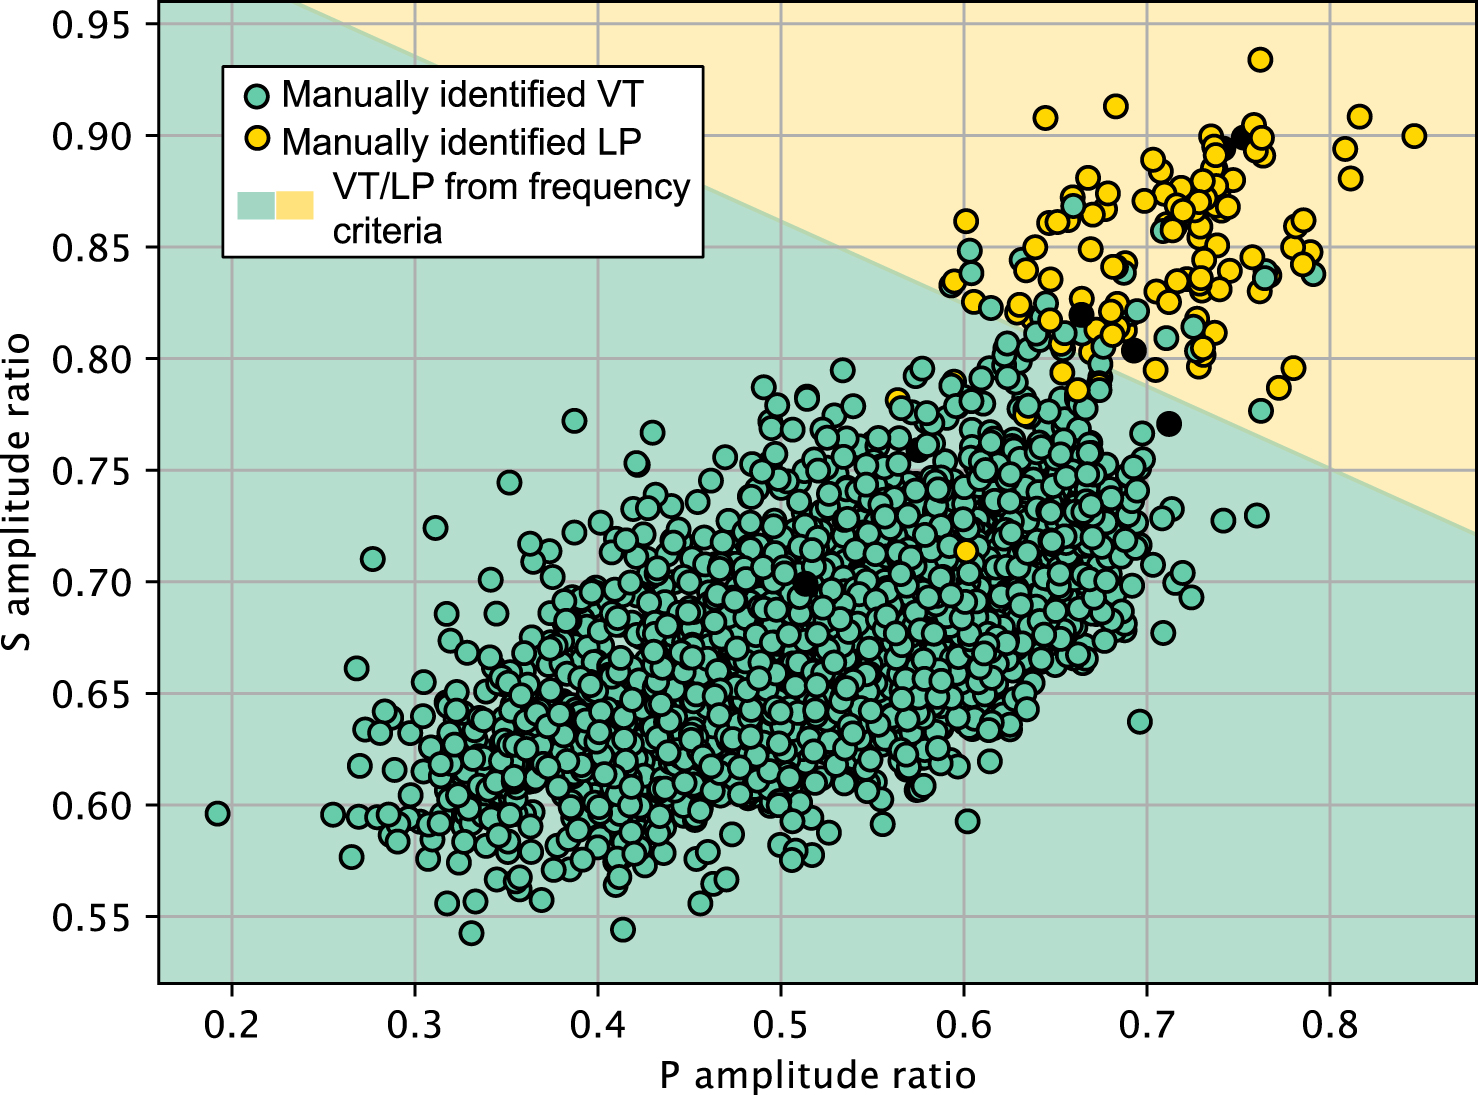
Examples of (a) VT and (b) LP earthquakes early March 2019 after event separation.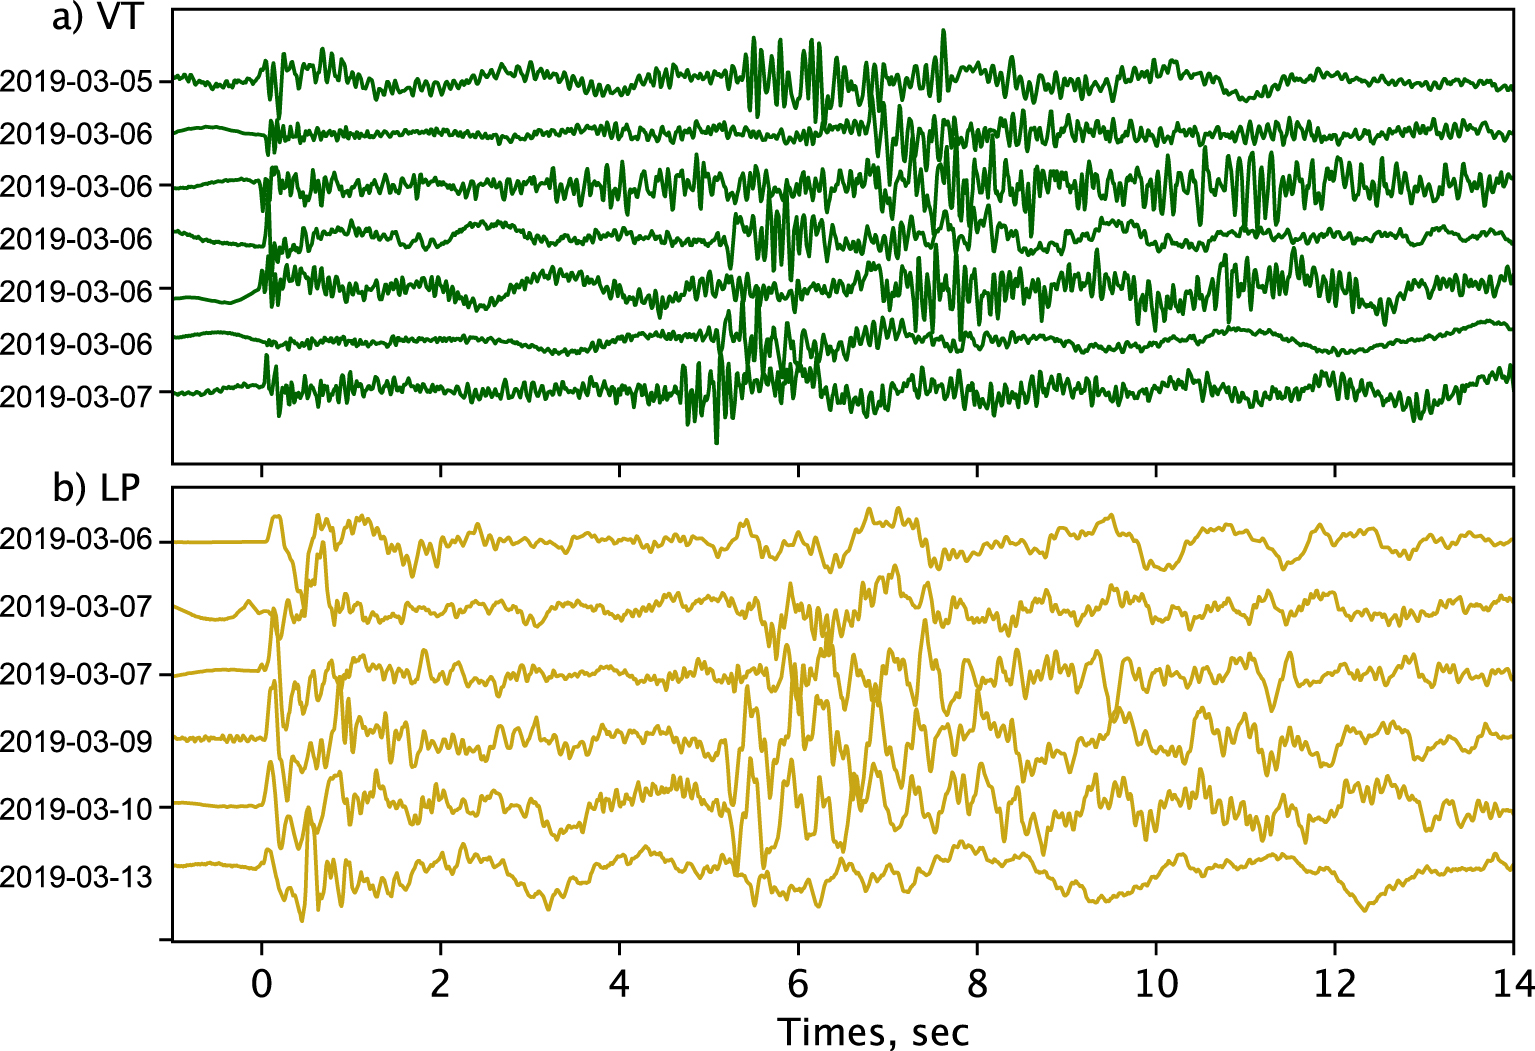
3.2. VT versus LP location and time evolution differences
After identification of both VT and LP earthquakes we compare their spatial and temporal behavior. For clarity we represent the events’ locations as event count for both VT (in red hues) and LP (with yellow and blue contours) events on Figure 6. As observed in previous publications [e.g. Lemoine et al. 2020; Saurel et al. 2022] and already mentioned in Section 2.3, the seismicity is spread over two clusters. The proximal cluster is closest to the island of Mayotte (about 10 km east) and has a circular shape. Its depth range extends from 20 to 45 km depth. The distal cluster is farther east and is aligned along a N130° axis toward the new volcanic edifice (represented with the red triangle on Figure 6).
Event count of VT (red colors) and LP (yellow and blue contours) earthquakes. The orange triangle represents the location of the new volcano.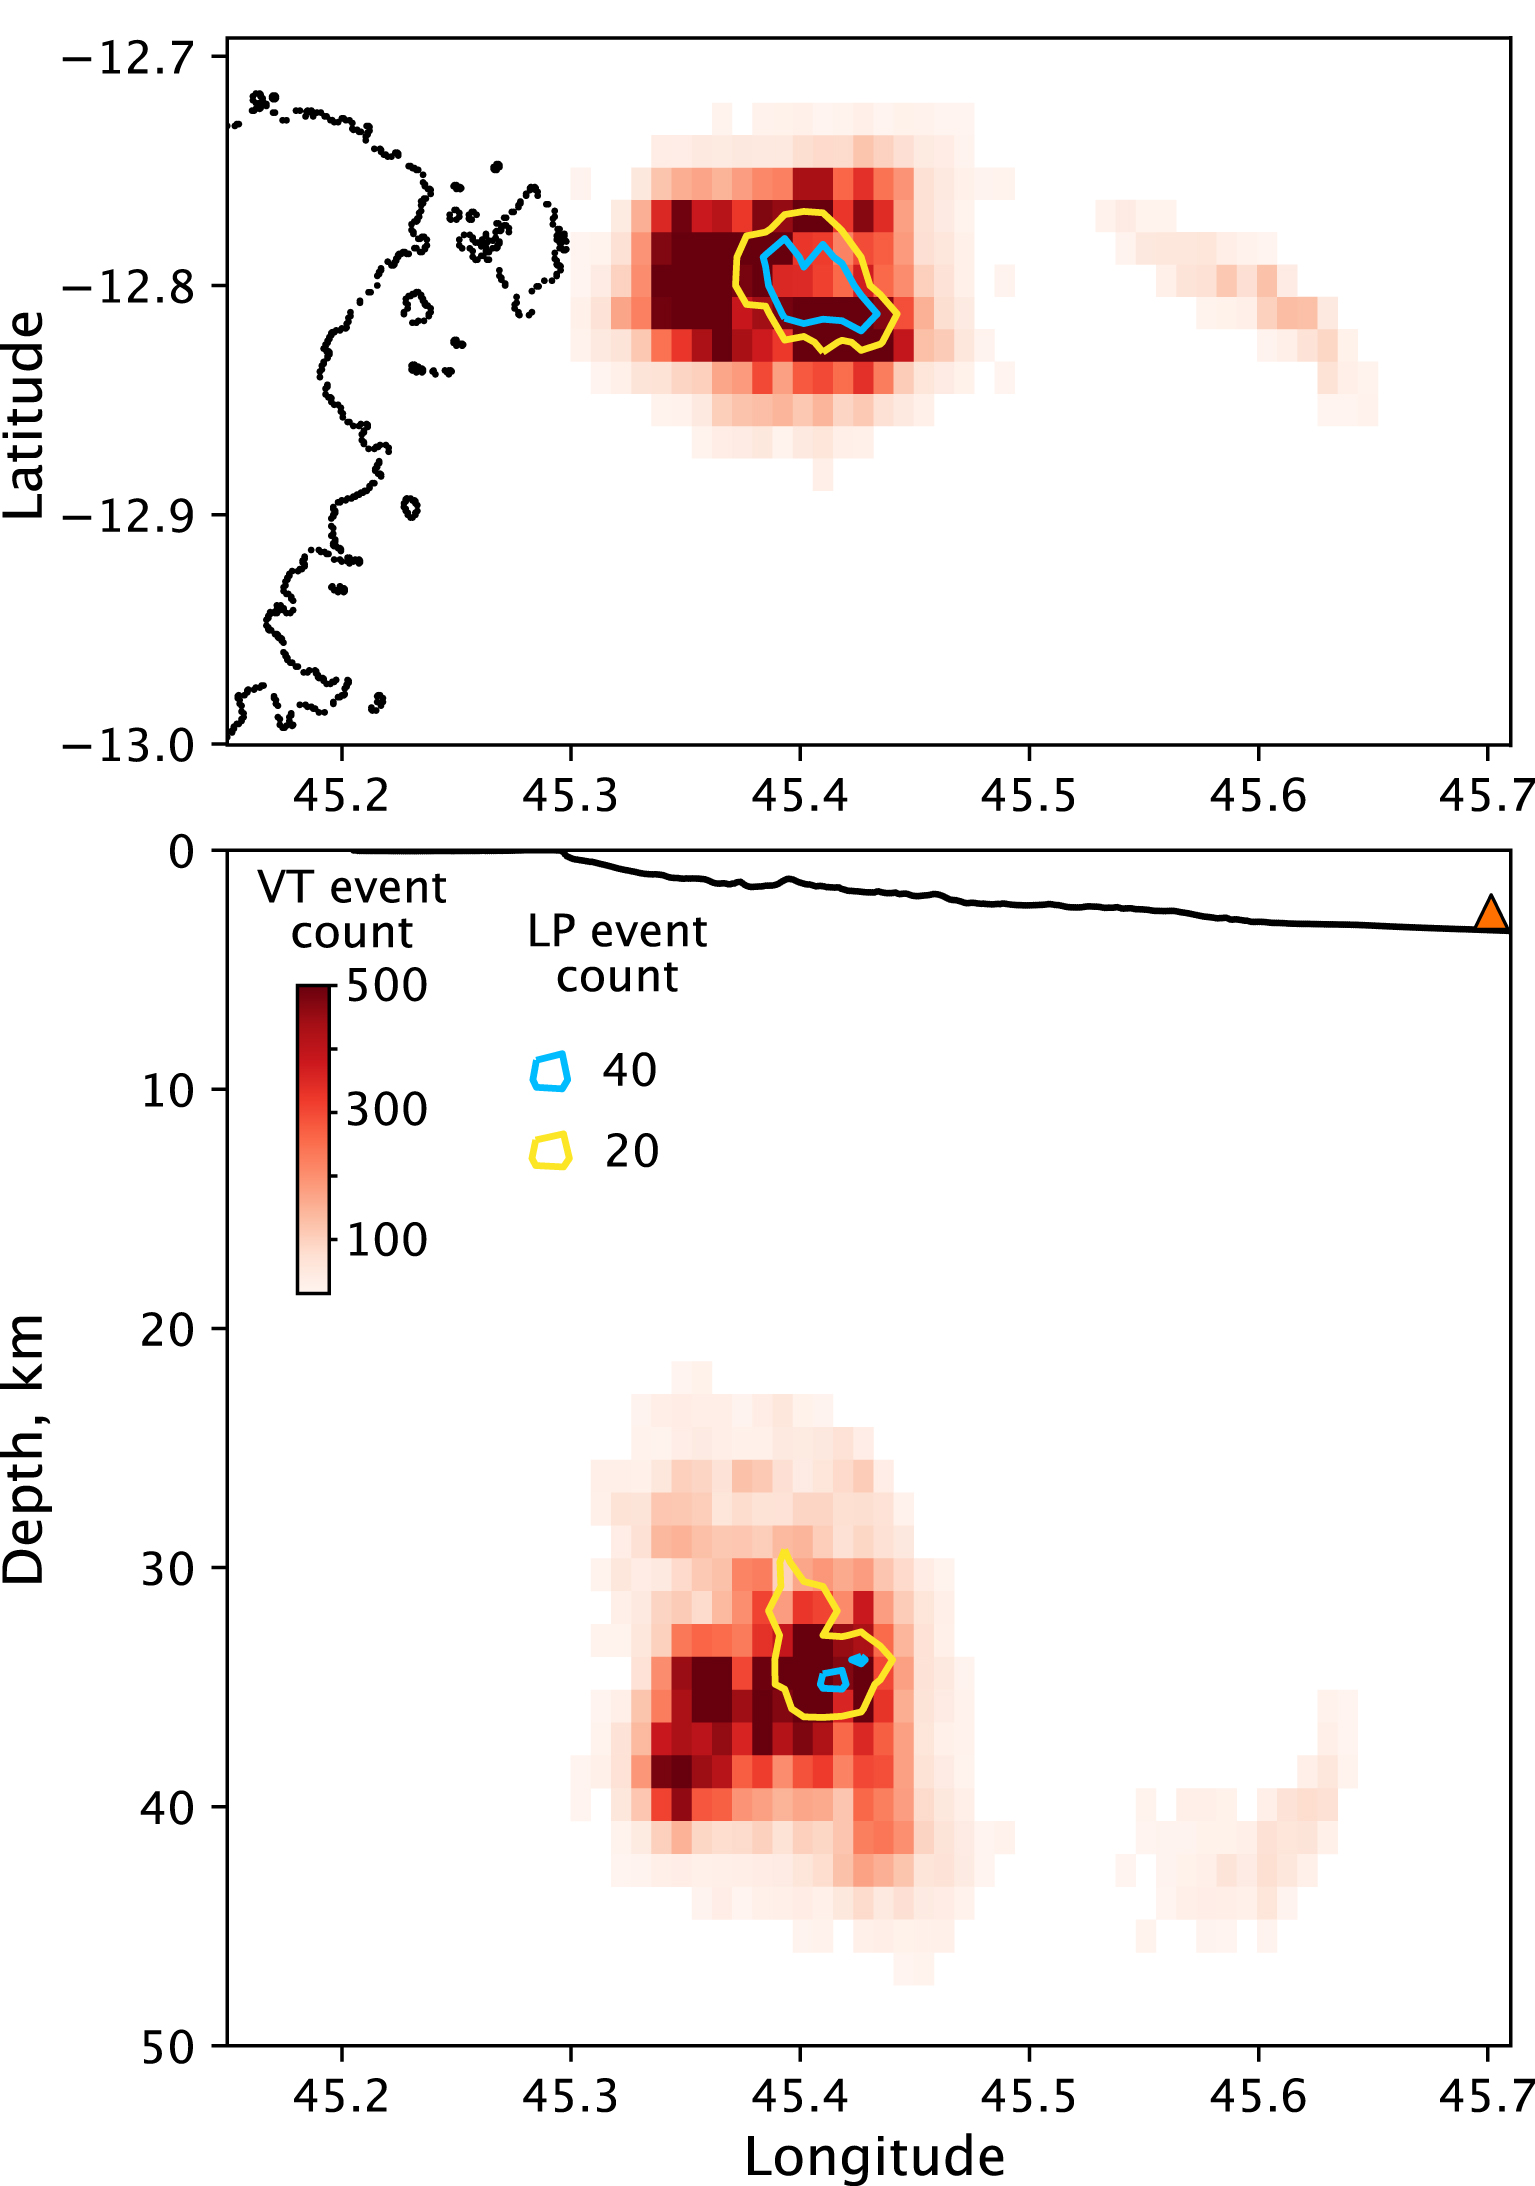
The VT earthquakes are spread over the two clusters. We do not explore in this paper the short scale-length spatio-temporal variability of the VT seismicity, which will be analysed in a later study. Remarkably, the LP earthquakes are only observed in the center of the proximal cluster, over a 25–40 km depth range (with most events between 30 and 37 km depths as shown in Figure 6). In this central area, we can see in map view that the density of VT events is lower than in the rest of the proximal cluster, a region which we later refer to as the proximal cluster VT gap. This is not observable in the depth view because all events and thus all the azimuths are shown, the south and north sides masking the central part. We can also note that, in map view, the VT cluster does not appear as a complete ring as shown by previous studies [e.g. Lavayssière et al. 2022]. This is because we plot the event count and most VT events are located in the western part of the proximal cluster. There are thus fewer VT events in its eastern part in comparison. Figure 1a does show clearly the circular shape.
Our catalog is dominated by VT earthquakes with 48,387 events compared to the 2125 LP events, as the histogram in Figure 7a shows. For this reason, before the development of this automatic processing, the LP earthquakes in Mayotte had not been studied and had only been systematically identified as LP through the daily manual screening of continuous data at OVPF, which started in March 2020. Figure 7a shows that the number of VT earthquakes decreased slowly after a maximum in April, 2019 with some variations. The number of LP events is very small compared to the number of VT events and no clear time evolution is apparent. To observe the temporal evolution of event occurrence, we represent the normalized cumulative rate of both the VT and LP earthquakes (Figure 7b). We estimate the mean seismicity rate over a ten-event sliding window by computing the time difference between the 10th and the 1st event. We then calculate the cumulate of this result. We normalize the results to compare the time evolution of the two types of events. While this representation may be a little unnatural, it clearly shows that the temporal behavior of the VT and LP earthquakes is very different. The VT activity is continuous with a significant slowdown since April 2019, while the LP earthquakes occur episodically in successive swarms. Several LP events occur in a short while (usually less than one hour), followed by a period of sparse activity. Figure 7 also shows that, while the VT activity dominates the LP activity, the latter’s activity does not seem to diminish compared to the former.
(a) 10-days histograms and (b) normalized cumulative rate of the number of VT and LP earthquakes (green and yellow respectively) from March 2019 to March 2021.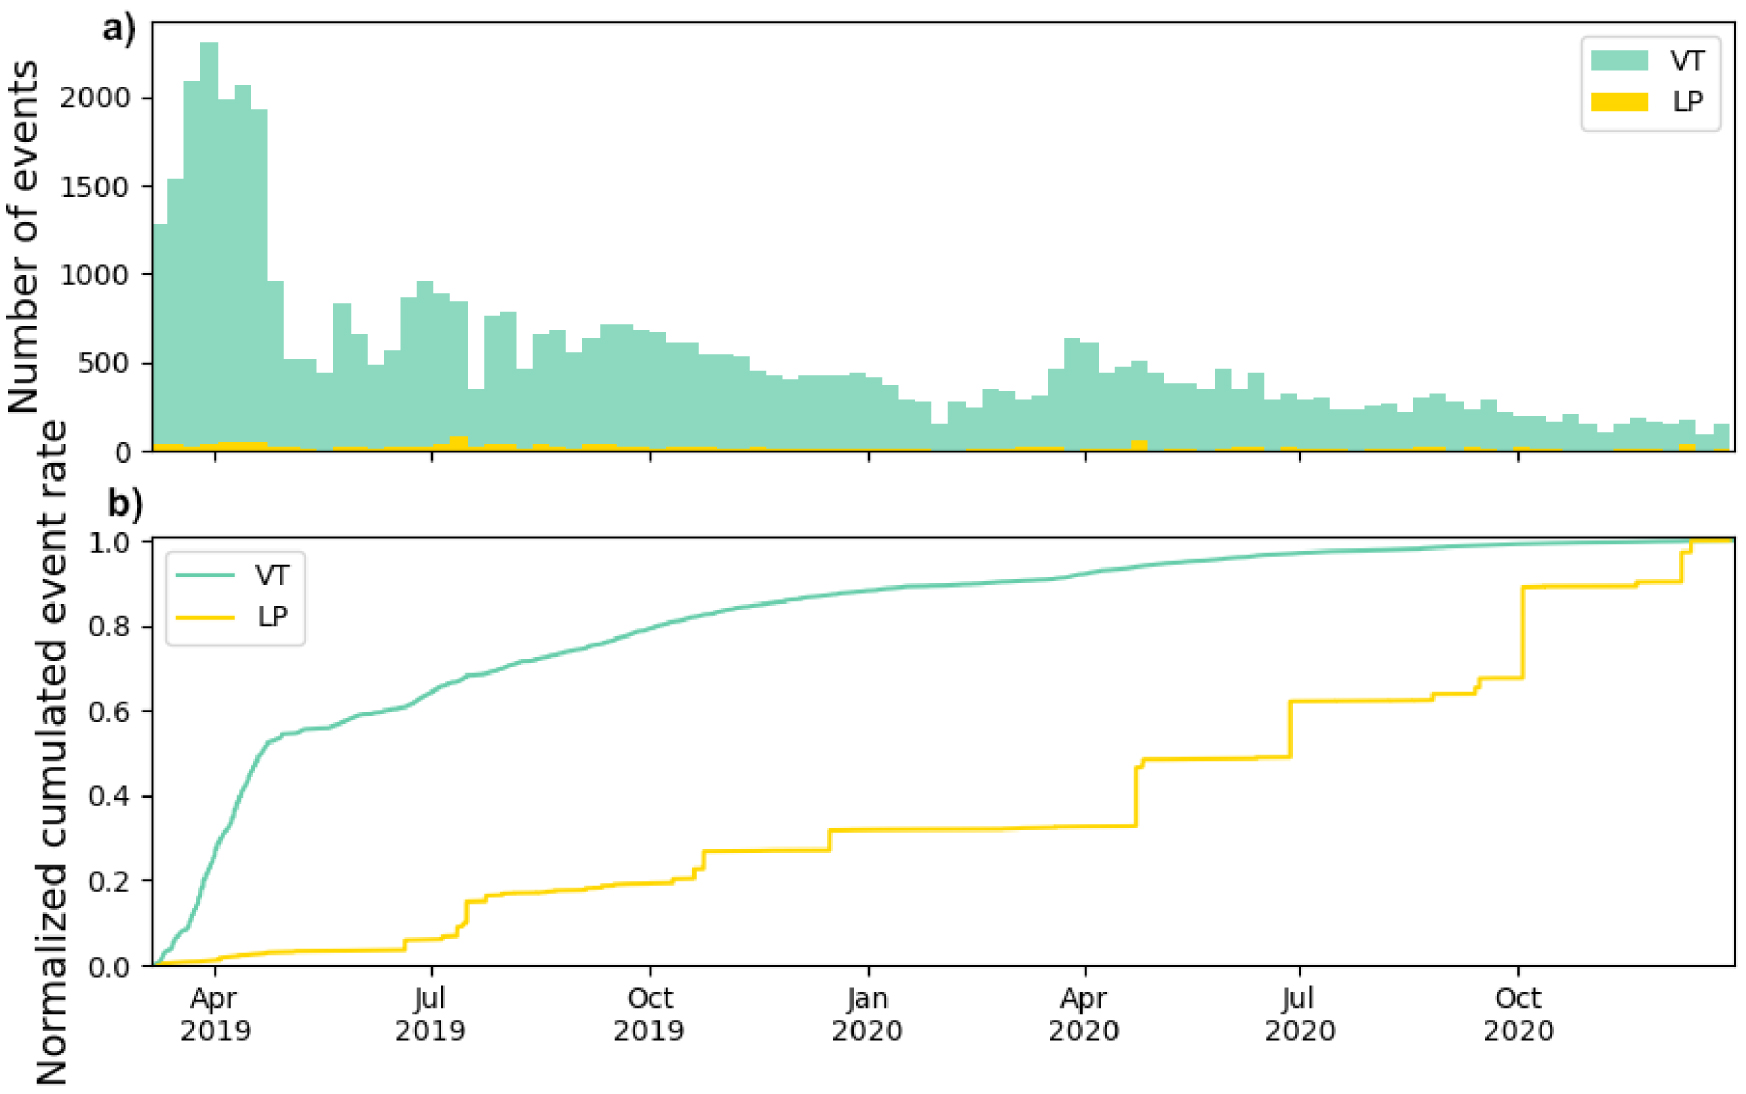
4. Discussion
Using the ability of PhaseNet to pick and identify P- and S-phases we detected over 50,000 earthquakes and separate them into two categories. Indeed, while the seismicity in Mayotte is dominated by VT earthquakes, there is also a substantial population of LP events.
We separated events into these two categories to compare their behavior. The events we define as LP earthquakes look similar to VT earthquakes, but with a lower dominant frequency. In Mayotte, the VT and LP earthquakes also show distinct spatial and temporal features. VT earthquakes are spread over both zones of seismicity (proximal and distal clusters). The VT seismicity of the distal cluster is the first seismicity that was observed in 2018 [Lemoine et al. 2020; Cesca et al. 2020; Feuillet et al. 2021]. It was associated by the authors to magma migration through a dyke feeding the eruption on the seafloor. With its N130 orientation, it is also aligned with a pre-existing ridge with numerous volcanic cones, indicating that faults could have been reactivated by the eruption. This orientation can also be found in other regional geographic features on the seafloor [REVOSIMA-IPGP 2021] and the VT seismicity in the distal cluster can also be linked to the regional tectonic context [Feuillet et al. 2021; Famin et al. 2020].
The proximal cluster is more complex, spread over a broader area, and appears less directly linked to the new volcanic edifice. This seismicity has been linked to the deflation of the main magmatic reservoir [Cesca et al. 2020; Lemoine et al. 2020; Saurel et al. 2022; Lavayssière et al. 2022]. This was deduced because its activity started after the deflation did [modelled from GNSS data, Lemoine et al. 2020]. Moreover, the structure of the seismicity in depth is consistent with ring faults, further supporting the theory of a reservoir below the seismicity. A main reservoir around 40 km depth was suggested by geobarometry analyses of emitted lavas [Berthod et al. 2021] and follows deformation models [Mittal et al. 2022; REVOSIMA-IPGP 2021]. The drainage of the main reservoir could have generated shear failure or reactivated faults. Indeed, numerous volcanic cones and edifices can be observed on the seafloor above the cluster [REVOSIMA-IPGP 2021], suggesting a large and complex pre-existing system.
Up to now, seismicity observations of the proximal cluster of Mayotte have been focused on the VT seismicity. The LP seismicity is restricted to the proximal cluster and seems concentrated towards the center east of the cluster, with depths ranging from 25 km to 40 km, and thus directly above the depth suggested by geobarometry and deformation models. This corresponds to a VT seismicity gap in the center of the proximal cluster, also highlighted by previous studies [Saurel et al. 2022; Lavayssière et al. 2022]. A recent tomography analysis by Foix et al. [2021] suggested the presence in this area of a magma chamber between 30 and 50 km depth and a shallower zone of mush and partial melt between 20 and 30 km depth. This is supported by the conceptual model developed by Mittal et al. [2022] which suggests the presence of a porous mush next to the reservoir to explain the deformation estimated through GNSS data. Similarly, Lavayssière et al. [2022] has suggested that the gaps in VT activity could be associated with a magma storage zone.
These observations suggest that the VT seismicity might surround zones of storage [Lavayssière et al. 2022] while the LP seismicity seems to be located inside these same zones. Clarke et al. [2021] showed that VT sources can appear as LP events when the seismic propagation path passes through highly attenuating areas, such as gas-saturated rocks. They confirmed their laboratory observations using Whakaari volcano shallow-event recordings. While a scaling needs to be done in the Mayotte context, this hypothesis could explain the LP seismicity location in a VT gap as mentioned above. Both LP and VT seismicity could share similar mechanisms, but the LP seismic waves might travel through a few kilometer-wide gas-saturated area that narrow and lower their waveform spectral content. The similarity of frequency content of LP earthquakes inside a swarm, even with their varying depths, also agrees with this idea. These events could be closer to VT earthquakes in mechanism but with a different propagation that lowers their frequency. Studies are on-going to characterize time evolution and links between VT, LP and VLP types of seismicity.
We represent the depth of the LP earthquakes through time in Figure 8 to focus on their evolution. Figure 8a represents all LP earthquakes and shows that the depths of these events are spread between depths ranging from 25 to 40 km. There is no clear long-term trend of depth change with time. We focus on the main swarms to observe the short-term evolution of the events during a swarm. We flag an LP as part of a swarm when at least 5 LP events occur within one hour around it. The resulting swarms are represented on Figure 8b. For each swarm, we estimate the depth migration speed of the LP earthquakes using a linear regression. We represent in Figure 8c the estimated depth migration speed for each swarm. The histogram shows that this speed is mostly negative, implying that, during a swarm, the LP earthquakes occur at increasing depth with time. During a swarm, the LP earthquakes occur from their shallowest location (around 25 km depth) to their deepest location (around 40 km) at an average speed (removing outliers) of 19.2 km⋅h−1 or 5.3 m⋅s−1. With this average speed, the migration doesn’t seem compatible with a migrating fluid (estimated for example at a maximum of 0.3 m⋅s−1 on Piton de la Fournaise volcano by Duputel et al. [2019]). Those two observations suggests that these events are not linked to an ascension of fluids. However, it coincides with the ideas developed in the previous paragraph, and these events could be associated with a propagation through a gas-saturated conduit. Still, their downward propagation remains unexplained.
(a) All LP earthquakes depths with regards to time, (b) LP earthquakes depths of the main swarms with regards to time, (c) Depth migration velocity estimate during the main LP swarms identified in (b), and (d) Representation in depth of the main LP swarms. Each index also represents one hour. The dashed black lines represent the depth evolution linear regression for each swarm in km⋅h−1.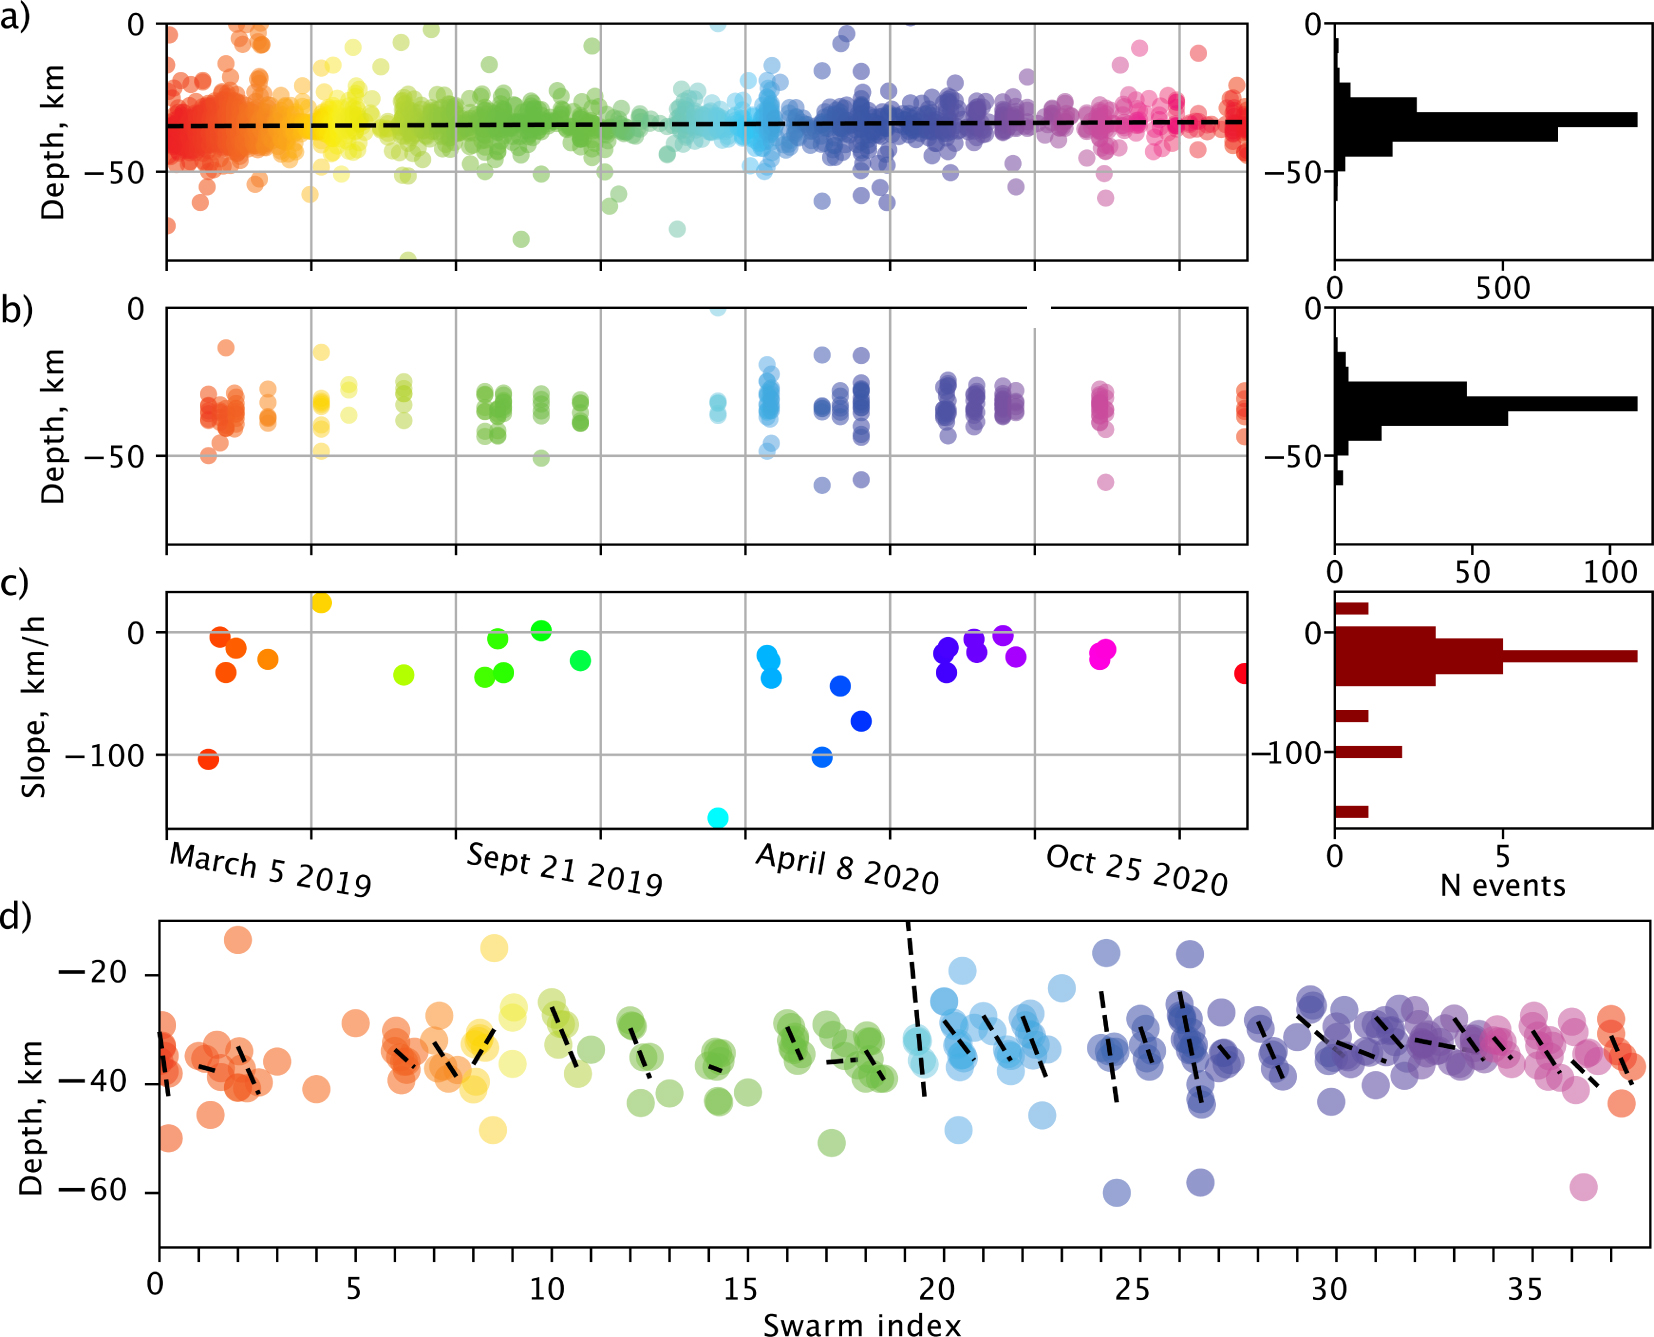
Since the LP earthquakes occur at a different location than the VT earthquakes, it means that their origin could be different. The LP swarms often coincide temporally with very long period events (VLP) which have been observed along with the rest of the activity and was one of the indicators that the activity had a volcanic origin [Laurent et al. 2020; REVOSIMA-IPGP 2021]. This implies that their origins could be linked. Although the origin of the LP events could be linked to shear failure generating waves propagating through a gas saturated medium, their trigger seems to have a volcanic origin. A thorough analysis of the links between the different signals will be the subject of another study.
Our interpretation of the LP seismicity is still limited by the lack of focal mechanism solutions that could help distinguish physical processes [Chouet and Matoza 2013]. The land stations are all distributed to the west of the seismicity, which makes it difficult to obtain reliable focal mechanisms. Broadband OBS surrounding the seismicity in the east would certainly help improve the event location’s precision to better understand the process behind this LP seismicity. They could also allow us to perform reliable focal mechanisms to help determine whereas those LP events are volumetric sources or VT sources travelling through a highly attenuating area.
5. Conclusions
The use of neural-network-based automatic picking permitted us to precisely re-analyze the seismicity linked to the volcanic system in Mayotte from March 2019 to March 2021. We detected and accurately located 50,512 earthquakes which is close to 8 times more than the 6508 earthquakes in the currently available catalog (RENASS/REVOSIMA). This automatic picking algorithm has been converted into an operational automatic process to monitor the seismic activity in Mayotte since March 2021 [Retailleau et al. 2022]. We separated two types of events from their frequency content as VT and LP earthquakes. These two types of events show a different behavior through time and space. While VT earthquakes are spread over the two clusters observed throughout the crisis, LP earthquakes are restricted to the center of the VT proximal cluster. Moreover, VT earthquakes appear to occur continuously, decaying with time, while LP earthquakes appear to happen episodically in swarms and are on-going. Contrary to VT earthquakes, LP earthquakes may propagate through a fluid area that modified their waveforms and lowered their frequency content. Alternatively, their different location could imply a different source mechanism. In any case, their apparent link to VLP events seems to imply a volcanic trigger, which still needs to be explored.
Conflicts of interest
The authors declare no competing financial interest.
Dedication
The manuscript was written through contributions of all authors. All authors have given approval to the final version of the manuscript.
Acknowledgments
Since June 2019, Mayotte eruption monitoring is funded by le Ministère de l’Enseignement Supérieur, de la Recherche et de l’Innovation (MESRI), le Ministère de la Transition Ecologique (MTE) and le Ministère des Outremers (MOM) with the support of le Ministère de l’Intérieur (MI) and le Ministère des Armées (MINARM) through the REVOSIMA (Réseau de surveillance volcanologique et sismologique de Mayotte; [Mayotte Volcanological And Seismological Monitoring Network (REVOSIMA) et al. 2021]). AL was partly funded by the European Union’s Horizon 2020 research and innovation program under Eurovolc projet (grant agreement No 731070). The authors thank the reviewer Robin Matoza and the editor Jérôme van der Woerd for their reviews which helped improve the manuscript.
OVPF Team: Aline Peltier, Patrice Boissier, Valérie Ferrazzini, Christophe Brunet, Frédéric Lauret, Arnaud Lemarchand, Nicolas Desfete, Kevin Canjamalé, Cyprien Griot, Lise Retailleau, Philippe Catherine, Philippe Kowalski, Andrea di Muro, Fabrice Fontaine, Luciano Garavaglia, Zacharie Duputel, Frédérick Pesqueira.
RA network data available from Résif datacenter [RESIF 1995]. ED.MCHI station data available at EduSismo. AM network data are available from IRIS and Raspberry Shake SA datacenters [Raspberry Shake 2016]. 1T and QM data [Mayotte Volcanological And Seismological Monitoring Network (REVOSIMA) et al. 2021] are available upon request.
The catalog of LP earthquakes locations is available on the journal’s website.