


 CC-BY 4.0
1. Introduction
Most of the Earth’s volcanic activity occurs underwater, particularly along mid-ocean ridges, building the oceanic crust [Crisp 1984]. To constrain the setting and overall structure of submarine volcanic systems, detailed bathymetric and optical surveys of the seafloor are needed for comprehensive geological mapping. These combined data are crucial to better understand the distribution, geometry and nature of volcanic products, and to extrapolate local seafloor observations to more general submarine volcanic processes. Systematic seafloor mapping also provides a baseline for temporal studies, while providing a context for in-situ measurements. Such comprehensive studies [e.g., Dziak et al. 2001, Embley et al. 2010, Wessel et al. 2010, Nomikou et al. 2013, Anderson et al. 2017] can constrain the history and time evolution of submarine volcanism, document the processes leading to the formation of the present-day seafloor volcanic morphologies and in some cases, allow us to envision potential scenarios of future volcanic activity. To date, only a few active submarine volcanoes have been monitored, either along the axis of mid-ocean ridges [e.g., Axial Seamount, Clague et al. 2017, Chadwick et al. 2022], or at seamounts away from mid-ocean ridges [e.g., West Mata, Chadwick et al. 2019, Lō‘ihi, Clague et al. 2019; Havre, Carey et al. 2018, Ikegami et al. 2018; NW Rota-1, Embley et al. 2006, Chadwick et al. 2008, Schnur et al. 2017].
Since May 2018, Mayotte Island (Comoros archipelago) has been undergoing a major seismo-volcanic crisis [Cesca et al. 2020, Lemoine et al. 2020] that has led to the formation of a major new deep sea (∼2500 m) volcanic edifice, Fani Maoré, about 50 km east of the island [Deplus et al. 2019, Berthod et al. 2021a, Feuillet et al. 2021, Masquelet et al. 2022]. This eruption is the largest submarine event ever documented. While earlier studies have focused on the understanding of the geodynamic setting of the Comoros archipelago [Nougier et al. 1986, Famin et al. 2020, Bertil et al. 2021, Tzevahirtzian et al. 2021, Thinon et al. 2022], the source of volcanic activity in the area is still poorly understood [Bachèlery et al. 2016, Famin et al. 2020, Quidelleur et al. 2022]. The present seismo-volcanic crisis thus provides a unique opportunity to better understand the interactions between different processes on the submarine flanks of Mayotte (e.g., volcanism, tectonic activity, deep seismic activity, hydrothermal activity), and to improve our knowledge of deep submarine volcanism in general. All these phenomena impact the local ecosystems, while representing a potential risk for the human population on the island. As a result, the Mayotte Volcanological and Seismological Monitoring Network [REVOSIMA 2019–2022] consortium was created and a series of oceanographic cruises have been carried out since 2019, to both monitor and study the area, providing a wide range of datasets (e.g., bathymetry, imagery, petrology, seismicity, geochemistry, biology, etc.), and involving numerous multidisciplinary research groups.
Here we do not focus on the new post-2018 Fani Maoré volcanic edifice, but we present a multi-spatial-scale geomorphological study of the Horseshoe area, located 10 km east of Mayotte Island, on its eastern upper submarine slope. This area shows complex and diverse volcanic morphologies, active fluid outflow, and lies directly above the main cluster of seismicity, which is located at a depth of more than 30 km [Lavayssière et al. 2022, Saurel et al. 2022].
Specifically, we analyze very high-resolution bathymetry, acquired with Autonomous Underwater Vehicles (AUVs named IdefX and AsterX), to document the different volcanic features and morphologies in this complex Horseshoe area. The analysis of in-situ seafloor imagery from a deep-towed camera system (Scampi) coupled to that of the AUV bathymetry provides ground-truth for geological interpretations. Hence, using a multiscale approach from regional maps down to outcrop-scale visual observations we interpret (a) the morphological nature and architecture of volcanic structures, (b) the eruptive modes at several spatial and temporal scales and their links to other processes, and (c) possible links between the present-day morphologies observed in the area and the recent Fani Maoré eruption and associated phenomena.
2. Geological setting
The Comoros archipelago is located north of the Mozambique Channel (Indian Ocean), between the Mozambique and Madagascar (Figure 1a). The archipelago is composed of four volcanic islands (Grande Comore, Mohéli, Anjouan and Mayotte) aligned in an overall east–west (E–W) trend: [Daniel et al. 1972, Tzevahirtzian et al. 2021]. Grande Comore is the most frequently active volcanic island with the Karthala volcano [Bachèlery et al. 2016]. This region was affected by an episode of NW–SE rifting through the Permo-Triassic which was associated with the fragmentation of Gondwana [∼170–185 Ma, Eagles and König 2008, Gaina et al. 2015, Leinweber and Jokat 2012, Mueller and Jokat 2019, Senkans et al. 2019], opening the Mozambique, Comores and Somali basins, during which Madagascar drifted southward [Mahanjane 2012, Davis et al. 2016]. The nature of the lithosphere (continental vs. oceanic) underlying the Comoros archipelago continues to be debated and has been diversely interpreted over the years [Nougier et al. 1986, Michon 2016, Masquelet et al. 2022, Rolandone et al. 2022]. The origin of volcanism in the area is also poorly understood, and proposed hypotheses include: (a) hot spot activity [Emerick and Duncan 1982], (b) lithospheric fracture zones facilitating melt transport [Nougier et al. 1986], or (c) coupling of both processes, with the interaction of extensional tectonics and deeper astenospheric processes [e.g., Courgeon et al. 2018, Deville et al. 2018, Famin et al. 2020, Franke et al. 2015, Kusky et al. 2010, Michon 2016, O’Connor et al. 2019, Wiles et al. 2020]. Several authors [e.g. Kusky et al. 2010, Stamps et al. 2018, Famin et al. 2020, Lemoine et al. 2020, Thinon et al. 2022] suggest the presence of a diffuse and immature Lwandle-Somalia plate boundary along the Comoros archipelago. Feuillet et al. [2021], based on data recently acquired offshore Mayotte, propose that the present-day morphology of the archipelago results from an E–W transtensional boundary that transfers the strain between the offshore branches of the East-African rift and the grabens of Madagascar.
(A) Simplified map of the Comoros archipelago showing the location of Mayotte Island. (B) Map of the East-Mayotte Volcanic Chain (EMVC) modified from Feuillet et al. [2021] showing the Horseshoe, the Crown—a structure likely associated with a former caldera collapse (red dashed line), and the New post-2018 Volcanic Edifice (Fani Maoré). The central part of Fani Maoré is in red and the radial ridges and associated lava flows are in orange (outlines were defined by Feuillet et al. [2021] based on depth changes between 2014 and 2019). Purple patches represent pre-2018 volcanic features (mainly cones). Pink patches represent pre-2018 lava flows and elongated features. Yellow patches represent the upper submarine slope’s highly reflective pre-2018 lava flows (see Figure 2).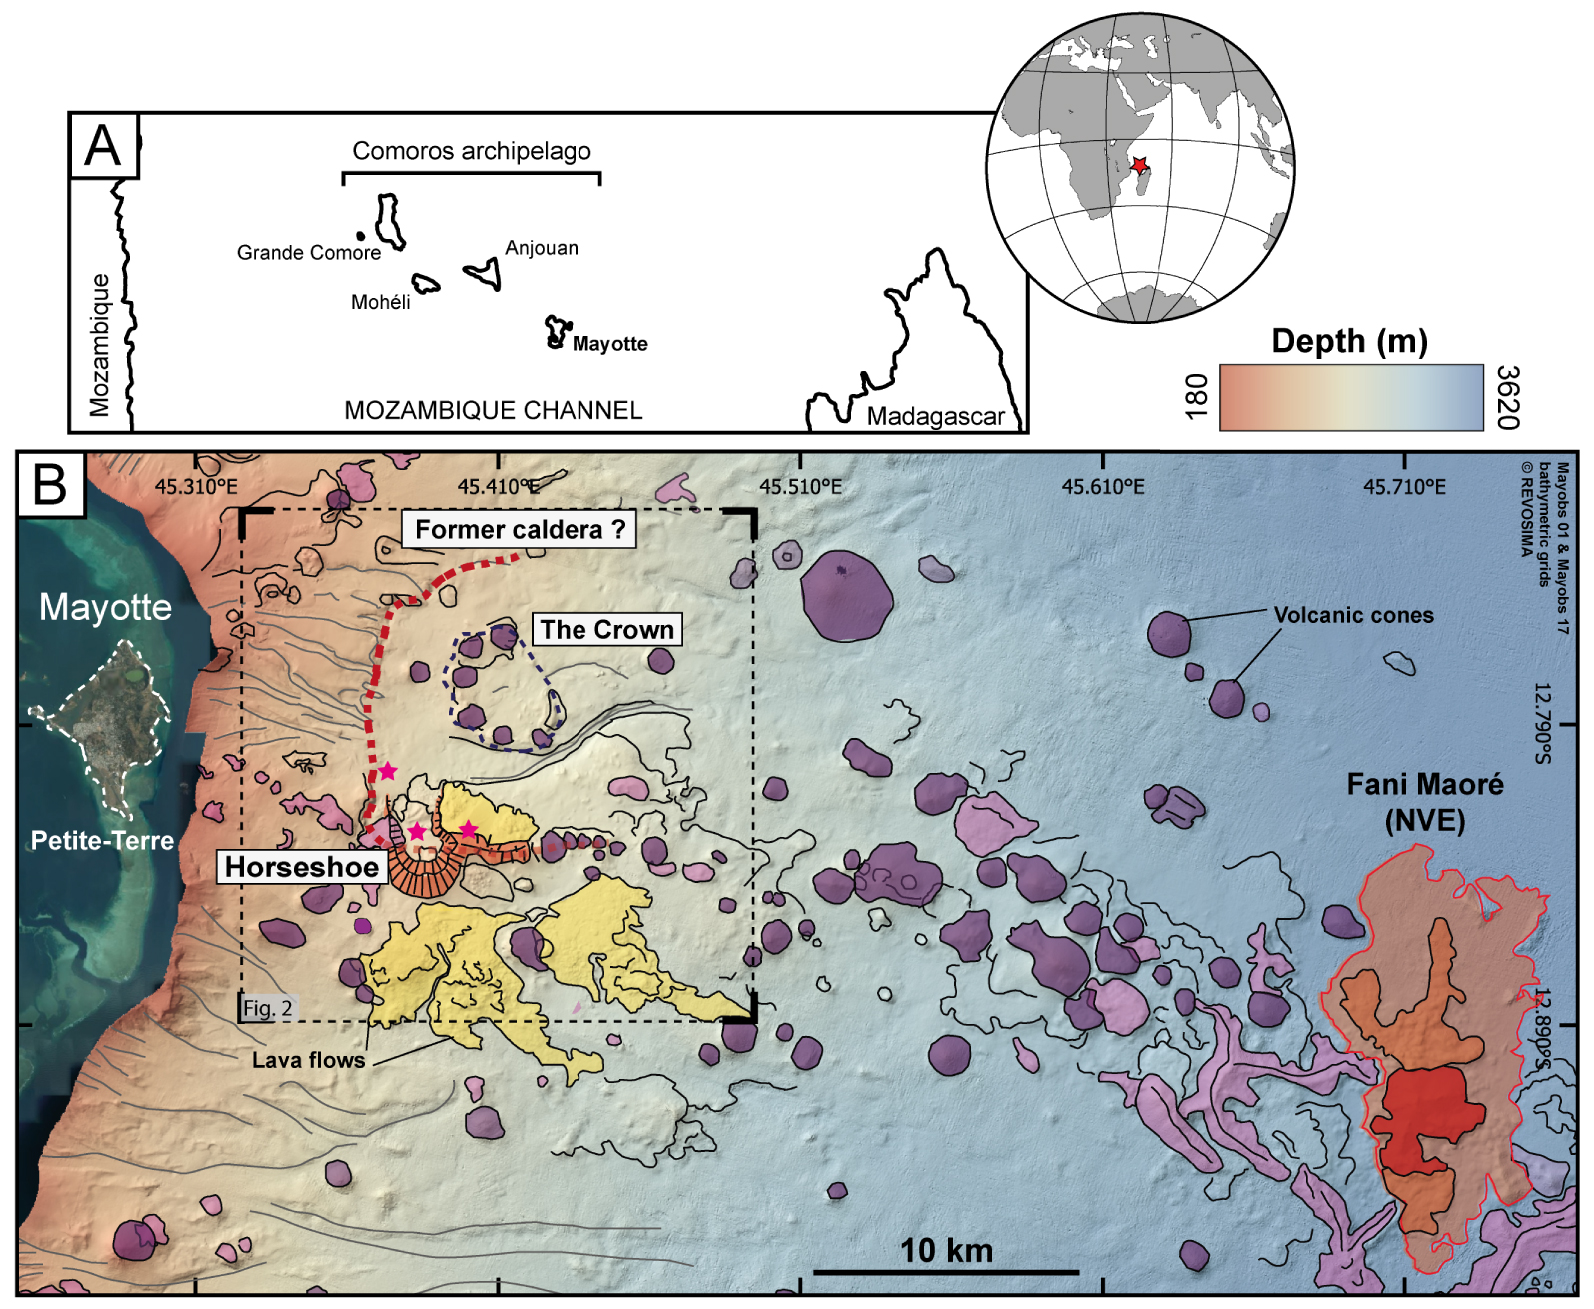
Mayotte, the oldest and easternmost cluster of volcanic edifices in the Comoros archipelago, is composed of two main volcanic islands: Grande-Terre and Petite-Terre (Figure 1). The onset of main magmatic activity in Mayotte has been estimated between 15–30 Ma [Emerick and Duncan 1982, Nougier et al. 1986, Debeuf 2004, Pelleter et al. 2014, Michon 2016], and in more recent studies between 26–27 Ma [Masquelet et al. 2022]. Mayotte is now made of three morphologically and structurally distinct units corresponding to three distinct eruptive phases [Debeuf 2004, Nehlig et al. 2013]. Volcanic activity continued in the Late Quaternary (⩽12 ka), and volcanic ash layers occurring just above coral from lagoon sediments dated at 7305 ± 65 years cal BP [Zinke et al. 2003, 2005] suggest that the last volcanic and explosive activity on land occurred less than 7 ka ago and perhaps as recently as between 6–4 ka BP as reported by Zinke et al. [2000]. Markers of this subaerial volcanic activity include cones, tuff rings, tuff cones and maar craters, that are well preserved [Nehlig et al. 2013, Pelleter et al. 2014]. The volcanic activity also extends offshore, east of Petite-Terre, where numerous submarine basanitic and phonolitic volcanic cones and lava fields are aligned along a 50 km long, WNW–ESE trending volcanic chain [Figure 1b; Audru et al. 2006, Berthod et al. 2021a, b, Feuillet et al. 2021, Tzevahirtzian et al. 2021], called the East-Mayotte Volcanic Chain (EMVC).
A major seismic crisis began in Mayotte on May 10th 2018, in a previously seismically quiet area [Audru et al. 2010, Lemoine et al. 2020]. Since the beginning of the crisis, thousands of exceptionally deep (25–50 km) earthquakes have been recorded offshore Mayotte, with a major swarm detected ∼10 km east of Petite-Terre [Cesca et al. 2020, Lemoine et al. 2020, Feuillet et al. 2021, Lavayssière et al. 2022, Saurel et al. 2022]. The strongest earthquake (Mw = 5.9) was felt on May 15th 2018, and is the strongest seismic event ever reported in the Comoros archipelago. Very-long-period seismic signals were also detected [Cesca et al. 2020, Lemoine et al. 2020, Feuillet et al. 2021, Lavayssière et al. 2022, Saurel et al. 2022], and could be generated by the resonance of a fluid-filled cavity [Feuillet et al. 2021, Laurent et al. 2021]. At the same time, GNSS stations recorded significant ground deformation of the island, with ∼20 cm of subsidence, and a horizontal displacement of ∼15 cm eastward [Lemoine et al. 2020, REVOSIMA 2019–2022, Peltier et al. 2022]. It was later proposed that the intense seismicity and significant surface deformation were linked to the drainage of a deep magma reservoir through dykes, leading to a deep submarine eruption [Cesca et al. 2020, Lemoine et al. 2020, Feuillet et al. 2021]. Recent geophysical and petrological studies have suggested the presence of a main magma reservoir at mantle depths (>30 km) 5–10 km east of Petite-Terre (below the Horseshoe area), together with reservoirs at shallower depths that may be present further east along the volcanic chain [Darnet et al. 2020, Berthod et al. 2021a, b, Foix et al. 2021, Lavayssière et al. 2022].
This major seismo-volcanic crisis led to the discovery of a new active volcanic edifice (NVE, recently named Fani Maoré) in 2019, at the eastern tip of the EMVC, at a 3500 m water depth [Feuillet et al. 2021]. To date, this new volcano is 820 m tall, has a base diameter of ∼5 km and has produced more than 6.5 km3 of lavas [REVOSIMA 2019–2022] with various morphologies, making it the largest effusive eruption since Iceland’s Laki eruption in 1783 [>10 km3, Thordarson and Self 1993]. The main edifice is also associated with extensive lava flows (Figure 1).
No recent (post-2018) eruption sites have been detected on Mayotte’s eastern submarine slope. However, the upper slope, east of Petite-Terre, is still underlain by significant deep seismic activity [25–50 km deep, Lavayssière et al. 2022, Saurel et al. 2022] and very active, with evolving fluid emissions [REVOSIMA 2019–2022]. This region is the focus of our study (Figure 2), and is characterized by numerous young volcanic cones, highly acoustically reflective lava flows that are widespread, and other features linked to mass-wasting processes subsequent to volcanic activity. North of the Horseshoe area, Feuillet et al. [2021] describe a large 10 km-wide depression that is bounded to the west by cross-cutting submarine faults and canyons (red dashed outline on Figures 1 and 2). They propose that this depression could be the vestige of a former caldera. A circular, 4 km-wide structure, hereafter called the Crown, was found inside the depression, composed of seven 1 km-wide, 100–150 m-high volcanic cones that have been interpreted by Feuillet et al. [2021] as post-caldera domes [Cole et al. 2005]. In this region, Feuillet et al. [2021] also described the so-called “Horseshoe area”, including a 3.5 km-wide horseshoe-shaped volcanic edifice, located on the southern edge of the proposed caldera and whose peculiar morphology, likely to have resulted from complex collapse processes. This study is an in-depth investigation of the Horseshoe area, through the analysis of high-resolution bathymetry and in-situ imagery.
(A) General shaded bathymetric map focusing on Mayotte’s eastern upper submarine slope showing the Horseshoe edifice, the Crown, deep submarine canyons, lava flows and volcanic cones. All interpreted features are pre-2018 and have been defined in Feuillet et al. [2021]. Bathymetry data used for this map were acquired during the MAYOBS 1 and MAYOBS 17 cruises (Table 1). (B) General backscatter map that corresponds to the extent of Figure 2a, only using reflectivity data from the MAYOBS 01 cruise. Relative scale is from −60 dB (black, low reflectivity) to +60 dB (white, high reflectivity).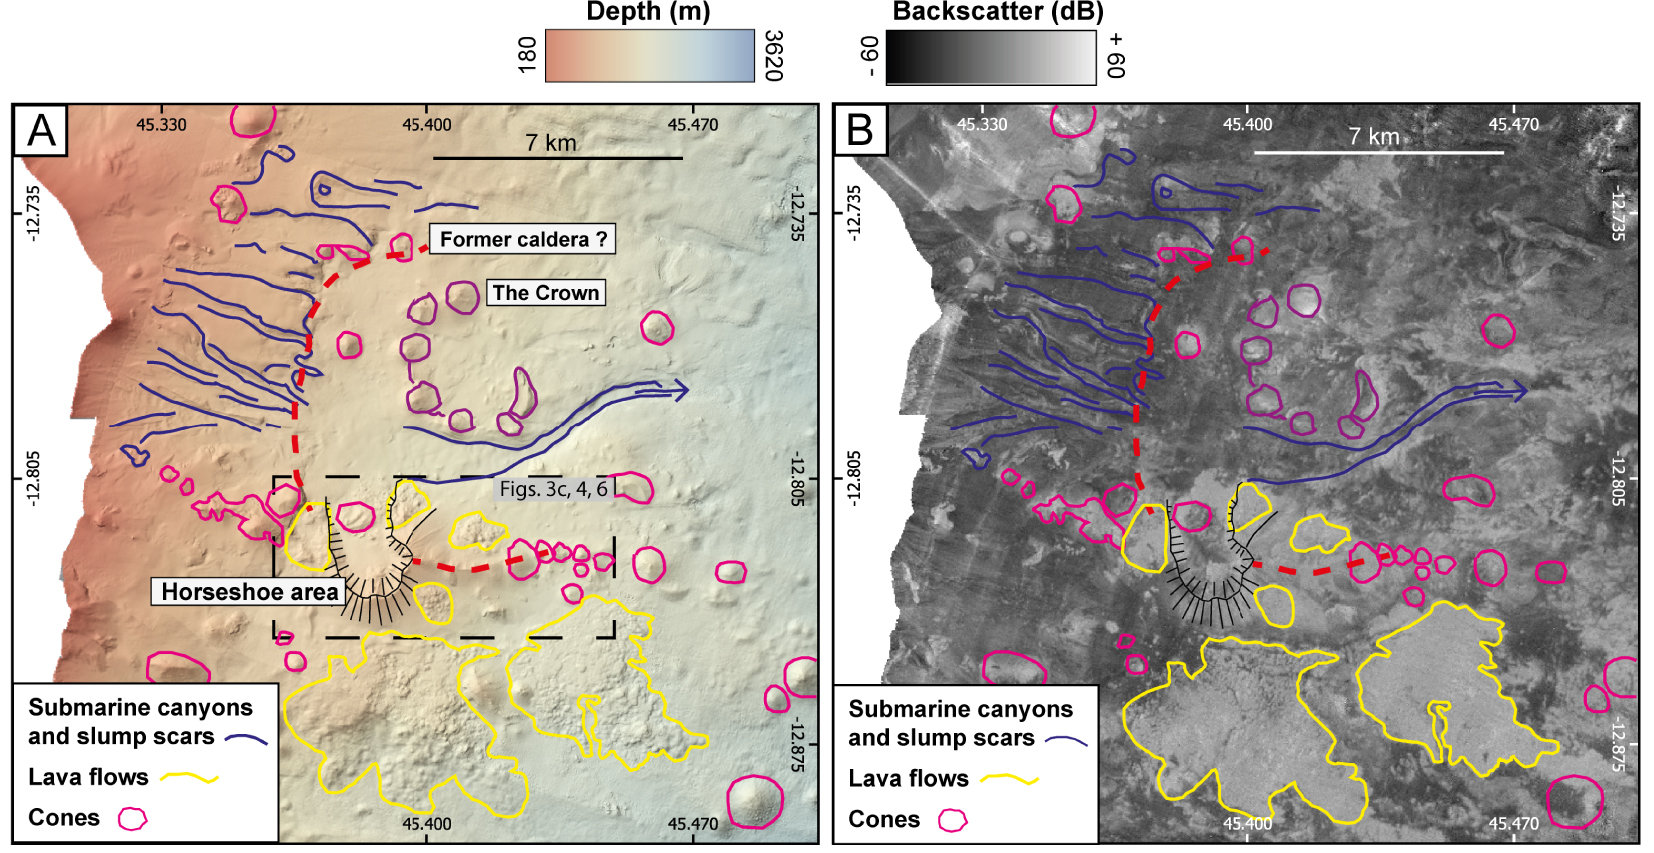
3. Data and methods
3.1. Seafloor textures derived from shipbased and near-bottom high-resolution bathymetry
This study combines two different bathymetry datasets: ship-based bathymetry, gridded with different cell sizes that vary from ∼10 to 20 m per pixel (Figure 3a), and near-bottom bathymetry acquired during AUV dives, at a spatial resolution of ∼1 m (Figure 3b).
Multi-scale approach, from regional mapping to high-resolution mapping, and to visual ground truthing of seafloor outcrops. Example of an area mapped with (A) ship-based multibeam echosounder system (MBES) bathymetry, (B) AUV near-seafloor multibeam bathymetry, (C) Scampi image relocated on the shipboard bathymetric grid (purple square), and (D) General bathymetric map of the study region: the Horseshoe area. Darker shaded bathymetry grids correspond to AUV grids coverage (cell size ∼1 m), that is superimposed on ship-based bathymetry (cell size ∼10 m). The continuous yellow lines locate Scampi dives from the MAYOBS 4 and MAYOBS 15 cruises (Table 1). Location of this figure is indicated in Figure 2.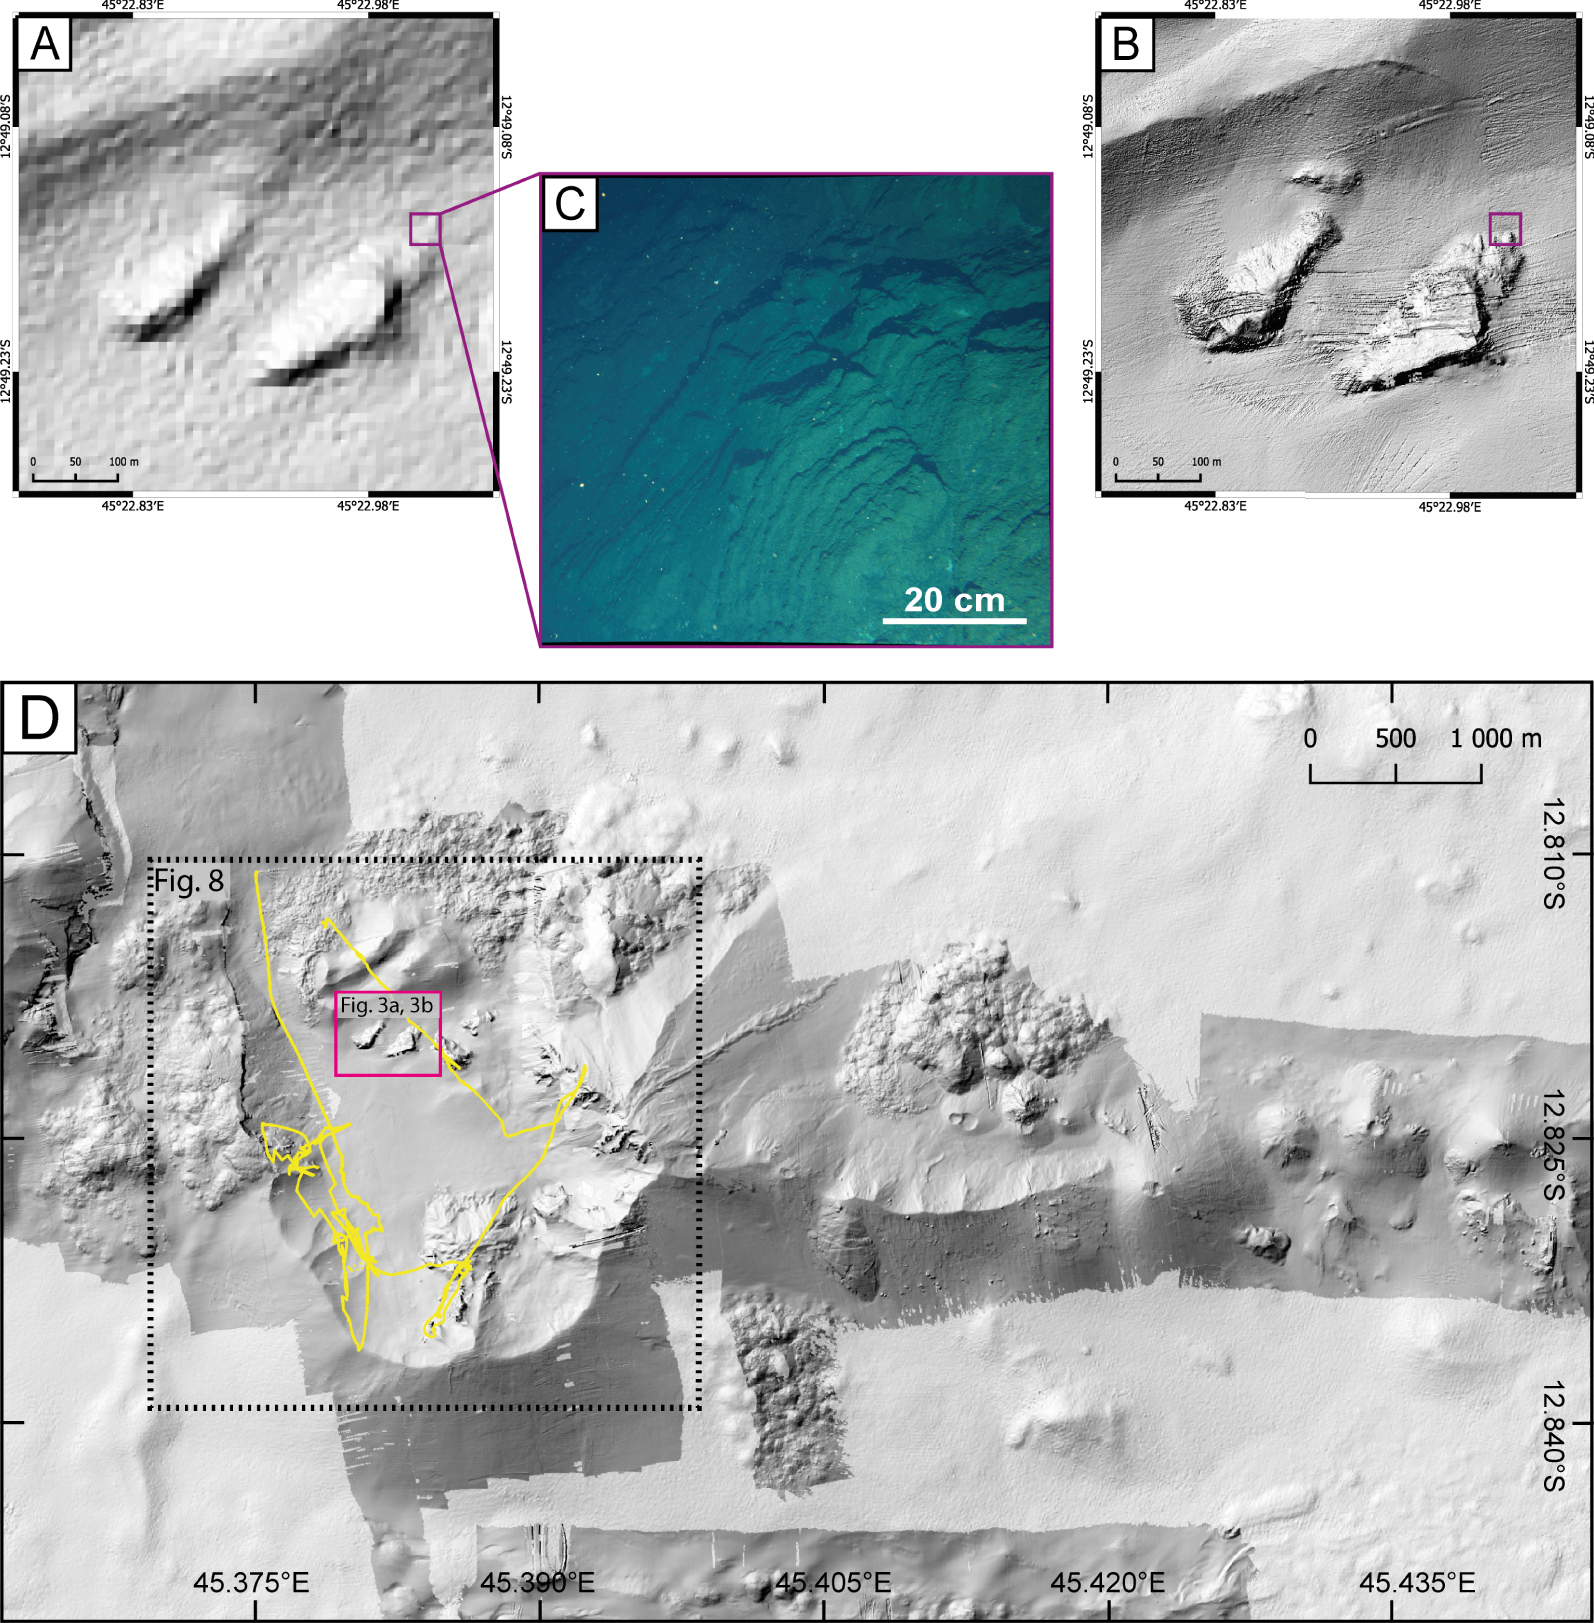
Ship-based bathymetry and seafloor backscatter data were acquired during three oceanographic cruises (MAYOBS cruises, https://doi.org/10.18142/291). The MAYOBS 1 and MAYOBS 4 data (Table 1) were acquired using a 1° × 1° beam width Kongsberg EM122 multibeam echosounder. In the study area (water depths of 1000–1500 m), the data were gridded with a 20-m cell size. In January 2021, another survey was carried out during the MAYOBS17 cruise (Table 1) using a 0.5° × 0.5° beam width multibeam echosounder (Reson Seabat 7150 at 24 kHz), which resulted in a bathymetry grid with a cell size of 10 m over the same area.
Monitoring oceanographic cruises conducted along the East-Mayotte Volcanic Chain (EMVC) by the REVOSIMA consortium used in this study
| Cruise | Date | P.I. | R/V | DOI |
|---|---|---|---|---|
| MAYOBS 1 | May 2019 | Feuillet, N. | Marion Dufresne | https://doi.org/10.17600/18001217 |
| MAYOBS 4 | July 2019 | Feuillet, N. and Fouquet, Y. | Marion Dufresne | https://doi.org/10.17600/18001238 |
| MAYOBS 15 | October 2020 | Feuillet, N., Rinnert, E. and Thinon, I. | Marion Dufresne | https://doi.org/10.17600/18001745 |
| MAYOBS 17 | January 2021 | Thinon, I., Rinnert, E. and Feuillet, N. | Pourquoi Pas? | https://doi.org/10.17600/18001983 |
Near-bottom, high-resolution multibeam bathymetry data were obtained during two cruises: the MAYOBS 4 and MAYOBS 15 cruises (Table 1), with IFREMER’s AUVs AsterX and IdefX respectively, both equipped with a Kongsberg EM2040 multibeam echosounder. The near-bottom surveys were run at an altitude of ∼70 m, yielding bathymetry with 1-m spatial resolution.
In this study, we use bathymetry data processed using the GLOBE software (doi: 10.17882/70460) to conduct a geomorphological analysis of volcanic and tectonic features, and those linked to later mass-wasting processes. We analyze the fine scale seafloor morphologies provided by near-bottom high-resolution data through a combination of shaded digital terrain models (Figure 4a), slope maps (Figure 4b), and topographic profiles (Figure 5). The seafloor textures and features identified are then digitized at a scale of 1:10,000–1:20,000, depending on the resolution of the underlying bathymetric grid, and georeferenced (Figure 6) using the QGIS software (https://www.qgis.org/). For our interpretations we solely use geomorphological criteria, without considering other data such as rock composition or geochemistry, as these data are currently being processed and will be integrated in a later study. Other seafloor features are clearly visible in the study area on the ship-based data, although they were not surveyed during AUV dives. We map these features separately (grey dashed outlines on Figure 6) for indicative purposes but do not include them in our interpretations as they were not identified with the same resolution and hence reliability as the rest of the morphologies identified in AUV near-bottom data (Figure 6).
(A) General shaded bathymetric map of the Horseshoe area (compilation AUV+MBES). The different squares indicate details of the AUV derived bathymetric maps from Figure 5. (B) General slope map of the Horseshoe area, with 50 m spaced bathymetric contours.
(A–D) Details of seafloor textures identified on AUV bathymetry maps at the Horseshoe area. Location of these details are indicated in Figure 4. Associated cross-sections are extracted from bathymetry grids. Location of these cross-sections are indicated on the corresponding shaded bathymetry map.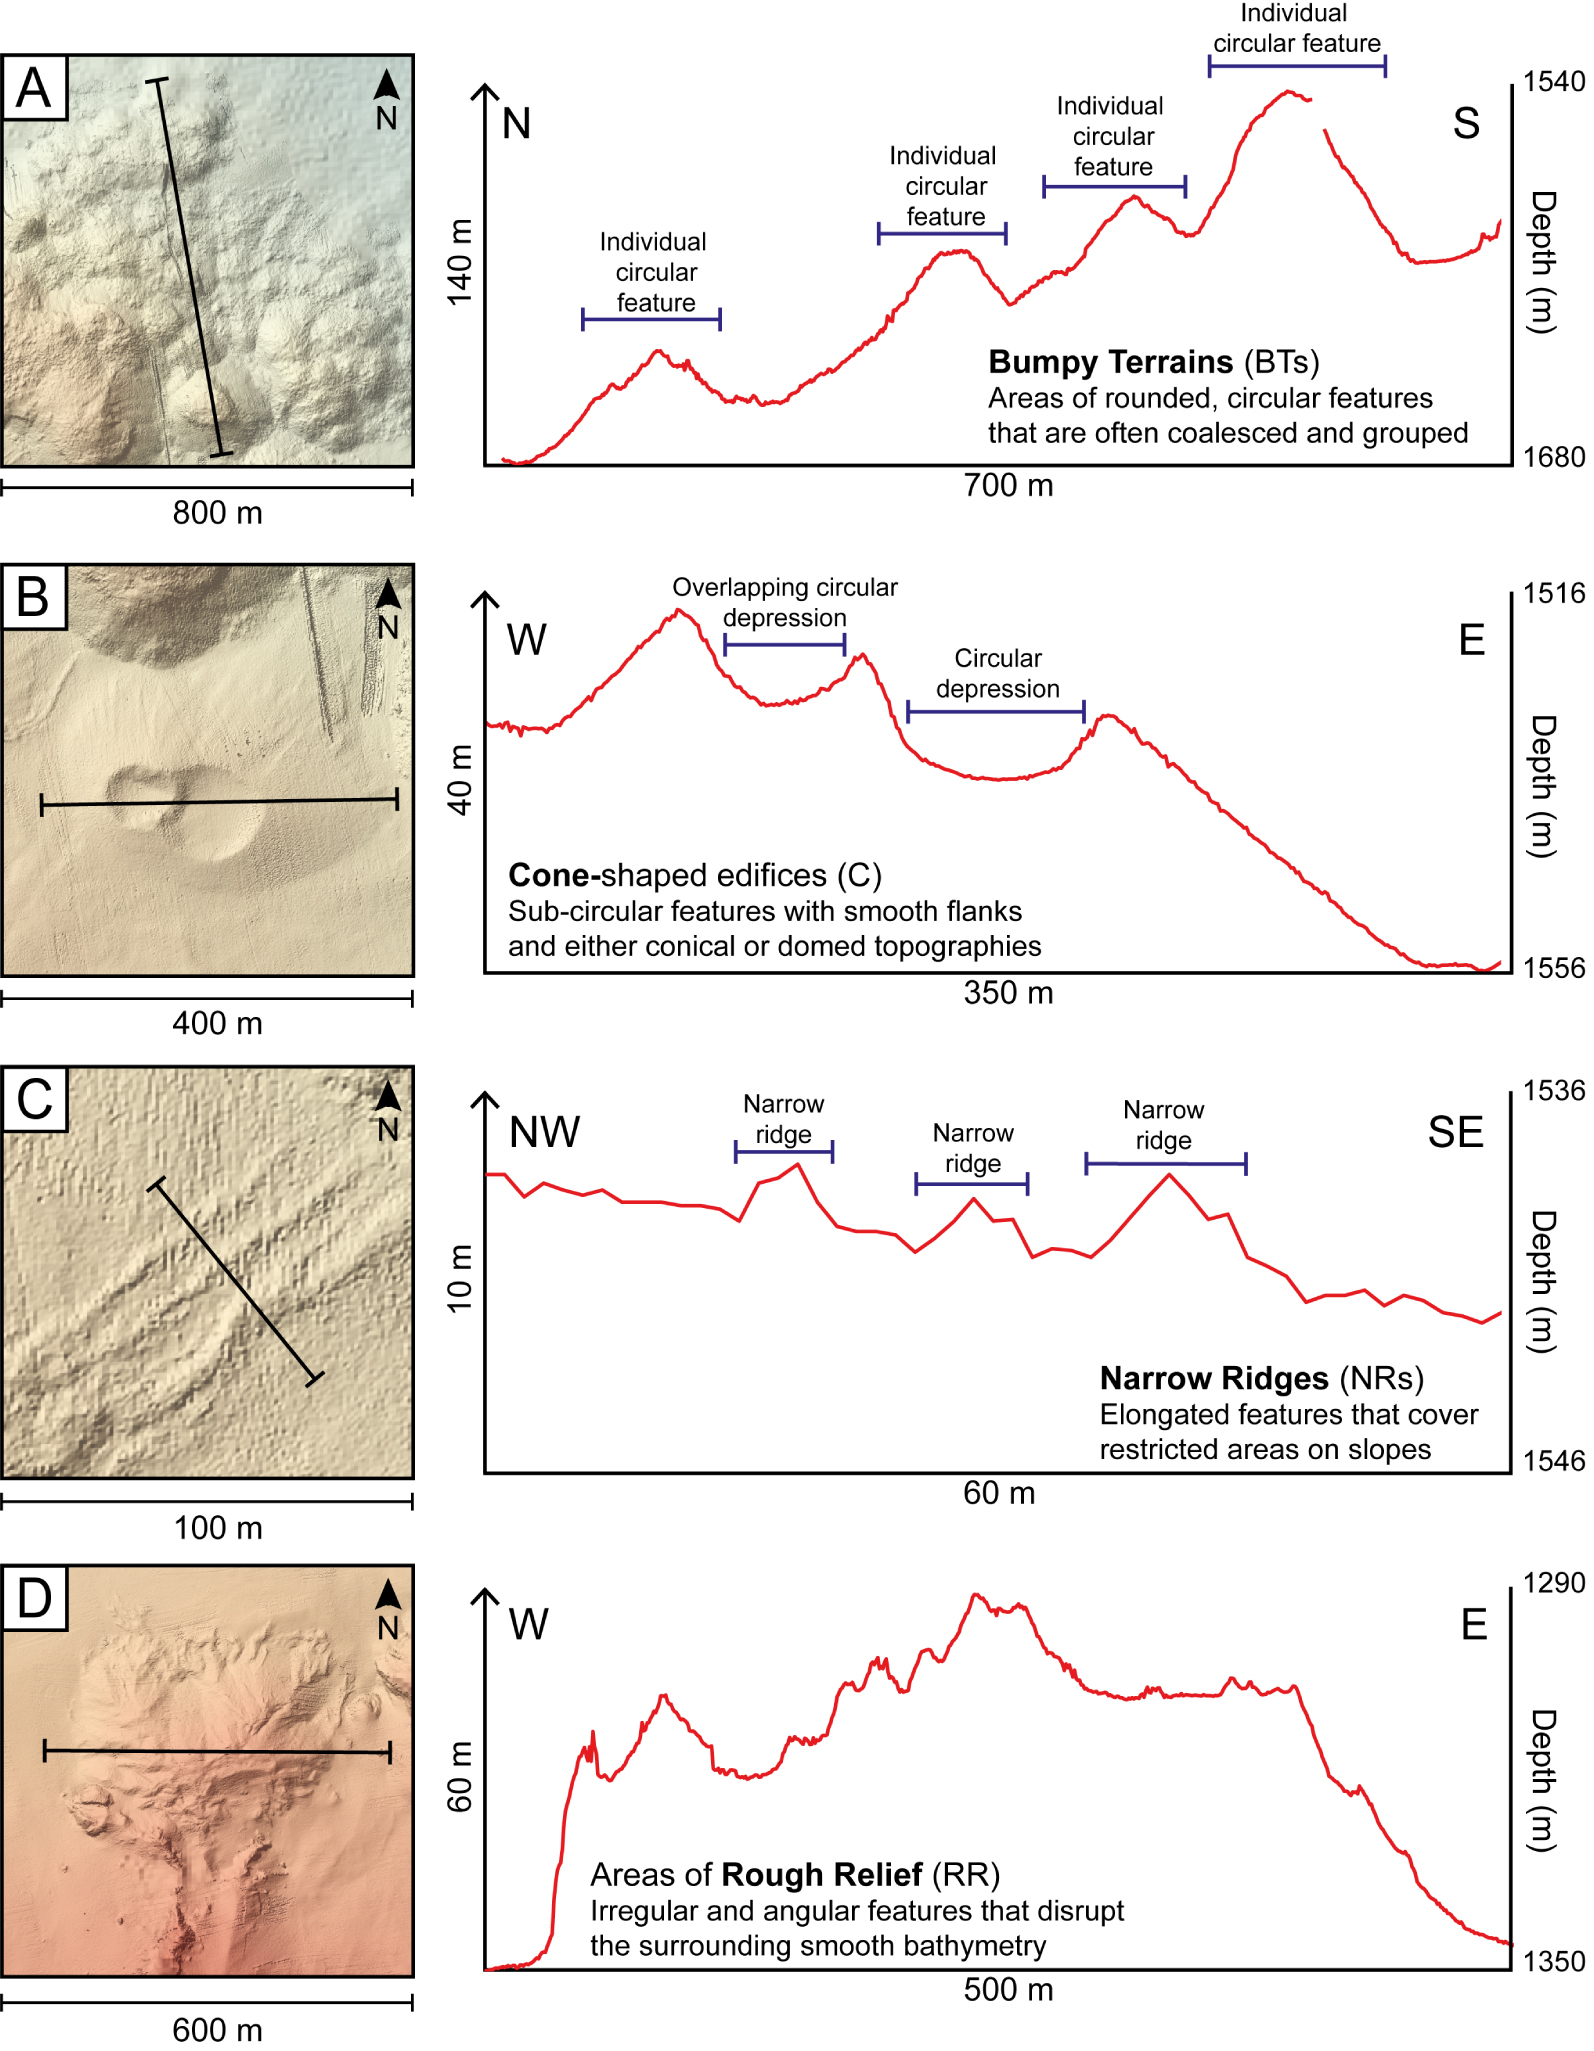
Geomorphological features of the Horseshoe area from seafloor textures and features mapped on the shaded bathymetry map, combining high-resolution AUV data (limited by black dashed lines) and ship-based data. Dashed outlined features are mapped for indicative purposes but are not used for the discussion as they are located outside the AUV surveyed area (black dashed outline; see Figure 3d).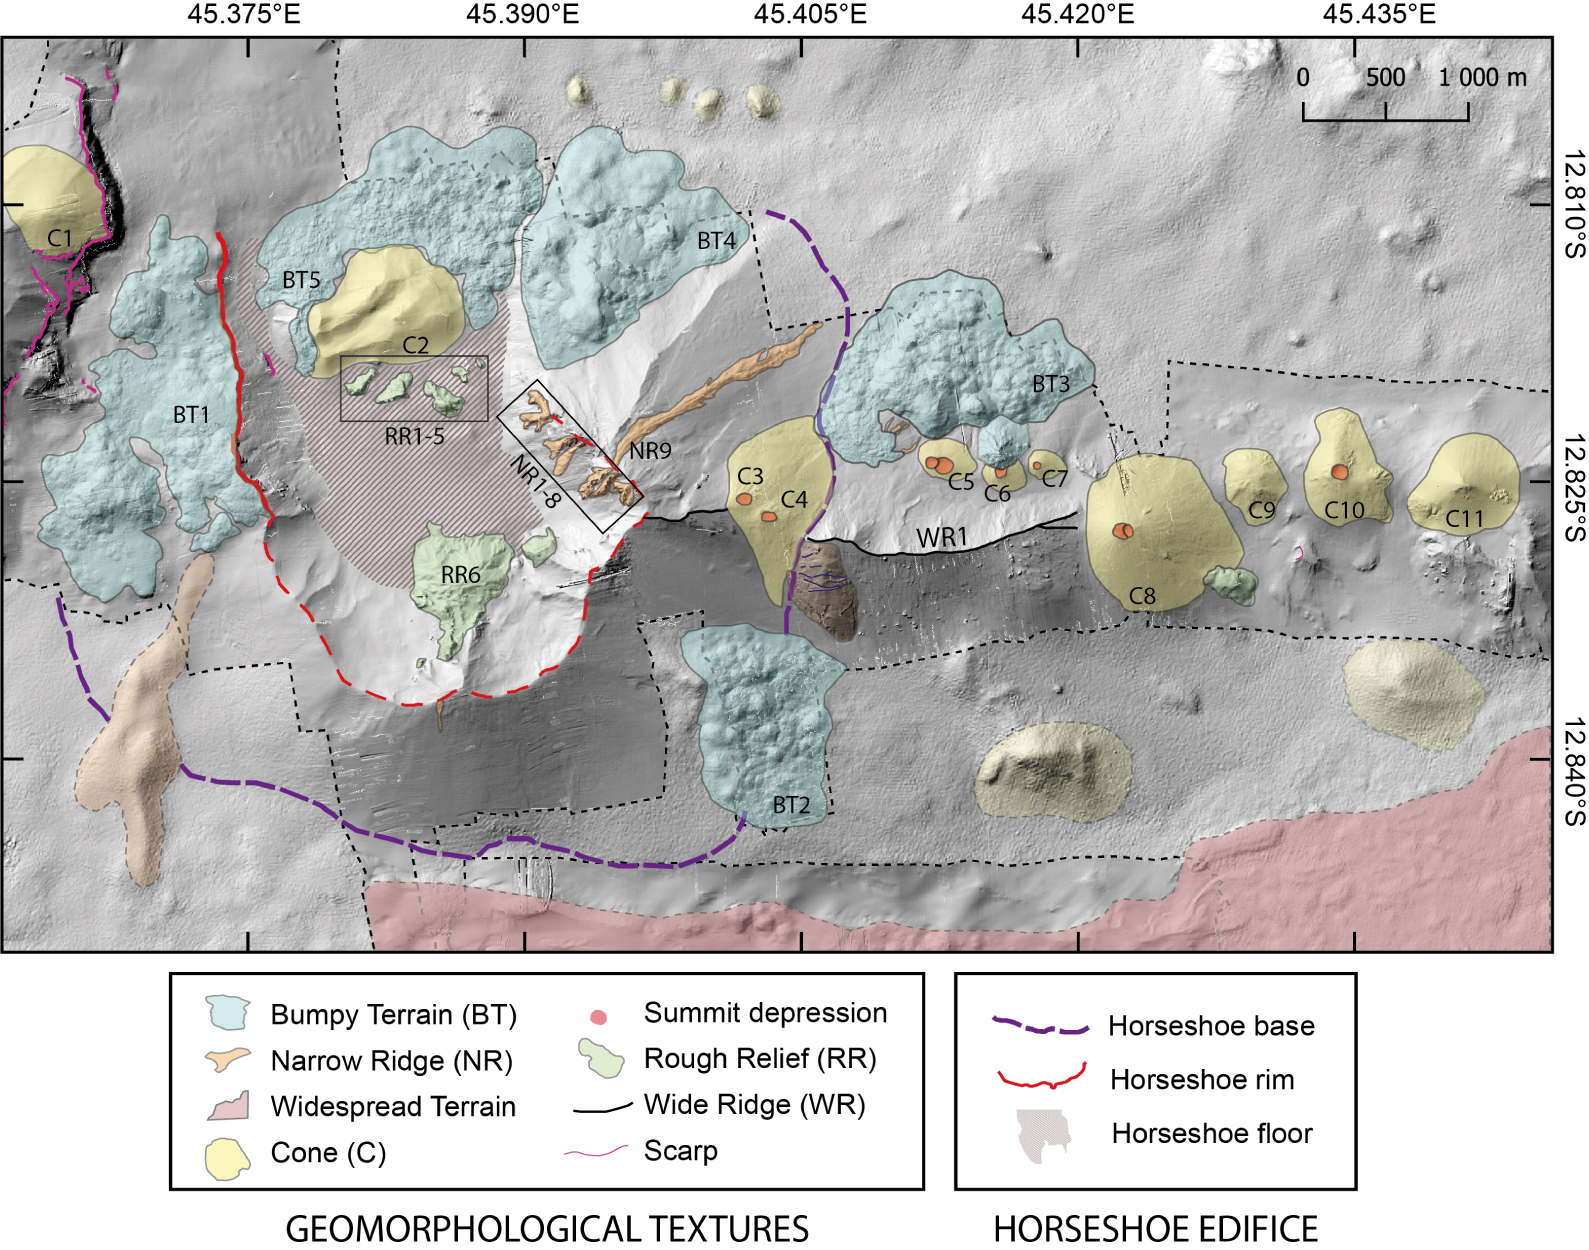
3.2. Ground truthing with in-situ observations
Seafloor images were obtained from a deep-towed camera system named Scampi, a submarine seafloor imaging system from IFREMER that is towed behind the ship along predefined tracks. The Scampi is flown a few meters above the seafloor to acquire images and video with a vertically mounted camera and light sources (Figure 3c). It was deployed during the MAYOBS 4 and MAYOBS 15 cruises (Table 1). Seven camera tows were made along the volcanic chain, and four specifically targeted the Horseshoe area, providing ∼21 h of video imagery (Figure 3d).
Visual seafloor observations provide ground-truth of the geomorphological seafloor textures mapped on the bathymetry, and are required to better understand their geometry, nature, and distribution. These visual data are used to define several facies that provide clues regarding their origin (e.g., volcanic deposits, mass wasting, etc.). Qualitative comparison and spatial correlation of the distribution of the geomorphological seafloor textures and visual facies mapped with high-resolution bathymetry and in-situ imagery allows us to determine whether local in-situ observations can be extrapolated to broader areas using the high-resolution bathymetry, or if more systematic and in-situ observations are needed to ground-truth the bathymetry data.
All the images and videos from the Scampi tows conducted within the Horseshoe area were inspected visually, and from this systematic review we are able to distinguish various visual facies based on textures (e.g., size of blocks, surface texture; Figure 7). This visual interpretation was conducted independently from the geomorphological interpretation described above for objectivity and to avoid biases. We systematically classified each image according to the different visual facies along the Scampi tracks, thus providing a precise along-track map of the distribution of the different facies (Figure 8). The superposition of visual facies along the Scampi tracks over the seafloor textures mapped on the bathymetry then allows us to discuss the results presented in the following section.
(A–F) In-situ image examples of the different seafloor facies encountered in Scampi imagery and reported on Figure 8. Fa1: fine clastic material with little to no blocks. Fa2: angular blocks a few cm to a few 10 s of cm across with very little matrix. Fa3: clusters of angular blocks up to a meter across with no matrix. Fa4a–Fa4c: stratified, consolidated, to massive in-situ outcrops.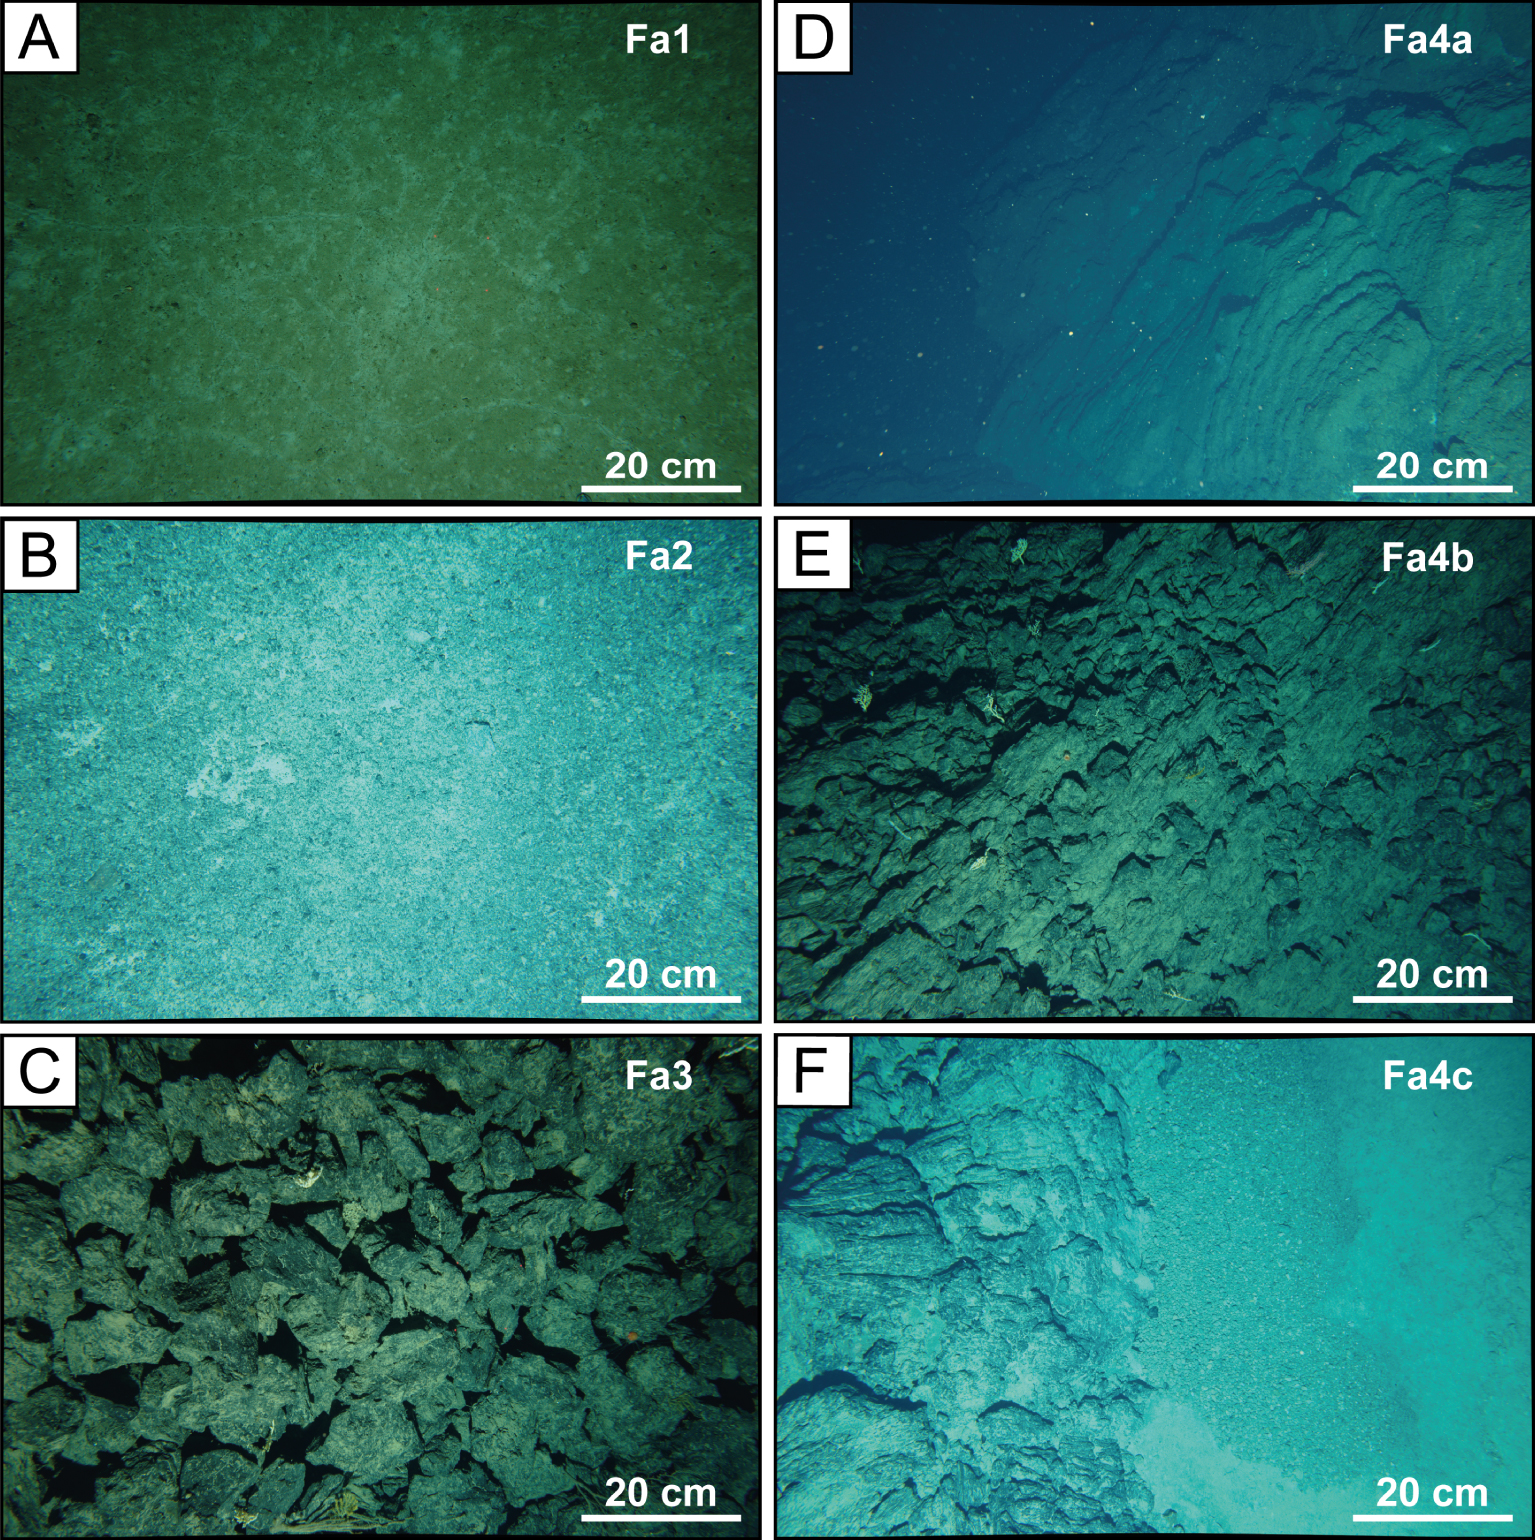
Seafloor textures throughout the Horseshoe’s depression from the AUV high-resolution bathymetry and Scampi imagery. The colors along the navigation track of the scampi diving (Dives 01 and 02 of MAYOBS 4 (Table 1) and Dives 02 and 03 of MAYOBS 15 (Table 1; see location on Figure 3d)) correspond to the different seafloor types indicated in the text and are underlain by the seafloor textures mapped on the bathymetry (Figure 6). The small white circles locate the images from Figure 7. Owing to navigation and flight conditions of the Scampi, the vehicle was off-bottom during part of the transects and no images could be acquired. In addition to the visual facies described above, we also report these track sections as off-seafloor with no visual ground-truth.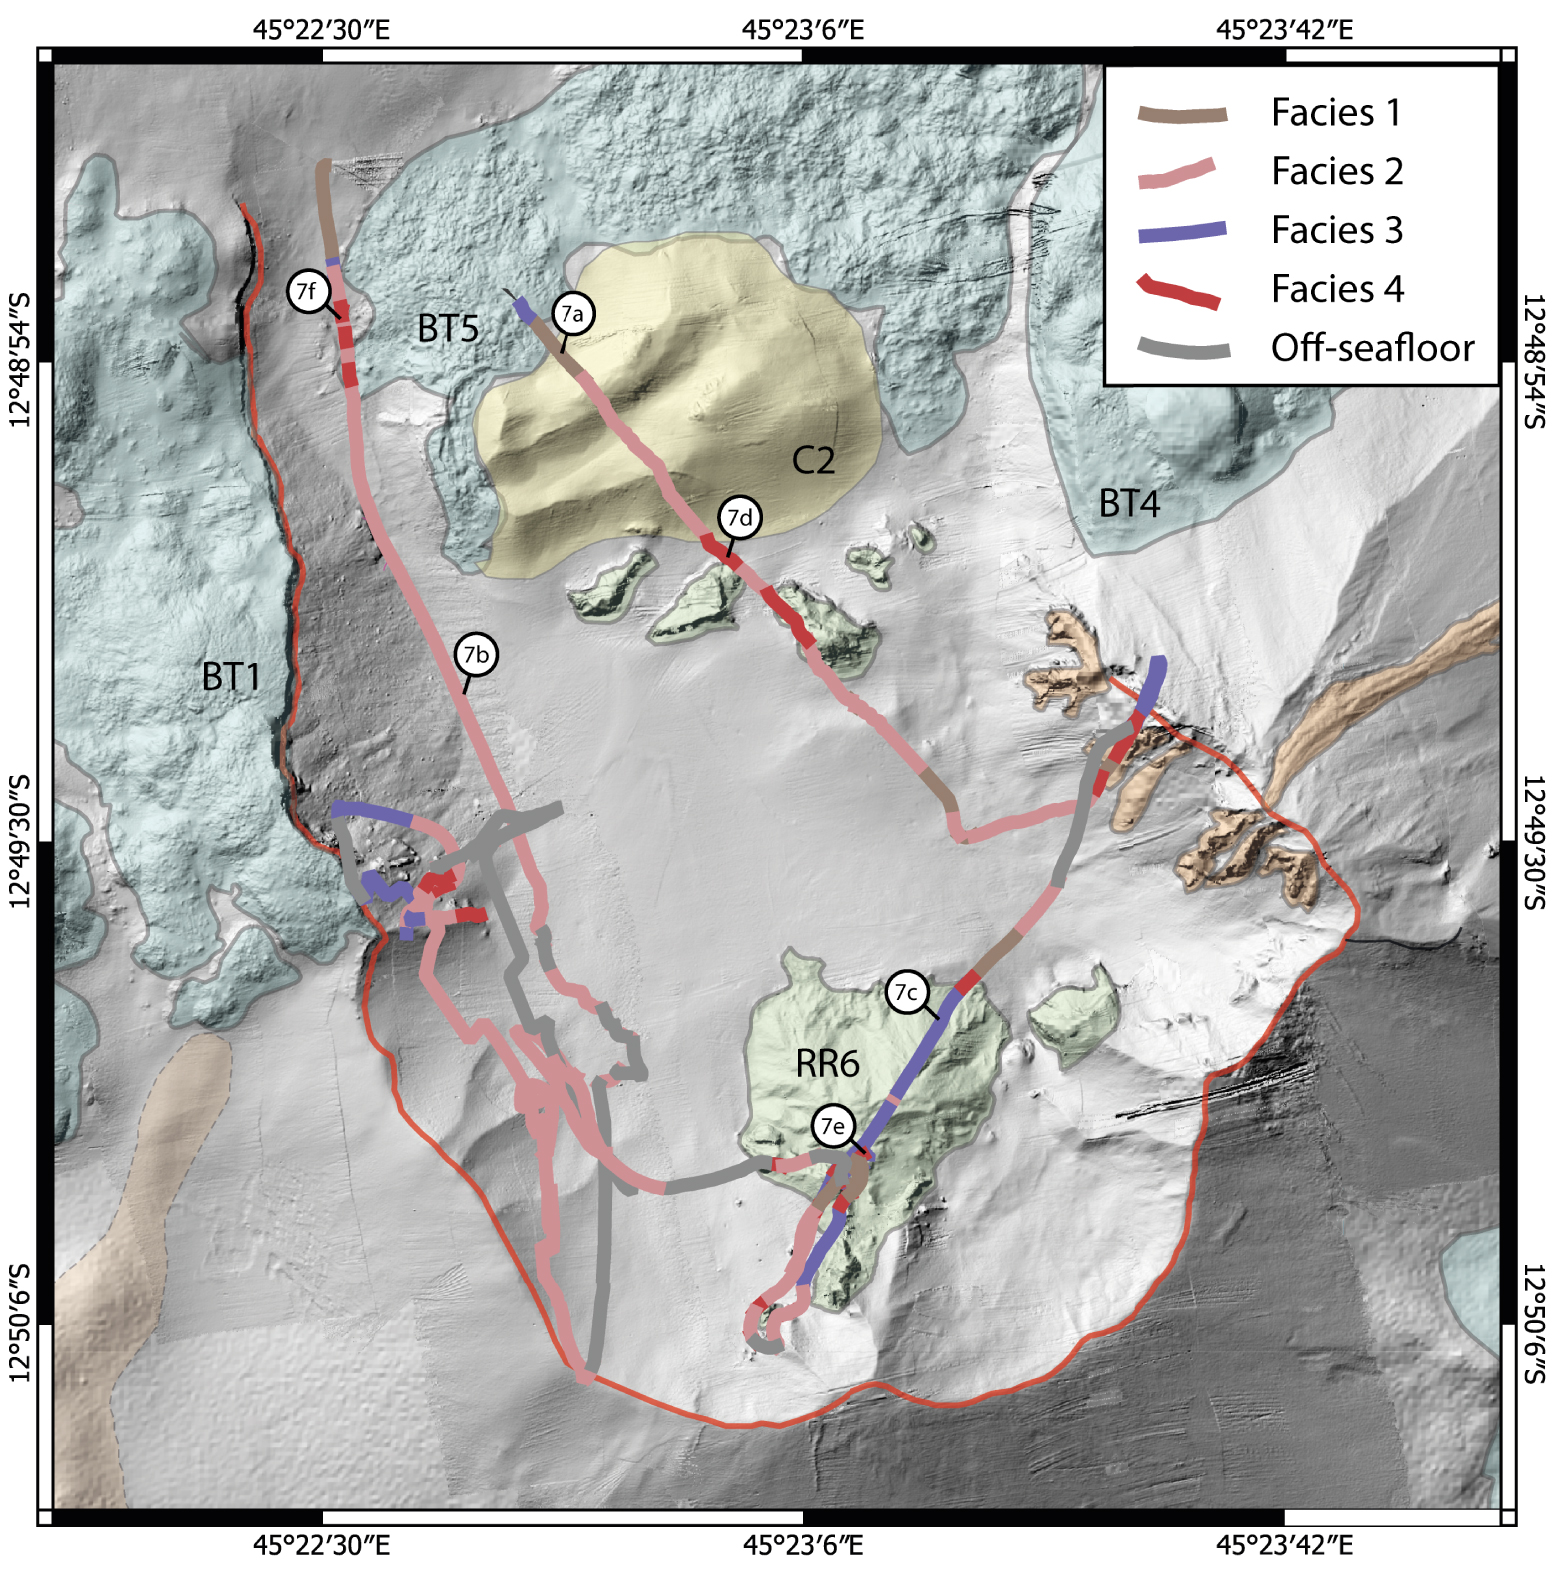
4. Results
4.1. Geomorphological characteristics and distribution of seafloor textures in the Horseshoe area
Near-seafloor, high-resolution AUV bathymetry data (∼1 m) acquired along Mayotte’s upper eastern submarine slope document variations in seafloor morphology (Figures 4, 5). Figure 5 presents the main geomorphological seafloor textures that we observe in the Horseshoe area between water depths of 1100–1500 m.
The Horseshoe edifice was first described in Feuillet et al. [2021] as a large cone with smooth slopes and a large irregular U-shaped scar, based on ship-based bathymetry data. With the new high-resolution AUV bathymetry, we can now describe this structure in finer detail. The base of the edifice (purple dashes on Figure 6) is ∼4 km wide, as inferred from the break in slope, from 15° to 25° on the cone compared to the flat surrounding seafloor (Figure 4b). The center of the edifice shows a 2 km-wide depression that is open to the north. Its crest is marked by a sharp and well-defined U-shaped limit: the Horseshoe’s rim (red dashes on Figure 6). To the west, the depression is bounded by a ∼N–S striking, steep (∼60°) 60 m-high, eastward facing cliff (solid red line on Figure 6). To the south, the depression is bounded by slopes that are both smoother and more gently dipping. To the east, the Horseshoe’s rim is kinked in a NW–SE direction.
4.1.1. Bumpy terrains
First, we identify bumpy terrains (BTs) characterized by rounded, circular features that are often coalesced and grouped (Figure 5a). Individual circular features have typical diameters of a few tens to up to ∼200 m, heights of 10–100 m and display either rough or smooth textures in the high-resolution bathymetry. We map five areas of bumpy terrains (BT1–BT5) on the western and eastern outer flanks of the Horseshoe edifice as well as in the center of its depression (Figure 6). These zones cover surfaces of ∼1–2 km2. The westernmost terrain BT1 is clearly truncated on its eastern edge by the sharp scarp bounding the Horseshoe’s depression.
4.1.2. Cone-shaped edifices
We identify well-preserved cone-shaped edifices (C1–C11 on Figure 6) that all display a sub-circular plan-view base with either conical or domed topographies (Figure 5b). Their flanks are smooth in the high-resolution bathymetry with gentle slopes ranging from 10° to 25° (Figure 4b). These structures show basal diameters of a few hundreds of meters to ∼1 km and heights of up to ∼200 m relative to the adjacent seafloor. West of the Horseshoe edifice, we map a large cone (C1; 500 m in diameter at the base, 140 m-high). North of the Horseshoe’s depression and surrounded by BT5, we map a smooth 100 m-high edifice (C2) with gentle slopes and having a conical shape elongated in a WSW–ENE direction. A 20 m-deep, 180 m-wide depression elongated in the same direction is visible at its center. East of the Horseshoe edifice, we identify three distinct sets of cones (Figure 6). C3 and C4 (SC 1) are irregular cones, overlap each other and present well-defined small circular depressions (up to 100 m in diameter) at their summits. C5–C7 (SC 2) are much smaller (diameter up to 350 m), have clear circular bases and also show summit depressions. Lastly, C8–C11 (SC 3) are larger (diameter up to 950 m), more irregularly shaped and do not systematically show summit depressions. The three sets of cones are aligned in an overall E–W direction.
4.1.3. Wide ridges
The three sets of cones (SC 1–SC 3) are aligned with a sharp E–W to N 70° E striking Wide Ridge (WR1 on Figure 6). The northern and southern slopes of this 1.2 km long ridge gently dip northwards by 25° and southwards by 20° and show a very smooth texture in the bathymetry (Figure 4b). This ridge appears to extend from the kinked eastern part of the Horseshoe’s rim and shows a sharp crest at its summit. South of WR1 and just east of the base of the Horseshoe, we identify an ellipsoidal feature with a smooth surface that is disrupted by northward dipping scarps (brown patch on Figure 6).
4.1.4. Narrow ridges
We also identify narrow ridges (NRs) that cover more restricted areas on slopes (Figure 5c). In particular, originating from the kinked, eastern part of the Horseshoe’s rim we map eight narrow ridges (NR 1–8, Figure 6) that are 120–250 m long, 30–60 m wide and that are directed towards the center of the depression. Originating from the eastern part of the Horseshoe’s rim, we map a longer narrow ridge (NR 9; ∼1500 m) that goes away from the Horseshoe’s depression, on its outer flank. We observe a depression in the center of NR 9. Shorter NRs also originate from BT3 and from the southern part of the Horseshoe’s rim, displaying widths of ∼30 m and lengths of 100–200 m.
4.1.5. Areas of rough relief
Within the Horseshoe’s depression and along WR1 we map irregularly shaped features that distinctly disrupt the surrounding smooth bathymetry (Figure 5d). In particular, we identify five ∼70 m–∼280 m long and up to 40 m high areas of rough relief (RR1–RR5 on Figure 6). Another angular and irregular relief with a similar rough morphology is located further south at the foot of the southern part of the Horseshoe’s rim (RR6). This RR6 relief is higher (up to 100 m-high) and larger (0.3 km2) than those identified further north and appears to be a “spur” originating from the Horseshoe’s rim. Two other outcrops of smaller size are also visible east and west of the “spur” structure, and other angular features can be identified throughout the study area, but we have chosen to only digitize the most prominent structures.
4.1.6. Other features
Northwest of the Horseshoe edifice we note a set of steep N–S striking scarps arranged in an en-echelon trend with the steep cliff bounding the northwest edge of the Horseshoe’s depression (pink lines on Figure 6). Lastly, south of the study area, we identify a widespread terrain (WT) that has smoother surfaces than those observed with the BTs.
4.2. Visual seafloor facies from in-situ imagery
In-situ imagery of the seafloor documents the outcrop textures and detailed seafloor morphology at smaller scales (∼ a few m or less; Figure 7). In this section we describe the different seafloor textures observed at the Horseshoe area based solely on visual criteria, for objectivity. The interpretation of these facies and their comparison to those observed elsewhere is detailed in Section 5.1. The distribution of these visual seafloor facies is shown in Figure 8 along the Scampi tracks that go over the different geomorphological seafloor textures we described.
We identify four different visual facies (Fa1 to 4). The first facies (Fa1; Figure 7a; Table 2) is characterized by fine ( <1 cm), clastic, matrix rich material with few or no blocks and a muddy aspect. In some areas the material seems consolidated, forming crusts that are often cracked. This Fa1 facies is encountered in three distinct areas: (a) north of the Horseshoe’s depression, (b) in the eastern region of the Horseshoe’s floor, where it alternates with coarser deposits and (c) along the southern inner flank of the Horseshoe edifice (Figure 8), especially within the “spur” region (RR6), where it covers some areas with more abrupt topography and higher relief.
Characteristics and location of high-resolution visual seafloor facies identified solely on deep-towed camera images and videos
| Facies | Description | Location | |
|---|---|---|---|
| Fa1 | ∙ Fine ( <1 cm) clasts | ∙ North of the Horseshoe’s depression | |
| ∙ Few to no blocks | ∙ Eastern region of the depression | ||
| ∙ Matrix rich | ∙ Within RR6 region | ||
| Fa2 | ∙ Small angular blocks (>1 cm, <10 cm) | ∙ Most of the Horseshoe’s floor (most frequently encountered facies) | |
| ∙ Not consolidated | |||
| ∙ Very little matrix | |||
| Fa3 | ∙ Large angular blocks (>10 cm, <1 m) | ∙ Within RR6 region | |
| ∙ Not consolidated | ∙ Eastern part of the Horseshoe’s rim | ||
| ∙ No matrix | ∙ West of BT1 | ||
| ∙ On top of BT5 | |||
| Fa4 | Fa4a | Stratified/brecciated in-situ structures | ∙ North of the Horseshoe’s depression |
| ∙ West of RR6 region | |||
| ∙ Eastern part of the Horseshoe’s rim | |||
| Fa4b | Massive angular in-situ blocks (>10 m) | ∙ Around RR6 region | |
| ∙ East of BT1 | |||
| Fa4c | Flat, striated in-situ surfaces | ∙ West of BT5 |
The most frequently encountered facies (Fa2; Figure 7b; Table 2) is characterized by small angular blocks that are a few centimeters across, do not appear to be consolidated, and with very little clastic matrix. There is a significant variability in the visual distribution and size of clasts, with some areas displaying larger blocks that are placed over units with smaller sized clasts. The density of larger blocks shows lateral (along-track) variations and qualitatively we observe that their abundance increases up-slope, or close to steep scarps. This Fa2 facies is found in the Horseshoe’s central depression and on its southwestern inner flank, The Horseshoe’s floor is thus mainly composed of this facies, at least along the tracks imaged by the Scampi (Figure 8).
The third facies (Fa3; Figure 7c; Table 2) is characterized by clusters of larger angular blocks that are tens of cm to one meter in diameter with no clastic matrix. This facies is found throughout the area, at the base of cliffs, along sloping areas, or within areas of rough relief. In particular, we observe this facies on the top of the large area of rough relief (RR6) at the foot of the southern part of the Horseshoe’s rim, west of BT1, as well as along its kink-shaped northeastern rim. This facies is also found locally on the top surface of BT5, just north of the smooth relief (C2, Figure 8) that it surrounds.
The last facies (Fa4) features in-situ, consolidated, stratified or massive structures. We identify three sub-facies within Fa4, based on the apparent alteration and stratification of outcrops (Fa4a–Fa4c). Some structures are made up of brecciated, stratified material (Fa4a, Figure 7d; Table 2). Fa4b consists of clear angular, massive blocks 10 s of m across (Figure 7e; Table 2) while the last sub-facies (Fa4c) shows overall flat morphologies with clear striations, resembling subaerial ropy lava surfaces (Figure 7f; Table 2). The areas mapped north of the Horseshoe’s depression, west of the “spur” (RR6) and originating from the eastern kink-shaped part of the Horseshoe’s rim all display brecciated, stratified outcrops often showing fractures and thus correspond to the sub-facies Fa4a. Facies observed around the spur region are less fractured, often marking clear breaks in the topography, as is the case east of BT1, below the western part of the rim and are thus interpreted as the sub-facies Fa4b. Lastly, north of the Horseshoe’s depression, west of BT5, we identify a massive area with an overall flat morphology that we characterize as part of the Fa4c sub-facies.
4.3. Comparisons and correlations between high-resolution bathymetry and in-situ imagery
Qualitative comparisons of the seafloor geomorphological textures mapped on the bathymetry and of the visual facies identified on the in-situ imagery allows us to determine if local, outcrop-scale data can be extrapolated to broader areas. Visual seafloor facies Fa1 and Fa2 both are composed of relatively fine (>10 cm) clastic material that corresponds to smooth seafloor texture on the high-resolution bathymetry, with no significant relief or changes in topography. Both visual facies are composed of material that is too fine to be associated to a specific sub-texture (i.e. Fa1 or Fa2) in the smooth bathymetry areas. Hence, all visual facies composed of elements with scales lower than the resolution of the bathymetry and lacking distinctive topographic features cannot be regionally extrapolated using only local in-situ observations. We thus restrict our interpretations to the Scampi tracks for these facies.
The visual facies Fa3 cannot be directly correlated with any of the seafloor textures and features identified in the bathymetry for the same reasons (the material is coarser but still too fine to be identified in bathymetry). However, we do observe that this facies tends to be found over features that show small-scale roughness (at scales of a few m), especially along slopes associated with scarps, ridges, or clear topographic markers.
In the Horseshoe area, the visual facies Fa4 identified on the Scampi imagery can be directly associated to the areas of rough relief mapped on the bathymetry (e.g., RR1–5). The sharp edges visible on both the imagery and bathymetry provide general ground-truth of these features, but systematic in-situ observations are necessary to characterize the finer scale morphologies, and to detect the presence of lineations, fissures or breccia within the outcrops.
5. Discussion
5.1. Interpretation of seafloor textures and facies
To date, only a few seamounts have been studied systematically over a wide range of scales [e.g., Axial Seamount, Chadwick et al. 2013, Clague et al. 2017, West Mata, Chadwick et al. 2018; Havre, Carey et al. 2018; NW Rota-1, Embley et al. 2006]. The geodynamic context offshore Mayotte is complex and different from those regions, and the volcanic features and morphologies that we identify along Mayotte’s eastern upper submarine slope cannot be directly compared. However, we propose here an interpretation of the seafloor features of our study area, based on preexisting subaerial and submarine geomorphological studies.
Bumpy terrains, widespread terrains and narrow ridges likely correspond to different types of lava flows that were emplaced through different processes. While we do not yet have clear ground-truth for the bumpy terrains identified from the high-resolution bathymetry, we propose that BTs 1–5 are similar to hummocky lava flows that are made of pillow lava [Smith and Cann 1990, Clague et al. 2017]. The latter are commonly observed at slow-spreading mid-ocean ridges [Smith et al. 1995, Yeo et al. 2012, Yeo and Searle 2013], or at other submarine volcanic settings [e.g., Mariana back-arc spreading center, Chadwick et al. 2018; West Mata seamount, Chadwick et al. 2019; Lō’ihi seamount, Clague et al. 2019]. However, individual hummocks observed at BTs 1–5 show a texture that visually appears rougher than that described previously, and similar to what has been observed by Embley and Rubin [2018] in the Lau Basin, or by Portner et al. [2021] on the Alarcon Rise segment of the East Pacific Rise. We propose that the eruption processes might be similar, but the fine-scale rougher morphology of hummocks observed at the Horseshoe area may be due to lavas that are more evolved, and therefore more viscous [Berthod et al. 2021b], than those usually erupted along mid-ocean ridges. We suggest that the narrow ridges that we map at the Horseshoe area correspond to narrow lava flows that originate from restricted and focused vent areas. Lastly, the widespread terrain that we identify corresponds to the highly reflective lava flows visible on both shipboard bathymetry and backscatter data (Figure 2). They have a finer, smoother and more homogeneous aspect than that of the hummocky lava flows and are thus possibly associated with lavas that are erupted at a higher effusion rate and possibly a slightly lower viscosity [Gregg and Fink 1995, White et al. 2015a].
The cone-shaped edifices mapped throughout the Horseshoe area show smooth and regular slopes in the high-resolution bathymetry and circular bases. Some cones display sharp, circular summit depressions which can be interpreted as summit craters resulting from (a) an explosive volcanic activity or (b) minor collapse (e.g., pit craters). In subaerial volcanic settings, summit craters are usually associated with explosive volcanic activity that results in the formation of monogenetic volcanic edifices [e.g., cinder cones, spatter cones, tuff rings, tuff cones; Acocella 2021]. High-resolution geomorphological studies on deep submarine volcanic cones have also highlighted the presence of summit craters [e.g., Davis and Clague 2006, Chadwick et al. 2008, Minami and Ohara 2018, Nomikou et al. 2012, Cronin et al. 2017, Iezzi et al. 2020]. In submarine volcanic settings, the interactions of magma with seawater and the effects of pressure and temperature mean that explosive eruptions are less common, but not impossible [Head and Wilson 2003, White et al. 2015b].
We were able to correlate some of the geomorphological features mapped on the bathymetry with the in-situ visual facies. That is the case for the areas of Rough Relief, which appear to match the visual facies Fa4. Yet, the morphologies we observe in these areas are complex and likely result from different processes. They are thus difficult to interpret confidently based solely on images and videos from a subvertical 2D camera. Nevertheless, we propose that these features are also the result of different volcanic processes, some of which could be of effusive origin.
Features at scales below the resolution of the AUV bathymetry (∼1 m) cannot be regionally extrapolated using only local in-situ observations. That is the case for Fa3 regions, that we interpret as “talus”, as observed at other submarine areas [e.g. West Mata, Chadwick et al. 2019]. Here we make no distinction as to their origin (e.g. lava dome talus, rock-fall talus, lava flow levee rubble) as they are found at the base of cliffs, along sloping areas, or within chaotic volcanic outcrops.
That is also the case for visual facies Fa1 and Fa2, that are both composed of deposits that are too fine to be associated to a specific sub-texture, and hence all correspond to a smooth texture on the bathymetry. At the Horseshoe area, visual facies Fa1 and Fa2 correspond to fine and coarse clastic deposits that can be interpreted as pyroclastic deposits (Berthod, Gurioli, Komorowski, MAYOBS 15 cruise unpublished report, https://doi.org/10.18142/291). Such volcanic facies have already been observed at other submarine settings [e.g. West Mata, Chadwick et al. 2019; North Arch volcanic field, Davis and Clague 2006; Gakkel Ridge, Sohn et al. 2008].
Hence, based on visual observations, preliminary dredge results and on the morphological comparison of the volcanic cones mapped at the Horseshoe area combined with those observed at submarine volcanoes elsewhere, we infer that some of the volcanic cones that we observe are likely to result from explosive activity. We also propose that the wide ridge WR1 might be the result of the combination of explosive and effusive volcanic processes, as suggested by the elevated morphology of the cones, the presence of summit craters and the presence of several coalesced cones. We thus interpret this ridge as the cumulative result of the activity along an eruptive fissure.
The focus of our study, and the most striking feature that we observe in the area is the Horseshoe edifice itself. We infer that this structure may have been emplaced during a large explosive eruption, based on its overall sub-circular shape at its base (∼4 km in diameter), with smooth and regular slopes (Figures 4, 6), similar to that of the other volcanic cones mapped in the area. It is also consistent with the presence of fine and coarse likely pyroclastic deposits which are visible throughout the study area, suggesting its formation as a large tuff cone. The Horseshoe’s summit is now marked by a clear U-shaped rim that shows strong variations at very small scales. The western part of the rim is characterized by a steep scarp clearly disrupting BT1 and indicating a collapse stage postdating the emplacement of this BT1 unit. The morphology of the southern part of the rim is different: the associated slopes are much smoother and more gently dipping than to the west of the rim. The kinked, eastern part of the Horseshoe’s rim shows steeper slopes but is covered with narrow lava flows (NR 1–9). While this part of the rim is also reminiscent of some type of collapse processes, our interpretation is blinded by new volcanic features that emplaced over the original rim. We propose that the overall morphology of the Horseshoe edifice could be the result of complex vertical and/or lateral collapse processes, followed by new constructional volcanism.
5.2. Relative chronology and geological history of the Horseshoe area
Our multiscale study also provides preliminary constraints on the chronological evolution of the seafloor morphologies and the interactions and timing of the different volcano-tectonic processes identified. We propose a simplified relative chronology of eruptive events, based solely on geomorphological cross-cutting relationships (Figure 9). Other relevant multidisciplinary data (e.g., petrology, geochemistry, textural analysis of dredge samples) are currently the scope of other projects and will be published in the future. Here we discuss some of the main processes that have recurrently shaped the formation and evolution of the Horseshoe area within the East-Mayotte Volcanic Chain (EMVC).
(A–D) Interpreted simplified relative chronology of the eruptive events that occurred within the Horseshoe area, based solely on crosscutting geomorphological relationships. (E) Geomorphological map with seafloor features interpreted as in Section 5.1 (Cones in yellow, hummocky lava flows in blue, and areas of rough relief in green). We identify two main units: the Horseshoe edifice (purple) and a recent eruptive zone associated with scattered volcanic activity and explosive processes. (F) Summary of relative chronological time chart.
The first event we identify is the emplacement of the Horseshoe edifice, one of the most prominent geomorphological structures in the area on which other features have subsequently developed (Figure 9a). The geometry of the Horseshoe’s collapse scar and the distribution of hummocky lava flows (bumpy terrains), provide temporal constraints on their emplacement. The westernmost hummocky lava flow (BT1) is clearly cross-cut by the rim of the Horseshoe edifice (Figure 9b). This indicates that this lava flow postdates the formation of the Horseshoe edifice, emplaced on its flanks, but predates the Horseshoe’s collapse stage (Figure 9c). The northernmost hummocky lava flow (BT5) was emplaced within the Horseshoe’s depression, thus clearly postdating the collapse stage (Figure 9d).
Subsequent volcanic features do not display clear cross-cutting relationships and hence their subsequent relative history is not as well defined. In particular, it is not possible to clearly determine if the Horseshoe edifice and all other seafloor features are coeval or their emplacement postdated the formation of the Horseshoe edifice. Hence, these are grouped as part of a “recent eruptive zone” resulting from a recent eruptive fissure (WR1) that likely emplaced over older seafloor (Figure 9e). The volcanic cones with morphological features that lack evidence of erosion were emplaced on top or on a subparallel alignment to this recent eruptive fissure (SC 1–SC 3). The close association of these features suggests that volcanic activity at local scales may be controlled by larger scale pre-existing structures (e.g., faults, ring faults of a possible older postulated caldera). The other two volcanic cones (C1–C2) that are emplaced west and within the Horseshoe edifice are aligned with the recent eruptive fissure and imply a structural control of the subseafloor pre-existing structures on the emplacement of new volcanic material. Another recent volcanic event is associated with the emplacement of narrow lava flows mapped on the eastern rim of the Horseshoe along the eruptive fissure (NR 1–9). These features formed both within the Horseshoe’s depression and on the outside along its eastern outer flank. These lava flows are thus likely emplaced after the collapse stage, as they appear to flow over mass-wasted deposits.
Lastly, the massive volcanic outcrops mapped as RR1–RR5 north of the Horseshoe’s floor have peculiar morphologies and lack clear cross-cutting relationships to provide clues regarding their timing. Given the complex and chaotic structure of these outcrops, it is possible that they formed at the time of the Horseshoe collapse stage and might correspond to outcrops of partially buried volcanic features. The spur region (RR6), south of the Horseshoe could either be: (a) a young lava dome that formed directly after the collapse stage; (b) a lava dome or lava flow emplaced later, after the collapse stage due to resumption of eruptive activity within the depression; or (c) pre-collapse older host-rock uplifted by magma movement at shallow depth [Fouquet et al. 2018].
5.3. Implications for the recent seismo-volcanic crisis
The regional morphology of the eastern upper submarine slope of Mayotte Island suggests that caldera collapses may have occurred in the past in the Horseshoe area. The area is located on the southern boundary of what is believed to be the remnant of former large caldera structure (∼10 km wide) [Figures 1b and 2; Feuillet et al. 2021]. It also lies directly above a major seismic swarm that was recorded during the seismo-volcanic crisis and that was likely associated with the drainage of a deep magma reservoir that fed the recent Mayotte eruption ∼40 km to the east [Cesca et al. 2020, Lemoine et al. 2020, Berthod et al. 2021a, Feuillet et al. 2021, Jacques et al. 2021, Mercury et al. 2022].
While no sign of eruptive activity was detected on the upper submarine slope since the submarine eruption began in 2018, this study clearly shows that the Horseshoe area has been volcanically active in the recent past. Moreover, the multibeam echosounder surveys have documented active fluid emission sites throughout the area [Scalabrin et al. in preparation; REVOSIMA 2019–2022]. These fluid emission sites are located within and north of the Horseshoe’s depression with an apparent progression of new emission sites northwards, southwards and away from the Horseshoe edifice itself [Bulletin 45 du 1 au 31 Août 2022, REVOSIMA 2019–2022]. This supports the idea that the Horseshoe area might be one volcanic field on the boundary of a larger scale volcano-tectonic structure, reusing previous subvertical zones of weakness as pathways for new volcanic and hydrothermal emissions.
While Mayotte’s eastern upper submarine slope has not experienced any volcanic activity since 2018, this area is important for understanding and forecasting the potential long-term evolution and consequences of the current eruption. For example, a potential future scenario could include a new caldera collapse due to the drainage of the deep magma reservoir beneath this area. Given the uncertainties, the impacts of such a scenario are currently difficult to quantify and are the subject of ongoing geological scenarios elaboration and numerical modelling. Alternative scenarios could involve renewed explosive or effusive eruptive activity in the Horseshoe area or even the reactivation of the magmatic plumbing system that was responsible for Holocene explosive subaerial volcanic activity on Petite-Terre and on the north side of Grande-Terre on Mayotte.
6. Conclusions
This study of Mayotte’s eastern submarine slope aims to characterize the types and chronology of previous volcanic activity, the interactions between tectonic and volcanic activity in the area, and the relation to deep seismicity beneath it. This paper focuses on the Horseshoe area, a submarine volcanic field located ∼10 km east of Mayotte Island.
Using a multiscale high-resolution mapping approach, we discuss the nature of the observed volcanic features and propose a relative chronology of eruptive events in the area. We identify different volcanic textures including volcanic cones, hummocky terrains and lava flows. The observed morphologies likely result from both effusive and explosive volcanic processes. The Horseshoe edifice is a 4 km wide volcanic cone that underwent a major collapse, resulting in the formation of a 2 km wide depression opened to the north. Its collapse scar clearly cross-cuts hummocky lava flows and shows the emplacement of younger lava flows emanating from the rim. The Horseshoe edifice likely predates the emplacement of a prominent E–W trending volcanic fissure zone, that is associated with a series of volcanic cones that are also aligned E–W. The formation of this diverse set of volcanic features in the Horseshoe area may be related to their location on the southern rim of a proposed caldera structure. We plan on improving our understanding of the nature of the Horseshoe area through analyses of additional imagery and through the correlation of this study with on-going petrological and geochemical studies. A fuller understanding of the volcanic hazards that this area poses will have to await until then, but for now, this study has documented that the Horseshoe area has been volcanically active in the recent past and has experienced both effusive and explosive eruptive activity. Its location above the deep seismicity observed since 2018 suggests that the features that we have mapped may be earlier deposits from the same deep magmatic system that fed the 2018 eruption at Mayotte.
Conflicts of interest
Authors have no conflict of interest to declare.
Acknowledgements
MAYOBS 1 cruise was funded by the CNRS-INSU TELLUS MAYOTTE program (SISMAYOTTE project). MAYOBS 1, 4, 15, 17 cruises were conducted by several French research institutions and laboratories (IPGP/CNRS/BRGM/IFREMER/IPGS). All marine operations are performed as part of the MAYOBS set of cruises (https://doi.org/10.18142/291) and we thank the captains and crews of the R/V Marion Dufresne (TAAF/IFREMER/LDA), R/V Pourquoi Pas? (GENAVIR/IFREMER, SHOM), Beautemps-Beaupré (SHOM), Gauss (FUGRO), and the scientific parties of the different cruises. We thank the mission chiefs of the MAYOBS cruises (E. Rinnert, N. Feuillet, Y. Fouquet, S. Jorry, I. Thinon, E. Lebas, F. Paquet) for conducting marine operations that benefited this study. Analyses were funded by the Service National d’Observation en Volcanologie (SNOV, INSU) and the Réseau de Surveillance Volcanologique et Sismologique de Mayotte (REVOSIMA), a partnership between the Institut de Physique du Globe de Paris (IPGP), the Institut Français de Recherche pour l’Exploitation de la Mer (IFREMER), the Bureau de Recherches Géologiques et Minières (BRGM), the Centre National de la Recherche Scientifique (CNRS) and the REVOSIMA consortium. The REVOSIMA’s operational daily monitoring is under the responsability of the Piton de la Fournaise volcanological observatory (OVPF-IPGP). We thank A. Peltier (OVPF-IPGP) and C. Mucig (BRGM Mayotte) respectively the Operational Leader and Co-leader of the REVOSIMA. Since June 2019, all activities on Mayotte are funded by le ministère de l’Enseignement Supérieur, de la Recherche et de l’Innovation (MESRI), le Ministère de la Transition Ecologique (MTE), le Ministère des Outremers (MOM), with the support of the Ministère de l’Intérieur (MI), the Ministère des Armées, the DIRMOM (Direction Interministérielle aux Risques Majeurs en Outremer) and the MAPPPROM (Mission d’appui aux politiques publiques pour la prévention des risques majeurs en Outremer). We thank the IPGP for general funding to the Observatoires Volcanologiques et Sismologiques (OVS). The data contributes to the Service National d’Observation en Volcanologie (SNOV). The authors would like to thank E. Humler for his support and national funding coordination (CNRS, REVOSIMA). Lastly, we also thank the editors and the two reviewers for their comments that helped us clarify and improve this manuscript.