


 CC-BY 4.0
1. Introduction
Chars are solid residues resulting from the carbonization process. During this process, which is a pyrolysis of organic matter, the heteroatoms of the precursors escape in the form of water and gas and the molecular structure becomes aromatic [Oberlin 1989; Rouzaud et al. 2015]. For example, charcoal is a well-known char that can form in a fireplace where wood is sufficiently protected from oxygen, thus preventing complete combustion, and carbonizes under the effect of high temperatures produced by the combustion reaction. The same applies to other organic precursors. Chars such as charcoal, charred meat and charred fat can be found in anthropogenic fireplaces and provide precious information for archaeologists. Their characterization is important for studying the ways of life of prehistoric humans. They provide data such as the type of fuel used and the eating habits of the ancient occupants of archaeological sites. Furthermore, in the search for early traces of fire domestication, chars are among the fire indicators, along with ashes, burned bones, soot, heated sediments, heated artifacts and lithics that may argument for the anthropic use of fire, according to the archaeological context. Raman micro-spectroscopy is particularly well suited to the study of archaeological chars. It is very sensitive to the aromatic nanostructure of carbon compounds and has the advantage of being non-destructive. Moreover, it requires only a small sample mass (a few μg) and has a spatial resolution in the micrometer range. At the atomic scale, chars are made up of elementary bricks called Basic Structural Units (BSU) [Oberlin 1989], which correspond to a turbostratic stacking of polyaromatic sheets whose dimensions depend on the formation temperature. A Raman spectrum of char is mainly composed of two bands called D and G bands, located around 1360 cm−1 and 1600 cm−1, respectively. The G band is associated with the vibrational modes of the sp2 hybridized carbons of the aromatic rings, and the D band is associated with the vibrational modes of the aromatic ring edges [Ferrari and Robertson 2000]. At first sight, the presence of these two bands in a Raman spectrum demonstrates the carbonized status of a material. For instance, Raman analysis can be used to characterize charred bones, the char Raman signal being produced from the carbonized soft tissues (flesh, fat, collagen, etc.) present in or on the bone, giving them their black color. This can be useful to attribute the black color of an archaeological bone to heating and not to a coating of manganese oxides, sometimes induced by diagenesis.
Furthermore, the height of the D band in a Raman spectrum of charcoal increases monotonically with the carbonization temperature between 500 and 1200 °C [Deldicque et al. 2016]. Based on this phenomenon and by studying a homogeneous series of pine wood charcoals, Deldicque et al. [2016] developed a Raman palaeothermometer capable of determining wood charring temperatures from the HD/HG band height ratio. This palaeothermometer can then be used to retrieve the temperatures produced by events that have led to the formation of charcoals, such as forest fires, anthropogenic fires or pyroclastic flows. For example, the Raman thermometry method has been successfully applied to determine the maximum temperatures attained during the Notre-Dame de Paris fire on 15 April 2019, based on the oak charcoal remaining after the fire was extinguished [Deldicque and Rouzaud 2020]. This method has also been adapted to estimate temperatures generated on fault planes following experimental earthquakes [Aubry et al. 2018].
In addition, a Raman spectrum can provide other information, for example on the nature of the organic precursor of the char. The intensities, positions and bandwidths in the Raman spectrum of a char are dependent on its nanostructure (nanoscale organization), which depends on the charring temperature and the chemical composition of the organic precursor [Rouzaud et al. 2015]. Through a detailed analysis of the Raman spectrum, it becomes possible to distinguish the vegetal or animal nature of the organic precursor. For example, Lambrecht et al. [2021] were able to make this distinction, in particular by plotting the G band position as a function of the HV/HG band height ratio (HV being the height of the valley between the D and G bands, at around 1500 cm−1, see Figure 2 below). This approach is promising, particularly in the field of archaeology for identifying residues of fire use. Firstly, when applied to chars having a similar morphology, such as the glassy and globular morphology of charred flesh and fat fragments [Goldberg et al. 2009], as well as vitrified charcoal [McParland et al. 2010], and, secondly, when chars are so small or degraded that their characteristic morphology is no longer recognizable.
It would be tempting to use these Raman methods on very ancient chars. The Deldicque et al. [2016] thermometer could be useful for determining the temperatures of ancient fires or estimating the emplacement temperatures of ancient pyroclastic flows from the trapped vegetation transformed into charcoal. The method of distinguishing precursors proposed by Lambrecht et al. [2021] could be applied to chars found on very ancient archaeological sites to identify the nature of the charred material found there (bones, flesh and wood) even when alteration has fragmented, dispersed and erased all the morphological features allowing the identification of precursors. However, chars are subject to post-depositional environmental conditions that can lead to strong chemical alteration. One of these chemical alteration processes is oxidative weathering. Oxidative weathering occurs when a material is modified by the oxygen present in its environment at low temperature. Studies on archaeological charcoal and ancient pyrogenic carbon present in soils have shown that the carbonized organic matter is systematically oxidized to a certain extent [Cheng et al. 2008; Ascough et al. 2011]. Carbonyl groups, including carboxyl and carboxylate (COOH and COO−, respectively), were grafted onto the aromatic rings. Indeed, chars have a disordered and porous nanostructure [Rouzaud et al. 2015], with multiple access points for possible chemical interactions, in particular on the edges of the BSU, where heteroatoms and oxygenated groups remaining after the carbonization process are located [Rouxhet et al. 1979; Oberlin et al. 1980; Oberlin 1989].
Given that Raman spectrometry is a technique sensitive to variations in the chemical composition and nanostructure of materials, we may wonder if it is reasonable to apply the simple methods of Deldicque et al. [2016] and Lambrecht et al. [2021] to ancient chars. These materials have sometimes been weathered and most likely oxidized over periods of several millennia, or even hundreds of thousands of years. Indeed, these methods would also be impacted if the heights and positions of the Raman bands were modified. For example, if oxidation leads to modification of the D band height (and thus the HD/HG ratio) in a charcoal spectrum, it would no longer be possible to use the Deldicque et al. [2016] paleothermometer, as this would over- or underestimate the charcoal formation temperature. If oxidative weathering were able to shift other parameters such as band positions, it is unclear how this might impact the method of Lambrecht et al. [2021], which uses a plot of the G band position as a function of the HV/HG ratio to distinguish between the animal or vegetal origin of organic precursors. In the field of archaeology, this problem is crucial since both types of precursors can be found on an archaeological site; Animal and vegetal chars should not be confused since they each carry different information for archaeologists.
To date, the effects of oxidative weathering on the modifications of the Raman spectra of chars are poorly known and therefore probably underestimated. Moreover, in several studies, some Raman spectra of archaeological charcoal show Raman characteristics that are obviously different from the spectra of modern unweathered charcoal. For example, in the Raman spectra of archaeological charcoals (35–90 ka BP) analysed by Lambrecht et al. [2021], the height of the D band is often found to be higher than in the experimental unaltered wood charcoal spectra. In the Raman spectra of wood charcoals incrusted in Polish Neolithic ceramics, Łaciak et al. [2019] noted that the D band position is sometimes shifted towards higher wavenumbers, up to 1380 cm−1, while it is always lower than 1370 cm−1 in the spectra of pine, poplar or oak wood charcoals produced under laboratory conditions (inert atmosphere), with production temperatures between 500 and 1200 °C [Deldicque et al. 2016; Deldicque and Rouzaud 2020]. The same trend can be observed in the Raman spectra obtained from wood charcoal on parietal paintings in the Rouffignac cave (16 ka BP, France): the D band position can reach 1390 cm−1 [Lahlil et al. 2012].
To gain insight into these problems, it is essential to evaluate the changes in the Raman spectra of chars due to oxidative weathering as these effects could lead to serious misinterpretation if not taken into account. In this study, Raman spectra of ancient chars of animal and wood origin are compared with the spectra of newly produced and chemically unaltered (i.e. unoxidized) experimental chars to determine the changes in Raman parameters due to natural oxidative weathering. The experimental chars were produced between 500 and 1000 °C, to ensure that the variations observed in the Raman spectra of the archaeological and potentially altered chars are not due to those normally generated by the carbonization process, which also modifies the Raman parameters in this temperature range. We investigate whether the methods for Raman-based precursor identification are applicable to archeological weathered chars. In this article, we present a special case study of carbonized residues from a hearth of the Bruniquel cave (176 ka BP, France), where the origin of some precursors cannot be clearly and unambiguously identified using the morphology of the chars. To provide elements of comparison and improve our understanding, a series of chars were experimentally oxidized by incubation to simulate natural oxidation in humid environments. In this way, we aim to assess the impacts of oxidation on the Raman spectra of chars. Finally, we test if the Raman thermometry method, developed with modern and unaltered charcoal, is still applicable to weathered and probably oxidized charcoal. As an example, we try to access the carbonization temperature of wood charcoal formed in a pyroclastic flow of the Puy Chopine volcano in Auvergne, formed about 10,000 years ago.
2. Materials and methods
2.1. Experimental unaltered chars and ancient chars
The experimental modern samples studied in this study are pine charcoal (Pinus sylvestris) and animal flesh chars from beef tenderloin (meat and fat) and charred rabbit bones. These species were common in the Paleolithic period on European sites and they are readily available in modern supermarkets and forests. The samples were produced experimentally in the laboratory according to the same protocol used in Deldicque et al. [2016] and Deldicque and Rouzaud [2020]. Pieces of organic precursor (about 1 cm3) were deposited in a platinum crucible and then placed in an oven previously heated to the targeted temperature and under a controlled atmosphere (continuous flow of argon). The carbonization of samples was carried out with a one-hour plateau at the targeted temperature. Carbonization temperatures were 500, 600, 700, 750, 800, 900 and 1000 °C for charcoals and 500, 600, 700, 800 and 900 °C for animal chars. We chose not to carry out carbonization below 500 °C because the Raman spectra of chars produced below this temperature display too much fluorescence to be properly processed. The absence of oxygen is necessary to produce non-oxidized chars. The production of charcoal in the presence of a small amount of dioxygen (2%) is however possible for carbonization temperatures not exceeding 600 °C as showed in Ascough et al. [2011] but would be tantamount to oxidizing the freshly produced carbonized material, which would lead to an experimental bias concerning the objectives of this study. Indeed, heating in air is a classical oxidation process of organic materials [Ferreras et al. 1993].
The ancient charcoals come from the Chauvet cave (34 ka BP), the Bruniquel cave (176 ka BP), the Caune de l’Arago cave (560 ka BP) [Deldicque et al. 2021] and from a pyroclastic flow of the Puy Chopine volcano (9.7 ka BP). The ancient animal chars are archeological charred bone fragments from hearths located in the “Grande and Petite Structure” of the Bruniquel cave [Rouzaud et al. 1995; Jaubert et al. 2016], as well as from the Mandrin Cave (∼54 ka BP, France—Slimak et al. [2022]—from a sediment sample collected near the principal hearth of layer E). Some of these samples are illustrated in Figure 1.
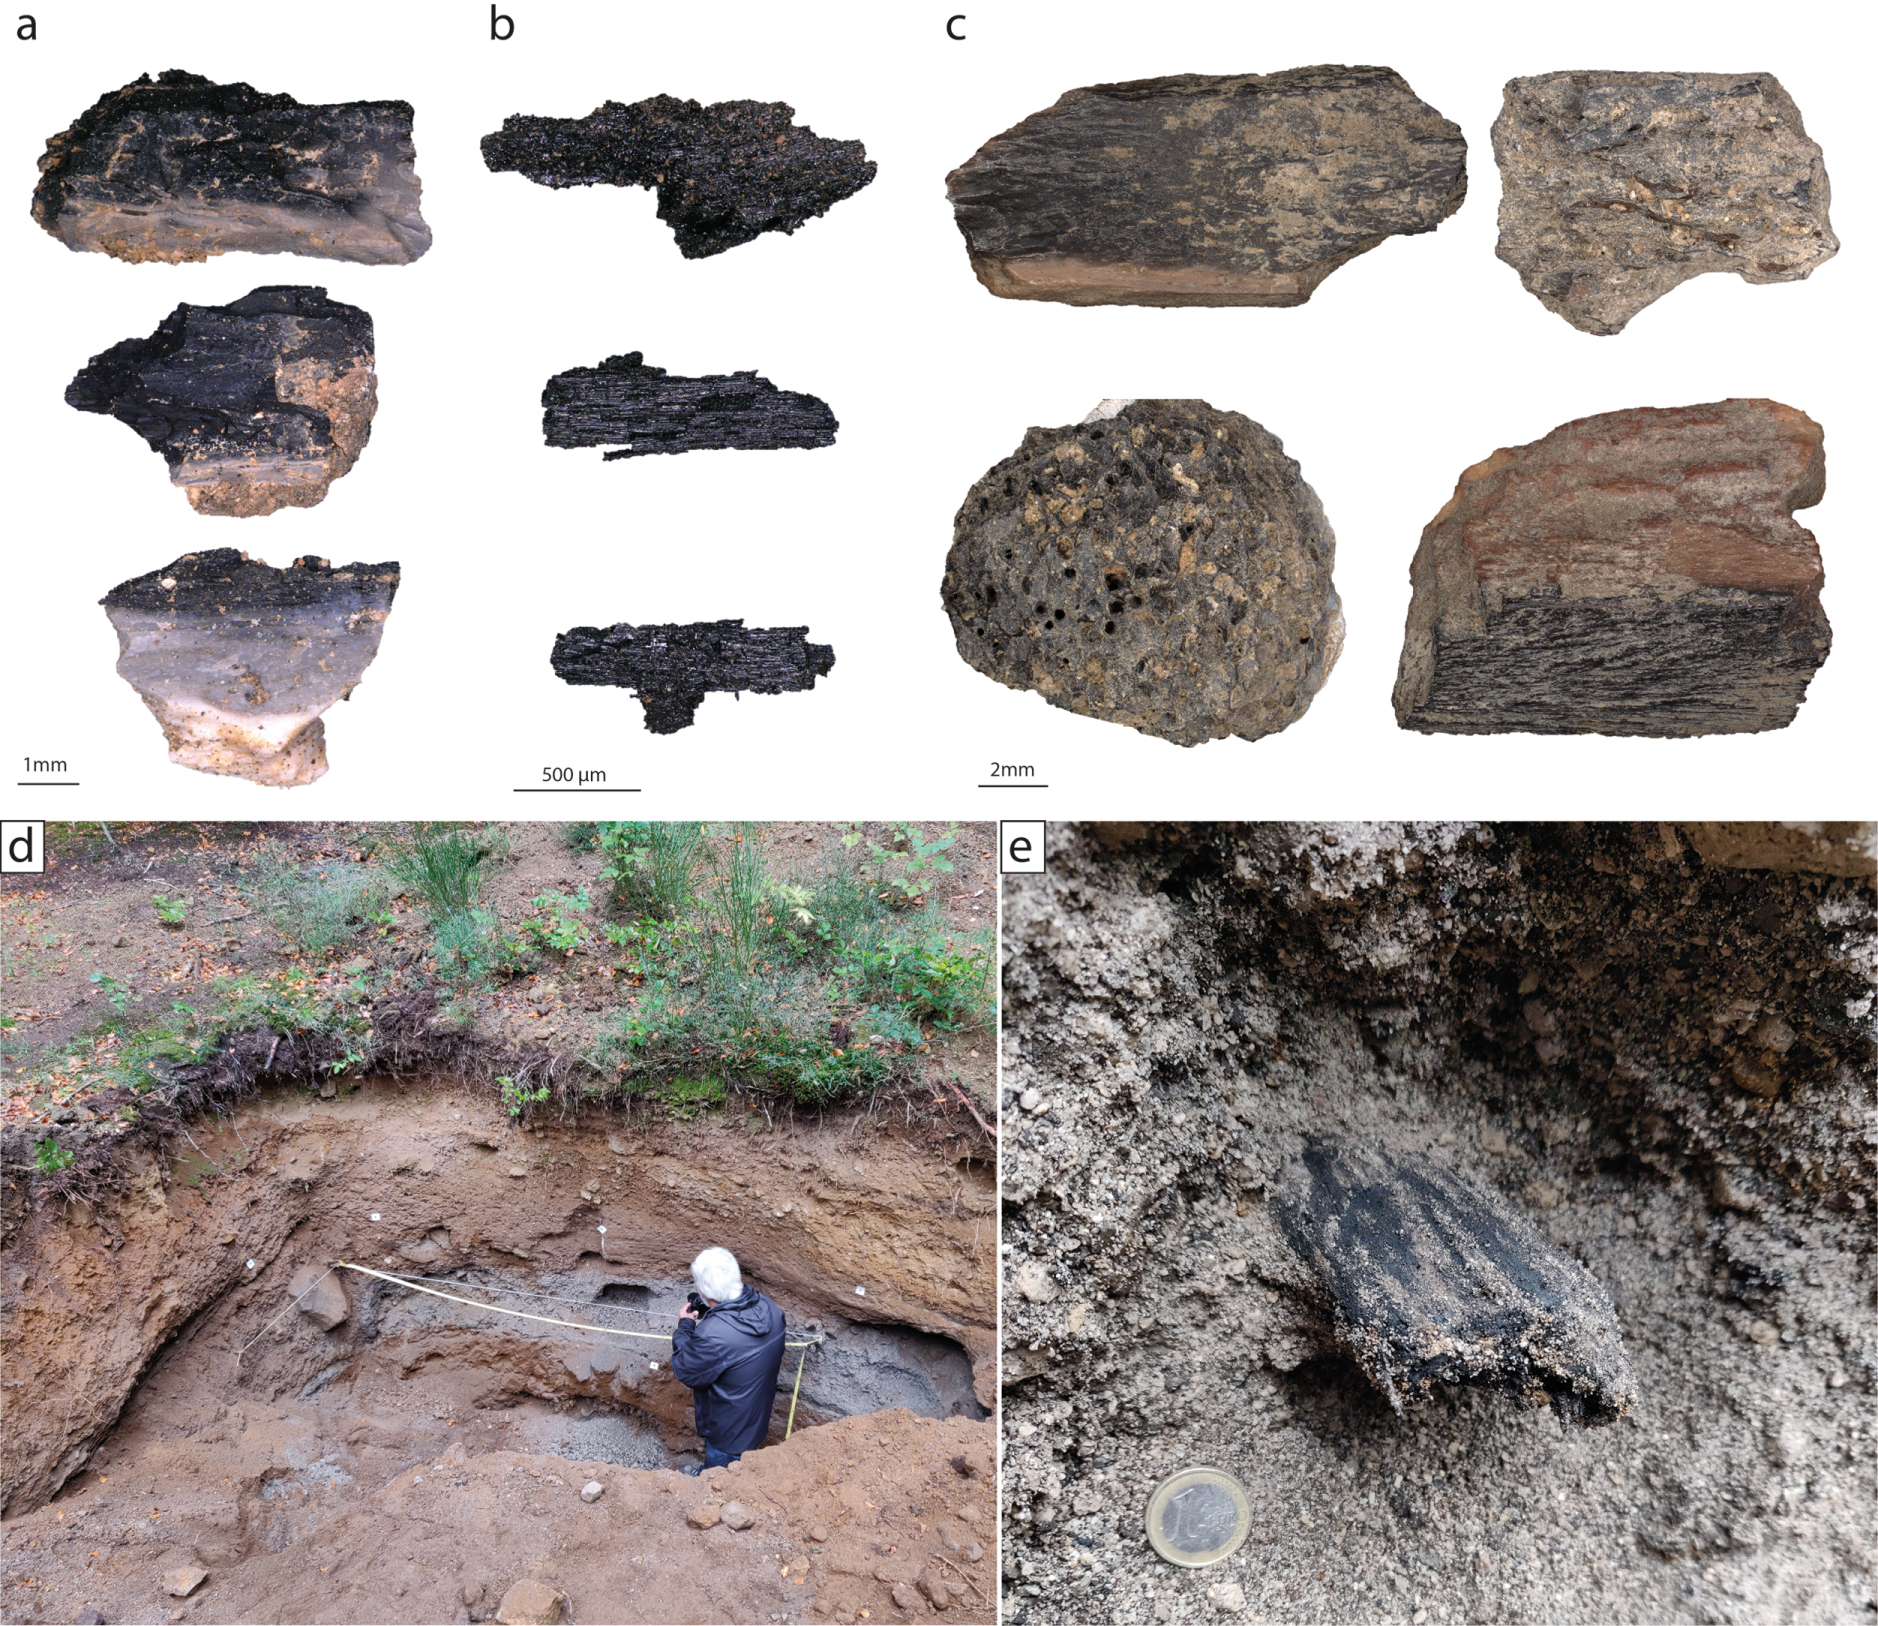
(a) Three different charred bone fragments and (b) Three different charcoals from a hearth of the Bruniquel cave; (c) Four different charred bone fragments from the Mandrin cave. (d) Ancient pyroclastic flow (grey layer) in which trapped vegetation was transformed into charcoal. (e) Charcoal form the grey layer in (d).
2.2. Acquisition and processing of Raman spectra
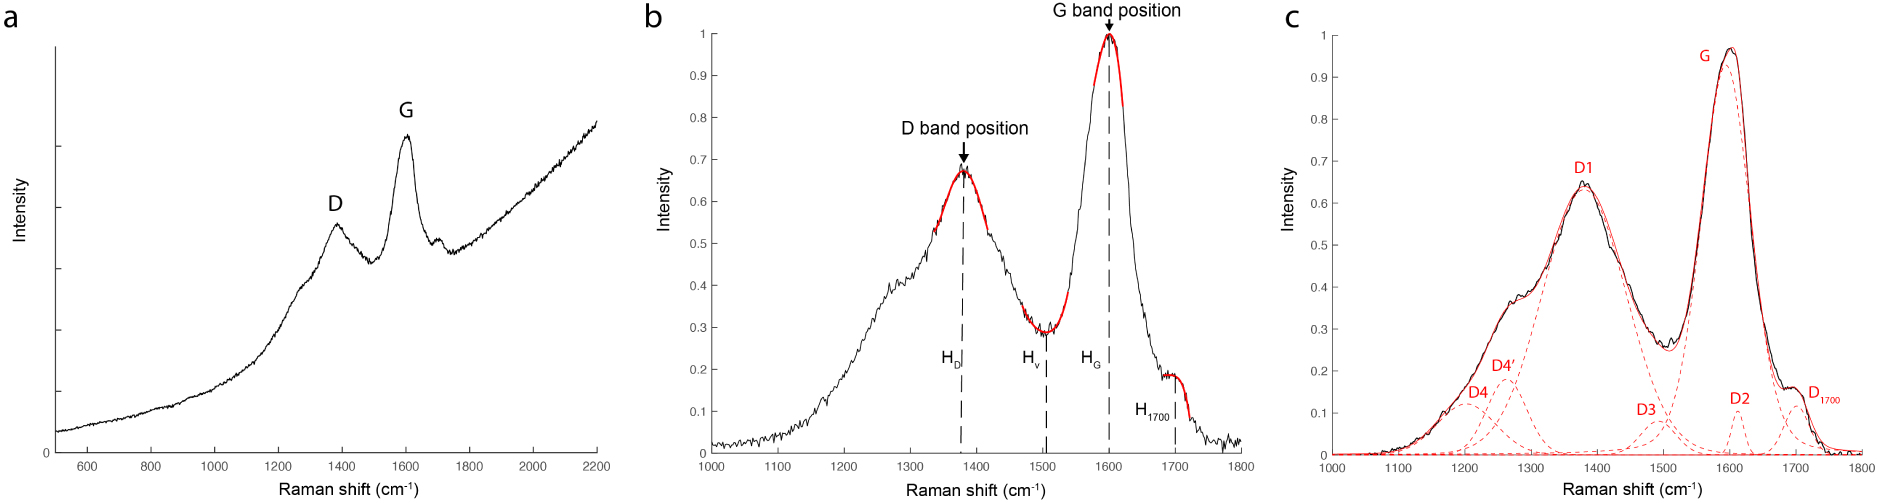
(a) Raw Raman spectrum of a charcoal from a hearth in the Bruniquel cave, with the main D and G bands. (b) Raman spectrum (a) after subtraction of fluorescence and normalization. Determination of the HD, HV, HG band heights and the D and G band positions from the portions of the curve represented in red. (c) Determination of the D1700 band intensity with a 7-band decomposition of the spectrum (b).
Raman spectra were recorded with a Renishaw InVia microspectrometer, equipped with a Cobolt diode laser with a 514 nm wavelength. The laser power was set at 0.5 mW and the acquisition time was 3 min. The recorded spectral range is 500 to 2200 cm−1. The spectral resolution is 1.8 cm−1. The samples were deposited on a thin glass slide. Ten analyses per sample were acquired. The procedure for processing the spectra is shown in Figure 2. Fluorescence was removed by performing a linear subtraction between 1000 and 1800 cm−1. Spectra with excessive fluorescence were discarded, as they remained too noisy after subtraction. All spectra were normalized with respect to the G band. In a first step, the D and G band heights, respectively named HD, HG, the height of the valley between the D and G bands at around 1500 cm−1 named HV as well as the D and G band positions, were determined automatically with a script developed in Matlab language, which consists of calculating the extrema of a polynomial curve passing in the vicinity of the peaks (Figure 2b). To obtain the intensity i1700 of the band located at around 1700 cm−1, associated with carbonyl groups [Socrates 2004] and whose presence would be indicative of a possible trace of oxidation, the spectra were decomposed with a 7-band method (Figure 2c). The positions of the bands are assigned according to the study by Sadezky et al. [2005], with the addition of the D4′ and D1700 bands especially for this study. These bands were added as Voight functions. The seven-bands decomposition method was used for all the chars. The bands D4, D4′, D1, D3, G, D2, D1700 are positioned at 1200 cm−1, 1260 cm−1, 1360 cm−1, 1490 cm−1, 1600 cm−1, 1610 cm−1 and 1700 cm−1, respectively.
2.3. Scanning electron microscopy and qualitative elemental analysis
To determine the elemental composition of some of the weathered chars from this study, qualitative analyses were performed with a ZEISS Zigma field emission gun scanning electron microscope equipped with an Oxford Instruments Energy Dispersive Spectrometer (EDS). The chamber vacuum is 2.50 × 10⁻⁶ mbars and the accelerated voltage is 15 kV. As weathered chars are no longer electrically conductive, the selected char fragments had to be previously coated with gold. It should be noted that this gold coating method still allows the acquisition of new Raman spectra after SEM-EDS analysis. By contrast, an amorphous carbon coating would yield a characteristic Raman signal consisting of an asymmetric band with a maximum width at 1500 cm−1 [Schwan et al. 1996], which would superimpose on the char spectrum and thus prevent any reliable exploitation.
2.4. Effects of aqueous oxidation on Raman spectra
The experimental chars were first crushed in an agate crucible and 10 mg were introduced into a plastic test tube with a lid, containing 3 ml of hydrogen peroxide (12% H2O2), which is a stable oxidant. The tubes were placed in an oven at a temperature of 90 °C to accelerate the reaction. Incubation times varied from 15 to 48 h. Drops containing the suspended solid chars were then deposited on a thin glass slide using a glass pipette, air-dried at room temperature, and analyzed by Raman microspectrometry. It should be noted that this kind of artificial ageing does not strictly represent the true conditions of natural oxidative weathering, which is evidently much slower. Nevertheless, this experimental approximation allows us to obtain oxidized chars produced at a known temperature, which can then be used to characterize the effects of aqueous oxidation on Raman spectra as a function of the char formation temperature.
3. Results
3.1. Raman spectra of experimental unaltered chars
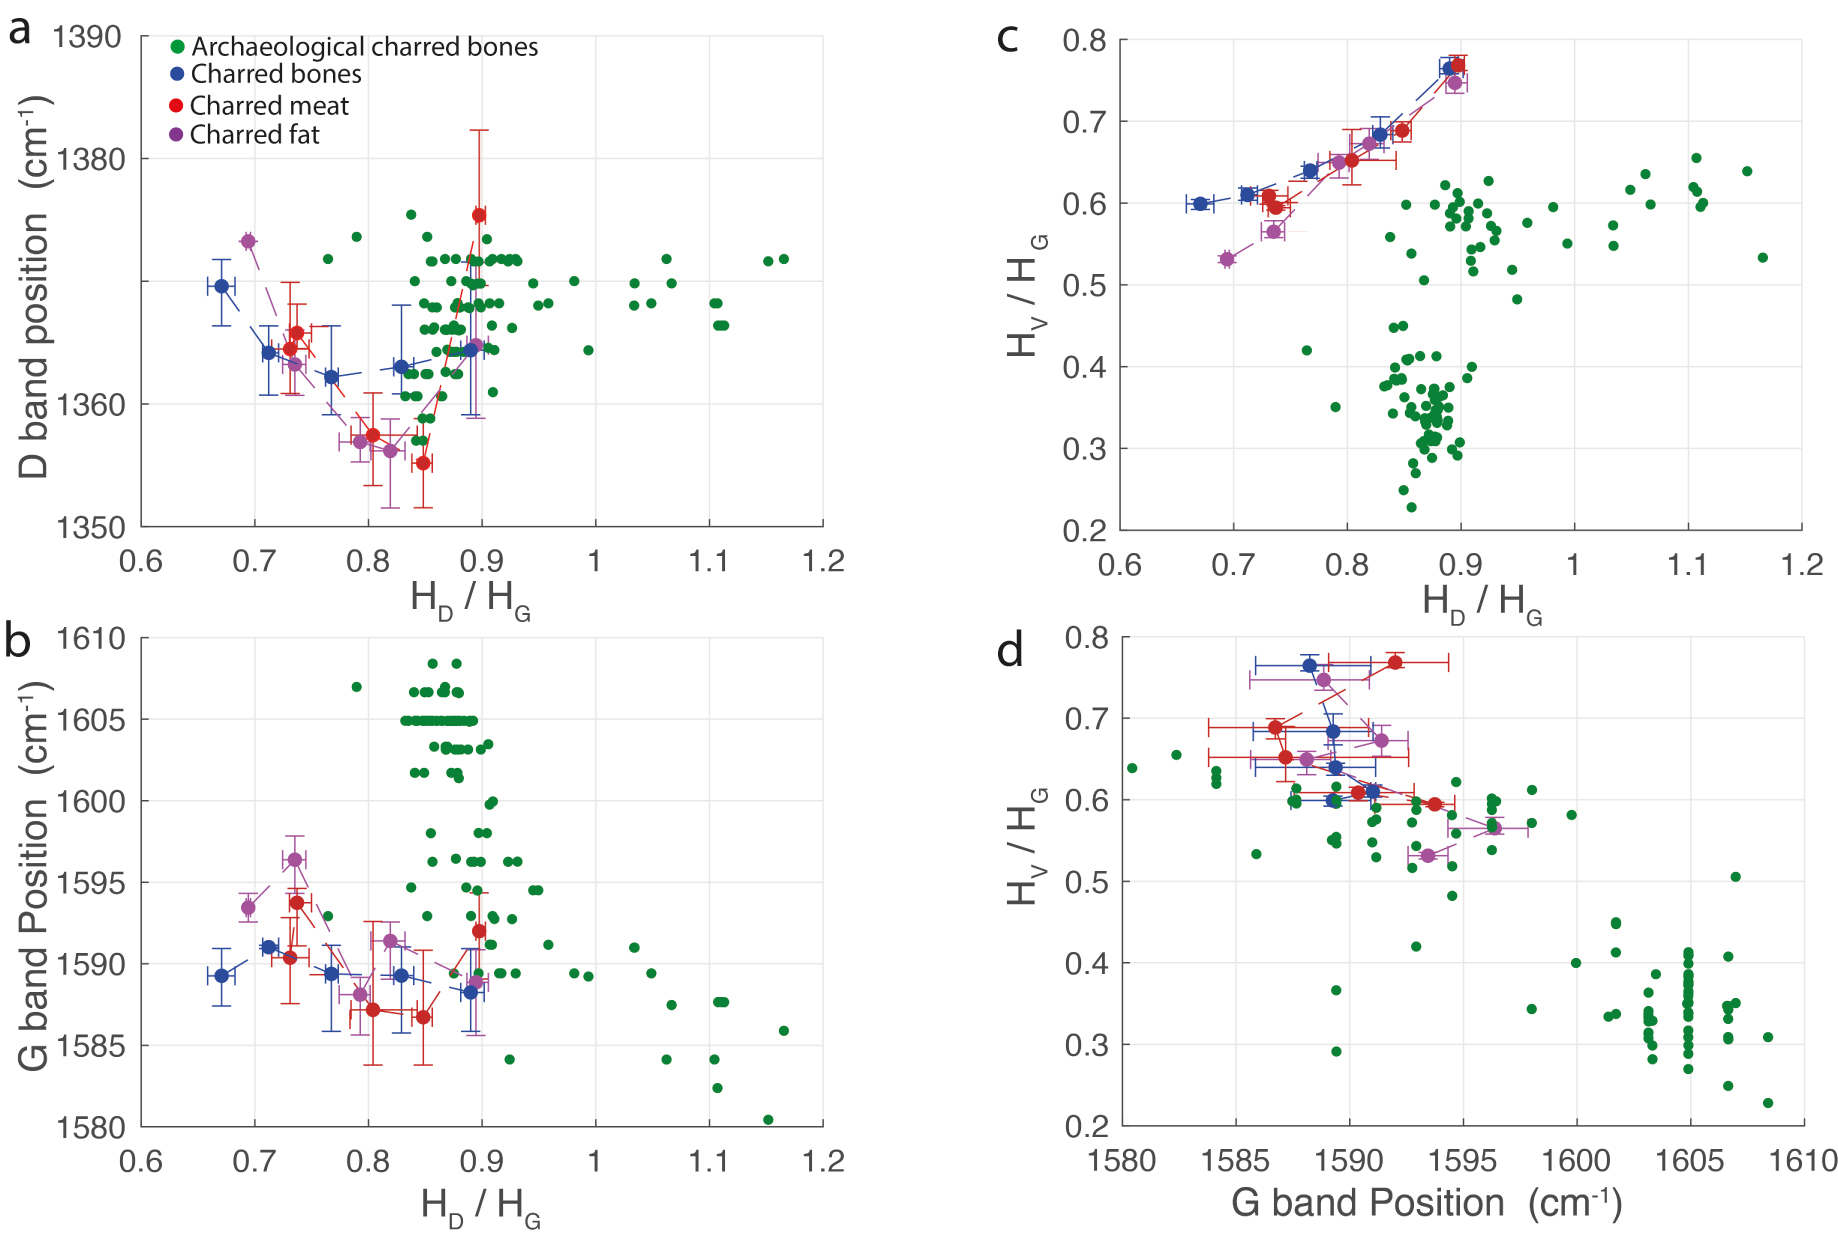
As already described for charcoal [Deldicque et al. 2016], the height of the D band in the spectra of char derived from bone, fat and meat increases monotonically with the charring temperature (Figure 3). This appears to be a universal signature characteristic of the carbonization of any organic precursor. To follow the evolution of the Raman parameters as a function of the carbonization temperature and the organic precursor nature, we plotted the D and G band positions and the HV/HG height ratio as a function of the HD/HG height ratio (Figure 4a–c), which is itself proportional to the carbonization temperature. For each parameter on the x and y-axis, the dots represent the average values and each error bar indicates the minimum and maximum values. The plots of the G band position as a function of the HD/HG ratio (Figure 4b) and the plot of the HV/HG ratio as a function of the HD/HG ratio (Figure 4c), distinguish the animal or vegetal origin of the experimental unaltered chars. These are new discriminant plots in addition to the already recognized plot of HV/HG versus the G band position (Figure 4d) highlighted by Lambrecht et al. [2021].

Raman spectra of experimental unaltered chars. (a) Charred bones. (b) Charred meat. (c) Charred fat. (d) Charred wood.
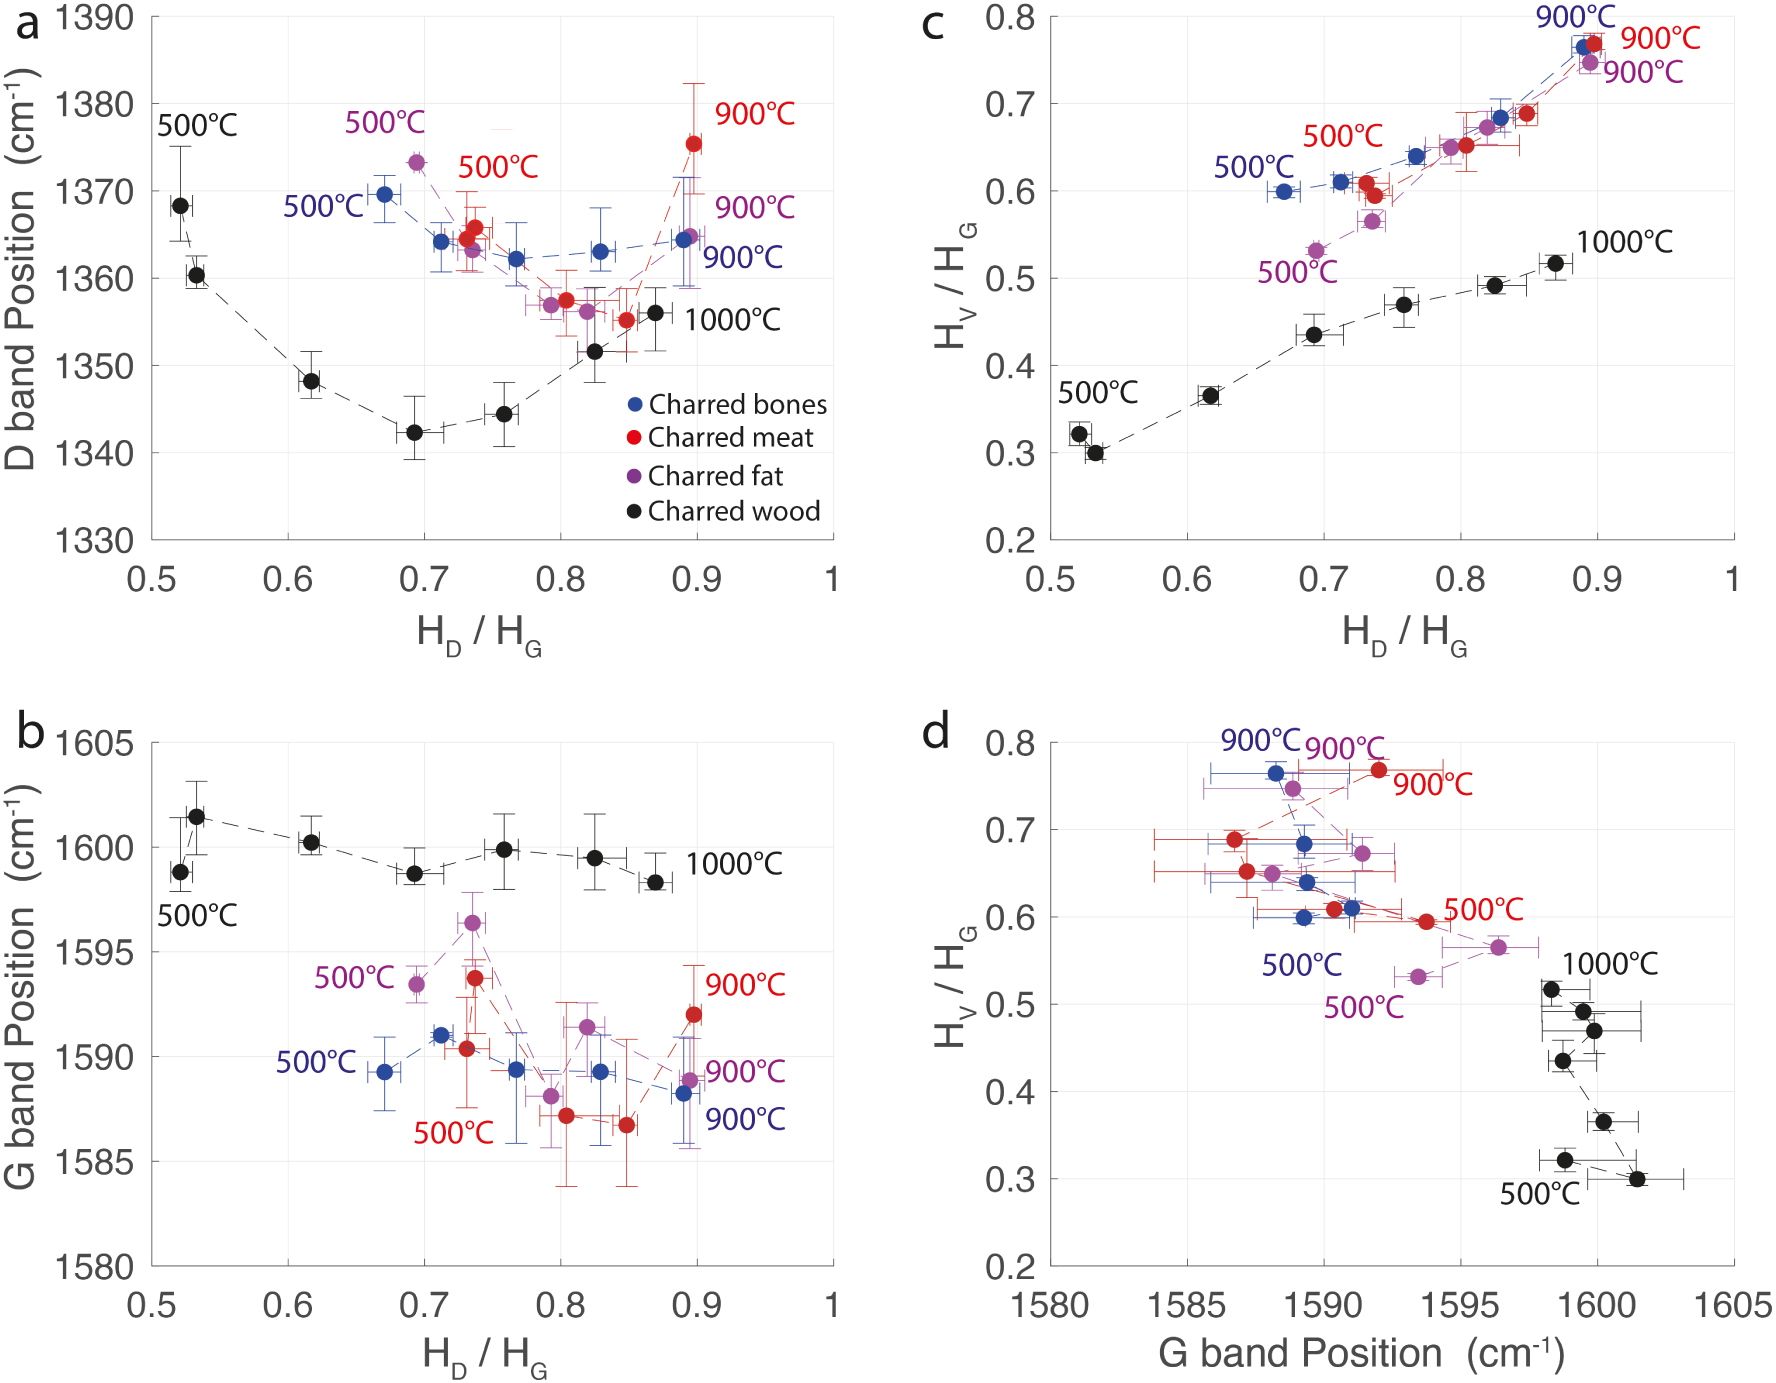
Evolution of Raman parameters of experimental unaltered charcoal produced between 500 and 1000 °C and Raman parameters of experimental unaltered charred bones, meat and fat between 500 and 900 °C. (a) D band position as a function of the HD/HG ratio. (b) G band position as a function of the HD/HG ratio. (c) HV/HG ratio as a function of the HD/HG ratio. (d) HV/HG ratio as a function of the G band position.
3.2. Comparison of Raman spectra of experimental and ancient chars
Here, we investigate the differences between the Raman spectra of experimental unaltered and ancient potentially oxidized chars of vegetal and animal origin. Figure 5 shows examples of Raman spectra of the reference experimental wood and animal chars compared with ancient chars. At first sight, and even if their general shapes are similar, the spectra of experimental unaltered and ancient chars are noticeably different. But before drawing any conclusions, it is essential to compare the Raman parameters of the ancient chars with the Raman parameters of experimental unaltered chars so as not to confuse variations caused by a potential oxidative weathering with those induced by carbonization (see Figure 4).
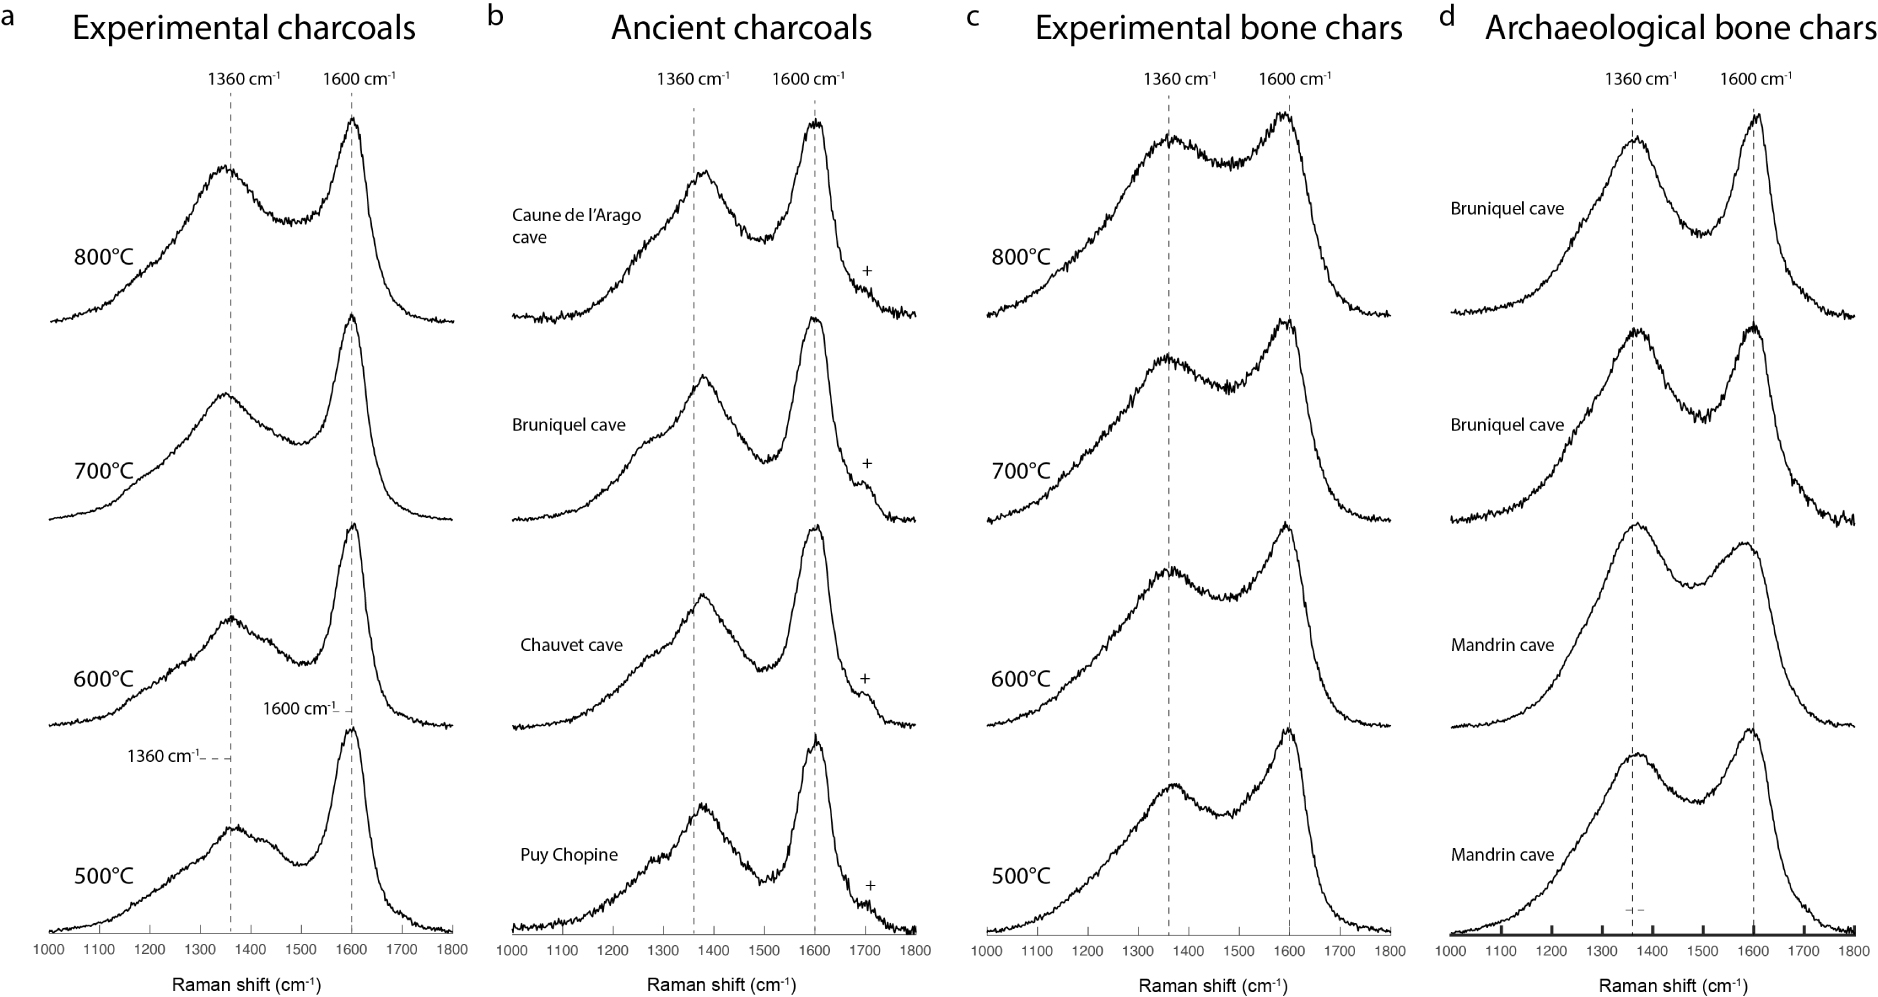
Comparison of the Raman spectra of experimental unaltered and ancient chars. The cross (+) indicates the presence of a band around 1700 cm−1. (a) Experimental unaltered charcoals carbonized between 500 and 800 °C with 1 h of plateau. (b) Ancient charcoals from the Chauvet, Bruniquel, Caune de l’Arago caves and a charcoal formed in the pyroclastic flow of the Puy Chopine volcano. (c) Experimental unaltered bone chars produced between 500 and 800 °C with 1 h of plateau. (d) Different archaeological charred bone fragments from the Bruniquel and Mandrin caves. Masquer
Comparison of the Raman spectra of experimental unaltered and ancient chars. The cross (+) indicates the presence of a band around 1700 cm−1. (a) Experimental unaltered charcoals carbonized between 500 and 800 °C with 1 h of plateau. (b) Ancient charcoals from the ... Lire la suite
3.2.1. Ancient charcoals
Ten different ancient charcoals were analysed per site (Chauvet-Bruniquel-Arago), yielding a total of 300 spectra. The variations of Raman parameters are shown in Figure 6. Each colored dot represents one single Raman analysis. The spectra of ancient charcoals show some particular characteristics that differentiate them from the Raman spectra of experimental unaltered charcoal. In ancient charcoal spectra, the D band position is always higher than 1370 cm−1 (Figure 6a). The HD/HG height ratio varies greatly, from 0.56 to 0.87 (Figure 6a), however, with its position being systematically shifted towards high wavenumbers, between 1372 and 1383 cm−1. For the same HD/HG height ratio, the height of the HV valley is less intense than in experimental unaltered charcoal spectra (Figure 6b). In ancient charcoal spectra, the G band position can be shifted towards high wavenumbers (Figure 6c), up to 1603 cm−1, while it does not exceed 1601 cm−1 in the spectra of experimental unaltered charcoals obtained between 500 and 1000 °C. The band at around 1700 cm−1, which is theoretically associated with the C=O bonds of carbonyl groups [Socrates 2004], is much more intense in ancient charcoal spectra (Figure 6d), whereas this band is only present—with a low intensity—in the spectra of experimental unaltered charcoals produced below 700 °C. Lambrecht et al. [2021] also observed the 1700 cm−1 band in the Raman spectra of charcoal (modern and archaeological). Modern unaltered charcoals and ancient charcoals can be distinguished using the plots of the D band position versus the HD/HG ratio, the HV/HG ratio versus the HD/HG ratio as well as the i1700/iG intensity ratio versus the HD/HG ratio.

Raman parameters of ancient charcoals compared to Raman parameters of experimental unaltered charcoals produced between 500 and 1000 °C. (a) D band position as a function of the HD/HG ratio. (b) HV/HG ratio as a function of the HD/HG ratio. (c) G band position as a function of the HD/HG ratio. (d) i1700/iG intensity ratio as a function of the HD/HG ratio.
3.2.2. Ancient animal chars
Ten charred bone fragments from the Mandrin and the Bruniquel caves were analysed, making a total of 100 spectra. Raman measurements performed on archaeological charred bones are considered as representative of ancient animal char since the Raman signal from charred bone is produced from material of animal origin, in particular from carbonized animal soft tissues (meat, fat and collagen). In Figure 7, each green dot represents one single Raman analysis. In the Raman spectra of archaeological animal chars, the HD/HG ratio can reach values above 1, whereas it varies between 0.66 and 0.90 for unaltered animal chars (Figure 7a). The G band position can be shifted towards high wavenumbers, up to 1608 cm−1, while it does not exceed 1598 cm−1 for the experimental unaltered animal chars produced between 500 and 900 °C (Figure 7b). In archaeological animal chars, the height of the HV valley can be significantly less intense than in experimental unaltered animal chars (Figure 7c) and the band at 1700 cm−1 (Figure 5d) is much more discrete than in ancient charcoal spectra. The plot of HV/HG ratio versus HD/HG ratio discriminates experimental unaltered animal chars from ancient animal chars.
Raman parameters of archaeological animal chars compared to Raman parameters of experimental unaltered animal chars produced between 500 and 900 °C. (a) D band position as a function of the HD/HG ratio. (b) G band position as a function of the HD/HG ratio. (c) HV/HG ratio as a function of the HD/HG ratio. (d) HV/HG ratio as a function of G band position.
3.3. Effects of weathering on the distinction between vegetal and animal chars
3.3.1. Search for relevant Raman parameters to discriminate the animal or vegetal origin of weathered chars
In this section, we investigate whether it is possible to distinguish the vegetal or animal origin of weathered chars using their Raman spectra and, in particular, using the plots that can clearly distinguish the vegetal or animal origin of the experimental unaltered chars (see Figure 4b–d). The reference spectra of weathered vegetal chars are spectra of the ancient charcoals from the Chauvet, Bruniquel and Caune de l’Arago caves. The reference spectra of weathered animal chars are spectra of archaeological charred bone fragments from the Bruniquel and Mandrin caves. In total, 300 weathered charcoal spectra and 100 weathered animal char spectra are shown here, with each dot representing one single Raman analysis. Figure 8 reports the Raman parameters of chars of animal and vegetal origin, using the following plots: the HV/HG ratio as a function of HD/HG ratio (Figure 8b), the G band position as a function of the HD/HG ratio (Figure 8c) and the HV/HG ratio versus the G band position (Figure 8d). In all these plots, the black (vegetal origin) and red dots (animal origin) overlap. Thus, none of these plots are able to discriminate with any degree of certainty the origin of ancient and altered char precursors. Other discrimination criteria must therefore be sought. It is remarkable that the carbonyl band, located at 1700 cm−1, is clearly present in spectra of ancient charcoal, whereas it is very weak and sometimes barely visible in spectra of ancient animal chars (see Figure 5). It also appears that the HD/HG height ratio is often higher in spectra of ancient animal chars than in ancient charcoal. Thus, we can separate the charcoal and animal chars into two distinct fields by plotting the intensity of the band at 1700 cm−1 as a function of the HD/HG height ratio (Figure 8e). Furthermore, it is noteworthy that the D band position in ancient charcoal spectra is globally shifted more towards higher wavenumbers (Figure 8e).

(a–d) Raman parameters of weathered chars. Animal chars (red) and charcoal (black). (e) Band intensity at 1700 cm−1 on the G band intensity as a function of the HD/HG ratio.
3.3.2. Application—origin of the biological precursors of amorphous chars found in a Bruniquel cave hearth
Some small chars found in a Bruniquel cave hearth (Foyer Nord) (Figure 9a,b) have morphologies that do not allow a direct distinction between animal or vegetal precursors. They have a vitreous appearance, a globular morphology and no characteristic vegetal or bone structure; they could be charcoals called vitrified charcoal or charred fat or flesh [Goldberg et al. 2009; McParland et al. 2010]. On the other hand, their Raman spectra are very different from each other. In Figures 10a and b, we show the characteristic Raman spectra of these chars, named amorphous char 1 and amorphous char 2, respectively. Plotting the i1700/iG ratio as a function of the HD/HG ratio places amorphous char 1 in the animal char field and amorphous char 2 in the vegetal char field (Figure 10c). This would indicate that amorphous char 1 is an animal char (meat or fat) and that amorphous char 2 is of vegetal origin, a so-called vitrified charcoal. To verify if this plot is reliable, both chars were analysed by SEM-EDS. Prior to analysis, the chars were embedded in epoxy resin and polished to prevent sediments on their surface from contaminating the results. The EDS spectra show that, in addition to carbon and oxygen, that amorphous char 1 (Figure 10d), suggested as a fat or meat char by Raman, contains phosphorus, calcium and sulphur, elements characteristic of an animal precursor [Horbańczuk and Wierzbicka 2016]. The EDS spectra of amorphous char 2 (Figure 10e), suggested as a vitrified charcoal by Raman, are devoid of phosphorus and sulphur (Figure 10e), but instead show the presence of calcium and magnesium, indicating a vegetal precursor [Pettersen 1984]. These qualitative analyses confirm that amorphous char 1 is an animal char and amorphous char 2, a vitrified charcoal. Thus, plotting the i1700/iG ratio as a function of HD/HG (Figure 10c) provides us with a new Raman tool that can discriminate the animal or vegetal origin of chars when their morphological aspects are ambiguous.
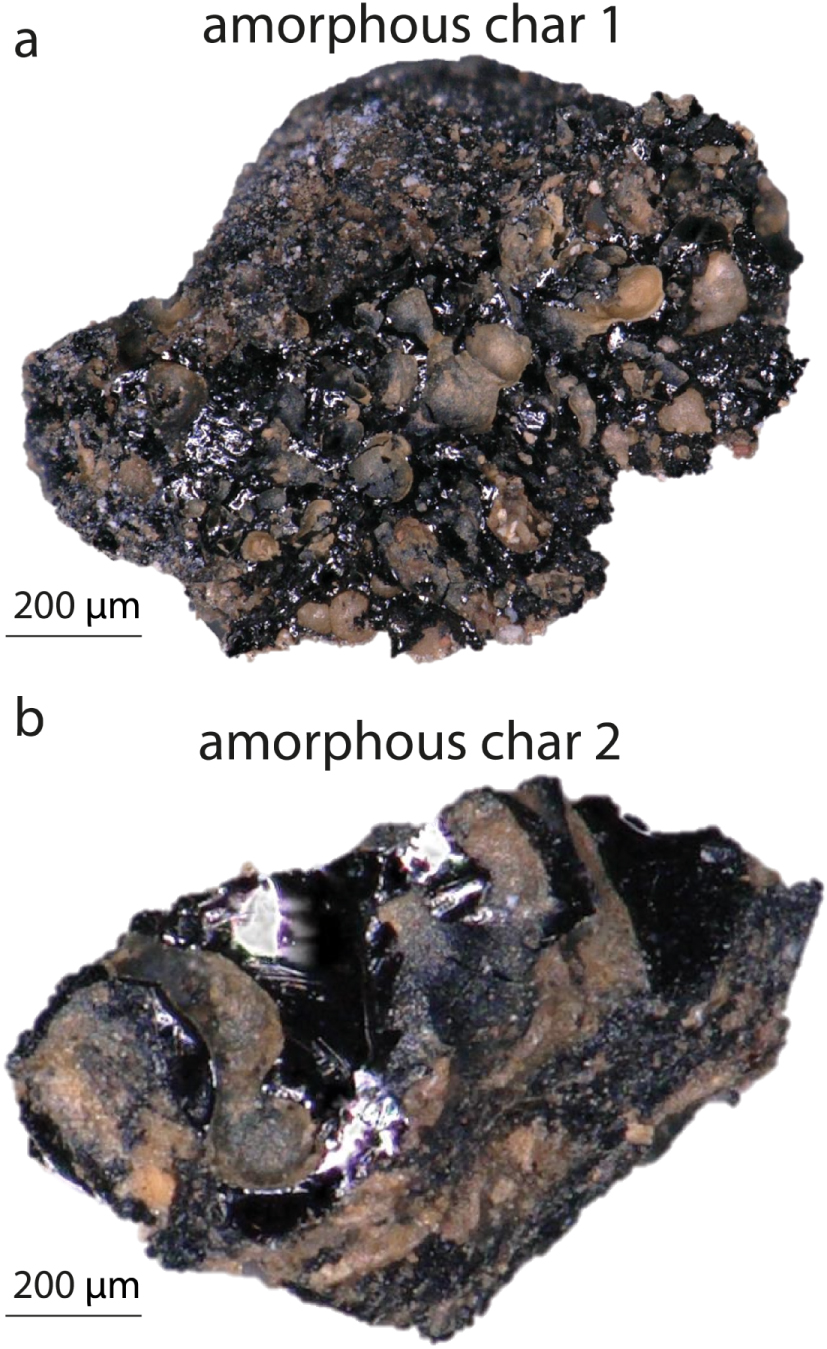
Amorphous chars found in a fireplace in the Bruniquel cave. The lack of specific morphology makes it difficult to identify the precursors, which could be vitrified charcoals or charred fat or meat. (a) Amorphous char 1. (b) Amorphous char 2.
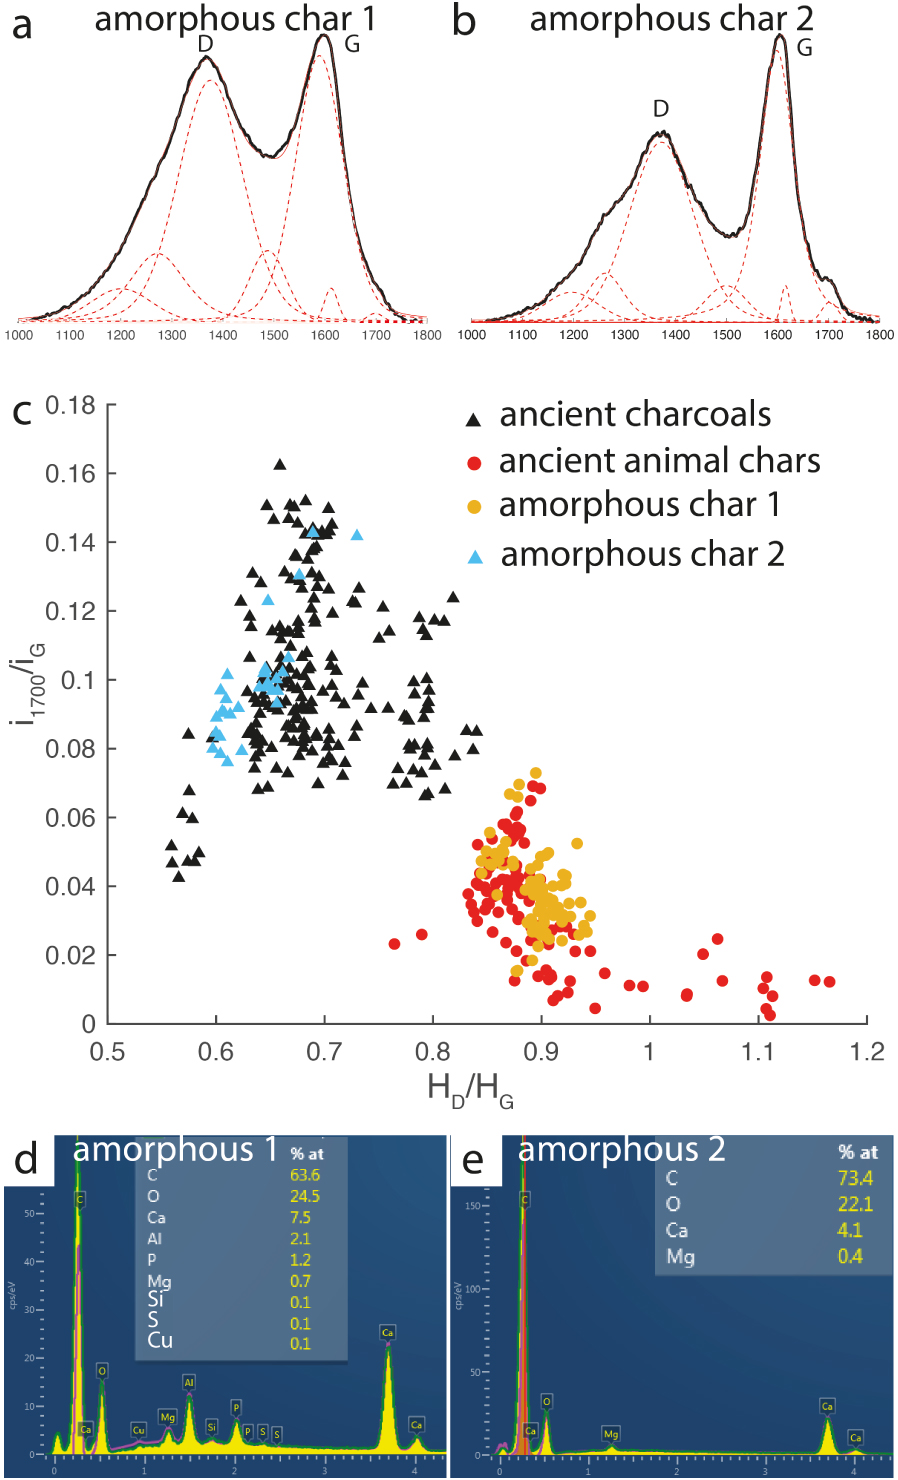
(a) Raman spectrum of amorphous char 1. (b) Raman spectrum of amorphous char 2. (c) Plot of Raman parameters placing amorphous char 1 in the animal field and amorphous 2 in the vegetal field using the frame of Figure 8e. (d,e) Energy dispersive spectra of amorphous chars 1 and 2, respectively.
3.4. Experimental oxidation of chars
Figures 11a and b compare the spectra of charcoal and meat chars, before and after experimental oxidation by incubation. For charcoals, the D band position is shifted towards high wavenumbers, up to 1382 cm−1 for a charcoal formed at 500 °C and incubated for 24 h. The height of the D band increases by about 10% for charcoals formed at 500 and 600 °C (Figure 11c). Concerning the spectra of oxidized charred meat, the D band height increases, the HV/HG ratio decreases and the G band position shifts towards high wavenumbers, up to 1605 cm−1 (Figure 11b) for a meat char formed at 600 °C and incubated for 15 h. These results confirm that the high D band height in the spectra of weathered chars and the D band shift to higher wavenumbers in the spectra of ancient charcoals, are linked to an oxidation process. After incubation in an aqueous oxidizing medium, the changes in the spectra of experimental chars show the same trends as seen in archaeological samples, apart from the band at 1700 cm−1 in spectra of charcoals, which barely increases.
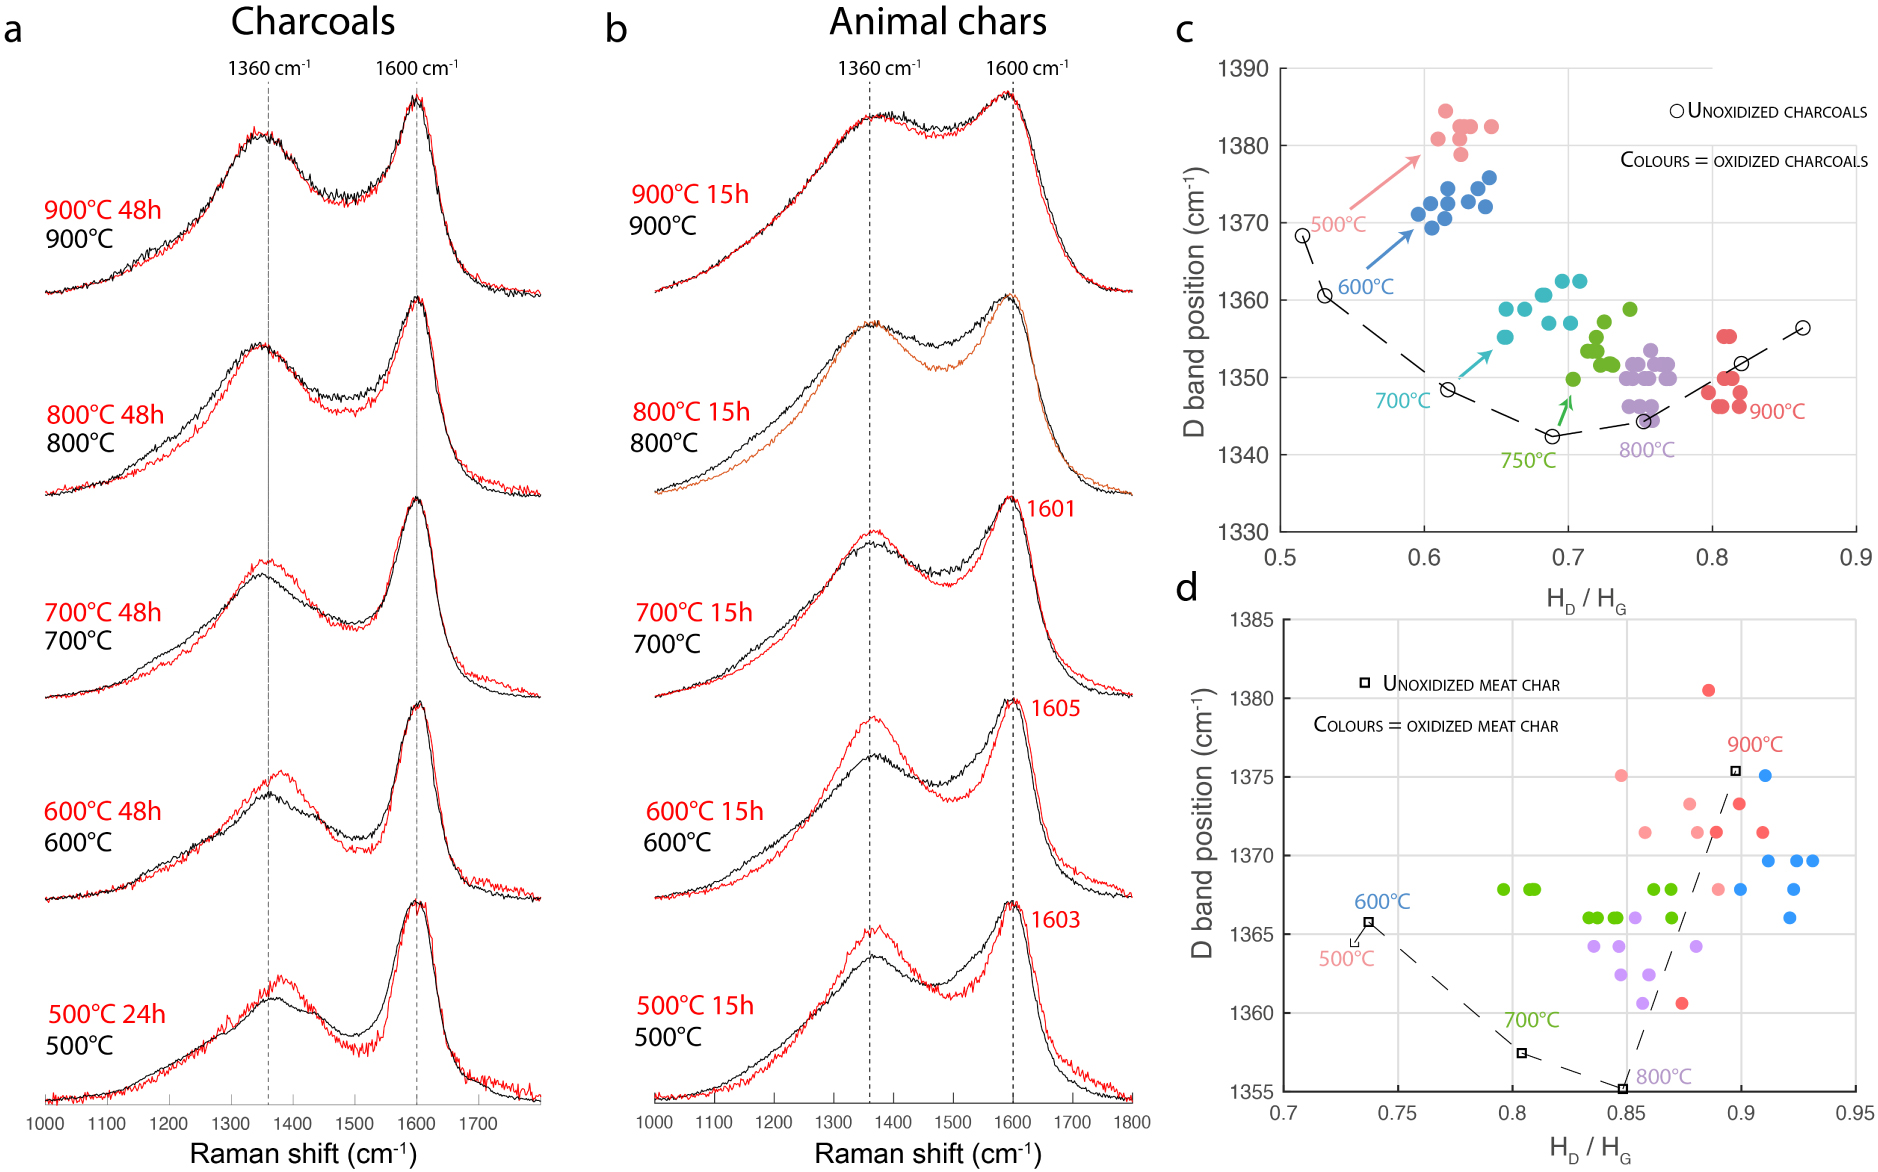
Spectra of chars before (black) and after oxidation (red). (a) Wood charcoal; (b) meat chars; (c) influence of carbonization temperature on the variation of the D band position and the HD/HG ratio for charcoals (d) same for meat chars.
The magnitude of the modifications in the Raman parameters depends on the carbonization temperature. Experimental oxidation leads to a greater variation in Raman parameters for chars formed below 800 °C (Figures 11c and d), with a very strong variation for chars formed at 500 and 600 °C.
3.5. Effects of oxidative weathering on Raman paleothermometry
A Raman map, totalizing 644 Raman spectra, was acquired from the surface of a charcoal formed in a 9700-year-old pyroclastic flow of the Puy Chopine volcano (Auvergne, France), in an attempt to retrieve its formation temperature with the Deldicque et al. [2016] thermometer method. The selected surface (around 100 × 100 μm2) was as flat as possible because the laser beam needs to stay focused during the acquisition of spectra. To verify if the charcoal is oxidized, the D band position and the HD/HG ratio are plotted against one another. This plot (Figure 12b) confirms that the charcoal is globally oxidized. Indeed, the majority of the points fall outside the curve for the experimental unaltered charcoals. We note that the higher the HD/HG ratio, the more the D band position is shifted towards high wavenumbers and the higher the intensity of the band at 1700 cm−1 (Figure 12a). This progressive evolution follows a completely different path from that of the carbonization process (Figure 12b). Unfortunately, we find that it is no longer possible to apply the Raman palaeothermometer developed by Deldicque et al. [2016] to oxidized charcoals. This is because the above method uses the HD/HG ratio, which also varies with oxidation. Nevertheless, some spectra show very little evidence of oxidation, to the extent that they overlap with a spectrum of experimental unaltered charcoal (Figure 12a). In this case, the spectra showing the least amount of oxidation are superimposed on the spectra of experimental charcoal formed at 600 °C during a 6 h plateau, the duration beyond which the Raman spectra of the experimental charcoal show no further evolution [Deldicque et al. 2016].
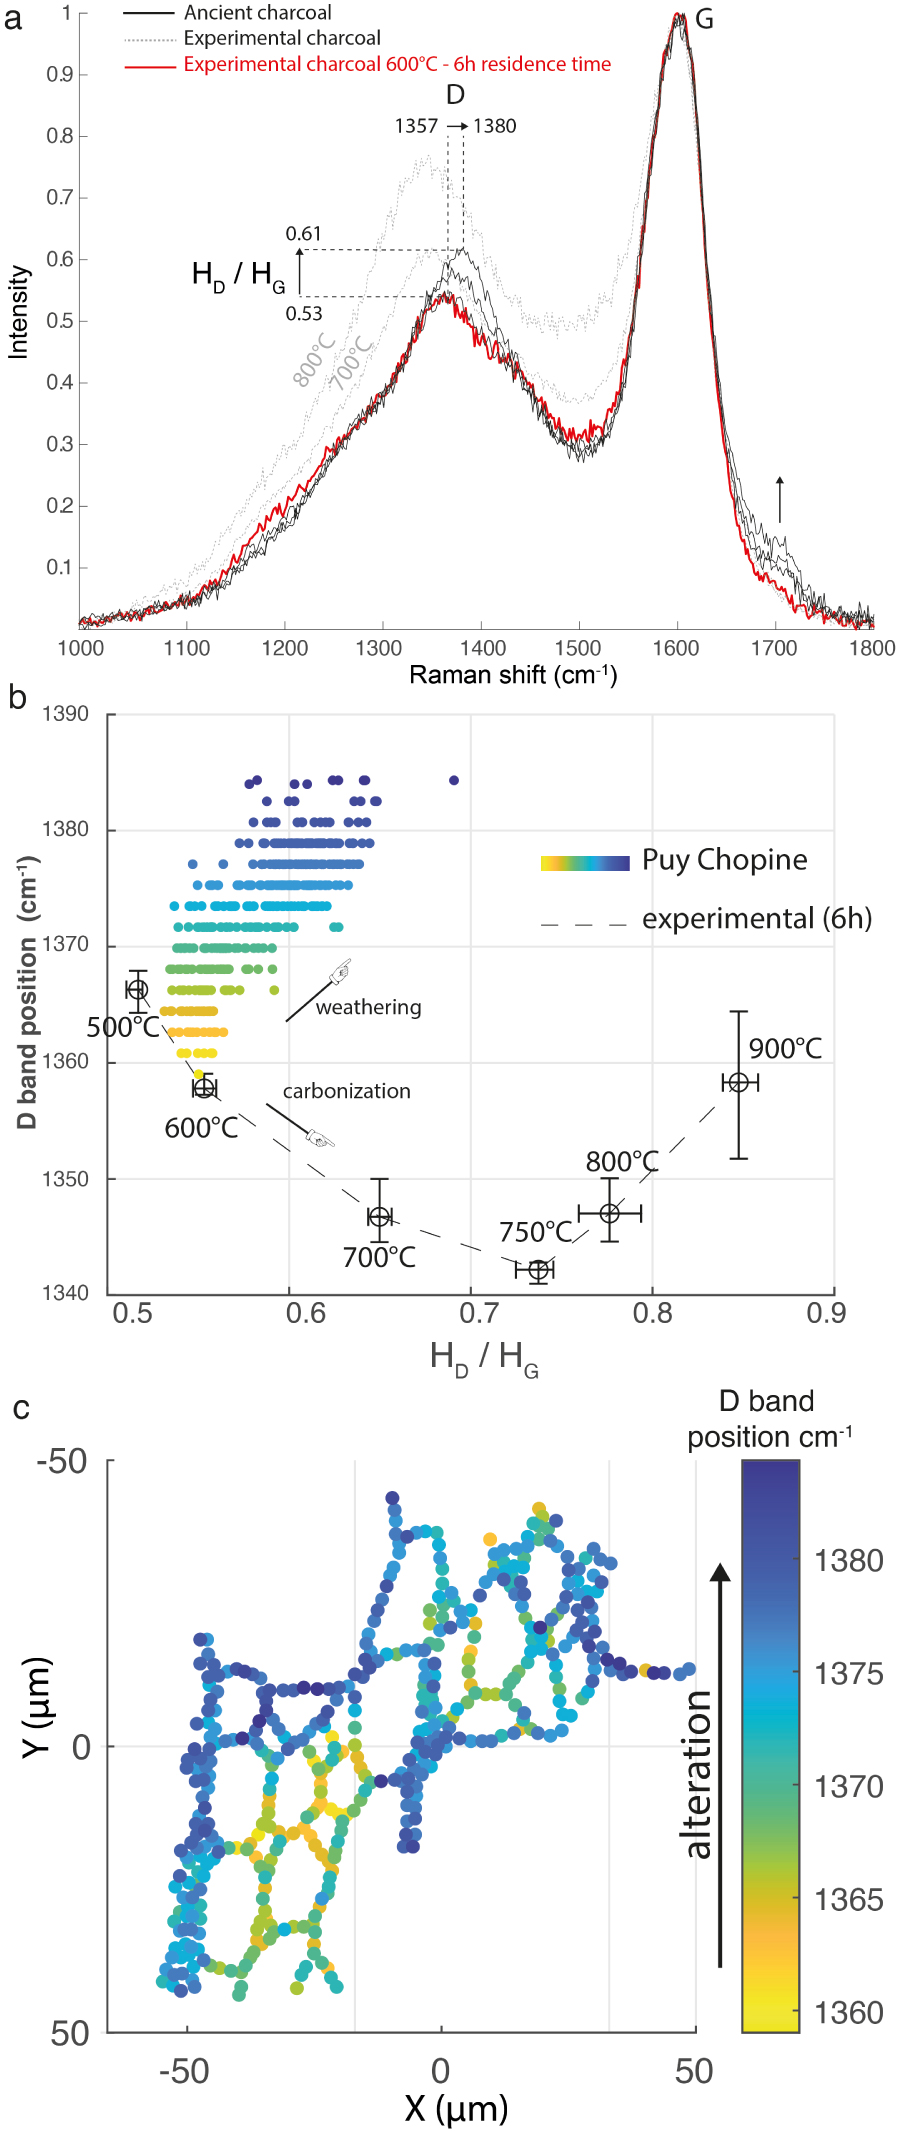
(a) Raman spectra recorded on the surface of a charcoal formed in a 9700-year-old pyroclastic flow of the Puy Chopine volcano (Auvergne). The higher the HD/HG ratio, the more the D band position is shifted towards high wavenumbers and the higher the band intensity at 1700 cm−1.The ancient charcoal spectrum (in black), with the lower HD/HG ratio (0.53), can be superimposed onto the spectrum of an experimental unaltered charcoal formed at 600 °C during a 6 h plateau (in red). (b) Variations of the D band position and the HD/HG ratio during the alteration process and during carbonization. (c) Points mapped on the charcoal surface associated with the variation of the D band position. The yellow areas correspond to the best-preserved areas. Masquer
(a) Raman spectra recorded on the surface of a charcoal formed in a 9700-year-old pyroclastic flow of the Puy Chopine volcano (Auvergne). The higher the HD/HG ratio, the more the D band position is shifted towards high wavenumbers and the ... Lire la suite
When the Raman mapping points are associated with a colour scale relative to the D band position, which varies with oxidation, (Figure 12c), we obtain an image of the charcoal surface, which highlights the most oxidized parts (blue dots) and the best-preserved parts (yellow dots). Only if the corresponding spectra merge with those of unweathered charcoal it is then possible to reapply the Raman palaeothermometer to the best-preserved parts.
3.6. Scanning electron microscopy and energy dispersive X-ray spectrometry
SEM-EDS mapping was carried out on the same surface of the charcoal fragment, which includes the area mapped by Raman spectroscopy (Figure 12c). In this way, it is possible to specify the elemental composition of the preserved and oxidized areas previously highlighted by Raman mapping. The charcoal fragment was deposited onto a conductive carbon tape, itself glued to a thin glass slide. The Raman mapping is superimposed onto the SEM image (Figure 13a), indicating the best preserved as well as the most oxidized areas. Figure 13b shows the characteristic Raman spectra of a preserved area (type A in yellow) and an oxidized area (type B in blue). The elemental maps (Figure 13c) show that the charcoal contains carbon, which is by definition present in a char, but also calcium. The calcium concentration is lower in the preserved areas than in the oxidized areas located by Raman: the calcium content (in atomic percent) in the oxidized areas can reach 6%, while in the less altered parts it varies from 0.2% to 1%. These values are not the exact concentrations because the surface mapped was not perfectly flat, but they nevertheless provide useful indications. The elemental map of calcium (Figure 13d) illustrates the very low concentrations of calcium in the least altered areas. The oxidized parts (therefore rich in oxygen groups) may interact more easily with the environment, and more particularly with the calcium cations present in variable concentrations in the water. The calcium elemental map thus reveals the most oxidized areas, since these have interacted most with the environment by binding with calcium atoms. Therefore, it is possible to use elemental calcium maps to locate the potentially least altered areas in a charcoal, to which we may apply the Raman palaeothermometer.
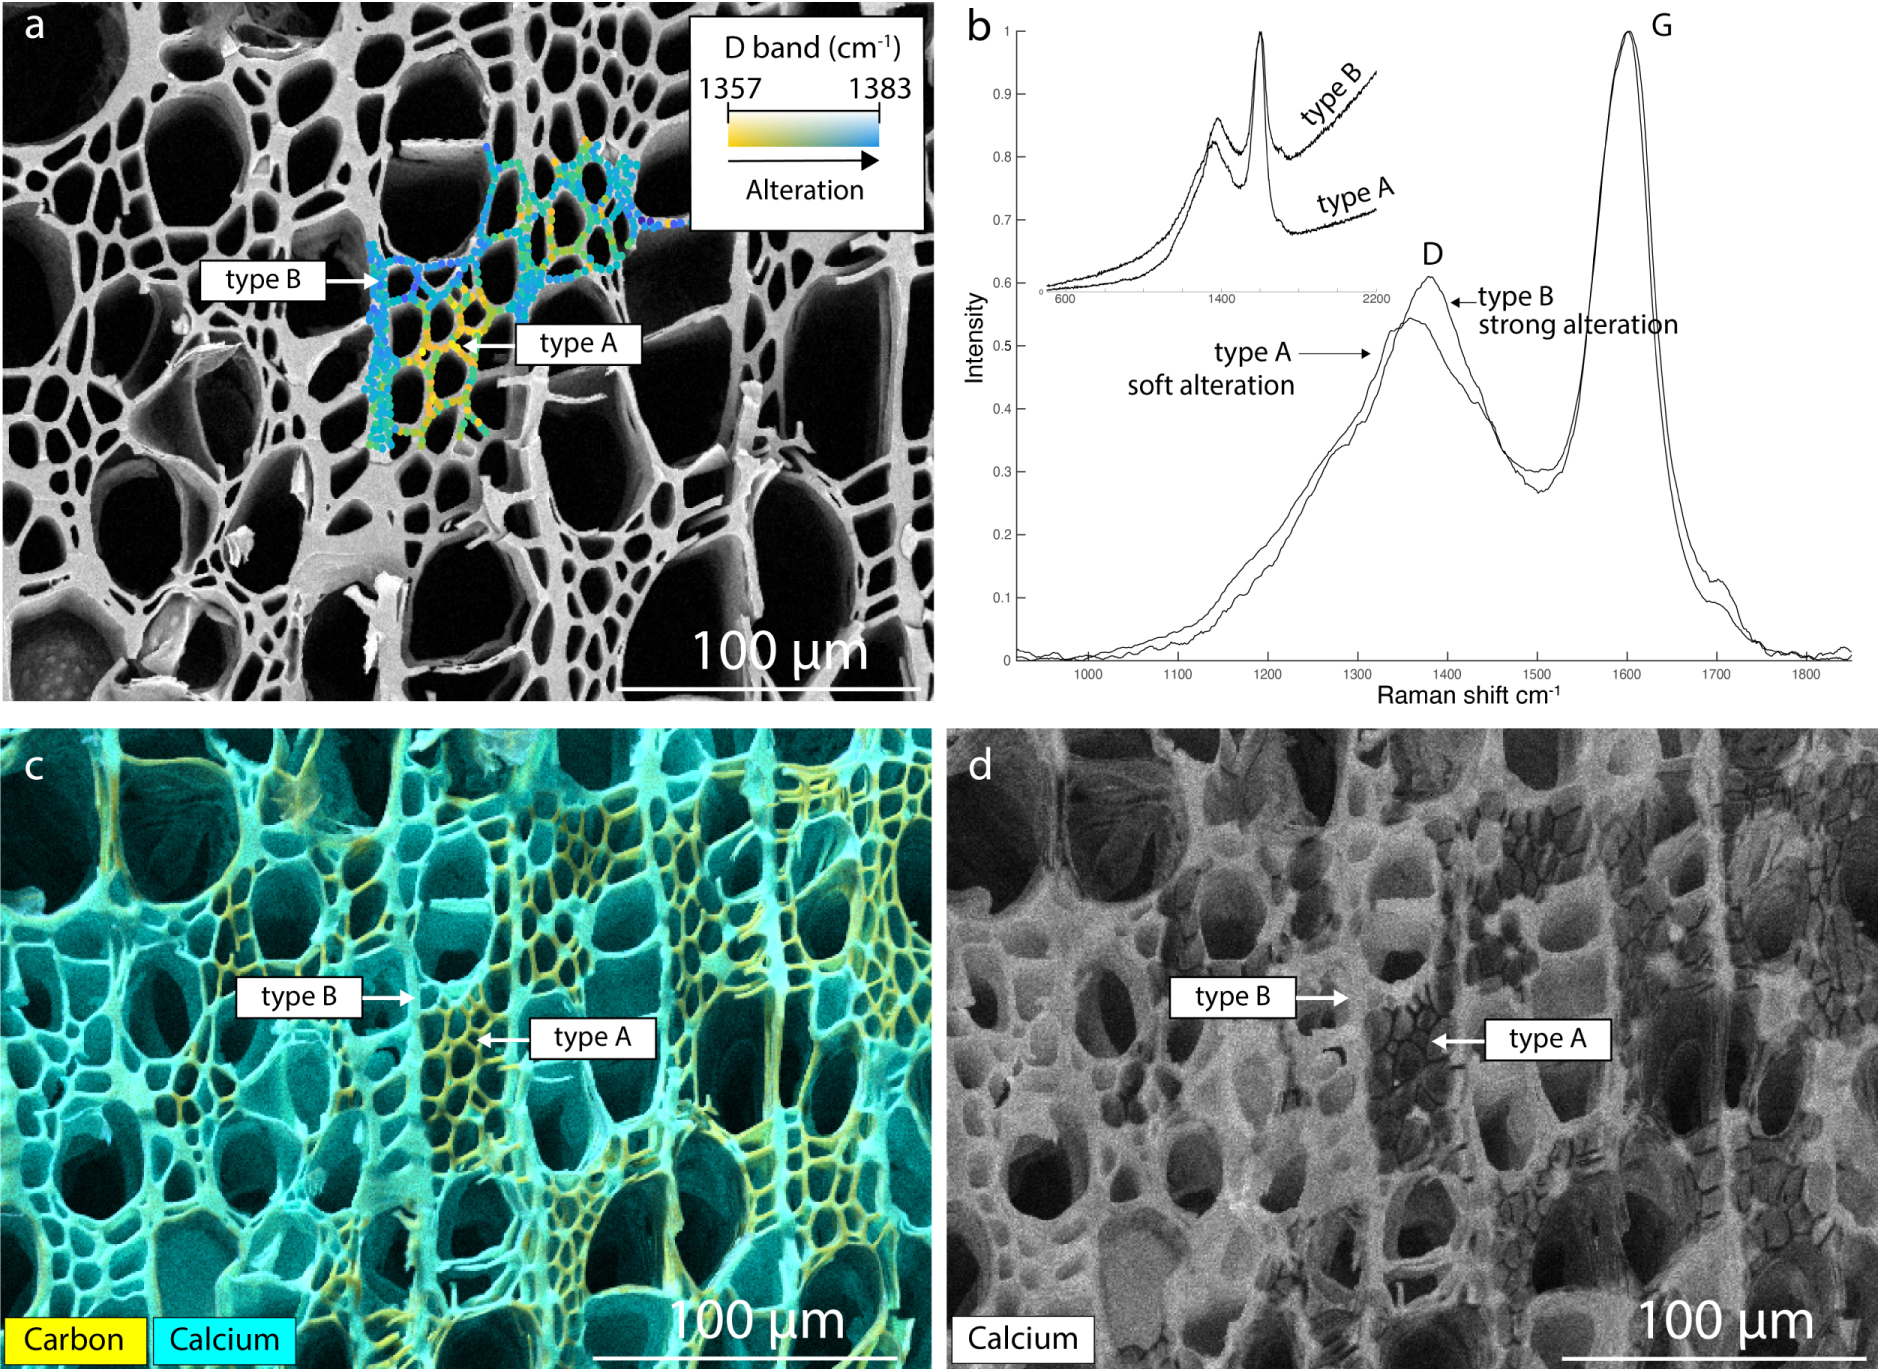
(a) Raman mapping integrated into the SEM image (backscattered mode), showing variations in oxidation via the shift in the D band position towards high wavenumbers. (b) Raman spectra characteristic of an oxidized (type B) and preserved (type A) area. (c) Superimposed elemental maps of calcium and carbon. (d) Elemental map of calcium, showing its near absence in the best-preserved areas.
4. Discussion
4.1. Modifications in Raman spectra of chars due to oxidative weathering
Although it would clearly be valuable to obtain a precise interpretation of the spectral modifications (position and intensities of the Raman D and G bands), this is not, however, the main objective of this study. In an attempt to acquire a better understanding of the growth of the D band observed during carbonization but also during oxidation (as shown by our present results), we base our approach on the study by Ferrari and Robertson [2000]. These authors postulate that the D band in a Raman spectrum of carbon is strictly connected to the presence of sixfold aromatic rings [Ferrari and Robertson 2000, p. 14098]. In their figure 5 (p. 14099), these authors show that the intensity of the D band is a function of the density of sheet edges and thus of the size of polyaromatic structures. The intensity is nil for amorphous carbons sensu stricto which do not possess any polyaromatic structures. The D band intensity then increases as the number of such structures increases in the material, in proportion to the square of the extent “La” of these structures.
It should be borne in mind that carbonization corresponds to an enrichment in carbon by the elimination of heteroatoms (H, O, N, S, etc.) from the precursor and an aromatization of the carbons giving rise to polyaromatic structures of nanometric dimensions (BSU) [Oberlin 1989; Rouzaud et al. 2015; Deldicque et al. 2016]. The increase in the D band intensity with temperature in a Raman spectrum of char thus reflects the increase in the concentration of nm-sized polyaromatic structures in the volume of material explored by the laser (about 1 μm3) and a notable growth in the extent of the polyaromatic sheets [Rouzaud et al. 2015, p. 131]. The D band intensity reaches a maximum when the carbon is completely polyaromatic, i.e., when the carbonization process comes to an end. Crystal growth only occurs during the graphitization process, when the concentration of polyaromatic sheet edges starts to fall, leading to a decrease in D band intensity (which may become zero for a single μm-sized crystal of graphite).
However, in the spectra of archaeological charcoal and bone chars, the height of the D band is particularly high and can even be higher than the G band (Figure 5d), even though there has been no thermal episode since their sedimentation. So how to interpret the growth of the D band with oxidation? To answer this question, it is interesting to discuss the results obtained from studies of changes in the chemical composition of lignite and low-rank coal during experimental oxidation in air (<280 °C) [Joseph and Oberlin 1983; Ferreras et al. 1993]. The coupling of elemental analysis and infrared spectrometry used in these studies has shown that the oxidation process occurs in two main steps. The first consists of the loss of aliphatic groups, accompanied by the attachment of oxygen atoms to form C=O carbonyl groups, including COOH and COO−. In a second step, most of the aliphatic chains having been eliminated, the hydrogen atoms and CH3 methyl groups remaining at the edge of the aromatic rings are eliminated.
Thus, during oxidation, the removal of aliphatic chains and heteroatoms would be accompanied by a collapse of the polyaromatic structures and thus an increase in the BSU concentration within the volume analyzed by the laser. The number of polyaromatic ring edges interacting with the Raman laser would increase, and thus the intensity of the D band as well. In addition, the grafting of COOH and COO− functional groups would increase the band at 1700 cm−1 attributed to the C=O bonds of carbonyl groups.
The oxidation carried out on the experimental samples modifies the D and G band positions according to the same trends observed in the spectra of archaeological and oxidized chars. However, no significant growth of the band at 1700 cm−1 is detected by H2O2 incubations. This suggests a limitation of the oxidation simulations carried out in this study, or at least the protocol that was used: oxidation in the aqueous phase by H2O2 and at 90 °C, which has the advantage (and the disadvantage) of being much faster than the natural oxidation process at near-ambient temperature over thousands of years.
4.1.1. Possible contribution of humic substances to Raman spectra of ancient chars
The degradation of organic material in soils by biotic or chemical activity, is known to produce humic substances, and in particular humic and fulvic acids [Schnitzer 1978]. These substances are complex macro molecules composed of aromatic carbons with functional groups, mostly oxygenated. In Ascough et al. [2011], humic acids were extracted from weathered charcoal by alkaline extraction and analysed by Fourier Transform Infrared Red spectroscopy (FTIR). The FTIR analyses show that the humic acids contained in weathered charcoals are mainly composed of aromatic compounds with carboxylic and carboxylate functions. In Raman spectra of weathered charcoal, the 1700 cm−1 band associated with the carbonyl groups could be due to the presence of carbonyl groups in the oxidized charcoal structure in addition to carbonyl groups of humic acids probably contained into the porous nanostructure of weathered charcoal. Moreover, in the Raman spectra of humic-like materials, the D band is situated around 1390 cm−1 [Yang et al. 1994; Coccato et al. 2015]. Thus, the D-band shift toward high wavenumbers in Raman spectra of weathered charcoals could be linked to the presence of humic substances trapped in the charcoal nanostructure. Therefore, the modification of char spectra by oxidative weathering could be caused by a combination of oxidation processes and the formation of humic substances. The different variations in the spectra of weathered animal chars may be explained by the different nature of humic substances produced by animal char degradation.
At present, more research is needed to study the contribution of humic substances to the Raman spectra of weathered chars, since their composition may change according to the pH, microbial activity, humidity and the nature of organic precursors (vegetal or animal). For example, it would be useful to couple Raman spectroscopy with FTIR or GC-MS to analyse weathered animal and vegetal chars.
4.2. Influence of formation temperature on the capacity of chars to oxidize
During the carbonization process, heteroatoms and aliphatic compounds are released as the temperature increases. This allows neighbouring aromatic layers to fuse together and consequently increase their size. In weakly carbonized chars, some aliphatic compounds still remain, making it possible for the nanostructure to collapse with oxidation. Many free radicals can be created when aliphatic compounds are released. Subsequently, the oxidation of these chars favours the grafting of oxygenated functions and their Raman spectra are strongly modified (strong D band increase). In contrast, in noticeably carbonized chars, where there are hardly any remaining aliphatic groups and heteroatoms to be torn off, this reduces the possibility of a collapse effect, which then leads to a noticeable increase of the D band. Moreover, this reduces the possibility of free radical formation and prevents the grafting of oxygen groups, such as C=O. This is supported by our experimental simulations of oxidation; following aqueous oxidation, the Raman parameters show a greater variation for chars formed between 500 and 700 °C (Figure 11).
4.3. Distinction between modern and ancient chars; estimation of degree of weathering
We find that some changes in Raman spectra due to oxidative weathering are clearly different from those induced by the carbonization process. This implies that Raman spectroscopy is able to distinguish between modern, unoxidized chars and ancient and weathered chars (see Figure 6a–c for charcoals and Figure 7c for animal chars). The ability to distinguish between modern and ancient chars is very useful as it allows us to rule out possible contamination of ancient chars by modern unweathered chars. This could be the case, for example, in an archaeological site that may be contaminated by a more recent external input, by a recent natural fire or by the excavators themselves.
The position of the D band and its height, as well as the height of the band at 1700 cm−1, vary progressively with weathering (see Figure 11a). It is thus possible to estimate the degree of weathering or preservation on the surface of the same charcoal by means of a Raman spectrum, especially by plotting the D band position against the HD/HG ratio (see Figure 11b). However, weathering is dependent on time but also on the temperature of the char formation and, furthermore, on environmental conditions that can be very variable. Inconsequence, up to now, it is quite impossible to compare the degree of preservation or weathering of two different charcoals that do not share the same formation temperature and the same post depositional environment.
4.4. A new tool for the characterization of fire traces in Palaeolithic sites
To our knowledge, the present results show for the first time that oxidative weathering effects have a strong impact on the Raman spectra of chars. The plots used to separate the vegetal or animal nature of unweathered chars are no longer efficient when applied to the ancient chars analysed in this study (see Figure 8b–d). However, the band at 1700 cm−1 is very pronounced in a weathered charcoal spectrum and less pronounced, and sometimes barely visible, in a weathered animal char spectrum. In addition, the HD/HG ratio is often higher in the Raman spectra of weathered animal chars than in weathered charcoals. Thus, when the i1700/iG intensity ratio and the HD/HG height ratio are plotted against each other, it becomes possible to discriminate the vegetal or animal origins of weathered chars (see Figure 8e). The method proposed here extends the ability of Raman spectroscopy, as first described in Lambrecht et al. [2021], to identify the animal or vegetal origin of chars, even when they are oxidized.
Therefore, this Raman spectroscopy method appears as a promising tool to characterize carbonized fire residues in prehistoric hearths or fireplaces. Firstly, when weathering has been severe to the point that the characteristic morphologies of organic precursors are no longer recognizable or when they are too small. Secondly, it allows us to avoid confusing the vegetal or animal origin of chars, which sometimes have the same morphological characteristics as vitrified charcoal and charred fat or meat. Moreover, this capability may be useful when charred bone fragments have been so altered by the sometimes-extreme post-depositional conditions that the mineral matrix of bones is completely dissolved or transformed, for example due to bat guano fallout [Shahack-Gross et al. 2004]. In this case, the carbonized animal tissues would be the only indicators of their initial presence and our Raman tool would be able to characterize them. This method could also be applied to the combustion traces recorded in speleothems preserving soot and micro-chars (Figure 14), as highlighted by Vandevelde et al. [2017]. The analysis of these micro-chars (wood or animal origin) would allow the identification of the fuel used even in the absence of remains on the ground, in the case of strong disturbance of the archaeological filling or when excavations are impossible (for example, for conservation purposes).

Speleothems found in occupation soils (J and E/F) of the Mandrin cave. (a) Micro-charcoal. (b) Sooty layer (red arrow) and micro-chars (red circle).
4.5. Consequences of charcoal oxidation on the validity of Raman paleothermometry
Both oxidative weathering and charring temperature increase the height of the D band in the Raman spectra of charcoals. This also leads to an increase in HD/HG ratio, which is precisely used to retrieve wood charring temperatures using the thermometer developed by Deldicque et al. [2016]. Thus, it would no longer be possible a priori to apply this thermometer using the Raman spectrum of an oxidized charcoal since the wood charring temperature would be possibly overestimated. Nevertheless, our present study shows that some parts of a charcoal can display very little alteration, to the point that the Raman parameters merge with those of unaltered experimental charcoal. Thus, only these preserved unaltered parts in a charcoal can be exploited for Raman thermometry since the height of the D band results from the carbonization process and not from oxidation or other chemical weathering. We therefore propose to systematically plot the D band position as a function of the HD/HG ratio, thus detecting the presence or absence of oxidation (Figure 12b), which would indicate whether the Raman thermometry method of Deldicque et al. [2016] can be reliably used.
However, not all ancient charcoals, and especially the oldest, are liable to contain preserved parts, and it would be very time-consuming to use Raman spectroscopy to map the entirety of a charcoal section in order to find the least altered parts. We show that the use of SEM-EDS allows us to locate these parts more easily. Indeed, the oxidized parts of a charcoal are better bound to the calcium ions present in the surrounding water. Thus, we can use the elemental calcium map of the surface of a globally altered charcoal to locate areas that have more or less reacted with their environment. The least reacted areas therefore represent the best-preserved parts and are therefore likely to be useable for Raman thermometry (see Figure 13).
In the case of ancient volcanic events, the SEM method proposed here would be a necessary preliminary step to estimate emplacement temperatures of pyroclastic flows from the trapped vegetation transformed into charcoal by means of Raman spectroscopy. This method could thus be profitably applied to the charred vegetation or wooden infrastructures of ancient cities buried under volcanic debris as in the case of Herculaneum and Pompeii, and could precise and complement the estimated temperatures obtained by charcoal reflectance measurements [Caricchi et al. 2014]. However, it should be noted that this protocol remains applicable when the surrounding post-depositional environment contains soluble calcium. Moreover, the possibility of finding preserved parts of charcoal is limited by the rate of oxidation relative to the variable post-depositional conditions (pH, humidity, microbial activity).
4.6. Other implications
Raman spectrometry has been demonstrated to be an effective tool for selecting the best-preserved carbonaceous fossils that may contain molecular biomarkers of the earliest traces of life on Earth, particularly in Archean rocks [Delarue et al. 2016]. During their geological history, these carbonaceous fossils have likely undergone periods of thermal and/or aqueous alteration. Indeed, the D bands of their Raman spectra are often exceptionally intense (HD/HG ≫ 1). This characteristic feature deserves to be revisited in the light of our present results. Owing to the approaches recommended here, we now have some idea of how alteration manifests itself in the Raman spectra of chars. It is therefore now possible to select more precisely the candidates of carbonized fossils that might contain molecular tracers in the best state of preservation.
5. Conclusion
The objective of this study is to evaluate the effects of oxidative weathering on the Raman spectra of chars. We indeed show that this weathering can induce serious interpretation errors if not taken into account. We show that the effects of oxidative weathering invalidate the direct extension of Raman methods developed with recent experimental chars to ancient and oxidized chars. Thus, the Raman thermometry method of Deldicque et al. [2016] and the recent method used to distinguish vegetal or animal precursors [Lambrecht et al. 2021] can no longer be applied if the oxidative weathering of chars is not considered. However, the present study allows overcoming these identified limitations. It reveals that the thermometry method of Deldicque et al. [2016] remains applicable and reliable when some parts (often μm-sized) of a globally oxidized charcoal are preserved. We show that it is possible to detect the least weathered parts of a charcoal by Raman spectroscopy, by plotting the D band position as a function of the HD/HG height ratio. Moreover, owing to a new and original SEM-EDS approach, we show that the least oxidized areas are those containing the least calcium. Thus, elemental calcium maps can be used as a guide to find the least oxidized parts on the section of a charcoal, on which it may be possible to apply Raman thermometry. Finally, to be able to reliably distinguish the animal or vegetal origin of an ancient and weathered char based on its Raman spectrum, we recommend plotting the intensity of the band present at 1700 cm−1 (associated with carbonyl groups) as a function of the HD/HG height ratio; this method can separate the precursors into two distinct fields. This new archaeometric tool proves to be very relevant when applied to very ancient and highly altered vegetal and animal chars found in anthropogenic fireplaces.
Conflicts of interest
Authors have no conflict of interest to declare.
Acknowledgments
We especially thank François Rouzaud (†), late Chief Curator of Prehistoric Antiquities of Midi Pyrénées, and Michel Soulier for sampling the precious hearth residues of the Bruniquel cave, in 1992, which could be analyzed recently with the new available methods developed in this article. We are grateful to the Volcanthraco project, which enabled us to sample charcoal formed in pyroclastic flows of the Auvergne volcanoes. We greatly thank the anonymous reviewers for their helpful and constructive remarks that made the article improved.