


 CC-BY 4.0
1. Introduction
“If the world were homogeneous, i.e. if the rock properties were constant in space, and/or easy to determine, hydrogeology would be a rather boring job: solving well-known equations in a perfectly identified medium. Fortunately, the world is heterogeneous, with highly nonconstant properties in space, and “dealing with heterogeneity” is what makes the work fascinating.” [de Marsily et al. 2005]. These authors present the various numerical approaches developed through time to represent subsurface heterogeneity: from stochastic methods and geostatistics which suppose an underlying “structure”, Boolean methods based on specific pre-defined shapes to genetic methods now usually called forward or process-based models which model the physical processes leading to the subsurface architecture and heterogeneity. Michael et al. [2010] proposed to combine geological-process models and geostatistical models to condition to 3D subsurface structures. de Marsily et al. [2005] first question in their discussion is “when does heterogeneity matter?”. In the case of sedimentary rocks, their 3D heterogeneity is certainly governed by the sedimentary architecture and facies distribution as well as potential later diagenetic processes. The resulting petrophysical variability may depend on several superimposed structures and processes. This is particularly true in the case of carbonate rocks, where the fabric depends on the metabolism of the different competing organisms and local environmental factors or controls [Ahr 2008]. Carbonate rocks are also prone to diverse diagenetic transformations through time. This paper focuses on a particular type of carbonate: microbial carbonates which are important components of carbonate sedimentary systems, both in modern and ancient times. Well-represented in marine and lacustrine settings, they are also found in fluvial, spring or cave environments [Riding 2000]. The large variety of microbial communities and of mechanisms at play [Dupraz et al. 2009, Riding 2000, 2002, 2008, Suarez-Gonzalez et al. 2019] may result in high spatial variability within facies belts and in different and complex geobodies such as mats, oncolites, stromatolites, thrombolites etc. These geobodies can vary in size from a few centimeters to large meter-scale structures and may contribute to the development of kilometre-scale formations that could be interpretable in seismic data [Wright 2012, Wright and Barnett 2015]. This highly variable heterogeneity scale (10’s–100’s of meters) and their spatial distribution make their impact on reservoir properties or fluid flow still a matter of debate. Moreover, it is important to keep in mind, as highlighted by Corbett et al. [2015], how the bio-architectural component, when controlling porosity in microbial carbonates, may represent a challenge in terms of sampling, measurement and modelling microbialite bearing carbonate reservoirs.
Several models focus on the growth of microbialite considering the interactions of intrinsic and extrinsic factors whether at intermediate scales, namely bed- or build-up scales by combining Diffusion Limited Aggregation (DLA) and Cellular Automata (CA) [Dupraz et al. 2006, Johnson and Grotzinger 2006, Curtis et al. 2021] or at larger scales combined with stratigraphic models [Gallois et al. 2016, Kozlowski et al. 2014, Xi et al. 2022]. Several authors [Arslan et al. 2008, Dirner and Steiner 2015, Janson and Madriz 2012, Jung et al. 2012] propose to combine Multiple Points Simulation (MPS) with field observations and digital outcrop techniques to create 3D models.
To date relatively few publications have focused on modelling strategies for such geobodies and associated deposits. The aim of this methodological paper is to present how the bi-variate plurigaussian method has been applied to the lacustrine Yacoraite Formation of the Salta rift basin (NW Argentina) whose heterogeneity depends on both sedimentary facies and microbialite geobodies. One of the main focuses is to illustrate how it is possible to integrate geological data and concepts in this modelling geostatistic method to reach a better description of the porosity field.
2. Geological context and general description of the sequence of interest
The Salta basin (NW Argentina; Figure 1A) belongs to the Andean Basin system evolving from a rift to a foreland setting [Marquillas et al. 2005, Viramonte et al. 1999]. The sedimentary infill of the Salta Basin is dated from Early Cretaceous to Middle Palaeogene [Reyes 1972, Salfity 1982, Marquillas et al. 2007, Rohais et al. 2019]. It can be divided in three main stages: (1) the Pirgua subgroup (syn-rift) corresponding to alluvial and fluvial deposits; (2) the Balbuena subgroup (transitional sag) corresponding to aeolian, fluvial and shallow lacustrine mixed deposits; and (3) the Santa Barbara subgroup (post-rift) corresponding to fluvio-lacustrine deposits (Figure 1B).
(A) Location of the Salta rift basin and the Alemania-Metán sub-basin [modified from Carrera et al. 2006, 2009, Cristallini et al. 1997, Salfity 1982, Viramonte et al. 1999]. The red line corresponds to the correlation transect presented in Figure 1C. The blue rectangle corresponds to the area modelled in this article. (B) Sedimentological section of the Yacoraite Formation and its three main members (Amblayo, Guemes and Alemania). The blue rectangle corresponds to the stratigraphic interval modelled in this article. A close-up view of this interval is shown, with its subdivision into two units: Al.A and Al.B. (C) Correlation panel of the stratigraphic interval at basin scale modelled in this article. The blue rectangle shows the Cabra Corral area location (the area modelled in this article). The black vertical lines indicate the sedimentary sections and well traces. The two stars indicate the wells informed in terms of petrophysical properties, used in the modelling project.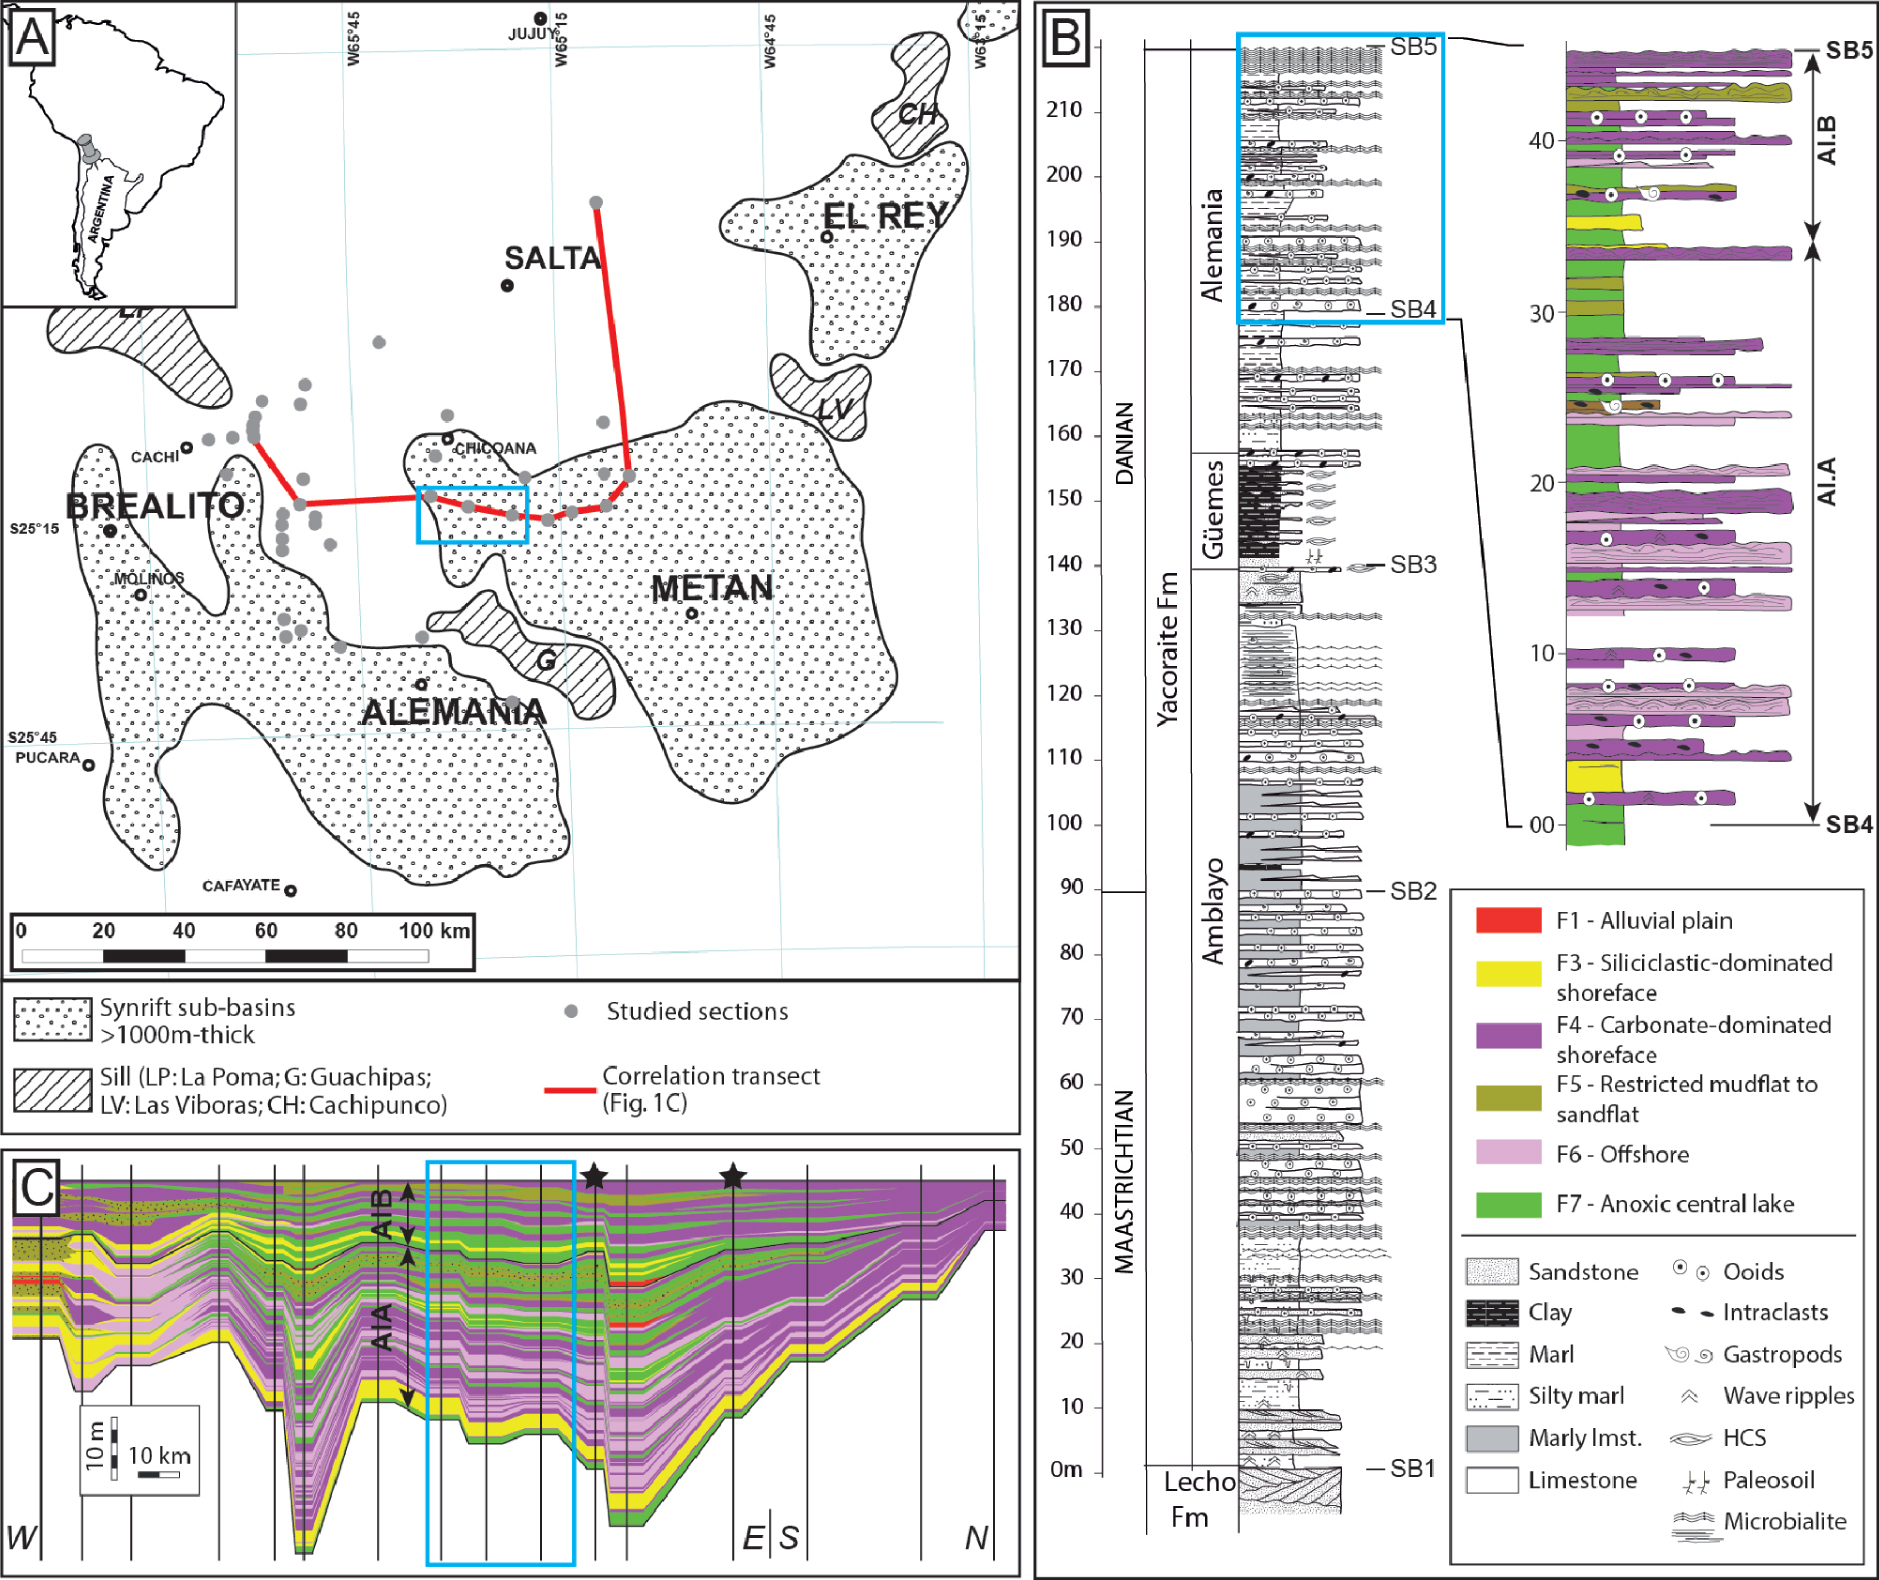
Several sub-basins exist during the rift evolution of the Salta Basin with two main ones within the study area: Alemania and Metán sub-basins (Figure 1A). In the western edge of the Metán sub-basin, the Yacoraite Formation (formation of interest) is a 220 m thick formation which was deposited during the sag phase (initiation of thermal subsidence) of the rift evolution after the syn-rift phase characterized by a tectonic subsidence. Its age ranges between Maastrichtian to Danian [Marquillas 1985, Montano et al. 2022, Moroni 1982, Rohais et al. 2019] and it is characterized by a mixed carbonate-siliciclastic sedimentation and a large diversity of microbial carbonates. Based on the observation of constituent facies, vertical stacking, lateral facies change and overall geometry performed during a basin-scale study of the Alemania-Metán-El Rey sub-basin outcrops, Deschamps et al. [2020] defined 10 genetically related facies associations (Table 1): alluvial deposits (FA1), deltaic deposits (FA2), sandflat deposits (FA3), shoreface and low-energy shore (FA4), offshore/profundal deposits (FA5), mixed mudflat deposits (FA6), high-energy carbonate shoreface deposits (FA7), low-energy eulittoral deposits (FA8), oolitic bank (FA9), highly alternating lacustrine deposits (FA10 Based on this sedimentary analysis and on the facies stacking pattern, they also defined a precise stratigraphic framework and divided the succession into four mid-term stratigraphic sequences [numbered 1–4, bounded by sequence boundaries SB1 to SB5; Deschamps et al. 2020] controlled by climate variations. These mid-term sequences can be subdivided into short-term sequences which mainly recorded high frequency climate variations, forced by earth eccentricity variations modulated by obliquity variations [Deschamps et al. 2020]. The short-term sequences are themselves divided into very short-term sequences visible at the scale of alternating facies and included within the facies associations (see for example facies S5 in FA3 defined by Deschamps et al. [2020] modelled in FA5 mudfat to sandflat) (Table 1).
Facies association, description, related facies associations in Deschamps et al. [2020], reservoir quality and lateral extension of the facies
| Model FAs (this paper) | Description in the model area | Deschamps et al. 2020 FA’s | Deschamps et al. 2020 facies | Reservoir properties | Porosity data | Lateral continuity |
|---|---|---|---|---|---|---|
 |
∙ Reddish silty shales and siltstones with root traces ∙ Rare decimeter-scale beds of fine-grained rippled sandstones |
FA1 | S1: Massive gravelly sandstones S2: Med. To coarse sandstones with trough-cross bedding S3: Red siltstones with rootlets |
Tight clayey material | 1 value Mean = 0.15% Max = 0.15% |
Less than 1 km |
 |
∙ meter-scale, fine, medium to coarse sandstones with plane-parallel to low-angle cross-bedding ∙ Rare sandy oolitic grainstone beds |
FA4a | S7: Medium to coarse sandstones with plane parallel to low-angle cross-bedding S9: Fine to medium sandstones with HCS |
Theoretical good reservoir properties | 8 values Mean = 3.31% Max = 8.7% |
Over 1 km |
| FA4b | S8: Fine to medium sandstones with plane parallel to wave ripples M4: Sandy gastropod/ooid rudstone M5: Sandy oolitic grainstone |
|||||
 |
∙ Coarse-grained peloidal, oolitic and bioclastic (ostracods and gastropods) grainstone to packstone (decametric to metric beds) ∙ Centimetric to decametric layers of silty dolomitic marls to mudstones |
FA7 | C5: Oolithic grainstone C3: Coated ostracod grainstone to packstone M4: Sandy gastropod/ooid rudstone M2: Ostracod wackestone C9: Oncoid rudstone |
Theoretical good reservoir properties | 52 values Mean = 3.81% Max = 15.7% |
Over 1 km |
| FA10a | C1: Peloid/lithoclast packstone M3: Sandy to silty gastropod floatstone C4: Grapestone-ooids grainstone to packstone C6: Green silty dolomitic marls C8: Intraclastic oncoidal breccia C9: Oncoid rudstone |
|||||
 |
∙ Thinly laminated siltstones to fine-grained sandstones ∙ Bioturbated mudstone to wackestone ∙ Wave and current ripples made of medium-grained sandstones and sandy oolitic packstones ∙ Frequent dessication cracks, generally associated with intraclastic breccia made up of stromatolite fragments |
FA3 | S5: Alternating silt and fine-grained sandstones, with ripples S6: Med. To coarse sandstones with sigmoidal cross-bedding M4: Sandy gastropod/ooid rudstone M5: Sandy oolitic grainstone |
Tight silty and clayey material | 11 values Mean < 2% Max = 5.73% |
Good lateral continuity but extension below the kilometer |
| FA6 | C7: Laminated/bioturbated mudstone to wackstone M1: Green to brown shales M4: Sandy gastropod/ooid rudstone M5: Sandy oolitic grainstone S6: Med. To coarse sandstones with sigmoidal cross-bedding |
|||||
 |
∙ Silty dolomitic marls to mudstones ∙ Frequent, decimeter-thick intercalations of grapestones and oolites with wave ripples |
FA10b | C6: Green silty dolomitic marls C4: Grapestone-ooids grainstone to packstone C8: Intraclastic oncoidal breccia |
Tight marly and clayey material | 21 values Mean = 1.25% Max = 15.38% |
Up to 3 km |
 |
Presence of black organic-rich laminated shales to mudstones | Variant of the FA10b | M7: Black organic-rich shales to mudstone C6: Green silty dolomitic marls |
Tight marly and clayey material | 1 value Mean < 1% |
Up to 3 km |
It is also characterized by several forms of microbial carbonates or microbialites (Figure 2) which constitute distinctive geobodies with various sizes, macroscopic morphologies, microscopic textures and petrophysical properties. Based both on macrostructure (field observations) and microstructure (thin section observations), these microbialites were grouped in seven categories [Deschamps et al. 2017, Hamon et al. 2012, 2017, Rohais et al. 2011, 2012] following the terminology defined by Riding [2000] and completed by Riding [2008]: (1) planar mats (M1), (2) stromatolite isolated domes (M2), (3) stromatolite coalescent domes and columns (M3-4), (4) agglutinating stromatolites (M5), (5) thrombolite isolated domes (M6), (6) thrombolite coalescent domes (M7), (7) oncoidal rudstone (M8).
Field photographs showing several examples at various scale, of lateral stratigraphic relationship between microbialite geobodies and host sedimentary facies (hammers and geologists are visible for scale). Note that microbialite geobodies can pass laterally and vertically to several host facies. Facies association and microbialite names and colors refer to Figures 3 and 4.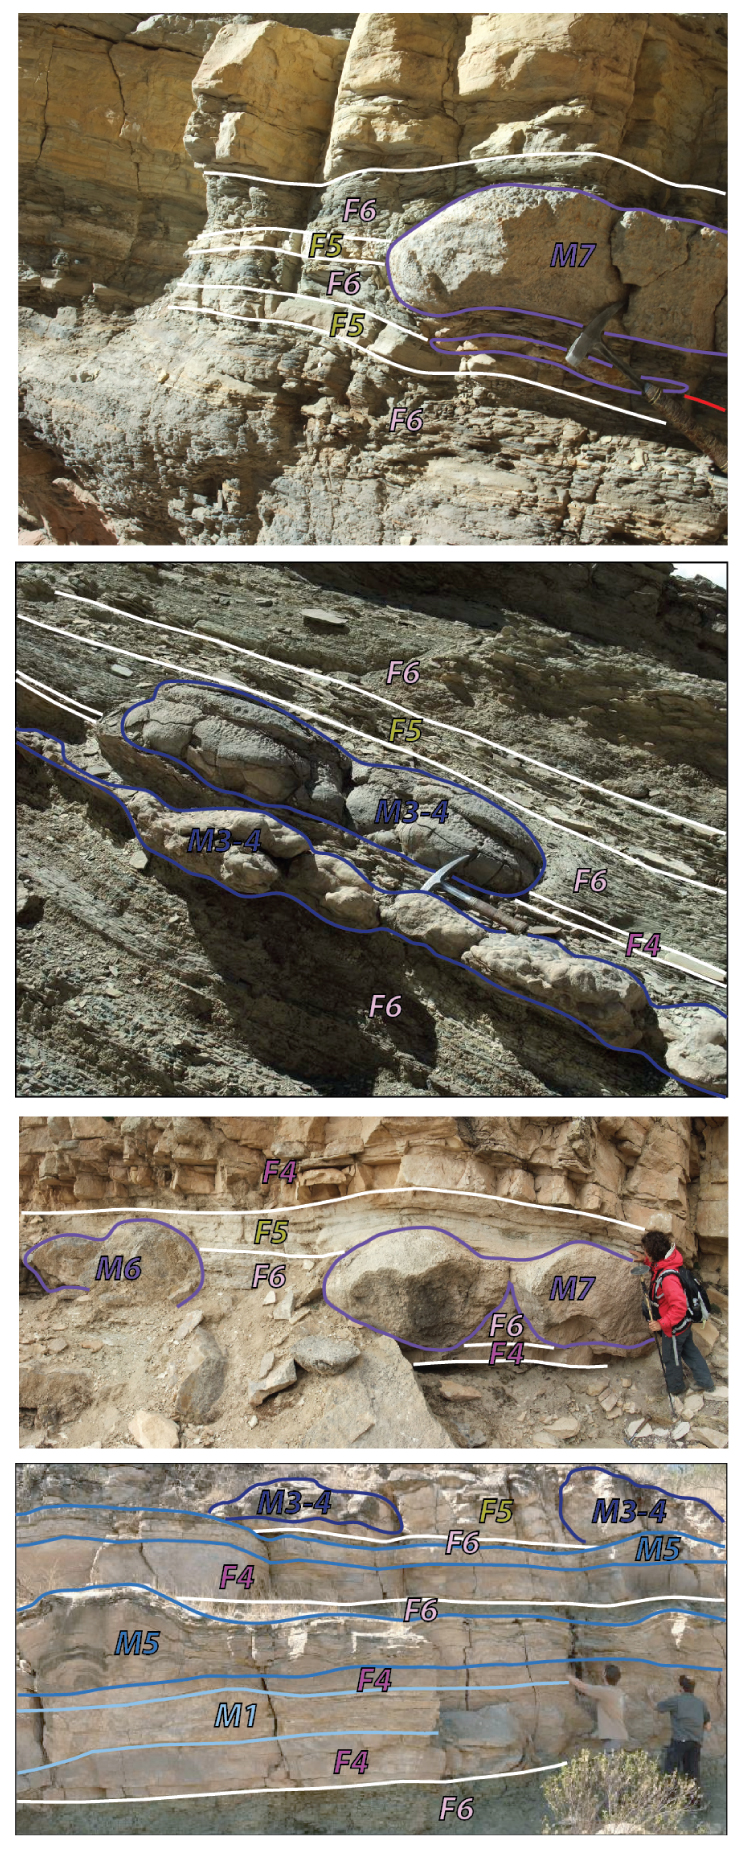
This study focuses on the 8.5 by 5 km2 area of interest located around the Cabra Corral area (blue square on Figure 1) and on the top of the Alemania Member corresponding to the mid-term sequence #4 defined by Deschamps et al. [2020]. This sequence is itself subdivided into two short-term sequences (Al.A and Al.B; Figures 1B and C), by a major exposure surface. Each short-term sequence is characterized by a shallowing upward trend with siliciclastic-dominated lower part and a carbonate-dominated upper part (Figure 1C), associated to climatic variations controlled by eccentricity cycles. The tectonic context does not play a role during this sag phase of the basin evolution. The general architecture and the facies association distribution for the sequence 4 at basin-scale based on chronostratigraphic correlations are proposed on Figure 1C. In this area, this sequence 4 is characterized by a high alternation of proximal and distal facies interpreted as very short-term sequences, recording climatically controlled lake level variations (obliquity cycles; Deschamps et al. [2020], Gomes et al. [2020] and Magalhães et al. [2020]). The impact of the rapid variation of the lake level is enhanced by the shallow depths of the lake prevailing during the deposition of the sequence 4 [Deschamps et al. 2020]. It leads to sharp interbedding of distal facies associations from the lacustrine offshore domain and facies associations from the proximal domain (mudflat/sandflat and shore facies associations) but also of the microbialite forms. Usually, microbial activity occurs in proximal conditions where oxygen, light and nutrients are available. Microbialites can form positive relief geobodies that can be surrounded or capped by facies association from distal domains when the lake level rises bringing into lateral contact microbialite forms with facies associations from offshore domain. Similar observations in other microbialite-bearing formations were reported by other authors [Bunevich et al. 2017, Loucks 2018]. Figure 2 illustrates at different scales some relationships between microbialite forms and facies associations. It highlights the two types of heterogeneity (sedimentary facies association and microbialite forms) affecting the Sequence 4 of the Yacoraite Formation as well as their geometrical relationships. The heterogeneity coming from microbialite geobodies is not embedded in the facies association heterogeneity but rather spreading across the sedimentary primary heterogeneity.
3. Data
This work is based on the large database (field data, conceptual, sedimentological, diagenesis studies and models) resulting from the Joint Industrial Project COMPAS led by IFP Energies Nouvelles from 2012 to 2015. Both sedimentary and microbialite facies classifications were adapted for this study since some of the ten facies associations defined by Deschamps et al. [2020] are not present in the area and in Sequence 4. Others were merged into a single facies as they are similar in terms of reservoir properties (Table 1). For modelling purposes, six facies associations were defined (Figure 3; Table 1). They are presented with their equivalent to the facies association (FA) of Deschamps et al. [2020] in Table 1.
Conceptual depositional models for the Alemania Member and associated background facies associations used in this study. Two depositional models are distinguished: on the left, the western siliciclastic-dominated lacustrine margin; on the right the eastern carbonate-dominated lacustrine margin showing the spatial distribution and succession of the different facies associations in each case. On the pictures of the facies, dashed lines indicate the bedding.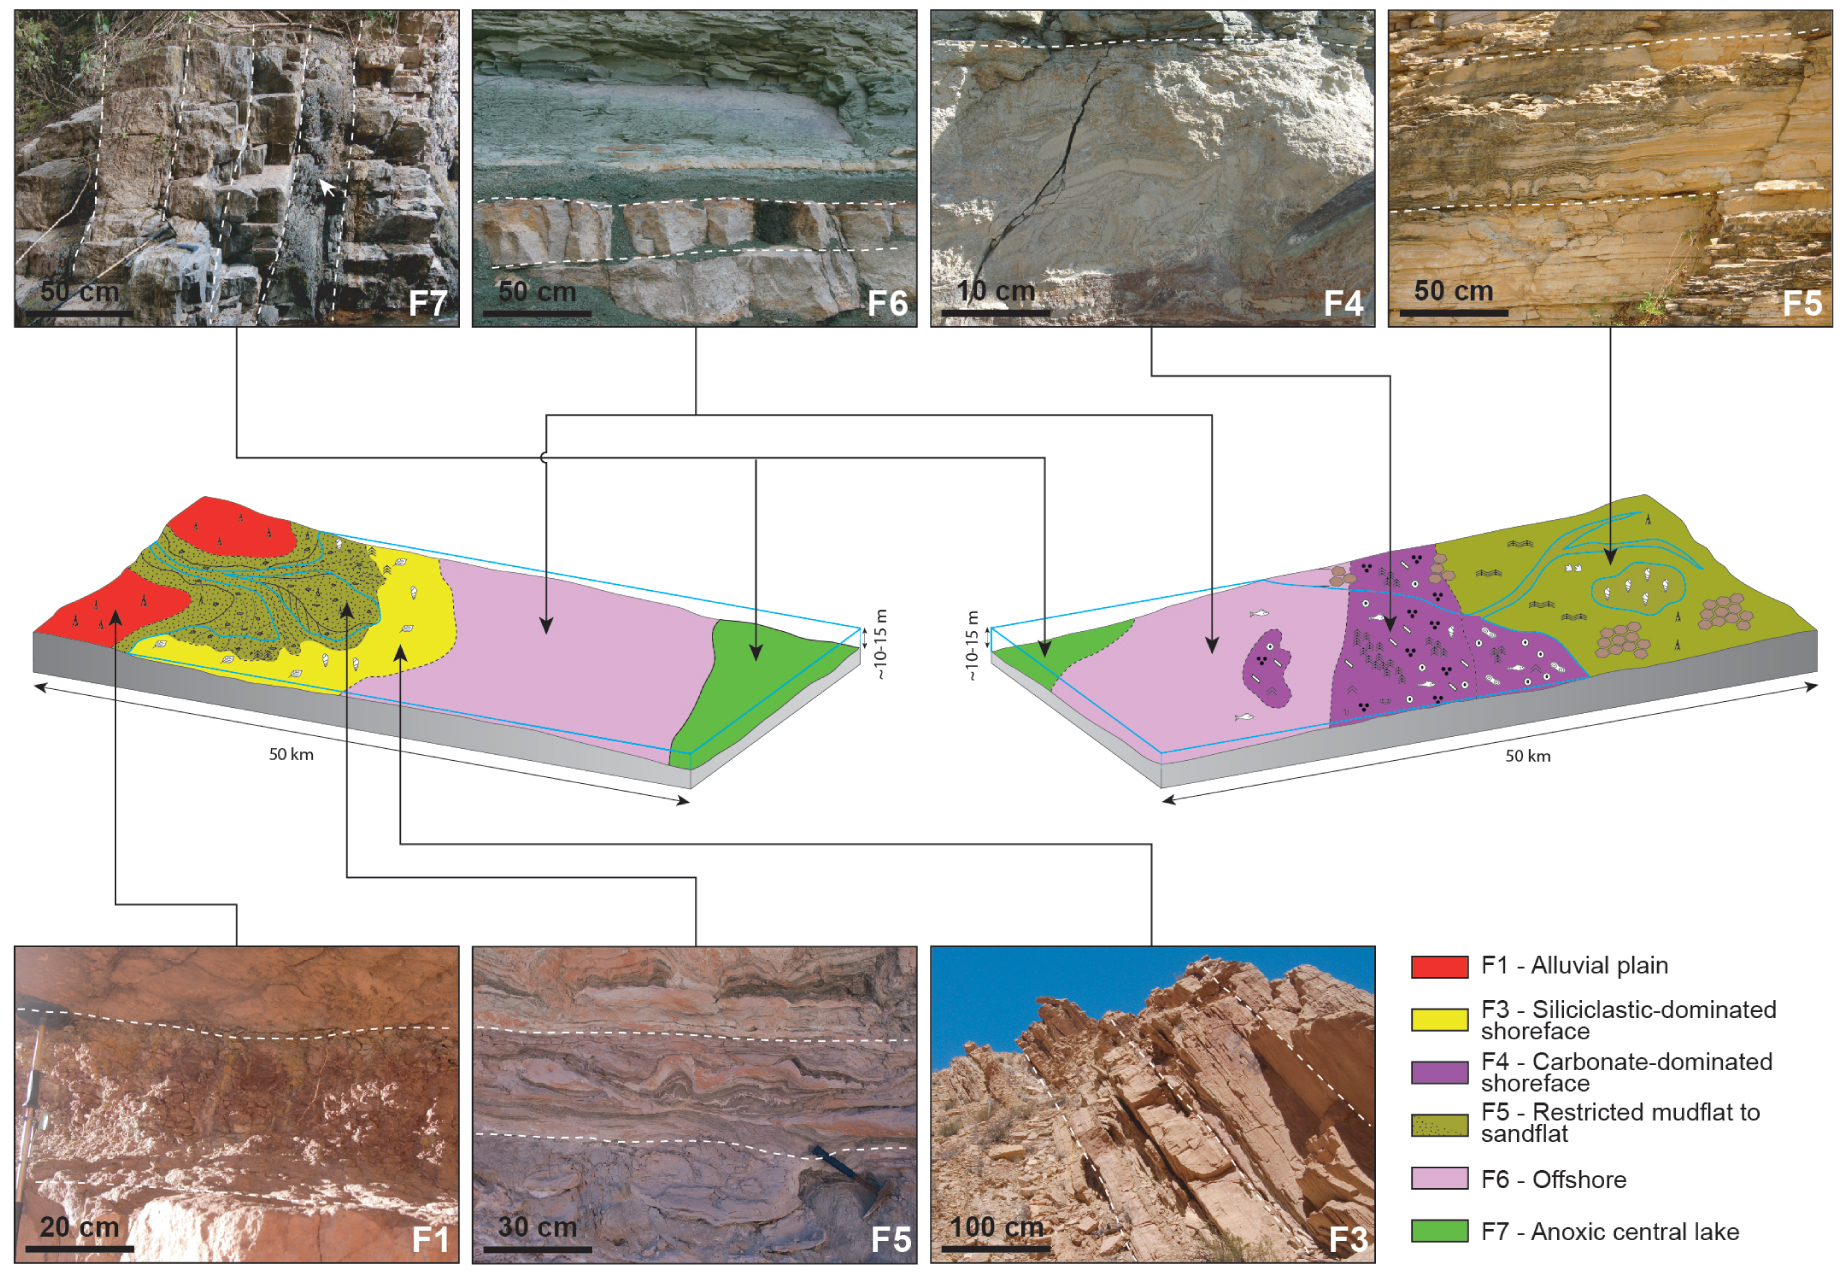
These facies associations have been distributed on two separate depositional profiles representative of the Sequence 4 in the Alemania-Metán basin (Figure 3): the first one, a siliciclastic-dominated lacustrine margin is typical of the western part of the basin; the second one, a carbonate-dominated lacustrine margin is characteristic of the eastern part. The studied area is located in the central area of the basin, consequently, both of these conceptual depositional models are relevant at different periods of the Sequence 4.
For modelling purpose, only four simplified microbialites forms were retained (Figure 4) from the original classification [Deschamps et al. 2017, Hamon et al. 2012, 2017, Rohais et al. 2011, 2012]: (1) planar mats (M1) which constitute the most extensive microbial geobodies as they can span horizontally over a kilometer, forming pluridecimetric to plurimetric thick beds; (2) stromatolite coalescent domes and columns (M3-4) whose spatial isotropic extent is of the order of half kilometer horizontally and 1 m vertically; (3) agglutinating stromatolites (M5) which form geobodies of similar dimensions than the latter; (4) thrombolites, forming coalescent domes (M7), forming meter-scale (height and diameter), generally flattened domes, clustered in discontinuous patches to continuous layers (tens to hundreds of meters of lateral extent). M7 is one of the microbialite forms which exhibits higher porosity. Although it is relatively scarce in the modelled area, it is more present in the western part of the basin. This microbialite form was described also in other sites [Muniz and Bosence 2015, Bosence and Gallois 2022, Kirkham and Tucker 2018]. For these reasons, it was kept in the modelling process as it may have an important impact on the reservoirs petrophysical properties. A fifth class (M9-No Microbial) is used to represent in the model the absence of microbialite. The stromatolite and thrombolite isolated domes (M2 and M6) have small dimensions (1 m2 horizontally and 0.5 m vertically) compared to the grid cell dimensions. They were excluded from the modelling process as the impact of these geobodies will not have a significant nor sensible effect on the heterogeneity and petrophysical properties at the considered reservoir scale. The oncoidal rudstone (M8) forms are almost absent of this area, they were observed in less than 0.25% of the section levels and thus not considered for the model.
(A) Four simplified categories of microbialite forms used for the simulation workflow and their characteristics in terms of geometry and dimensions. The color associated to each category corresponds to the color code used in the simulation workflow. (B) Relative spatial distribution of the microbialite forms on a schematic depositional profile.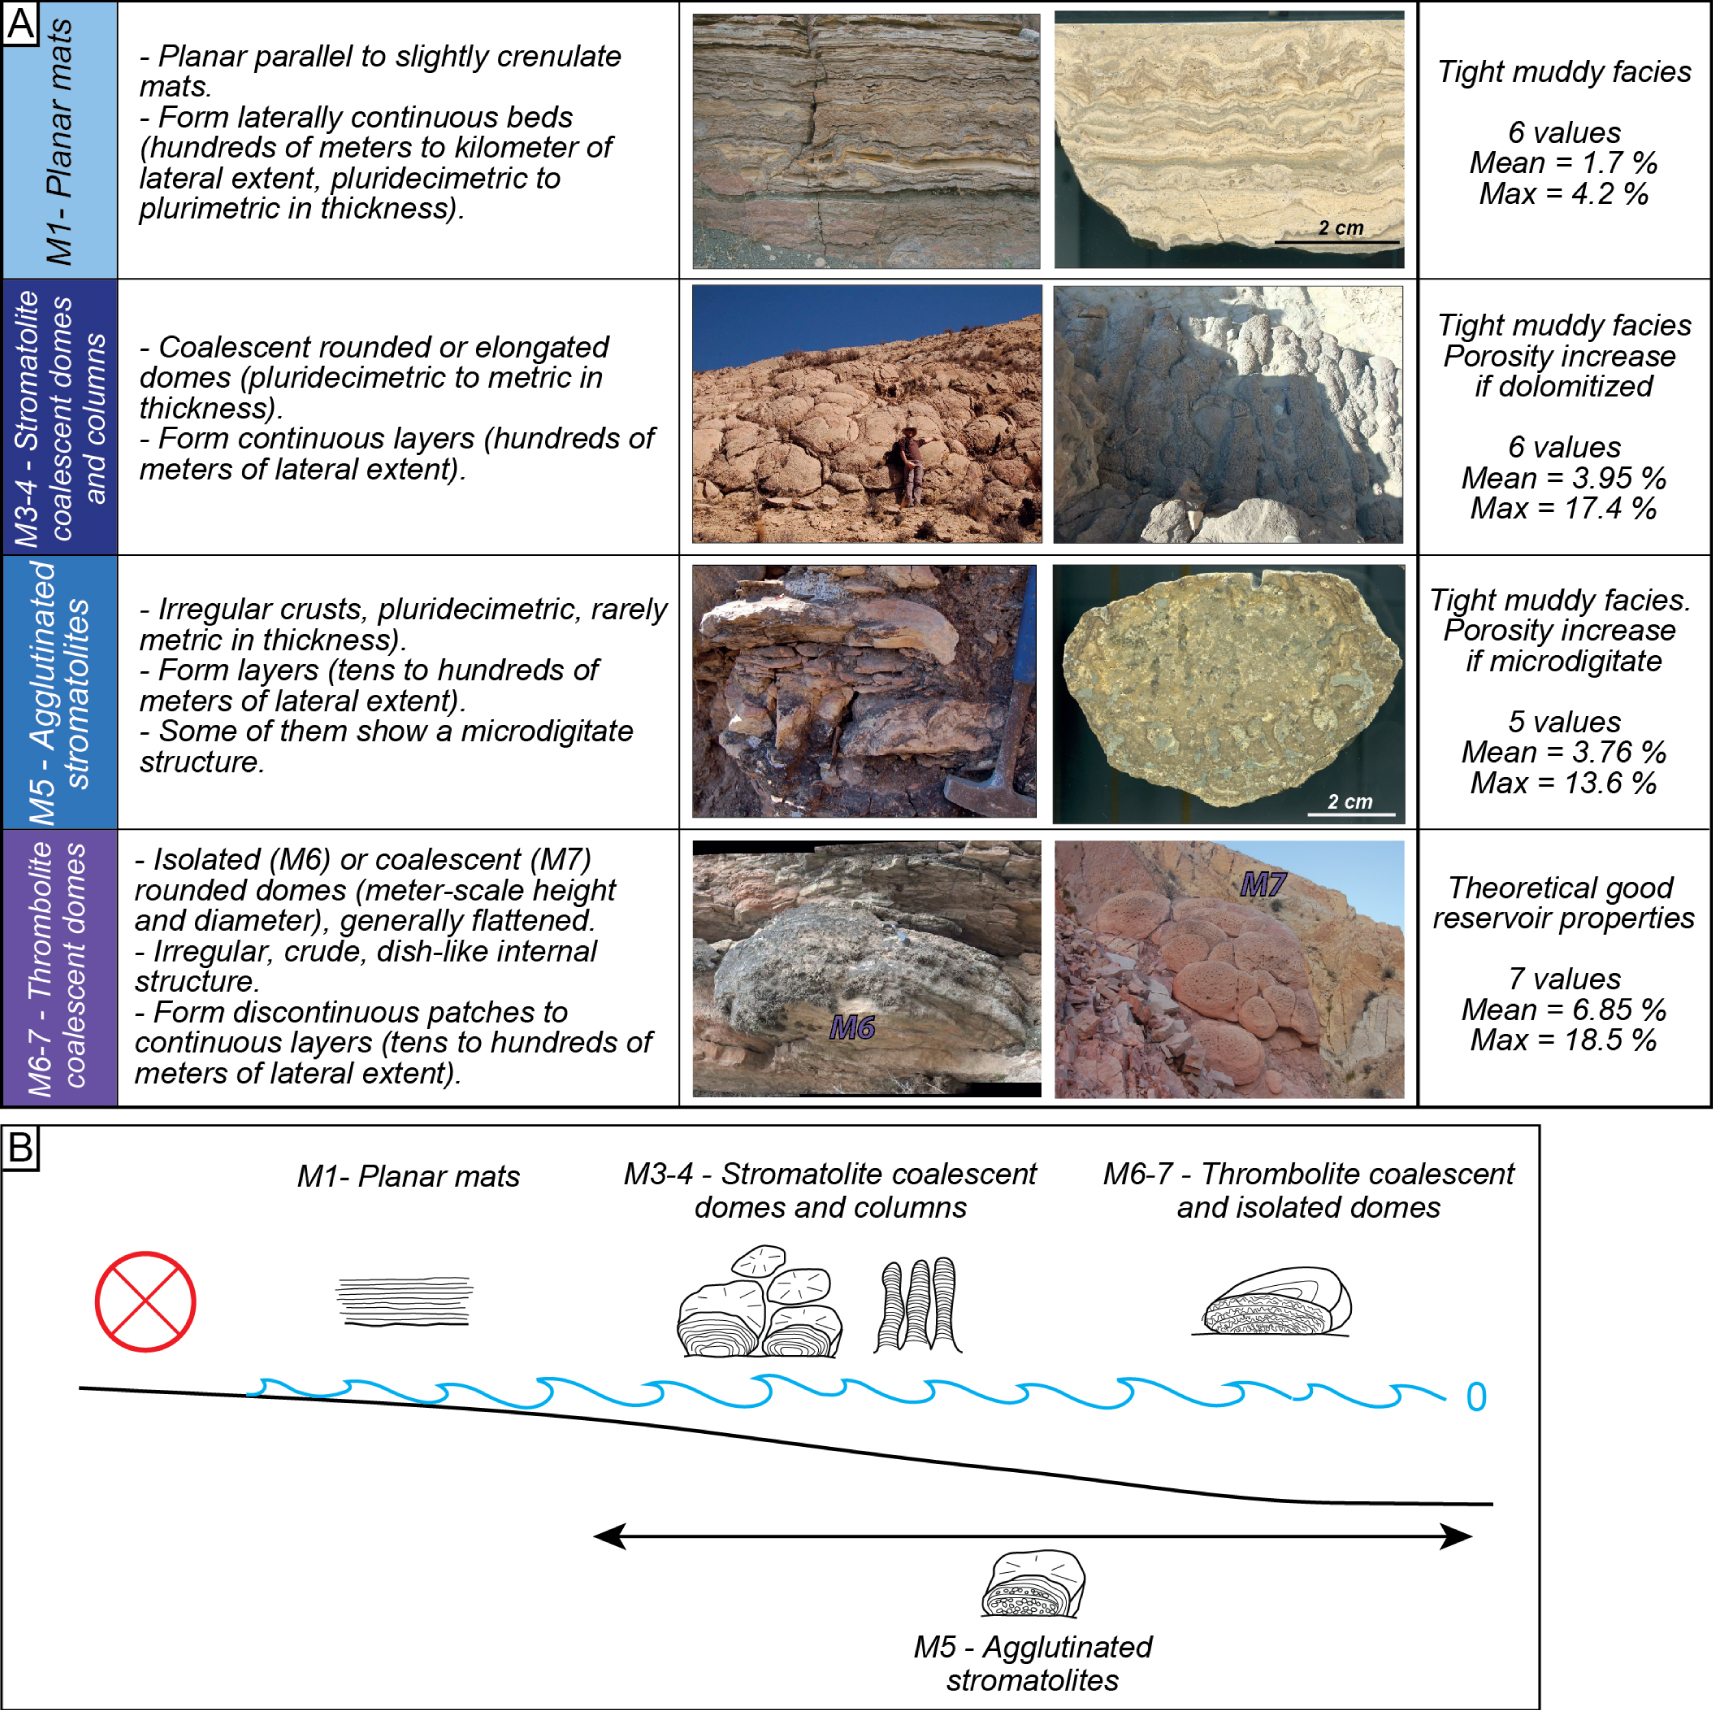
In the Cabra Coral area, 17 sedimentological sections have been described at a vertical resolution of 10 cm in terms of both sedimentary facies association and microbialite forms as presented above. During the numerical formatting of the field observations, both categorical data were informed for each sample or levels. When microbialite facies were absent, the description was set to (M9) “No Microbial”. The locations of the described sedimentary sections are quite well distributed in the area (Figure 7), so the facies vertical distribution can be compared in all spatial directions. There is no evidence of any lateral trend in terms of vertical distributions. This stationarity was expected consistently with both the reservoir-scale dimension and the central position of the grid in the basin. Therefore, we assume that the simulation does not need additional horizontal trend. It should be noted that the alluvial facies association (F1) is marginal in terms of percentage and could have been disregarded in respect to its impact on the porosity mapping. However, this facies type is a useful marker bed that identifies the disconformity (exposure surface) between the units Al.A and Al.B. This facies association has a meaning in terms of stratigraphy with the occurrence of more proximal environment at this level. It was kept in the modelling process to keep this stratigraphical information that could be a potential local barrier to fluid flow between the 2 units due to the lower permeability of these siltstones and shales deposited in an alluvial/floodplain environment compared the other facies associations.
The relative proportions of microbialites per facies association (Table 2) have been computed from the 17 available sections. Although microbialites grow in proximal environments, they might be laterally in contact with distal facies association due to the sharp interbedding of the facies as discussed above in the section on the geological context. It explains the significant proportion of microbialite forms associated with the offshore facies association (F6).
Relative proportions in percentiles (%) of microbialite forms per facies association in the 17 observed sections
| Microbial form | M1 Planar mats | M3-4 Coalescent stromatolites | M5 Agglutinated stromatolites | M7 Coalescent thrombolite | M9 No microbial | |
|---|---|---|---|---|---|---|
| Sedimentary facies |
 |
 |
 |
 |
 |
|
| F1—alluvial |
 |
0 | 0 | 0 | 0 | 100 |
| F3—siliciclastic shore |
 |
1.2 | 0.7 | 0 | 0 | 98.1 |
| F4—carbonate shore |
 |
11.8 | 7.5 | 8.9 | 0.4 | 71.4 |
| F5—mud-sandflat |
 |
19.8 | 11.1 | 22.3 | 0.4 | 46.5 |
| F6—offshore |
 |
21.7 | 7.7 | 4.2 | 3.5 | 63 |
| F7—anoxic offshore |
 |
0 | 0 | 0 | 0 | 100 |
Porosity quantifications were performed by threshold color extraction and point counting methods on scanned thin sections with the free software “JMicroVision” [Roduit 2007]. Thin sections from 2 wells studied during the basin-scale study [Deschamps et al. 2017, 2020, Hamon et al. 2012, 2017, Rohais et al. 2011, 2012] and close to the modelled area were considered: Juramento which is at a distance of 6 km east of the modelled area and “CoreLP05” located 25 km away in the NE direction. Overall, 130 estimated values are available, 62 and 68 respectively coming from Juramento and from “CoreLP05” sections. Sedimentary facies and microbial forms were observed via respectively 96 and 34 thin sections. Figure 5 exhibits the distributions of these porosity values for each facies or microbialite type. It shows that microbialite forms may exhibit higher porosity values than the facies associations except for the planar mats (M1).
Porosity distribution per sedimentary facies association (left) and microbialite forms (right). See also Table 1 for mean and max values for each facies.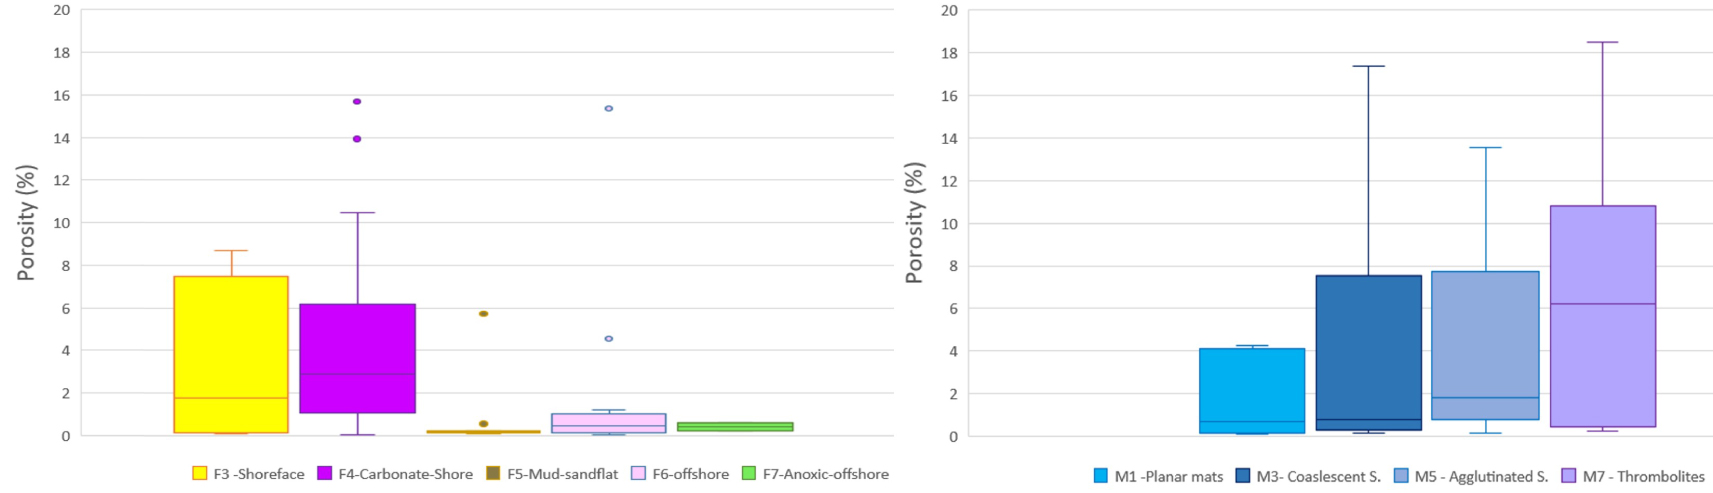
4. Methodology
4.1. Bi-variate Pluri-Gaussian simulation
In order to consider jointly sedimentary facies associations and microbialite forms as two distinct properties, the bivariate plurigaussian (bi-PGS) simulation method [Renard et al. 2008, Hamon et al. 2016] has been applied here. It was developed to process two categorical variables, while accounting for their correlation, their continuity and their potential heterotopy. This bi-PGS method is a sprout in the plurigaussian family tree. The first member of this family was the truncated gaussian methods (TGS) published by the reference papers of Galli and Beucher [1997], Journel and Isaaks [1984], Matheron et al. [1987]. It is based on one spatial gaussian random function truncated by given threshold values that mark off different areas assigned to the different values of the simulated categorical variable (e.g. different geological facies) (Figure 6A). Plurigaussian simulations (PGS) were developed to provide greater flexibility to realistically simulate geological environments [Armstrong et al. 2011, Emery 2007, Madani and Emery 2015]. Gaussian random functions (correlated or not) are generated and simultaneously truncated to simulate 3D distribution of geological facies. Each underlying Gaussian function is defined by a variogram type, direction, major and minor ranges. Each one is compliant to a zero mean and a unit variance. They shape the global geometry, the direction, and the scales of the simulated structures. The truncation rule has as many dimensions as the number of gaussian functions. In each direction, it defines the succession of facies used when assigning facies to the different truncated parts of the gaussian. In consequence, it strongly controls the succession of facies and the possible contacts between facies (Figure 6B). Threshold values are computed based on the computed proportions of facies in the data and can vary spatially. In the case of a vertical variability, the threshold values are usually computed based on the Vertical Proportion Curve (VPC) which gives the proportions per layer of the grid. To account for lateral variability in addition to the vertical one, the threshold values can be computed on a matrix of proportion (MP) which holds VPCs as elements. In both cases (VPC and MPC), their computation is usually based on the observed data such as wells or sedimentary sections, but external information can be added to the computation for example palaeogeographical maps or seismic derived information. Thanks to its flexibility and to the large panel of possibilities to account for additional data, PGS is now widely applied in petroleum industry for building realistic geological models. It has been used for handling various applications and geological environments [Albertão et al. 2005, de Galard et al. 2005, Doligez et al. 2007, Gasparrini et al. 2017, Hamon et al. 2016, Pontiggia et al. 2010].
(A) Basic principles of the Truncated Gaussian Method: transformation of a Gaussian random function into a simulation of three facies x, y, and z with equal proportions in the domain. (B) Basic principles of the plurigaussian model: transformation of two Gaussian random functions into a simulation of three facies x, y and z, using the truncation rule illustrated in the middle and the same proportion for the three facies.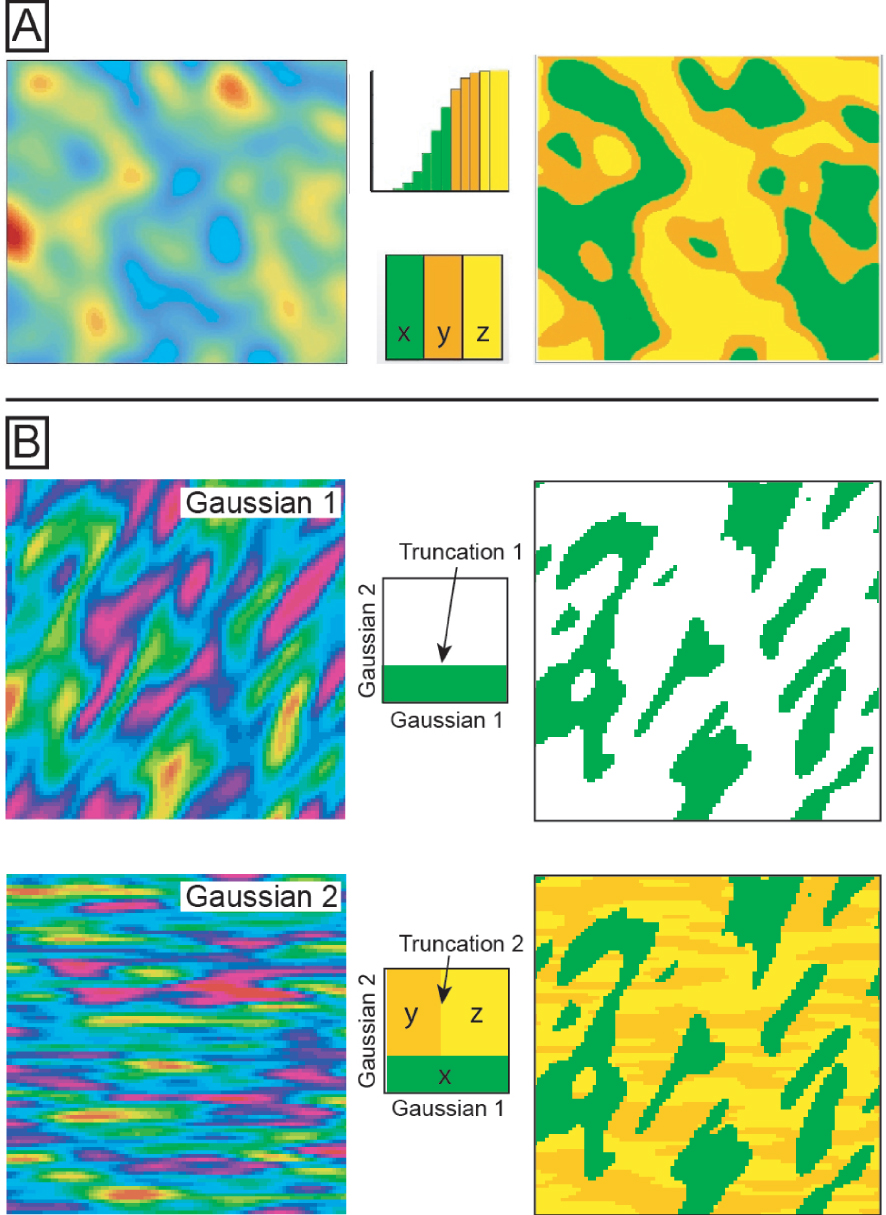
In the case of the bivariate PGS method [Beucher and Renard 2016, Renard et al. 2008], one categorical variable (usually the geological facies) is simulated by a first complete PGS defined by specific gaussian functions possibly correlated, their variogram model and specific truncation rule defined according to the sequential and spatial organization of the considered variable. The second categorical variable (for example diagenesis types, intensity or microbialite forms) simulation is defined by a second complete PGS model which parameters might be computed from a completely different dataset (hence the possible heterotopy). The two PGS simulations are linked through the given proportions of the second variable in each of the first variable classes. Finally, the different realizations of the two variables are combined to produce and visualize the joint simulation of both variables through a “combined facies”.
In our modelling workflow, for each value of the categorical variables, Gaussian distribution of their associated porosity were defined based on the thin-section measurements. The porosity values are drawn at random in these distributions according to the simulated facies.
4.2. Application to the Alemania Sequence 4 in the Cabral Corral area
The 3D reservoir grid has a horizontal regular resolution of 100 m and a vertical one of 10 cm. The top and bottom surfaces were constructed with the Gocad/Skua® geomodelling software by Emerson. They are based upon the stratigraphic surface markers [Deschamps et al. 2020] of the sequence boundaries. The top surface is the flattened reference surface and corresponds to the Sequence Boundary SB5 surface of Deschamps et al. [2020]. The bottom surface was constructed based on the Sequence Boundary SB4 surface of Deschamps et al. [2020] (Figure 1). The grid has the same vertical resolution (0.1 m) than the sections which ensures no loss of information during the numerical conversion. There is no horizontal spatial trend but a clear vertical organization visible in all wells. Hence only a single representative VPC (Figure 7B) has been computed from the 17 sections with a smoothing over 3 layers.
(A) 3D view (100 × vertical exaggeration) showing: (i) the bottom surface (SB4) discretized at 100 m resolution upon which is constructed the 3D simulation grid; the top surface is horizontal; (ii) the red 3D box which encompasses the reservoir grid; (iii) the 17 sedimentary sections, represented as vertical wells, with the discretized sedimentary facies association. (B) Vertical proportion curve (VPC) for sedimentary facies association, computed from the 17 wells available in the modelled area.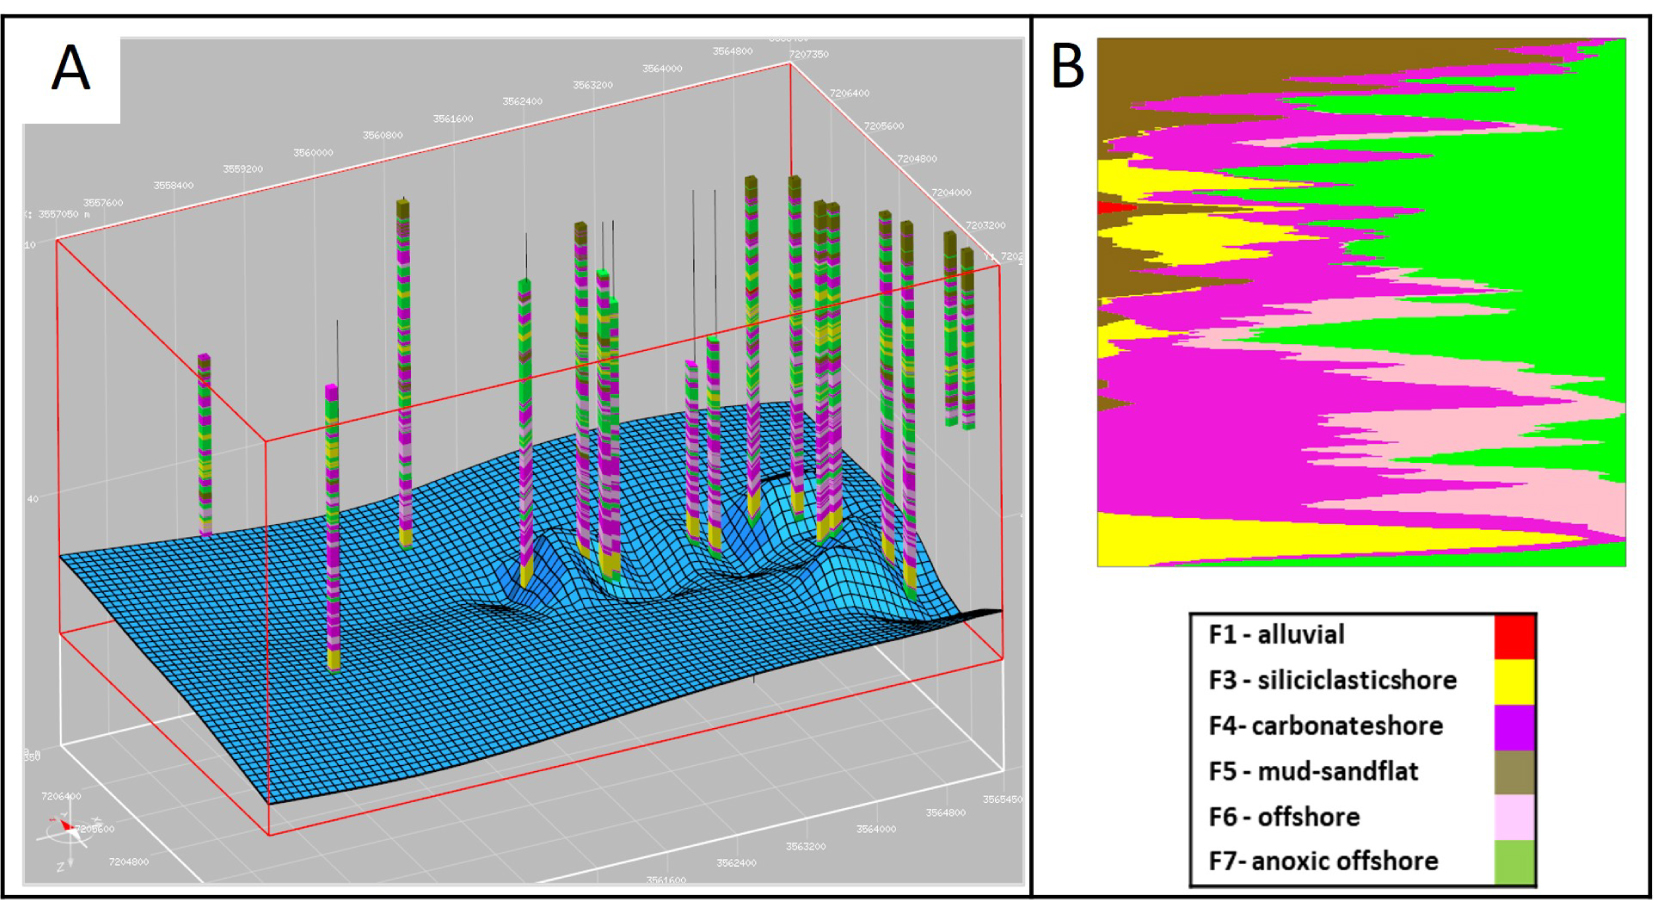
The Gaussian functions underlying the simulation of both the sedimentary facies associations (GFS1 and GFS2) and microbialite forms (GFM1 and GFM2) were defined according to the lateral continuities observed on the field (Table 1) and the depositional environment interpretation. Carbonate facies (FA5) exhibit a good lateral continuity but with an extent below the kilometer, whereas the other facies show a larger horizontal continuity over 1 km, reaching 3 km for the offshore facies (FA6, FA7). For the microbialite forms, the thrombolite coalescent domal form (M7) is relatively scarce, organized in patches with the smallest lateral extension, whereas the other microbialite forms span laterally over more than half kilometer. Therefore, in addition to different ranges (Table 3), an exponential type Gaussian Function (GFM2) subtends the simulation of the M7 form to enhance the patchy or pixelated structure in opposition to the Gaussian type that leads to smoother and more continuous spatial organization. As no preferential direction was observed on the field for any facies, variograms are isotropic for both PGS.
Bi-variate plurigaussian simulation parameters: truncation rules and gaussian functions variogram
| Truncation rule | Model | Horizontal range | Vertical range | ||
|---|---|---|---|---|---|
| Sedimentary facies association |
 |
Gaussian | 800 m | 0.4 m | GFS1 |
| Gaussian | 2000 m | 0.4 m | GFS2 | ||
| Microbialite forms |
 |
Exponential | 200 m | 0.4 m | GFM1 |
| Gaussian | 500 m | 0.4 m | GFM2 |
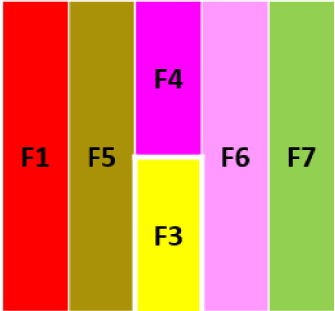
The threshold template or truncation rules (Table 3) were designed according to the depositional models (Figures 3 and 4B). In the case of the siliciclastic-dominated margin one, from proximal to distal position, the succession goes from F1 Alluvial, F5 Mudflat, F3 Siliciclastic shoreface to F6 offshore and F7 anoxic offshore. This trend is reproduced horizontally in the truncation rule. Likewise, the carbonate-dominated margin depositional model shows F5 Sandflat, F4 Carbonate shoreface in a proximal position to the offshore facies (F6 and F7) distally. This ordering can be simulated following the second line of the truncation rule. It means also that, following its other dimension, the vertical one, set for the second GFS, F3 siliciclastic shore facies can be in contact to F4 carbonate shore facies as the depositional environment of real shores can change laterally from a siliciclastic-dominated to a carbonate-dominated one farther from clastic sources.
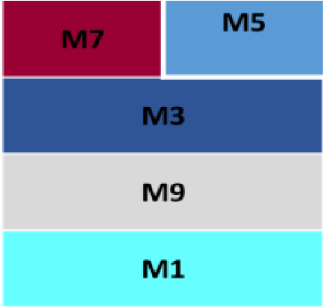
In the truncation rule for the microbialite forms, the planar mats (M1) are separated from the other forms (M3-4, M5 and M7) by the “no microbial” (M9) facies as it occurs at shallow depths, quite different from the depths of the other microbialite forms. The agglutinated forms (M5) may occur at the same locations than the stromatolite and thrombolite coalescent forms (M3-4 and M7). Hence, the template rule is defined so that the simulated microbialite forms M5 can be in contact with both M3-4 and M7. The stromatolite coalescent forms (M3-4) being more continuous than the M5, the latter was positioned with M7 on the direction defining the succession, for exponential Gaussian function (GFM2). The relative proportions of microbialite forms in each facies association (Table 2) is used to link the two PGS simulations. Due to the available porosity values, the different distributions (Figure 5) were used for their respective sedimentary facies associations and microbialite forms.
5. Results
Figure 8 illustrates one realization of the bi-variate simulation in terms of sedimentary facies associations and microbialite forms. The 3D block view (Figure 8A) shows that the vertical trend constrained by the VPC is well represented reproducing the main stratigraphic architectures visible in Figure 1C. The plan views show the horizontal distribution and lateral succession of the sedimentary facies association following the depositional model (Figure 3) imposed through the truncation template. This depositional model must be considered as a substitution facies diagram rather than a paleogeographic model. It represents the spatial facies distribution and relationships related to bathymetry. Due to the shallow depth of the lake and the palaeo-topography of the lake floor, a patchy facies distribution was expected, and correctly modeled. On palaeo-topographic highs, simulated mud/sand-flat facies associations (F5) pass laterally to carbonate (F4) or siliciclastic (F3) shore facies. In palaeo-topographic lows or depressions, anoxic offshore facies (F7) are simulated in the center and generally surrounded by simulated offshore (F6) or shore facies. Lateral extension of the simulated sedimentary facies reaches a few kilometers to hundreds of meters in accordance with the gaussian function ranges. Vertically, the simulated microbialite forms (Figure 8B) are distributed in agreement with the distribution of the simulated mud/sand-flat (F5) and carbonate shore (F4) facies associations, where they are the most present. They are organized horizontally in different kilometer-scale patches separated by the no-microbialite facies (M9): on one side, the planar mats (M1) are the most extended simulated facies with a maximum continuity of a few kilometers; on the other side, the three other microbialite forms compose the other patches. The simulated coalescent stromatolite forms (M3-4) are located around the agglutinated stromatolite (M5) and coalescent thrombolite (M7) forms. The exponential model of the Gaussian function GFM1 leads to scattered M7 forms which are the scarcest microbialites in the studied area with the shortest lateral extension. For both categorical variables, the simulation reproduces globally the distribution at the observed sections (Figures 8C and D). Except for the F5 facies association, the differences in the proportions of the observed and modelled sedimentary facies (Figure 8C) are below 1.4% with a mean difference below 0.5% (RMSE = 0.63). For the microbialite forms, the maximum difference (Figure 8D) is 3.35% for the majority (82.4%) “no microbialite” category and mean difference of 1.32% (or RMSE 1.75%).
Bi-variate simulation of sedimentary facies associations (top) and microbialite forms (bottom). (A, B), 3D views and 3 plan views of the layers 79, 167 and 295. (C, D), comparison of the proportions between simulation (right with colored patterns) and observed sections (left with plain colors).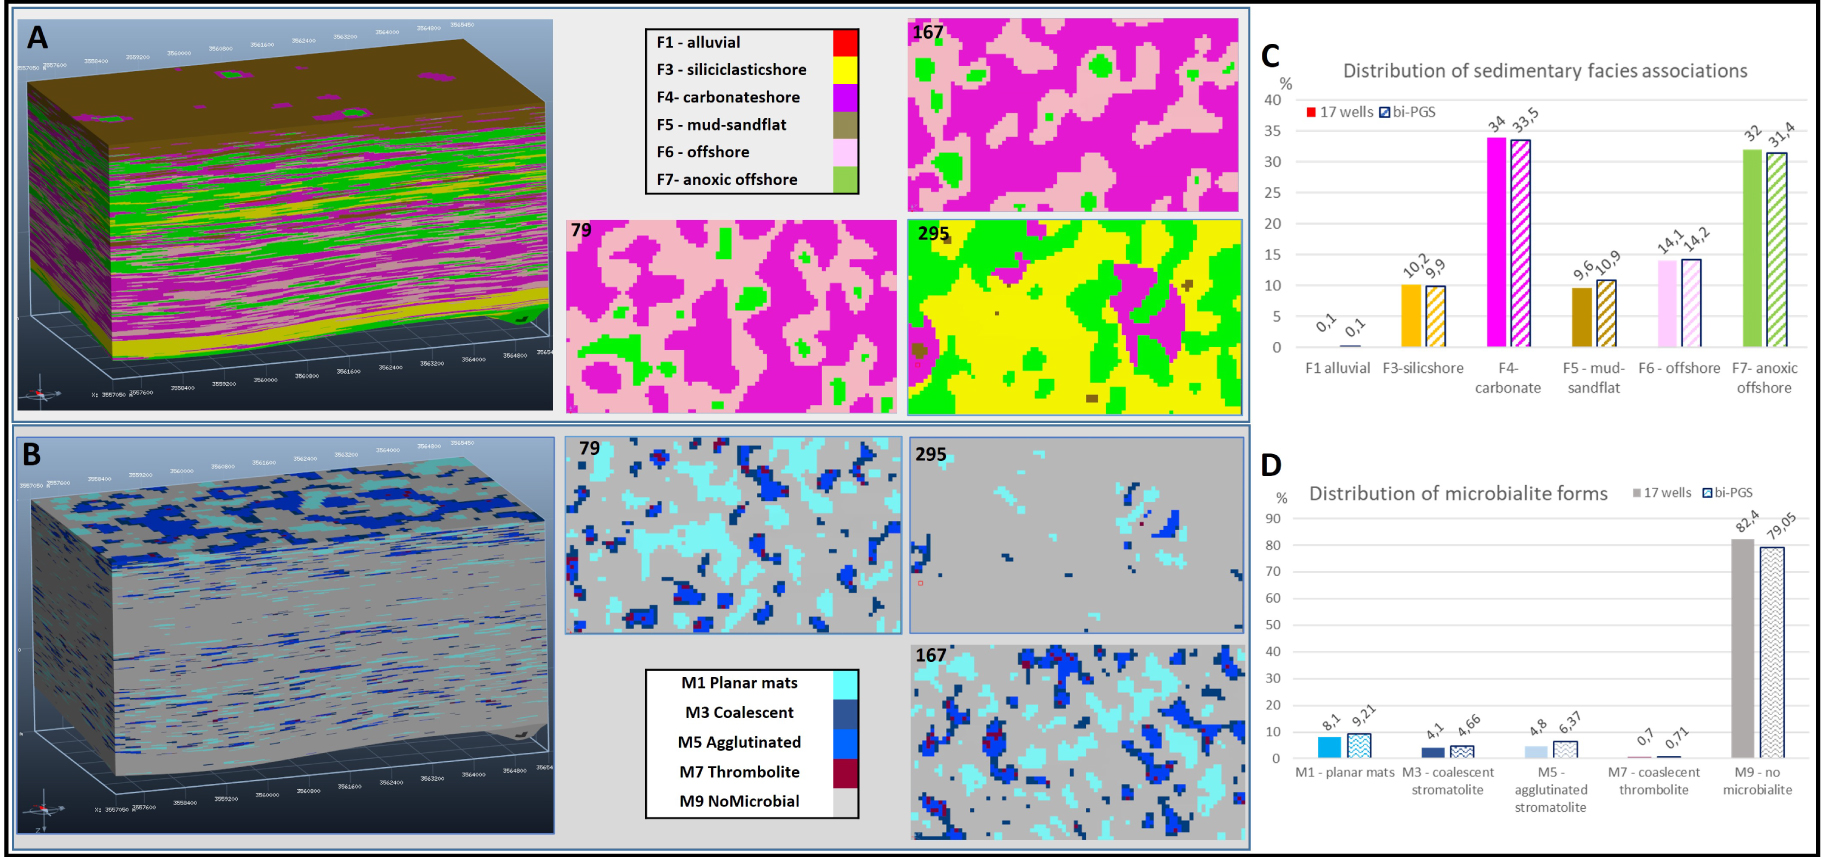
The bi-variate PGS simulation also produces a joint simulation of both categorical variables in a combined model and thus providing a visualization of the combined heterogeneity (Figures 9C and F). Planar mats (M1) as well as agglutinated stromatolites (M5), respectively colored in different shades of purple and orange, are simulated across sedimentary facies associations. Furthermore, two simulations of porosity were performed for comparison: the first with porosity distributions defined only according to the sedimentary facies association (Figure 9G), the second with different distributions for each combined facies which also takes into account the simulated microbialite form (Figure 9H). It shows the impact of the additional heterogeneity due to the microbialite forms. For example, mud/sand-flat (F5) is the most abundant sedimentary facies association in the top layers of the 3D block (Figure 9A), characterized by very low porosities (dark blue color on Figure 9G). The addition of microbialite forms such as M3-4, M5 and M7 brings patches of higher porosity in top layers (warm colors in the top layers of the 3D block on Figure 9H). Conversely, planar mats (M1) bring patches of lower porosity when they occur in sedimentary facies association of higher porosity for example carbonate shore facies (F4). On the plan view of layer 79 (Figure 9H), both effects can be identified by comparison with Figure 9G: higher values of porosity are visible where M3-4, M5 and M7 forms are simulated; conversely, additional and diffuse patches of lower values are simulated with the occurrence of M1.
Top, 3D views of the simulated facies associations (A), microbialite forms (B) and combined facies (C), white arrows underline the location of the layer k = 79 shown below for each categorical variable (D–F); Bottom, simulated porosity when considering only sedimentary facies association (G); Simulated porosity when considering the combined facies (sedimentary facies associations + microbialite forms). For these two categorical variables, color legends are defined in Figure 8.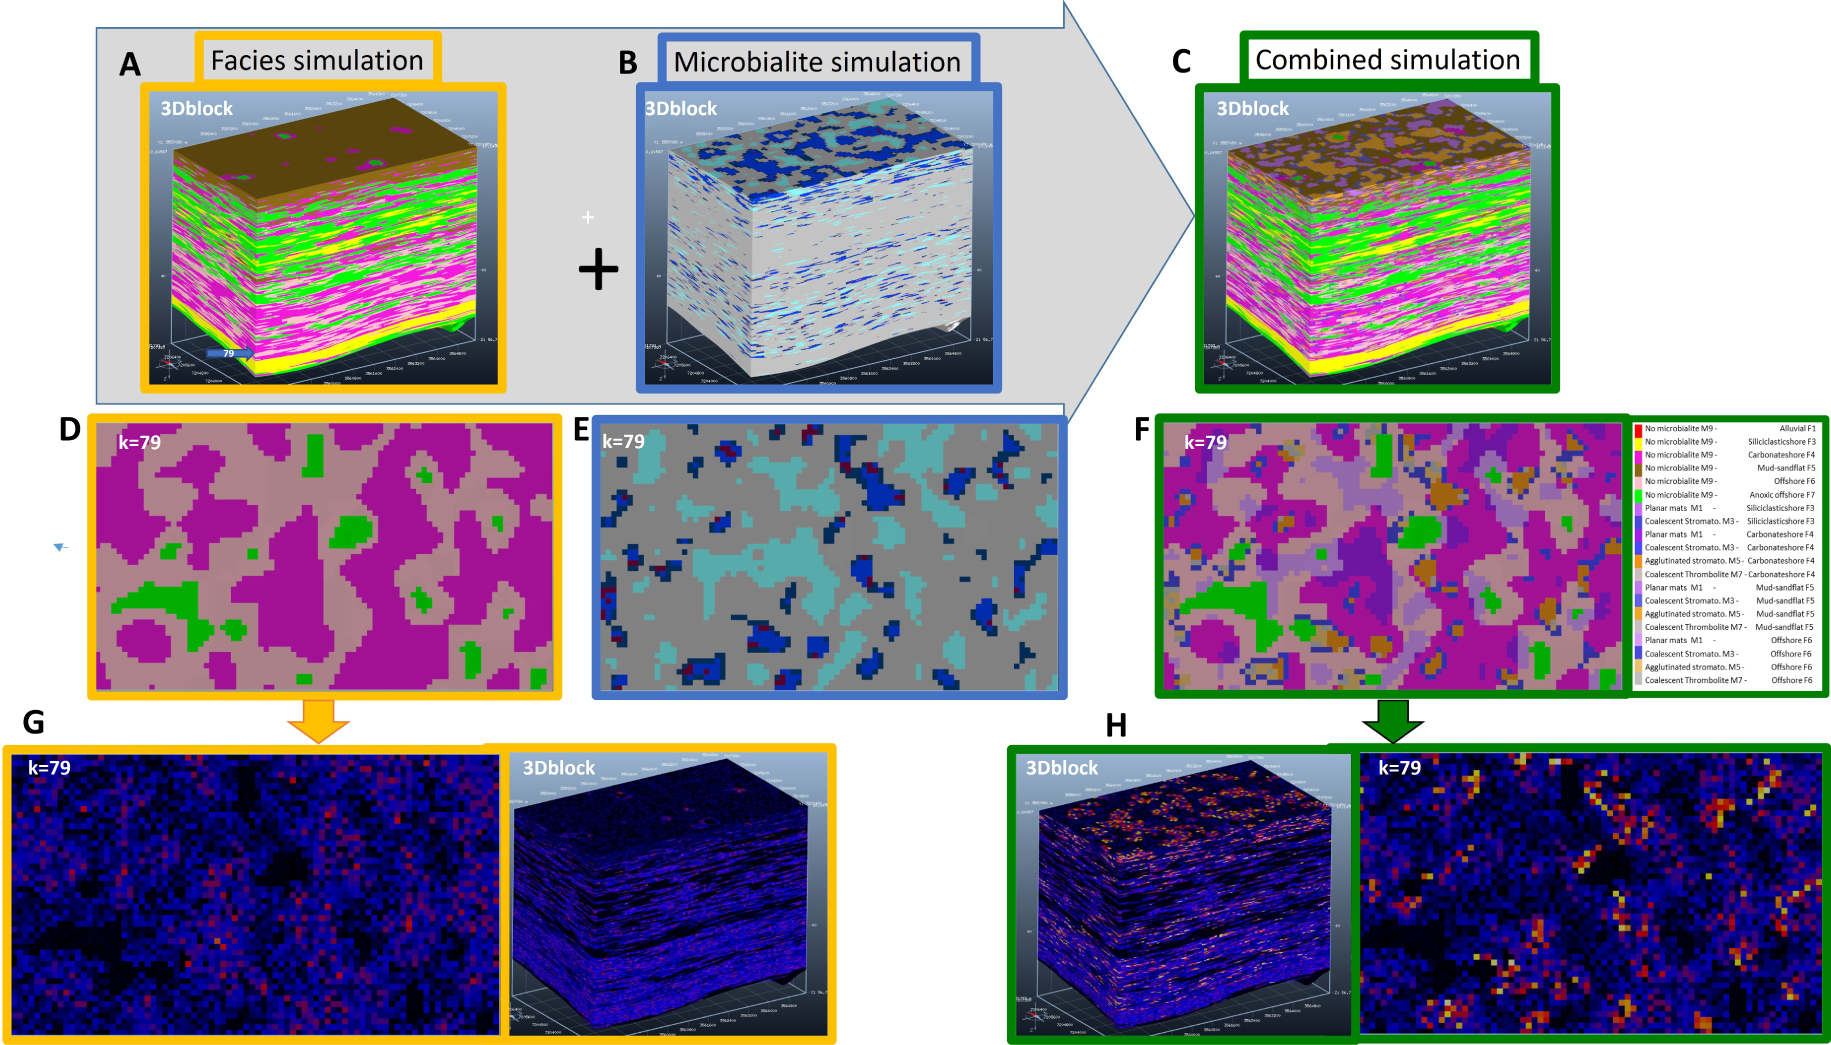
6. Discussion
6.1. Data and integration in the modelling process
The defined sedimentary facies associations regroup several sedimentary facies and represent different types of heterogeneity at smaller scale. It implies a loss in details of the description. This can be an important consideration especially when dealing with the petrophysical properties in such varying geological context. As the porosity values were computed on thin sections of characteristic sedimentary facies from 2 cores in the vicinity, we believe we captured the distribution of the porosity for the sedimentary facies associations. The vertical resolution of the grid is exactly the same than the observed sedimentary sections in the field (10 cm). No loss of information occurred during the digitalization of the data as no upscaling nor averaging was needed. Even so, the representativity of these values for the sedimentary facies associations of the area remains questionable and could be further investigated going back in details to the field observations and also by means of uncertainty analysis. It could be also an important consideration when defining the associated permeability.
The alluvial facies association represents only 0.1% of the facies associations observed at the wells. Even if it has an insignificant volumetry, this facies represents the most proximal facies of the “siliciclastic depositional model” and has, as such, an important stratigraphical meaning. This is somehow translated in the simulation through the truncation rule which is defined upon the depositional models and controls the sequence of the simulated facies. So, there is a significant impact for this level to keep this alluvial category. The truncation rule is a way to integrate soft data such as geological interpretation and conceptual models in terms of depositional environments in the stochastic modelling process. With the addition of the ranges defined from the expected continuity of the different sedimentary facies associations, allowing hence the representation of a realistic succession and size of the simulated facies associations.
The modelled microbialite forms were chosen for their potential impact on fluid flow in terms of both lateral and vertical extensions and porosity, and their relevance in relation to the grid cell dimensions. These choices as well as the modelling technique depend on the scale of interest and the model resolution. Such problematics of scale and representativeness were already emphasized by several authors who proposed different approaches. For example, in order to realistically simulate different heterogeneity levels in shoal reservoirs, Petrovic et al. [2018] used two nested 3D geo-cellular facies models: (1) a large-scale (30 × 30 km) model based on truncated Gaussian simulation (TGS), forming the basis for (2) a smaller scale (10 × 10 km), more detailed model based on multiple point statistics. Amour et al. [2013] also proposed a step-by-step methodology to simulate different orders of stratigraphic sequences and lithofacies. These authors combined a deterministic, surface-based modelling approach to represent the large-scale stratigraphic framework, in which they used stochastic methods (truncated Gaussian and sequential indicator simulations) to distribute respectively the facies association and lithofacies. This stresses out the need to elaborate scale-dependent modelling approaches to take into account a “statistical Representative Elementary Volume (REV)” if one wants to accurately represent the distribution of small-scale heterogeneities. Here the model has a 100 m horizontal resolution and 10 cm vertical resolution which is relevant to model flow barriers. Even with resolutions down to 50 m or 25 m, the choice of the considered microbialite forms in the model would have been the same as the disregarded forms were meter-scale isolated stromatolite domes.
The diagenesis imprints were not considered in this study. This process could have an important impact on the petrophysical properties. One could consider that its impact is accounted for globally in the quantification of the porosity values on the two wells samples used here. Indeed, they are quite low compared to the porosity values measured from plugs and logs from similar facies in the subsurface oil fields in the nearby Lomas de Olmedo basin probably due to different diagenetic processes and pathways [Cesaretti et al. 2000, Durieux and Brown 2007]. This study of an outcrop is not completely relevant in terms of porosity values for subsurface similar reservoir but interesting as a methodological example performed with a coherent dataset. Furthermore, it would be interesting to study the diagenesis imprints, timing and processes to better understand its spatial distribution which might be controlled by primary sedimentary and microbialite heterogeneity and initial porosity and permeability.
Structural or mechanical constraints may also have an important impact on the final porosity and hydraulic conductivity, through fracturing to be specific. It may be relevant to consider it and requires the definition of relationship between fracturing and the petrophysical properties. In the modelled area, some fractures and micro-fractures, mostly localized, have been observed at outcrop and in thin sections. The distribution of the significant structural elements could be added as an extra-step in the modelling workflow. These fractures would be modelled as DFN (Discrete Fracture Network) based on specific descriptive structural elements such as maps, fracture density, persistence. The simulation of the DFN may also be further controlled by larger structures such as faults or facies as shown by Lapponi et al. [2011]. It requires an important specific dataset gathered for this purpose and the identification of existing relationships between larger structures or facies which is not the case in this study.
6.2. Simulation results vs observed heterogeneity
The bi-variate method allows the simulation of two types of heterogeneity: the one due to the sedimentary facies variability and the one due to the microbial geobodies. For the first, it is thus possible to consider both depositional models valid for this mixed carbonate and siliciclastic environment. The microbialite heterogeneity can be simulated with its own spatial distribution and correlation dimensions through the parameter definition of the second PGS. The simulated planar mats (M1) have a kilometer scale lateral dimensions and are separated from the other simulated forms in accordance with the conceptual model (Figure 4B). The least extended coalescent thrombolite form (M7) is simulated in a few cells giving place for the agglutinated stromatolite form (M5) which has a larger lateral extension, in good agreement with the associated larger fetch of the depositional environment. The PGS method leads subsequently to the coalescent stromatolites M3-4 simulated generally as a ring or at least in the border of the M5 and M7 simulated forms, which is also coherent with the conceptual model (Figure 4B), where the M3-4 forms is in a shallower position and would appear closer to the lake shore. The correlation with the sedimentary PGS adds consistency to the whole simulation. This advantage is even more blatant when the available data of the categorical data are heterotopic, which is not the case in this study where data are available at the same locations and with the same resolution.
The bi-variate PGS method is well adapted to the case where the microbial geobodies are overprinting the sedimentary heterogeneity. It would be difficult to model this case with a nested approach as the microbial geobodies are not embedded in given sedimentary facies. A single PGS would not be sufficient to embed as many geological concepts and interpretations, spatial continuity and distribution. Some authors suggest the use of growth models [Curtis et al. 2021, Dupraz et al. 2006, Gallois et al. 2016, Johnson and Grotzinger 2006, Kozlowski et al. 2014, Xi et al. 2022]. However, the controlling factors of these processes are complex and difficult to infer from the simple sedimentary facies or depositional environments. An alternative could be to superimpose to a sedimentary simulation a Boolean method with different objects representing the different types of microbial geobodies.
7. Conclusion
A reservoir-scale geological numerical model of the sequence 4 at the top of the Yacoraite microbialite-bearing carbonate Formation has been generated with the bivariate plurigaussian approach proposed by Renard et al. [2008]. This method is able to reproduce both types of heterogeneity: the one due to the sedimentary facies and the microbialite geobodies due to the microbial activity. Simulation of the porosity associated with the combined heterogeneity allows a more realistic description of the volume/storativity of a reservoir and its connectivity. We present how we integrate concepts from the geological interpretation and conceptual models in the definition of the simulation method. We believe this work is a good illustration of how fun and fascinating dealing with the heterogeneity of such complex carbonate rock can be.
Conflicts of interest
Authors have no conflict of interest to declare.
Acknowledgments
Part of this work was supported by companies in the frame of the Joint Industrial Project COMPAS led by IFP Energies nouvelles: BHP Billiton, BP, Chevron, Cobalt Inc., Ecopetrol, ENI, ExxonMobil, GalpEnergia, Total, MaerskOil, Petrobras, Repsol, YPF S.A. We also really appreciated the support of José Salfity during several field excursions. Developments of the used prototype embedding the bi-PGS method were supported by Repsol. We would like also to thank the anonymous reviewer whose constructive comments helped in improving this paper.