


 CC-BY 4.0
1. Introduction
The explosivity of an eruption is mainly controlled by the ability of gases to escape the magma column, with overpressured gases trapped in melt likely to lead to an explosive eruption, whereas efficient outgassing may lead to effusive activity [Eichelberger et al. 1986; Woods and Koyaguchi 1994]. The conditions under which gas escapes the magma is thus a prerequisite to predict the eruptive dynamics, and depend on an interplay of many parameters involving magma characteristics [e.g., composition, temperature, volatile and crystal contents; Takeuchi et al. 2021; Popa et al. 2021] and emplacement conditions [e.g. flow and conduit properties, rates of decompression and shear; Cassidy et al. 2018].
An ascending volatile-saturated magma exsolves gases that are accommodated through bubble nucleation or growth of pre-existing bubbles in case of an initial volatile phase in excess. In highly viscous magmas (viscosity >106 Pa⋅s), bubbles are usually trapped in the melt and cannot easily migrate independently of the liquid to outgas via separated flow. If physical and time conditions permit, bubbles connect by coalescing and can develop gas channels that ultimately make the magma permeable to gases, thus allowing outgassing through fractured dome rocks or conduit walls. Rates of gas escape in silica-rich melts are difficult to assess because they depend on intrinsic parameters, such as the bubble characteristics [e.g., vesicularity, Klug and Cashman 1996; pore aperture size, Wright et al. 2009; Degruyter et al. 2010; bubble number density; Bain et al. 2019; bubble network, Burgisser et al. 2017], and external parameters related to magma emplacement kinetics. Among these external parameters, decompression rate has been demonstrated to affect bubble connectivity and permeability. The studies dealing with decompression-induced bubbles developing isotropically highlighted permeability increase at vesicularities mostly >50 vol% [Burgisser and Gardner 2005; Takeuchi et al. 2005; Okumura et al. 2012; Martel and Iacono-Marziano 2015]. Thereafter, shear has been demonstrated to drastically affect bubble connectivity and permeability, by promoting bubble coalescence [Okumura et al. 2008] and outgassing [Okumura et al. 2009; Shields et al. 2016], but also by alternately favouring and preventing connectivity where deformation resulted in magma compaction [Gonnermann et al. 2017]. If magma viscosity and/or shear rate are high enough, permeability development may proceed through magma fracturing [Stasiuk et al. 1996; Tuffen et al. 2003; Castro et al. 2012; Gaunt et al. 2014; Kushnir et al. 2017].
Many studies have been dedicated to crystal-free or -poor melts, but magmas can be highly crystallized, which affects the development of bubble connectivity. Estimates of the percolation threshold commonly range from 30 vol% [Saar and Manga 1999; Blower 2001] to 80 vol% vesicularity [Westrich and Eichelberger 1994; Takeuchi et al. 2008; Wright et al. 2009], with the highest values characterizing rapidly-decompressed crystal-free magmas. Okumura et al. [2012] experimentally decompressed rhyolitic melts containing 30 and 50 vol% corundum crystals, and concluded that gas permeability remained low until vesicularity reached >68 vol%. Lindoo et al. [2017] and deGraffenried et al. [2019] decompressed mafic and rhyolitic magmas, respectively, and reported a decrease of the percolation threshold from >60 to <50 vol% in the presence of more than about 20 vol% crystals. Parmigiani et al. [2017] numerically modelled the outgassing efficiency of a magmatic volatile phase in crystal-rich (mush-like) magmas, highlighting gas permeability from very low porosities (∼10 vol%) via a mechanism of channelling by which crystals build sustainable channels for gas percolation. Such a permeability development and outgassing at low vesicularity and high crystal content could explain the low porosity values inferred to occur in the volcanic conduit prior to Vulcanian eruptions [Collombet et al. 2021].
In crystal-bearing silicic magmas, the bubble network mostly rearranges under decompression in the central part of the volcanic conduit and simple-shear deformation at conduit edges or in lava domes where the rearrangement of the stressed crystal framework is facilitated by strain localization. To understand the processes governing the development of degassing pathways in crystal-rich silicic magmas, few studies have been dedicated to deform three-phase (melt, bubbles, crystals) magmas in simple shear using high-temperature and high-pressure deformation rigs of Paterson type. Laumonier et al. [2011] deformed a haplotonalitic melt containing 50 vol% plagioclase crystals and 11 vol% porosity, at temperature (T) of 600 °C, confining pressure (P) of 200 MPa, bulk finite shear strains (𝛾) of 1.3 and shear rates (𝛾r) from 3 × 10⁻⁵ to 1 × 10⁻³ s−1. They highlighted gas accumulation in local microstructures caused by shear-induced crystal fabric (local 𝛾 up to ∼9). Shields et al. [2014] sheared haplogranitic melts spanning crystal contents from 0 to 42 vol% and CO2-bubble contents from 12 to 36 vol%, at T < 600 °C, P of 150–200 MPa, 𝛾 up to 10, and 𝛾r from 1 × 10⁻⁴ to 5 × 10⁻⁴ s−1. They did not observe bubble coalescence and outgassing took place via sample-wide fracturing. These results of sample permeability reached by fracturing agreed with those obtained by Kushnir et al. [2017] using crystal-free haplogranitic melts with ∼15 vol% argon bubbles deformed at magmatic T of 880 °C, P of 60 MPa, 𝛾 up to 7, and 𝛾r of 1 × 10⁻⁴ to 8 × 10⁻⁴ s−1. Pistone et al. [2012] sheared haplogranitic melts with 24 to 65 vol% quartz crystals and 9–12 vol% CO2 bubbles, at T of 450–750 °C, P of 200 MPa, 𝛾 up to 8, and 𝛾r from 5 × 10⁻⁶ to 4 × 10⁻³ s−1. In the crystal-poor (24–44 vol%) samples, the authors reported bubble stretching with increasing strain, facilitating coalescence (for 𝛾 > 2 and for increasing 𝛾r) and gas channel formation, eventually leading to outgassing along the walls of the sample container. In the crystal-rich (55–65 vol%) samples, however, bubble stretching was localized in shear bands where the crystal framework (including crystal breakage) prevented gas loss.
These experimental studies provided information on the deformation of three-phase magmas at P of ∼200 MPa, T mostly close to the glass transition, for bubble contents mostly <15 vol%, and for 𝛾 up to ∼10. We aim at extending these studies to the investigation of the effect of a crystal network on bubble connectivity and gas percolation in bubbly crystal-bearing magmas emplacing at shallow depth, such as in upper volcanic conduits or lava domes, from which explosive eruptions may be triggered. We performed simple shear experiments in a Paterson rig, using three-phase magmas consisting of 0 to 50 bulk vol% plagioclase crystals and 15–30 bulk vol% H2O bubbles (20–45 vol% recalculated on the melt phase) in a haplogranitic melt, under magmatic T of 650–750 °C, confining P of 50 MPa, 𝛾 up to ∼2, and 𝛾r of 2 × 10⁻⁴ s−1. We characterized the sample microstructures and bubble connectivity as a function of crystal content and shear strain, and have discussed implications for the natural magmas and eruptive dynamics.
2. Methods
2.1. Experimental methods
The experiments consisted of three main phases: (i) synthesis of crystal-bearing hydrated glasses, (ii) decompression-induced H2O-bubble formation, and (iii) deformation in simple shear of the three-phase magmas.
2.1.1. Synthesis of crystal-bearing hydrated glasses
The method of preparation is detailed in Supplementary Section 1.1.1 and a summary is given below. The anhydrous starting glass is a haplogranite (HPG8; composition in wt%: 78.6 SiO2, 12.5 Al2O3, 4.6 Na2O, 4.2 K2O). The HPG8 glass was chosen because (i) it is rheologically well-characterized [Hess and Dingwell 1996], (ii) its eutectic composition allows experiments at relatively low T without crystallization, and (iii) it simulates late-stage crystallization of evolved liquids such as rhyolitic melts. The HPG8 hydrations were performed in internally-heated pressure vessels (at the Institut des Sciences de la Terre d’Orléans, ISTO) in order to obtain glasses with 5.0 and 9.6 wt% H2O, to which different amounts of plagioclase crystals (size of 50–90 μm) were manually added. Plagioclase crystals were chosen because they represent the main crystalline phase of silicic magmas, as phenocrysts or microcrysts. The crystal contents recalculated on the melt are 0, 21, 50, and 70 vol%, leading to bulk crystal volume (𝛷c_bulk_3D, recalculated on a bubble-bearing basis) of about 0, 10, 30, and 50 vol%.
2.1.2. Synthesis of a bubble-bearing magmas
The powder mixtures of plagioclase crystals and hydrated HPG8 glass were decompressed from 300 to 50 MPa at 850 °C in the Paterson gas-medium apparatus [Paterson and Olgaard 2000; Australian Scientific Instruments Pty Ltd, at ISTO; Figure 1a], in order to trigger a bubble nucleation event of supercritical H2O fluid (hereafter referred as to gas bubbles). The strategy was to obtain bulk amounts of bubbles around 20–40 vol%, ideally not connected to each other, in order to check whether further deformation will promote gas connectivity. The experimental details are given in Supplementary Section 1.1.2.
Experimental device and strategy. (a) Scheme of the Paterson gas-medium press, (b) Photography of the sample assembly, and (c) Pressure–temperature–time path showing the isothermal step (850 °C) of decompression-induced (300 to 50 MPa) bubble nucleation, followed by an isobaric (50 MPa) and isothermal (750 or 650 °C) step of sample torsion (𝛾 < 2) at a rate of 2 × 10⁻⁴ s−1.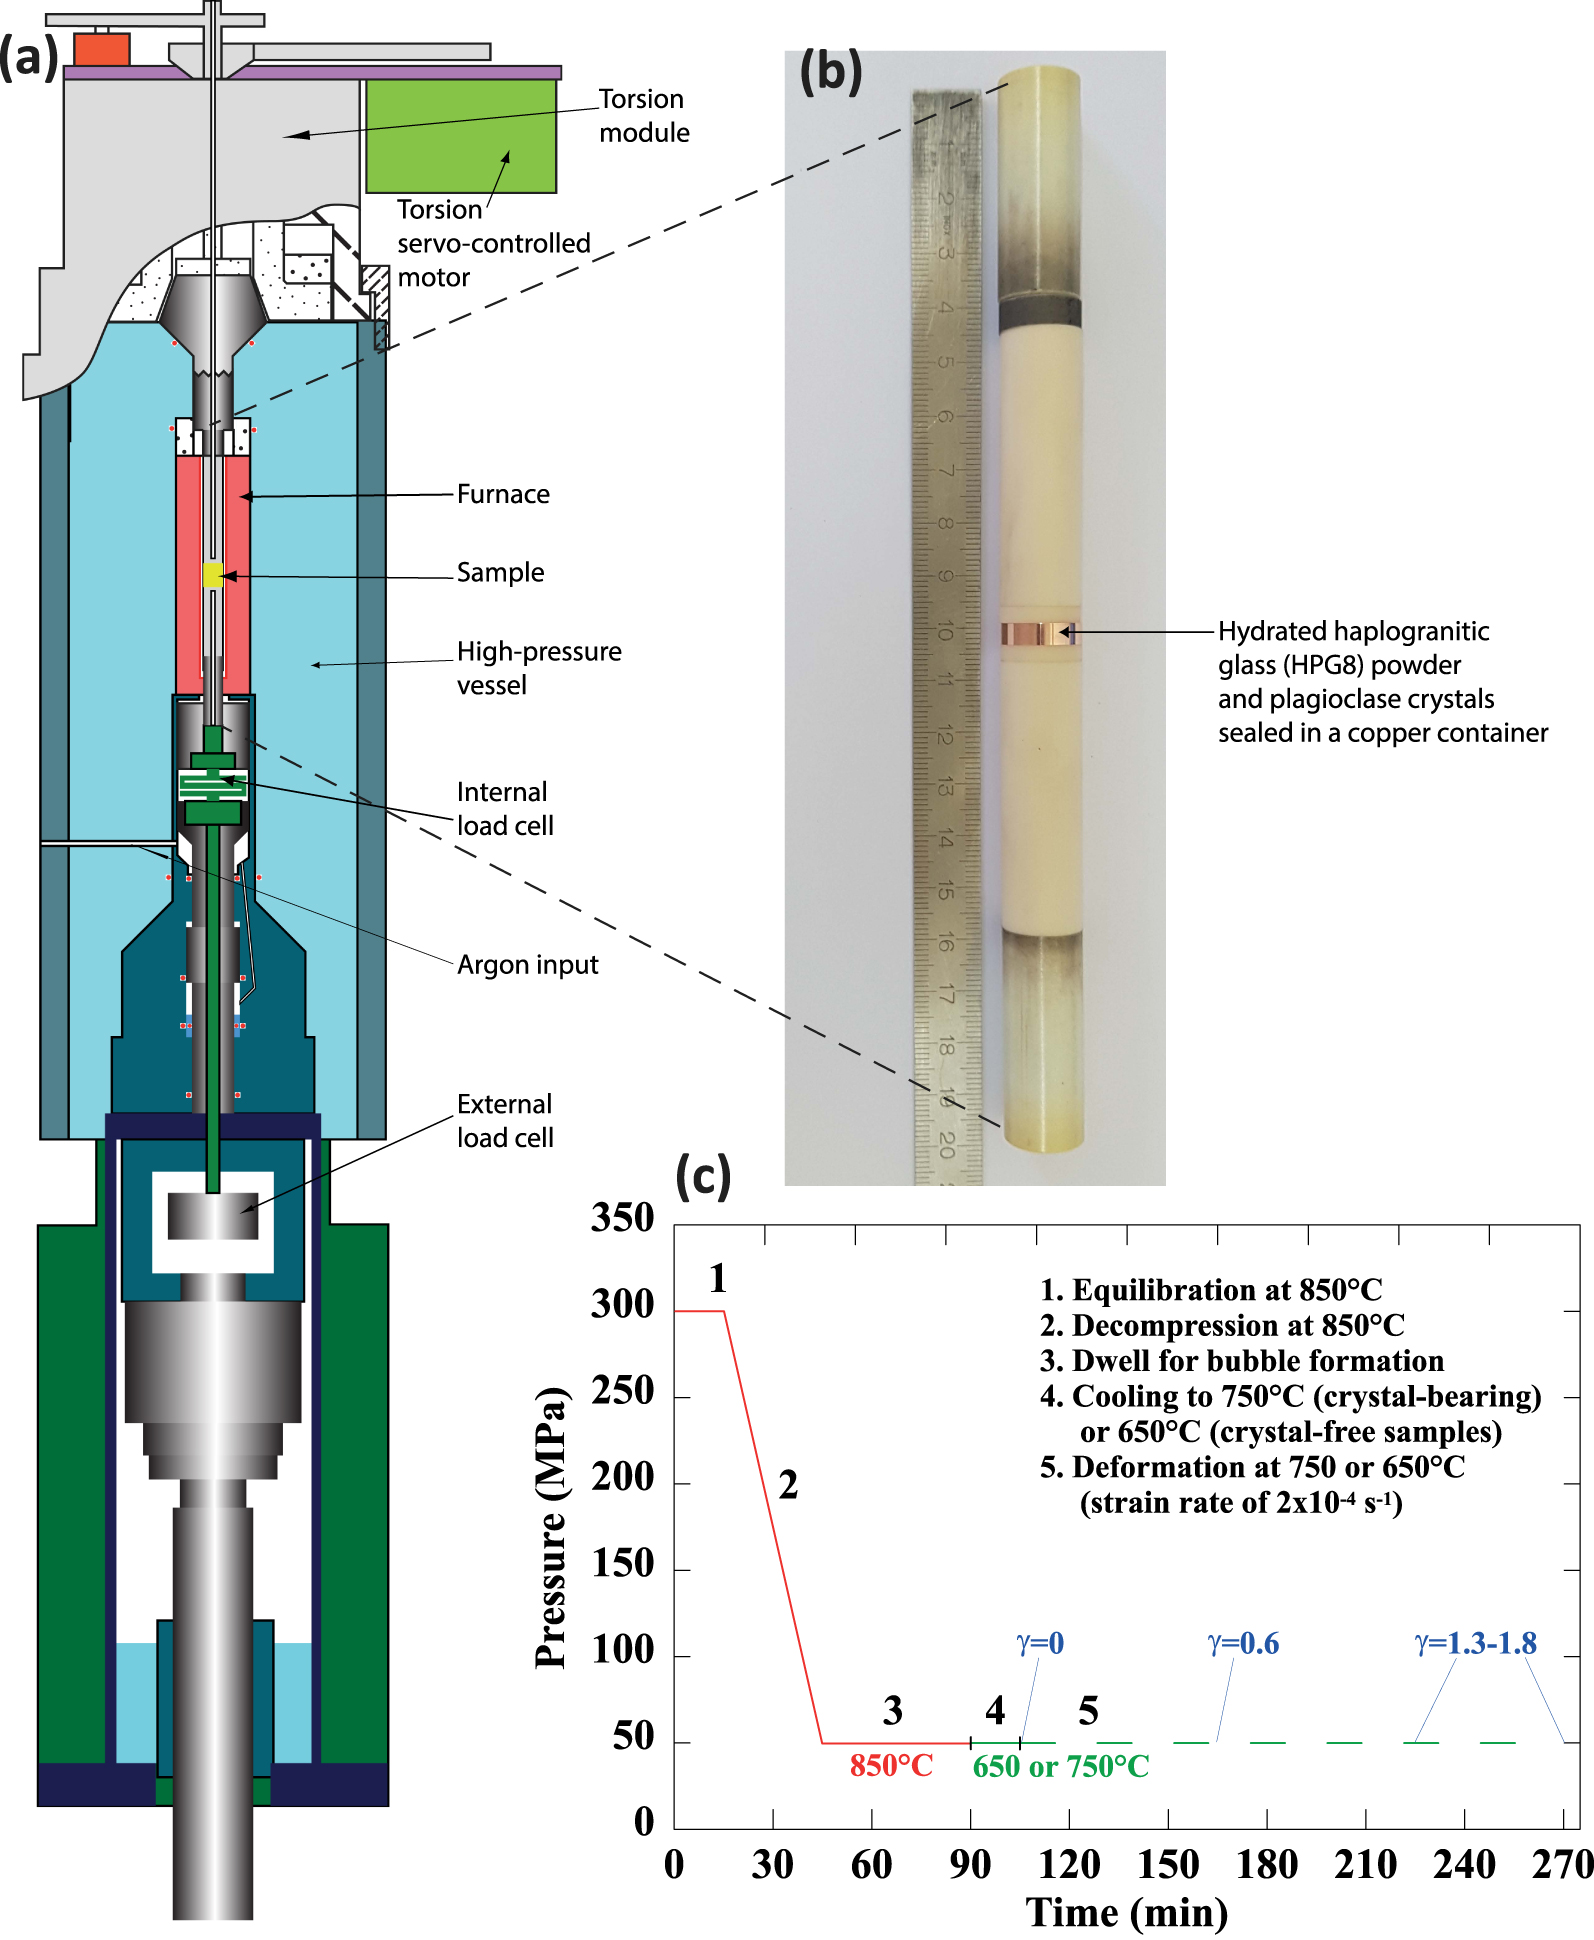
2.1.3. Torsion experiments
Keeping the experimental setup as it was after decompression, deformation in right-lateral simple shear was carried out at P of 50 MPa, T of 650 or 750 °C, 𝛾r of 2 × 10⁻⁴ s−1, and 𝛾 from 0 to 2. Such 𝛾 are rather small compared to those observed at natural conduit margins or dome bases, but the aim was to determine the gas percolation thresholds occurring during the initiation of deformation. The experimental details and calculations confirming limited relaxation of the bubbles during quenching are given in Supplementary Section 1.1.3.
2.2. Analytical methods
After experiment, the sample was cut following a section parallel to the shear plane and exposing the longitudinal tangential surfaces (maximum shear strain) for microstructural analyses using a scanning electron microscope (SEM; Merlin Compact Zeiss at ISTO). The whole section was imaged at high resolution using the SEM, and the images were segmented using the SPO2003 image-processing software [Launeau and Robin 1996; Launeau and Cruden 1998], in order to determine the two-dimensional (2D) contents, sizes, and orientations of the bubbles and the crystals, as detailed in Supplementary Section 1.2.1. A core sample bored perpendicularly to the shear plane was used for three-dimensional (3D) analyses using X-ray computed tomography (XCT; Phoenix NanoTOM at ISTO). The 3D bulk porosity (𝛷b_bulk_3D) and the amount of bubbles connected to the sample borders (𝛷b_connect_3D) were determined by segmenting the XCT images using commercial software, such as VGStudio Max and Blob3D, as detailed in Supplementary Section 1.2.2. The plagioclase crystals were hardly discernible due to their low contrast of density with the glass and were not subjected to 3D analyses.
The glass H2O contents of the bubble-bearing samples were checked following the “by-difference” method using an electron microprobe (EMP; Cameca SX Five at ISTO). As some of the residual glasses were unexpectedly rich in H2O, they were double-checked by micro-Raman spectroscopy (ISTO), as detailed in Supplementary Section 1.2.3.
2.3. Calculations
The calculations mainly concerned the gas fraction and the bulk viscosity of the samples. The expected gas fraction was determined using the equation of Jaupart and Allègre [1991], which calculates the gas volume (𝛼melt) resulting from a closed-system degassing (in that gas bubbles remain in contact with the melt), as described in Supplementary Section 1.3.1.
The samples were not viscous enough at 750 °C to allow viscosity measurements in the Paterson press, so we estimated the bulk viscosity (𝜂bulk) from Hess and Dingwell [1996] for the hydrated melt and using the equation of Truby et al. [2015] for the three-phase suspensions, as detailed in Supplementary Section 1.3.2.
3. Results
Four series with different bulk crystal contents (𝛷c_bulk_3D) of 0, 10, 30, 50 vol%, hereafter referred as to serie0, serie10, serie30, and serie50, respectively, were decompressed in the Paterson press for bubble formation and subsequent deformation in simple shear (P = 50 MPa, T = 650–750 °C, 𝛾r = 2 × 10⁻⁴ s−1) to finite deformations 𝛾 = 0 (no deformation), 𝛾 = 0.6, and 𝛾 = 1.3–1.8 (no run for serie10). The experimental conditions of the deformed bubble- and crystal-bearing magmas are given in Table 1. The analytical results are reported in Table 2 and detailed below.
Experimental conditions
| Run # | Series # | 𝛷c_melt_3Da (vol%) | H2Oib (wt%) | Pre-deformation bubble forming | Shear at P–T (𝛾r = 2×10⁻⁴ s−1) | |||||
|---|---|---|---|---|---|---|---|---|---|---|
| Decompression (from 300 MPa and 850 °C)c | Cooling at P | |||||||||
| P (MPa) | 𝜏DPd (min) | Dwell1 (min) | T (°C) | Dwell2 (min) | 𝜏defd (min) | 𝛾 | ||||
| Pp17 | serie0 | 0 | 5.0 | 50 | 19 | 45 | 650 | 15 | - | 0 |
| Pp16 | serie0 | 0 | 5.0 | 50 | 18 | 45 | 650 | 15 | 60 | 0.6 |
| Pp15 | serie0 | 0 | 5.0 | 50 | 18 | 45 | 650 | 15 | 120 | 1.3 |
| Pp5 | serie10 | 21 | 9.6 | 50 | 16 | 45 | 750 | 240 | - | 0 |
| Pp7 | serie10 | 21 | 9.6 | 50 | 18 | 45 | 750 | 15 | 60 | 0.6 |
| Pp6 | serie30 | 50 | 9.6 | 50 | 9 | 45 | 750 | 15 | - | 0 |
| Pp8 | serie30 | 50 | 9.6 | 50 | 19 | 45 | 750 | 15 | 60 | 0.6 |
| Pp9 | serie30 | 50 | 9.6 | 50 | 16 | 45 | 750 | 15 | 164 | 1.8 |
| Pp12 | serie50 | 70 | 9.6 | 50 | 18 | 45 | 750 | 15 | - | 0 |
| Pp11 | serie50 | 70 | 9.6 | 50 | 20 | 45 | 750 | 15 | 62 | 0.6 |
| Pp10 | serie50 | 70 | 9.6 | 50 | 17 | 45 | 750 | 15 | 145 | 1.5 |
a𝛷c_melt_3D is the content of plagioclase crystals manually added to the hydrated haplogranitic (HPG8) glass powder.
bH2Oi is the H2O content of the hydrated glasses that were used for the Paterson experiments, calculated after Newman and Lowenstern [2002] at 950 °C and 170 MPa (for the crystal-free series) or 400 MPa (for the crystal-bearing series).
cDecompression follows a 15-min dwell at 300 MPa and 850 °C.
d𝜏DPcand 𝜏defcare the duration of the decompressions and deformations, respectively.
Analytical results
| Run # | Series # | 𝛾 | Glass | Crystals | Bubbles | Viscositye | |||||||||||||||
|---|---|---|---|---|---|---|---|---|---|---|---|---|---|---|---|---|---|---|---|---|---|
| 𝛷g_bulk_2D (calc) (vol% ±3) | H2Ocalca (wt%) | H2Omeasa (wt%) | 𝛷c_bulk_2D (area%) | Log CND_2D (m−2) | Rcb | 𝜃cb (°) | 𝛷b_bulk_3Dc (vol% ±3) | 𝛷b_connect_3Dc (%, ±3) | 𝛷b_bulk_2D (area%) | 𝛷b_melt_2D (calc) (area%) | Log BND_2D (m−2) | Log BND_3D (m−3) | Rbb | 𝜃bb (°) | 𝛼meltd (vol%) | Log 𝜂melt (Pa⋅s) | Log 𝜂bulk (Pa⋅s) | ||||
| with H2Ocalc (wt%) | with H2Omeas (wt%) | ||||||||||||||||||||
| Pp17 | serie0 | 0 | 69 | 3.2 | 3.6 | 0 | n.a. | n.a. | n.a. | 30(28) | 49 | 31 ± 3 | 31 ± 3 | 5.6 ± 0.1 | 10.6 | 1.3 ± 0.1 | −10 ± 21 | 27 | 22 | 7.1 | 7.3 |
| Pp16 | serie0 | 0.6 | 76 | 3.2 | n.a. | 0 | n.a. | n.a. | n.a. | 21(20) | 52 | 24 ± 2 | 24 ± 2 | 5.7 ± 0.1 | 10.6 | 1.9 ± 0.2 | +22 ± 6 | 27 | n.a. | n.a. | n.a. |
| Pp15 | serie0 | 1.3 | 79 | 3.2 | 4.1 | 0 | n.a. | n.a. | n.a. | 15(21) | 50 | 30 ± 4 | 30 ± 4 | 5.7 ± 0.1 | 10.5 | 2.0 ± 0.3 | +23 ± 6 | 27 | 15 | 6.8 | 7.0 |
| Pp5 | serie10 | 0 | 63 | 2.8 | 6.1(5.1) | 9 ± 1 | 4.8 ± 0.2 | 1.1 ± 0.1 | +15 ± 33 | 28(29) | 59 | 29 ± 3 | 31 ± 3 | 5.6 ± 0.2 | 9.3 | 1.0 ± 0.1 | +20 ± 43 | 60 | 41 | 4.9 | 5.2 |
| Pp7 | serie10 | 0.6 | 65 | 2.8 | 5.3(5.9) | 12 ± 2 | 5.1 ± 0.3 | 1.1 ± 0.1 | +18 ± 3 | 18(23) | 64 | 24 ± 3 | 27 ± 3 | 5.2 ± 0.2 | 9.2 | 1.3 ± 0.1 | +35 ± 4 | 60 | 46 | 5.2 | 5.4 |
| Pp6 | serie30 | 0 | 63 | 2.8 | n.a.(4.3) | 28 ± 1 | 5.5 ± 0.2 | 1.1 ± 0.1 | +44 ± 31 | 22(22) | 37 | 15 ± 3 | 20 ± 3 | 5.8 ± 0.1 | 9.3 | 1.0 ± 0.1 | −8 ± 74 | 60 | n.a. | n.a. | n.a. |
| Pp8 | serie30 | 0.6 | 57 | 2.8 | n.a. | 29 ± 4 | 5.5 ± 0.1 | 1.1 ± 0.1 | +58 ± 38 | 25(27) | 83 | 20 ± 3 | 26 ± 3 | 5.6 ± 0.1 | 9.3 | 1.0 ± 0.1 | +33 ± 17 | 60 | n.a. | n.a. | n.a. |
| Pp9 | serie30 | 1.8 | 62 | 2.8 | 3.0 | 33 ± 4 | 5.6 ± 0.2 | 1.1 ± 0.1 | +26 ± 13 | 15(10) | 80 | 23 ± 12 | 26 ± 12 | 5.7 ± 0.1 | 9.9 | 1.0 ± 0.1 | +38 ± 22 | 60 | 57 | 6.2 | 6.9 |
| Pp12 | serie50 | 0 | 53 | 2.8 | 4.9 | 48 ± 3 | 5.5 ± 0.3 | 1.1 ± 0.1 | +40 ± 27 | 19(19) | 87 | 14 ± 2 | 21 ± 2 | 6.1 ± 0.1 | 10.2 | 1.0 ± 0.1 | −13 ± 42 | 60 | 49 | 5.3 | 6.5 |
| Pp11 | serie50 | 0.6 | 54 | 2.8 | n.a. | 43 ± 4 | 5.8 ± 0.1 | 1.1 ± 0.1 | +27 ± 8 | 16(15) | 76 | 16 ± 10 | 23 ± 10 | 6.1 ± 0.1 | 10.0 | 1.0 ± 0.1 | +33 ± 36 | 60 | n.a. | n.a. | n.a. |
| Pp10 | serie50 | 1.5 | 49 | 2.8 | 2.7 | 39 ± 7 | 6.1 ± 0.2 | 1.1 ± 0.1 | +28 ± 2 | 25(27) | 99 | 39 ± 17 | 44 ± 17 | 5.9 ± 0.3 | 9.5 | 1.0 ± 0.1 | −1 ± 36 | 60 | 58 | 6.4 | 7.4 |
n.a. indicates not analyzed;
aH2Ocalc is the H2O solubility at 650 or 750 °C and 50 MPa calculated after Newman and Lowenstern [2002]; H2Omeas is the glass H2O content measured by EMP (analytical uncertainty of ±0.7 wt%) and by Raman spectroscopy in bracket (average of 2 to 3 analyses with statistical error from ±0.2 to ±0.7 wt%).
b𝜃c and 𝜃b are the orientations to the horizontal of the bubbles and crystals, respectively; R gives the bubble mean eccentricity as the ratio of the long axes to the short axes.
c𝛷b_bulk_3D gives the bulk porosity measured on cubic samples of 1400-μm side volume and at smaller scale (600-μm side) in brackets; 𝛷b_connect_3D gives the percentage of bubbles connected to the sample outside, as defined in Supplementary Section 1.
d𝛼melt is calculated after Jaupart and Allègre [1991] for a degassing from the H2O content of the pre-hydrated glass (H2Oi in Table 1) to either H2Ocalc or H2Omeas.
e𝜂melt is the viscosity of the hydrated melt calculated at 650 or 750 °C after Hess and Dingwell [1996] using H2Omeas; 𝜂bulk is the viscosity of the three-phase (crystal, bubble, melt) suspension calculated after Truby et al. [2015] using 𝜂melt, 𝛷c_bulk_2D, and 𝛷b_melt_2D (see text and Supplementary Section 1 for details).
3.1. Crystal-free series (serie0)
The SEM pictures of the samples from serie0 show relatively homogeneous spatial distributions of the bubbles (Figure 2a–c), in agreement with the absence of strain localization expected from the Newtonian behaviour of pure melts. Melt porosity, 𝛷b_melt_2D, is 31 ± 3, to 24 ± 2 and 30 ± 4 area%, at 𝛾 = 0, 0.6, and 1.3, respectively (Figure 3a), in relatively good agreement with the porosities measured from the XCT images, 𝛷b_bulk_3D, which are 30 ± 3, 21 ± 3, and 15 ± 3 vol%, respectively. The content of bubbles connected to the sample outside measured from the XCT images, 𝛷b_connect_3D, represents about half of the 𝛷b_bulk_3D (i.e., 49 ± 3, 52 ± 3, and 50 ± 3 vol%, at 𝛾 = 0, 0.6, and 1.3, respectively). The 2D bubble number densities measured from the SEM images, BND_2D, are of 105.6–5.7±0.1 m−2 (Figure 4a) and those determined using the XCT, BND_3D, are 1010.5–10.6 m−3. In the undeformed sample, 95% of the bubbles have equivalent diameters of 20–40 μm, representing about half of the total vesicularity. The other half volume is made of bubbles with up to 300 μm diameter (Supplementary Figure 3a). Bubble eccentricity, Rb, increases from 1.3 ± 0.1 to 1.9 ± 0.2 and 2.1 ± 0.3 with increasing 𝛾, with a slight preferential orientation of the bubbles, 𝜃b of ∼22 ± 6° (Figure 4b). Glass H2O contents measured following the EMP by-difference method are 3.6 ± 0.7 wt% at 𝛾 = 0 and 4.1 ± 0.7 wt% at 𝛾 = 1.3, giving bulk viscosities of 107.3 and 107.0 Pa⋅s, respectively.
SEM pictures of the samples cut following the sketch shown in Supplementary Section 1.2.1. Increasing shear strain from 𝛾 = 0 to 2 (from left to right) and crystal content from 0 to 50 vol% (from top to down) promotes the development of non-spherical bubbles and heterogeneities in bubble spatial distribution. All main pictures have a yellow scale bar of 4 mm and subpanels are enlargements (with different coloured scale bars). The red arrows in (i) and (k) point to crystal fragmentations.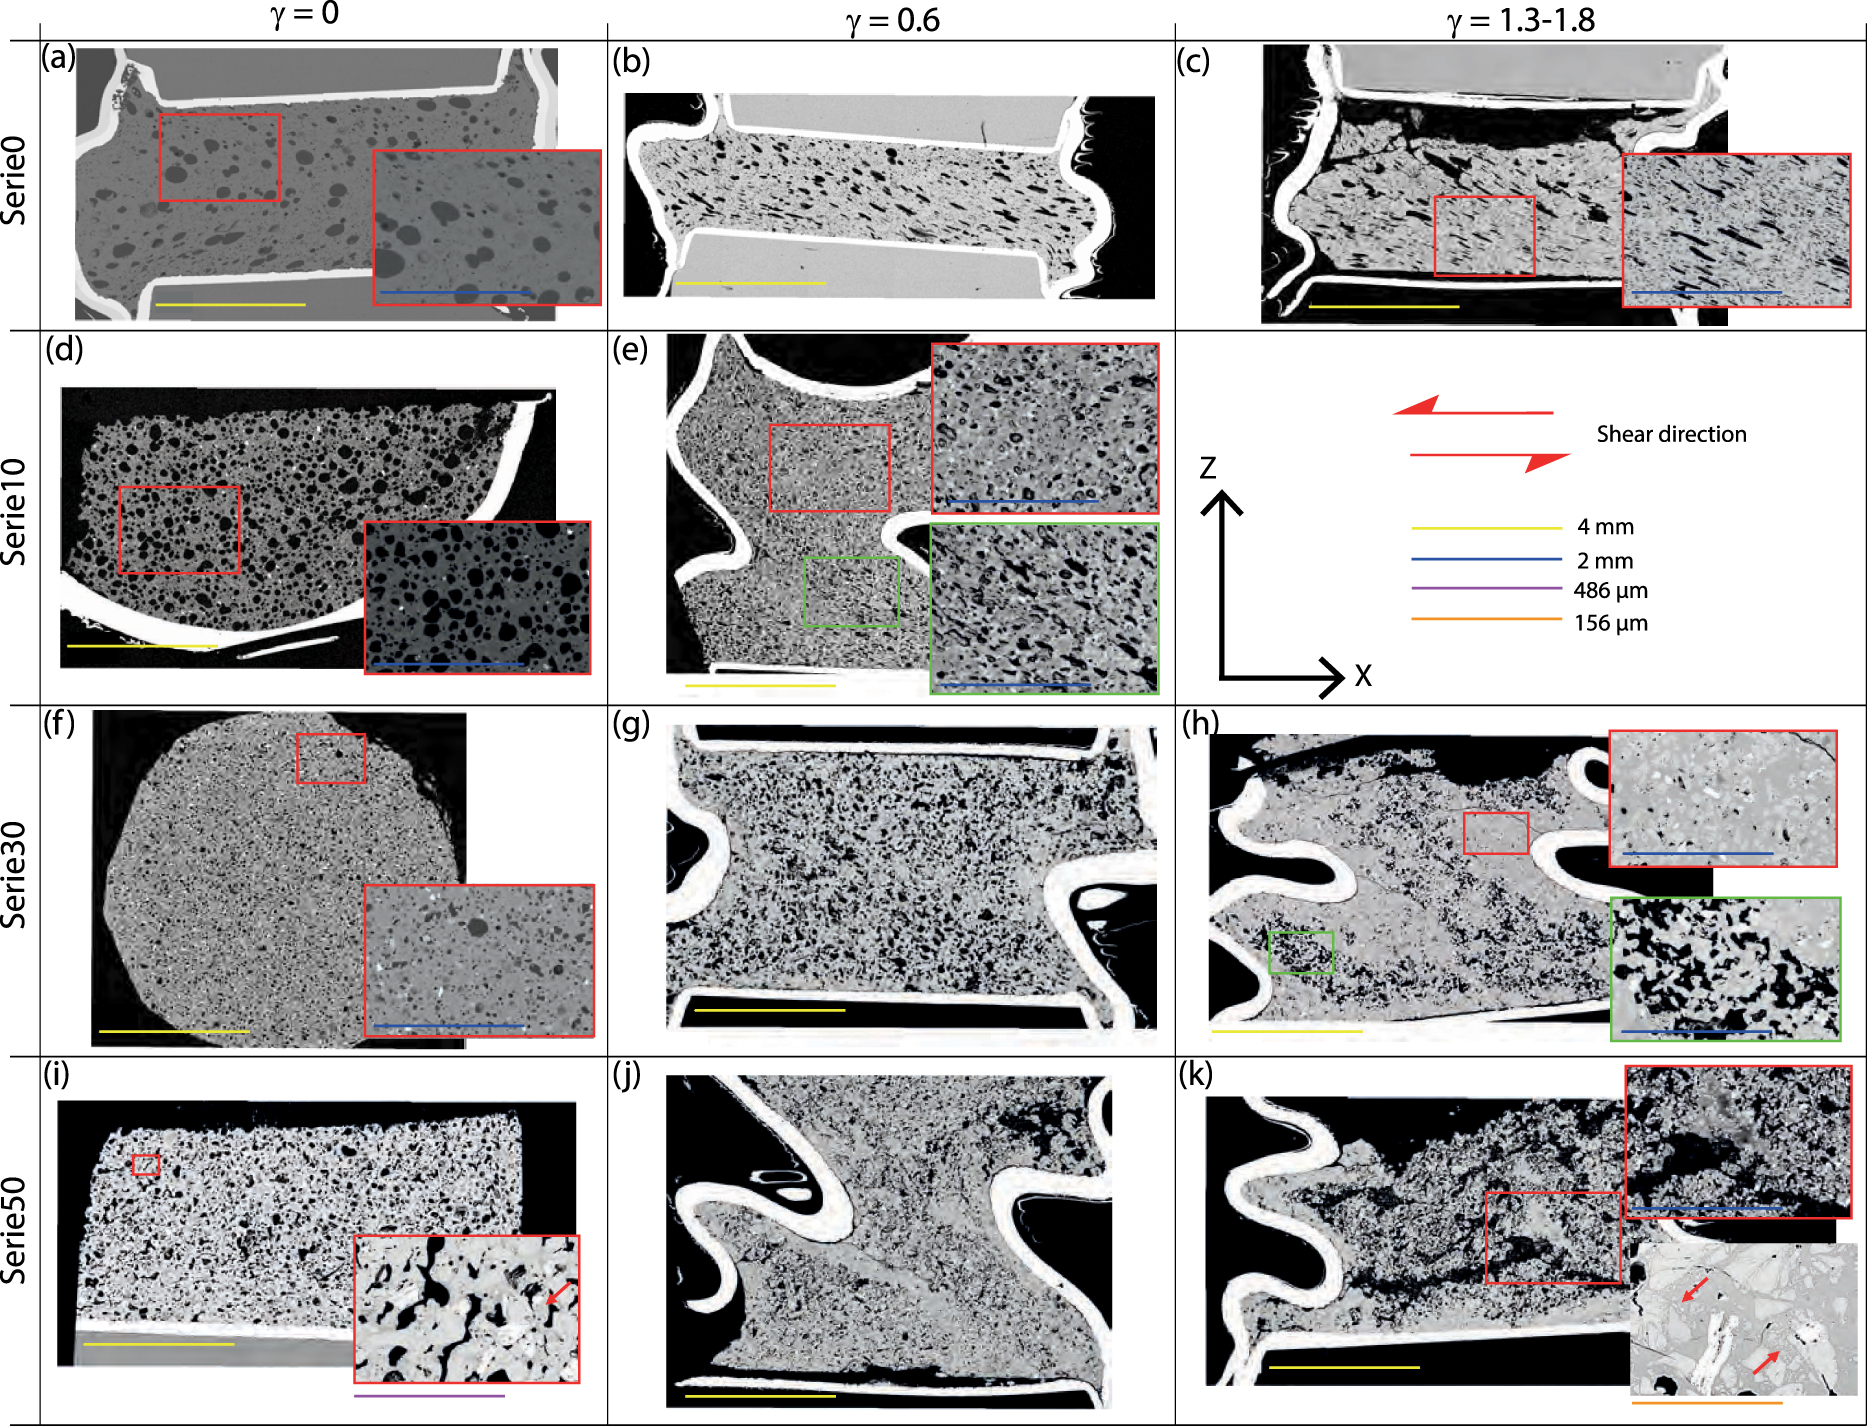
3.2. Series with 10% crystals (serie10)
Serie10 consists of only a 𝛾 = 0 (undeformed) sample and a 𝛾 = 0.6 sample, since higher shear strains inevitably conducted to capsule tearing. The deformed sample shows incipient shear zones marked by discrete local reorganisation of the bubbles and crystals (Figure 2e). 𝛷b_melt_2D slightly decreases from 31 ± 3 area% at 𝛾 = 0 to 27 ± 3 area% at 𝛾 = 0.6 (Figure 3a). Recalculating bulk porosities (i.e. including crystals) give 𝛷b_bulk_2D of 29 ± 3 area% at 𝛾 = 0 and 24 ± 3 area% at 𝛾 = 0.6, in good agreement with the XCT 𝛷b_bulk_3D of 28 ± 3 vol% at 𝛾 = 0 and 18 ± 3 vol% at 𝛾 = 0.6. BND_2D is 105.6±0.2 m−2 at 𝛾 = 0 and 105.2±0.2 m−2 at 𝛾 = 0.6 (Figure 4a), and BND_3D is 109.2–9.3 m−3. In the undeformed sample, about 80% of the bubbles have diameters of 20–40 μm, but their volumes only represent less than 10% of total vesicularity. More than one third of the vesicularity is occupied by bubbles with equivalent diameters of 220–240 μm (Supplementary Figure 3b). The bubbles have Rb of 1.0 ± 0.1 at 𝛾 = 0 and 1.3 ± 0.1 at 𝛾 = 0.6, showing no preferential orientation (𝜃b of 20 ± 43°) in the unsheared sample (Figure 4b). The glass H2O contents are of 6.1 ± 0.7 wt% at 𝛾 = 0 and 5.3 ± 0.7 wt% at 𝛾 = 0.6. The crystal contents, 𝛷c_bulk_2D, are of 9 ± 1 area% at 𝛾 = 0 and 12 ± 2 area% at 𝛾 = 0.6. The crystal number densities, CND, are 104.8±0.2 m−2 at 𝛾 = 0 and 105.1±0.3 m−2 at 𝛾 = 0.6 (Figure 4a). The crystals have eccentricities, Rc, that are not varying from 1.1 ± 0.1 with 𝛾, and their main orientations, 𝜃c, is 15 ± 33° at 𝛾 = 0 and 18 ± 3° at 𝛾 = 0.6 (Figure 4b).
Bubble formation. (a) Measured porosity versus porosity calculated for a H2O degassing from the initial content (5.0 wt% for the crystal-free samples and 9.6 wt% for the others) to the final content measured in the residual glasses, after the equation of Jaupart and Allègre [1991]; the two arrows on the X-axis give the gas content calculated for an equilibrium H2O exsolution (i.e., final content is H2O solubility at 50 MPa); the vertical error bars are not statistical uncertainties but span the whole range of the measured values; (b) Difference between the H2O contents measured in the residual glasses (circles and stars using electron microprobe and Raman spectrometry, respectively; technical details in Supplementary Section 1) and H2O solubility at final pressure (dashed box), showing incomplete H2O exsolution in some samples.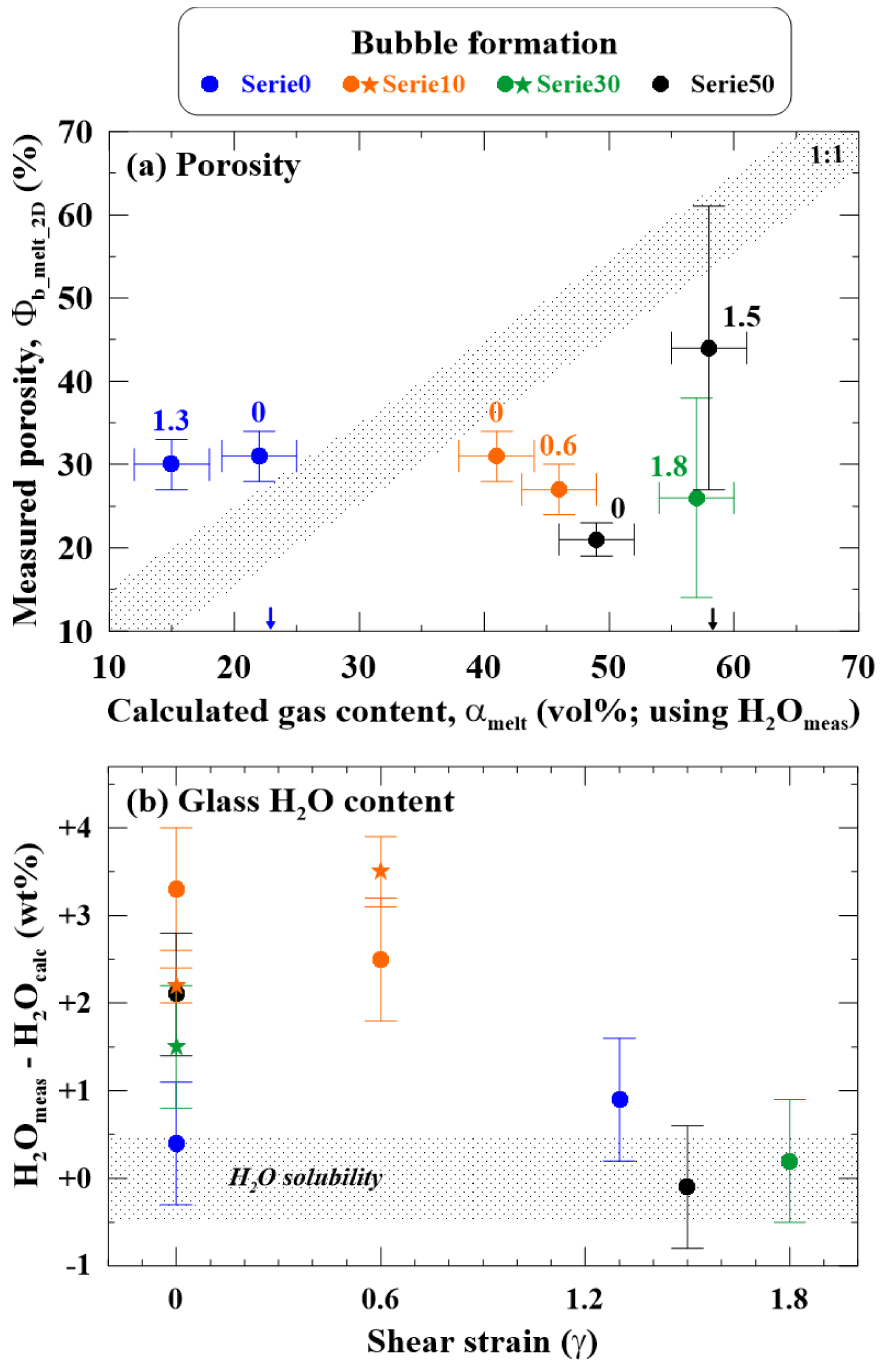
Bubble and crystal characteristics. (a) Number density and (b) Preferential orientations (0° is parallel to shear direction), with the dashed red line giving the theoretical angles between particle major axis and shear direction calculated for solid particles with eccentricity of 1.1, using the formulation of Fernandez et al. [1983]; the X-axis values have been slightly shifted for clarity; the vertical bars are not statistical uncertainties but span the whole range of the measured values.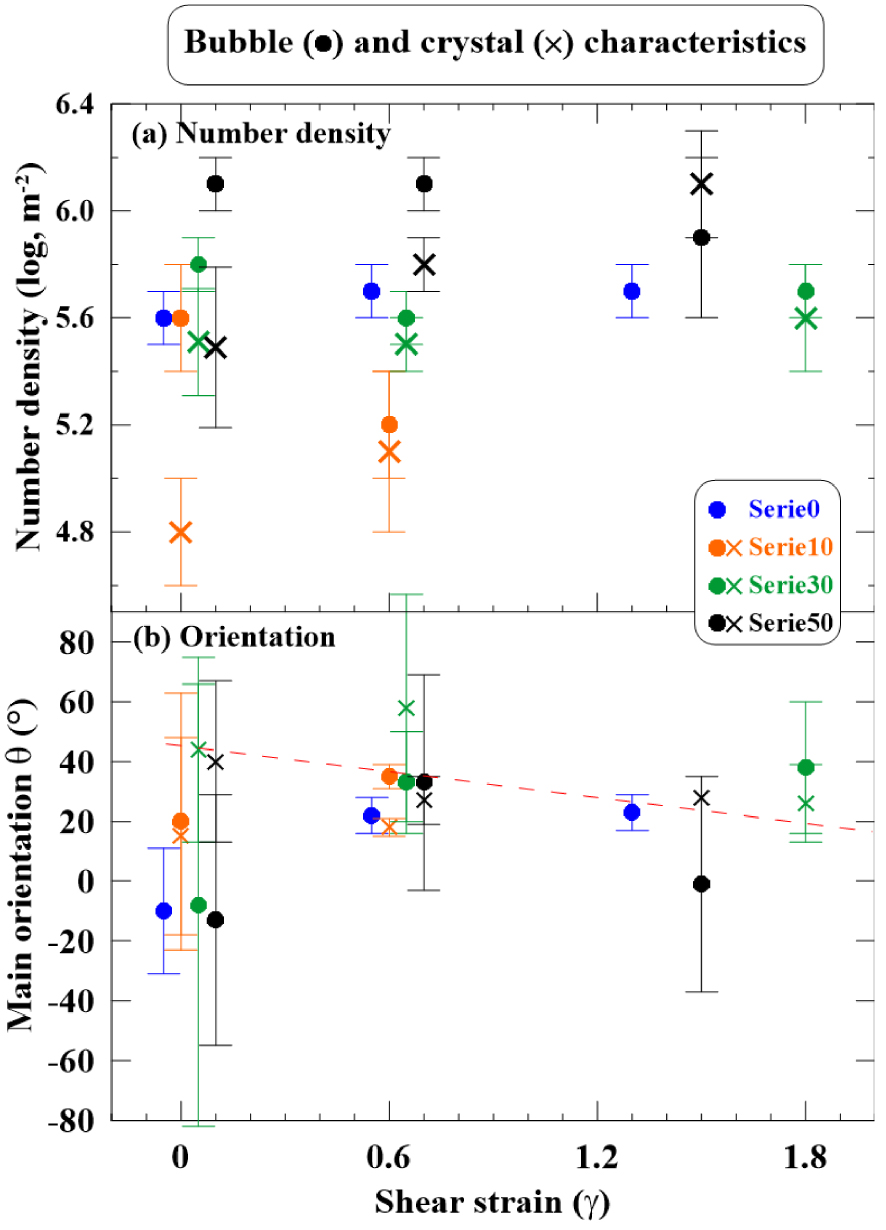
3.3. Series with 30% crystals (serie30)
Serie30 shows shear zones of reorganised bubbles and crystals, evidencing an intensification of strain localisation from 𝛾 = 0.6 to 1.8 (Figure 2g,h). 𝛷b_melt_2D are 20 ± 3, 26 ± 3, 26 ± 12 area% at 𝛾 = 0, 0.6, and 1.8, respectively (Figure 3a). Recalculating bulk porosities gives 𝛷b_bulk_2D of 15 ± 3, 20 ± 3, 23 ± 12 area% at 𝛾 = 0, 0.6, and 1.8, respectively. The XCT 𝛷b_bulk_3D gives 22 ± 3, 25 ± 3 and 15 ± 3 vol% at 𝛾 = 0, 0.6, and 1.8, respectively. BND_2D is 105.6–5.8±0.1 m−2 (Figure 4a) and BND_3D is 109.3 m−3 at 𝛾 = 0 and 0.6, and 109.9 m−3 at 𝛾 = 1.8. The undeformed sample shows more than 90% of bubbles with 20-μm diameters, the volume of which represents one third of total vesicularity. The rest of the vesicularity is mostly occupied by bubbles with equivalent diameters from 40 to 140 μm, with some larger bubbles up to 240 μm diameter (Supplementary Figure 3f). The bubbles have Rb of 1.0 ± 0.1 at any 𝛾, showing no preferential orientations (𝜃b of 33–38°; Figure 4b). Glass H2O content was only analysed at 𝛾 = 1.8, giving 3.0 ± 0.7 wt%. 𝛷c_bulk_2D is 28 ± 1 area% at 𝛾 = 0, 29 ± 4 area% at 𝛾 = 0.6, and 33 ± 4 area% at 𝛾 = 1.8. The CND is 105.5–5.6±0.2 m−2 at any 𝛾 (Figure 4a). Rc are not varying from 1.1 ± 0.1 with 𝛾. 𝜃c are 44 ± 31°, 58 ± 38°, and 26 ± 13° in the samples at 𝛾 = 0, 0.6, and 1.8, respectively (Figure 4b).
3.4. Series with 50% crystals (serie50)
Serie50 shows strong features of strain localization in the deformed samples, with alternation of strongly bubble-depleted zones and channelized bubble zones (Figure 2j,k). 𝛷b_melt_2D increases from 21 ± 2, 23 ± 10, 44 ± 17 area% with 𝛾 increasing from 0, to 0.6 and 1.5 (Figure 3a). Bulk 𝛷b_bulk_2D gives 14 ± 2, 16 ± 10, and 23 ± 17 area% at 𝛾 = 0, 0.6, and 1.5, respectively, in good agreement with the XCT 𝛷b_bulk_3D of 19 ± 3, 16 ± 3 and 25 ± 3 vol%. BND_2D is 106.1±0.1 m−2 at 𝛾 = 0 and 0.6, and 105.9±0.3 m−2 at 𝛾 = 1.5 (Figure 4a). BND_3D is 1010.0–10.2 m−3 at 𝛾 = 0 and 0.6, and 109.5 m−3 at 𝛾 = 1.5. In the undeformed sample, 95% of the bubbles have diameters of 20 μm, representing about 25% of the total vesicularity. Another third of the volume is occupied by bubbles with equivalent diameters of 240–260 μm (Supplementary Figure 3i). The bubbles have Rb of 1.0 ± 0.1 at any 𝛾, not showing significant preferential orientations (𝜃b from −13 to +33°, with standard deviations >35°; Figure 4b). The glass H2O contents are 4.9 ± 0.7 wt% at 𝛾 = 0 and 2.7 ± 0.7 wt% at 𝛾 = 1.5. 𝛷c_bulk_2D is of 39–48 area% whatever 𝛾. The CND increases from 105.5±0.3 m−2 at 𝛾 = 0 to 105.8±0.1 m−2 at 𝛾 = 0.6 and 106.1±0.2 m−2 at 𝛾 = 1.5 (Figure 4a). Rc are not varying from 1.1 ± 0.1 with 𝛾. 𝜃c are 40 ± 27°, 27 ± 8°, and 28 ± 2° in the samples at 𝛾 = 0, 0.6, and 1.5, respectively (Figure 4b).
4. Discussion
4.1. Bubble nucleation and growth
Exsolving H2O from 9.6 to 2.8 wt% [solubility at 50 MPa and 750 °C; Newman and Lowenstern 2002] corresponds to a calculated vesicularity of 58 vol% [Jaupart and Allègre 1991; Supplementary Section 1 (Equation (1))]. Yet the average porosities measured in the decompressed samples are mostly below 35 vol% (Figure 3a). We propose two explanations to account for this deviation; incomplete H2O exsolution and partial loss of bubbles.
4.1.1. Incomplete H2O exsolution
Checking the H2O contents of the residual glasses in the undeformed samples using both electron microprobe and Raman spectroscopy, revealed contents in the crystal-bearing samples higher by 1.5 to 3.5 wt% than expected for an equilibrium H2O exsolution (Figure 3b). This suggests incomplete H2O exsolution during the ∼1.5 h (𝜏DP + Dwell2 + Dwell3 in Table 1) allocated to decompression-induced bubble nucleation. Yet, all series show equilibrium H2O exsolution (∼3.0 wt% H2O) at 𝛾 of 1.5–1.8, that is, for another couple of hours spent at 50 MPa, thus confirming that H2O exsolution under the chosen experimental conditions requires more than 1 h to reach equilibrium. This strongly disagrees with the conclusions of Martel and Schmidt [2003] suggesting H2O exsolution timescales of less than 1 min in microlite-bearing rhyolitic melts at 860 °C, but agrees with complete bubble expansion requiring several hours. Therefore, we infer that in our experiments, the timescale of bubble expansion controlled H2O exsolution from the melt. In contrast, the undeformed crystal-free samples degassed to equilibrium, which we rather attribute to their lower initial H2O content (5.0 instead of 9.6 wt%) rather than the absence of crystals, since serie10 which contains 10 vol% crystals, shows the highest H2O exsolution disequilibrium. Further investigation would be required to validate the positive correlation between the initial H2O content of the melt and the timescale of bubble expansion, which in turn controls the H2O content of the residual melt.
4.1.2. Partial loss of bubbles
Knowing that H2O exsolution was not completed in the H2O-rich samples, the gas fractions were calculated using the final H2O contents measured in the residual glasses instead of using H2O solubility at 50 MPa. The results show that the measured porosities are lower by 10 to 30 vol% than expected for an equilibrium degassing (Figure 3a), suggesting that these samples lost a part of their bubble cargo. One explanation could be that the melt partially outgassed by bubble connection at some point during bubble growth, and partially collapsed via compaction. Yet the released gas pockets cannot escape the sealed capsule and were considered in the measurement of total vesicularity. Therefore, we infer that these gas pockets were heterogeneously distributed in the capsule corners and were not systematically visible on our SEM pictures (for instance, a large gas pocket is visible below the capsule roof in Figure 2c), so that they may miss from some porosity budget. This hypothesis is supported by the lack of clear relationships between the bubble deficiency and parameters such as H2O content, crystal content, or finite deformation.
4.1.3. Pre-deformation porosity
The undeformed samples show melt vesicularities of 19–30 vol% (Figure 3a) and bubble number densities not varying by more than 0.5 log unit (Figure 4a), which suggests a comparable and reproducible process of bubble formation. Within this 0.5 log unit, however, BND increases with crystal content, as experimentally observed by Cáceres et al. [2021]. The bubble number densities of 109.3–10.6 m−3 measured from the XCT images are lower by 1 log unit compared to those predicted in crystal-free magmas by the formulation of Toramaru [2006] for decompression rates of 0.1–1.0 MPa/s (i.e., BNDs of 1010.5–11.5 m−3), highlighting a possible role of the crystals in controlling nucleation sites for bubbles, as already pointed out by Cáceres et al. [2021]. In the undeformed samples from all series, more than half (and up to 95% in serie0 and serie50) of the bubbles have diameters of about 20 μm. These small bubbles occupy about one third of total porosity in all series but serie0. In serie0, the volume of the small bubble population nearly disappeared at the expense of larger (220–240 μm diameter) bubble volume (Supplementary Figure 3a). In serie50, the population of 20-μm diameter bubbles coexists with some 240–260 μm diameter bubbles (Figure 2i) representing one third of total porosity (Supplementary Figure 3i). The homogeneous spatial distribution of the small 20–40 μm bubbles (Figure 2a) confirms a process of homogeneous nucleation [Mourtada-Bonnefoi and Laporte 2002], in agreement with the observations in natural and experimental products that plagioclase is not a wetting phase for nucleating H2O bubbles [Navon et al. 1998; Cáceres et al. 2021]. The population of 200–300 μm bubbles may have three possible origins: coalescence of the 20–40 μm bubbles, a separate nucleation event, or pre-decompression bubbles. A separate nucleation event or bubble coalescence would lead to more or less similar bubble size distributions in the different series, which is not the case (Supplementary Figure 3a,d,f,i). Therefore, we argue in favour of bubbles that formed before decompression, as often observed in experiments starting with powdered material that is able to trap H2O and air in the intergranular voids before melting [i.e., the “hydration bubbles” in Gardner et al. 1999]. The number and size of these bubbles would then be affected by the crystal content in the glass powder. The undeformed samples of serie30 and serie50 show that bubbles started channelling along the crystals (Figure 2f,i). According to the model of Burgisser et al. [2017], crystal-free melts containing 20–30 vol% bubbles, number density of 109–11 m−3, and size of 200–300 μm, would be impermeable, even with 50–70% connected porosity. In contrast, gas permeability measurements in natural crystal-bearing samples with connected porosities from 50 to 80% give permeabilities from ∼10−14 to −10 m2 [Bain et al. 2019]. Therefore, in absence of permeability measurements in our samples, it is not clear whether the gas percolation thresholds were met before deformation.
4.1.4. Bulk viscosity
The bulk viscosities calculated using the formulation of Truby et al. [2015] range from 105.2–5.4 Pa⋅s for the series containing 10 vol% crystals at 750 °C, 106.5–7.4 Pa⋅s for the series containing 30 and 50 vol% crystals at 750 °C, to 107.1–7.3 Pa⋅s for the crystal-free series at 650 °C (Table 2). The regime of low capillary number (Ca < 1) calculated for our sample deformation conditions (see Supplementary Section 1.3.2 for details) results in considering the 20–30 bulk vol% bubbles as rigid particles that increase the hydrated melt viscosity by about 0.2 log unit (e.g. serie0 in Table 2). Adding crystals further increases bulk viscosity, from ∼0.3 log unit for 10 vol% added crystals to ∼0.7 log unit for 30 vol% crystals, and 1.0–1.2 log unit for 40–50 vol% crystals, which agrees with most of the common models of particle suspension rheology [see Mader et al. 2013].
4.2. Effect of the crystal network on porosity development under small shear (𝛾 < 2)
4.2.1. Crystalline fabric
The crystals were nearly isotropic in shape (Rc = 1.1 ± 0.1; Table 2), suggesting that the cutting of the labradorite block using the Selfrag apparatus did not permit to reproduce the elongated plagioclase crystals commonly observed in the natural magmas. This small anisotropy likely limited the development of strong crystalline fabrics in the sheared samples. Nevertheless, the crystals show main orientations that agree with those calculated as a function of 𝛾 by Fernandez et al. [1983] for solid particles of Rc = 1.1 (Figure 4b). Yet, the high standard deviations associated with these angles, especially at 𝛾 = 0 and 0.6, suggest that the crystalline fabric is very weak, with the exception of serie50 at 𝛾 = 0.6 and 1.5, for which the crystalline fabrics are well marked (standard deviations <10°). The serie30 and serie50 samples show crystal breakage features, evidenced by the appearance of a population of small crystals (Figure 2i,k) that are also visible in the 2D crystal size distributions (Supplementary Figure 4). Crystals breakage was also observed in crystal-rich samples deformed under low strains by Forien et al. [2011], likely resulting from intense stress localization at some grain contact.
4.2.2. Bubble spatial distribution
The melt porosity of 20–30 area% is maintained in whatever crystal content and 𝛾, with the exception of one sample (Figure 5a), which agrees with the results of Pistone et al. [2012] obtained on their samples sheared at T high enough to prevent bubble loss through shear fracturing. Yet in details, increasing both bulk crystal content ⩾30 vol% and finite strain, increases heterogeneities in bubble spatial distribution, as reflected by porosity variations up to ±20% between bubble-poor and bubble-rich zones, with the variation being positively correlated to 𝛾 (Figure 5a). For these samples, the gas accumulated in local microstructures caused by the shear-induced crystal fabric (Figure 2h,k), in agreement with the observations of Laumonier et al. [2011]. In samples with bulk crystal contents <30 vol%, however, our results suggest that the spatial distribution of the bubbles remain homogeneous (variations below ±5 vol%; Figure 5a).
Effects of the crystals on (a) melt porosity and (b) connected porosity; the solid line indicates the linear fit of the data but one point (𝛾 = 0) from serie30 with an anomalously low connected porosity; the dashed lines contour the evolution of the connected porosity as a function of bulk crystallinity (0–50 vol%) for bulk vesicularities of 20–30 vol% and shear strain of 0 <𝛾< 2.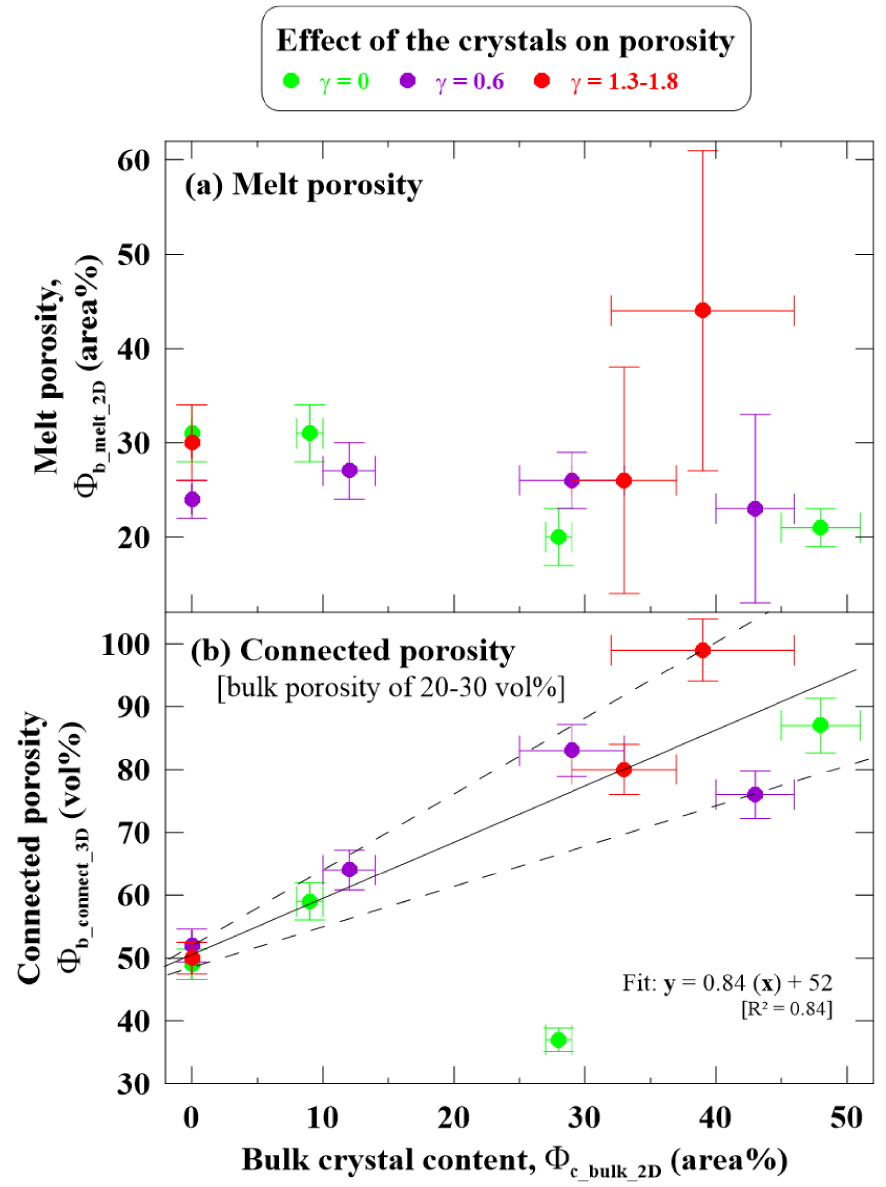
4.2.3. Connectivity development
At 𝛾 = 0, bubble connectivity increases with crystal content (Figure 6), reaching ∼87% connected porosity in the sample with bulk crystal contents of 50 vol% (Figure 5b; one exception is the undeformed sample of serie30 with only 37% connected porosity, for which we have no explanation). These results agree with those of Cáceres et al. [2021] who observed that phenocryst-bearing magma noticeably showed a higher degree of bubble coalescence, but disagree with those of Okumura et al. [2012] who reported no clear effect of crystallinity (30–50 vol% recalculated with respect to the melt volume) on the degree of bubble coalescence and connectivity until melt vesicularities reached ∼68 vol%. This disagreement may be explained by differences in bubble texture. Indeed, their crystal-rich samples with vesicularity ∼20–30 vol% (i.e. those decompressed to 20 MPa; number densities of ∼1012 m−3) do not show bubble channelling features, such as those observed in the undeformed samples of our serie50 (Figure 2). This could also result from different bulk viscosities, different bubble to crystal size ratios, or unimodal versus polymodal bubble size distributions (i.e. the ∼200–300 μm bubble population in our samples may have played a key role in early connectivity development).
XCT image processing of the core samples (3 mm diameters) for increasing shear strain from 𝛾 = 0 to 2 (from left to right) and crystal content from 0 to 50 vol% (from top to down). The left blocks were processed using VGStudioMax, with the melt and crystals in yellow, the isolated bubbles in red and the bubbles connected to the sample outside in grey. 𝛷b_bulk_3D and 𝛷b_connect_3D give the 3D percentage of bulk and connected bubbles, as defined in Supplementary Section 1. The upper right insets show details of the bubbles processed using Blob3D, with another colour code that show one colour per isolated bubble or identified network of connected bubbles. The black line in (e) highlights an alignment of bubbles connected to the sample outside, which denotes a post-experimental fracture.
In our samples, increasing bubble connectivity with increasing crystal content before shearing (𝛾 = 0) highlights the role of the crystal network on the decompression-induced formation of bubbles. Firstly, the crystals possibly influence bubble nucleation, by increasing bubble number density by up to 0.5 log unit with increasing crystal content (see log BND at 𝛾 = 0 in Figure 4a). We speculate that physical processes at the origin of more bubble nuclei in crystal-richer magmas could involve modified gas-melt interfacial tensions or excess free energy. After nucleation, bubble growth must have been partly dictated by the crystal network, forcing bubble coalescence and channelling, eventually approaching full bubble connection in serie50 (i.e. >80% connectivity; Figures 5b and 6i). These observations confirm the results of the numerical modelling of Parmigiani et al. [2017] predicting maximum outgassing efficiency via 40–50% connected porosity in crystal-rich (40–70 vol%) magmas.
Increasing 𝛾 from 0 to 2 does not significantly influence the amount of connected porosity (Figure 5b), thus highlighting the large predominance of crystal content over shear strain up to 𝛾 = 2 in favouring bubble connections. Fitting all the data but one (the low-connected sample at 𝛾 = 0 from serie30) shows a positive linear correlation between connected porosity and bulk crystal content (y = 0.84x + 52; Figure 5b), thus valid for silicic magmas with 20–30 vol% bulk vesicularity and sheared at low strain (𝛾 < 2) with shear rates of 10−4 s−1 under a low confining pressure of 50 MPa. The rather poor coefficient of determination, R2 = 0.84, mostly reflects a large variability of the connected porosity at high crystallinity (±15% for crystal content ∼45 vol%) with respect to crystal-free samples (±2%; Figure 5b).
4.3. Implications for natural volcanic systems
The experimental samples are silica-rich melts containing 20–30 vol% bubbles and 0 to 50 bulk vol% plagioclase crystals that cover a range from natural moderately-porous obsidians to crystal-rich (mush-like) rhyolitic magmas. The 50–90 μm crystal size typically scales microlites to microphenocrysts [e.g. Hammer et al. 1999; Martel and Poussineau 2007]. The low confining pressure of 50 MPa and the low shear strains (𝛾 < 2) applied to the samples simulate a shear initiation at shallow depth (about 2 km deep, considering rock density of 2400 kg∕m3), such as in a volcanic upper conduit. Overall, these conditions may be representative of Vulcanian events or dome-related eruptions, during which a moderately-porous magma degasses and crystallizes microcrysts at shallow depths, eventually emplacing effusively (as domes or plugs) or erupting explosively (as surges), depending on outgassing efficiency. In particular, vesicularities of 20–30 vol% are representative of those measured in lava domes and blast-generated pyroclastic density currents, such as the ones generated in 1350 AD (P1) and 1902 at Montagne Pelée, Martinique [Martel et al. 2000] and in 1980 at Mount St Helens, USA [Hoblitt and Harmon 1993].
The implications of our results to volcanic systems are schematized in Figure 7 and detailed below. Our results suggest that H2O bubbles nucleating in undeformed aphyric or crystal-poor (0–10 vol%) magmas by decompression at rates of 0.1–1.0 MPa/s (i.e. bubble number densities around 109–11 m−3) can connect to 50% (Figure 6a,d), but the magma could still be impermeable mainly due to the moderate bulk porosity of 20–30 vol% [Burgisser et al. 2017]. Such moderately-porous crystal-poor melts may reach permeability via a process of fracturing at high strains (𝛾 > 2) along the conduit margins, as experimentally demonstrated by Kushnir et al. [2017]. Adding crystals drastically increases bubble connectivity (>70%; Figure 5b), by favouring channelling even at low shear strains (Figure 2h,k). Channelling creates gas permeability of the order of 10−10 m2, which is two to five orders of magnitude higher than the other permeability processes at the equivalent bubble content [Collombet et al. 2021]. Therefore, magmas with matrix crystallinity >30 vol% and vesicularity of 20–30 vol%, as commonly observed in lava domes [Boudon et al. 2015], may show bubble connectivity >70% (Figure 5b) and gas permeabilities >10−12 m2 [Bain et al. 2019]. Our data suggest that bubble connectivity in low-porous (20–30 vol%) silica-rich magmas slightly sheared (𝛾 < 2; strain rate of 10−4 s−1) at low confining pressure (50 MPa; about 2 km deep) increases linearly with crystal content (following y = 0.84x + 52, with y being the connected porosity in vol% and x being the bulk crystal content in area%; Figure 5b). In natural samples, connectivity would be enhanced by unequal bubble sizes that favour bubble coalescence [Lin and Lin 2009], microtextures made of crystals with high aspect ratios [Lindoo et al. 2017], and polydisperse crystal size distributions involving phenocrysts and microlites [Cáceres et al. 2021]. Therefore, in comparison to crystal-poor magmas, crystal-rich melts are able to outgas much more easily (at lower 𝛾) for comparable temperature, pressure, and strain rate, confirming the effusive mode of crystal-rich lava-dome emplacement and the unnecessity to invoke dominant outgassing mechanisms other than channelling [Collombet et al. 2021]. From a crystallinity point of view and regardless of melt H2O content and magma storage pressure, the gas-permeable nature of the 30–50 vol% crystal-bearing rhyolitic melts investigated in this study agrees with the eruptions of low magnitude reported by [Takeuchi et al. 2021] and the crystallinity-controlled effusive eruptions reported by Popa et al. [2021]. Yet, the present experiments highlight the major control of an exsolved volatile phase (20–30 vol%) and low shear (𝛾 < 2) on the permeability development, with consequences on eruptive style that may deviate from those expected from the sole consideration of crystallinity and melt H2O content. Since low-sheared crystal-rich magmas at upper conduit level is permeable to gases, this poses the question of the mechanisms behind dome-related explosive eruptions, such as Vulcanian or Pelean explosions. External factors can be invoked, such as depressurization due to unloading by gravitational collapse of a part of the dome [Voight et al. 1981]. Among internal factors of self-explosivity, one could invoke processes capable of building up overpressure in gas bubbles from an initially permeable magma, such as a second boiling event in response to late-stage extensive microlite crystallization [Sparks 1997] and gas volume reduction by silica-phase deposition in bubbles [Boudon et al. 2015]. Another hypothesis for self-explosivity is permeability barriers and pressure accumulation via vertical rheological and lithological gradients in the magma column [e.g., Voight et al. 1999].
Schematic representation of bubble connectivity in magmas with (a) 0–10 vol% crystals or (b) 30–50 vol% crystals, deformed under shear at magmatic temperatures (650–750 °C), moderate shear-strain rates (2 × 10⁻⁴ s−1) and low pressures (50 MPa, that is at level of upper conduit to lava dome interior). The gas bubbles in crystal-poor magmas with 20–30 vol% porosity hardly connect under strain below 𝛾 = 2, so that outgassing requires fracture opening under high strains or strain rates, likely only reachable at conduit margins [Kushnir et al. 2017]. In contrary, a dense crystalline fabric favours bubble connectivity under strains as low as 𝛾 = 2 and bulk porosity of 20–30 vol%, so that outgassing may be an early process upon magma emplacement. Crystal fragmentation commonly occurs in crystal-rich magmas and heightens with increasing crystal content and strain. If temperature decreases and/or strain increases as expected at conduit margins, fractures may open and assist outgassing [Pistone et al. 2012; Shields et al. 2014].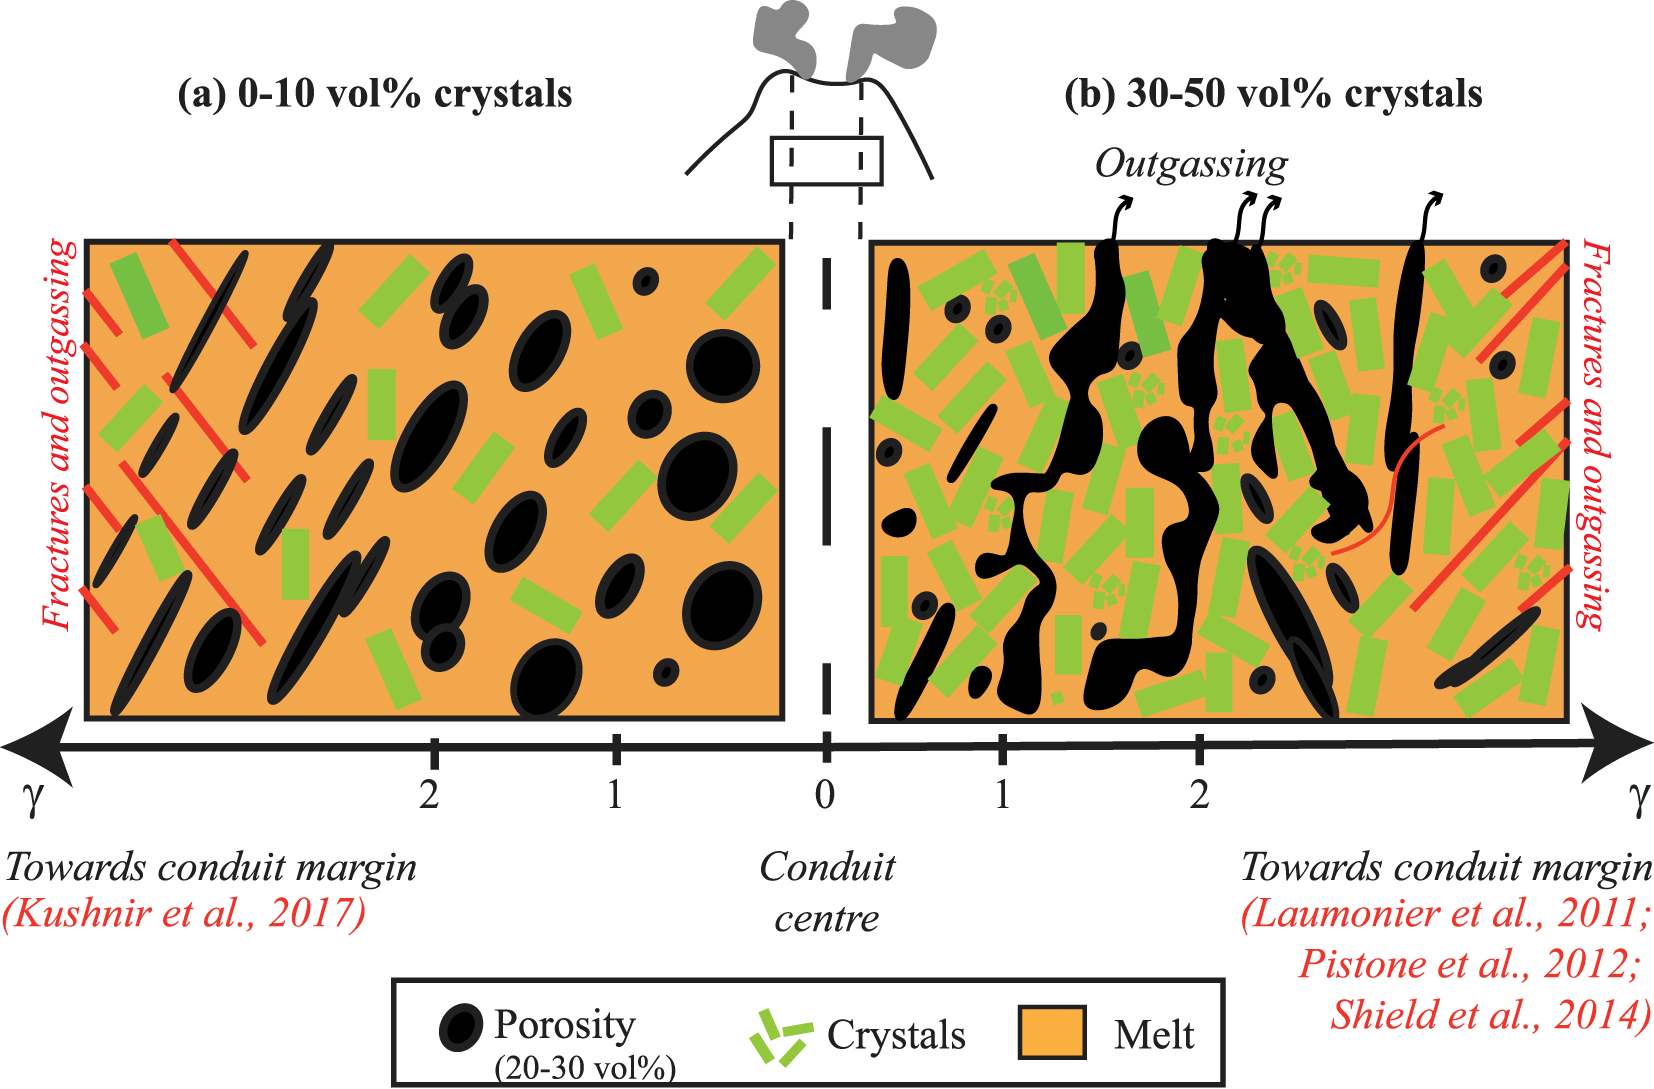
5. Conclusions
By deforming silicic melts with 20–30 vol% H2O bubbles and 0 to 50 vol% crystals at magmatic temperatures (650–750 °C) and low confining pressures (50 MPa), we highlighted that:
- Torsion experiments using three-phase (bubbles, crystals, and melt) suspensions are valuable analogues to shear initiation in moderately-porous aphyric to crystal-bearing silicic magmas at shallow depth, such as in lava domes or upper conduits.
- Bubble connectivity linearly increases with crystal content.
- Increasing strain from 𝛾 = 0 to 2 in crystal-bearing magmas drastically increases the heterogeneity in bubble spatial distribution, by concentrating pores in shear zones.
- Crystal-rich magmas develop gas permeability via a process of channelling in shear zones, even at moderate porosities (20–30 vol%) and low strains (𝛾 < 2).
- Natural crystal-rich magmas stalling in upper conduits or lava domes are thus likely permeable, so that violent dome explosions into devastating surges require additional mechanisms of gas pressurisation in shallow crystal-rich magmas.
Conflicts of interest
Authors have no conflict of interest to declare.
Acknowledgements
The authors greatly thank I. di Carlo, S. Erdmann, and P. Benoist for assistance with the SEM and EMP; M. Hatton for the analyses using the elemental analyser; A. Slodczyk and F. Faranda for the analyses using Raman spectroscopy; P. Penhoud for the technical assistance with the X-ray microtomograph; and M. Beaulieu for the crystal block grinding using the Selfrag device at BRGM. This work is part of CD PhD thesis that was funded by the French MNRT grant. The study costs were provided by the CNRS-INSU TelluS program, the Agence Nationale de la Recherche (ANR-19-CE31-0007; LA), the EQUIPEX PLANEX project (ANR-11-EQPX-0036; B. Scaillet), and the LABEX VOLTAIRE project (ANR-10-LABX-100-01; B. Scaillet). The authors greatly thank B. J. Andrews and two anonymous reviewers for their helpful comments on a previous version of the manuscript, as well as R. Cioni and an anonymous reviewer for their comments on the present manuscript. We would also like to thank B. Scaillet for the editorial handling.