


 CC-BY 4.0
1. Introduction
Volatiles dissolved in magmas are key parameters to understand geophysical and geochemical signals at depth, as their exsolution provides the needed driving force for magma rise and, possibly, trigger explosive eruptions. Being a multiphase system, most magmas are composed of phenocrysts coexisting with a volatile bearing silicate melt (e.g. H2O, CO2, S species, F, Cl, etc. …). Phase equilibrium studies are of paramount importance to better decipher magma storage conditions and physical properties during ascent to the surface. Thus, the role of parameters governing equilibrium between melt and phenocrysts such as pressure, temperature, redox state, volatile content, must be known. The best way to constrain magma storage conditions of volcanic rocks and changes occurring during ascent is to compare the natural solid assemblages with the phase assemblage and compositions obtained through phase-equilibrium experiments in which all these parameters are controlled [e.g., Martel et al. 2019]. Dissolved volatiles are known to affect the rheological properties of magmas during ascent to the Earth’s surface and H2O is the most important volatile in igneous systems since it affects density, viscosity, as well as phase equilibria, including crystallinity and liquidus temperature [e.g., Burnham 1981, Schulze et al. 1997]. It is well known that the amount of dissolved water in melts, as well as the mode of degassing in magma conduits, both affect eruptive styles [e.g., effusive vs. explosive, Sisson and Layne 1992; plinian vs. pelean, Martel et al. 1998].
However, water is not the only volatile component in magmas. Over tha last decades researchers have focused their efforts on trying to understand how different volatile ratios, such as H2O/CO2, can influence the magma properties in terms of phase equilibria, mobility of chemical elements, and the amount, shape and size of crystals [e.g. Kent 2008, Martel et al. 2019, and references therein]. The presence of CO2 reduces water activity and it is commonly assumed that the decreasing H2O/CO2 ratio in the melt results in an increase of the liquidus temperature and crystal/melt ratio in most silicate systems [e.g., Clemens and Wall 1981, Scaillet and Evans 1999]. However, the results of some experimental studies seem to indicate that the opposite may occur in basaltic or depolymerized systems at very high CO2 concentrations (low water activities) [Giuffrida et al. 2017]. These results are unexpected and contrast with our common assumption of the role of CO2–H2O-bearing fluids on phase relationships.
In order to expand the experimental dataset on the effect of CO2 on phase equilibria, we present new H2O- and CO2-bearing high temperature and high pressure crystallization experiments performed on a shoshonitic composition from the Vulcanello peninsula (Island of Vulcano, Aeolian Island, Italy). Experiments were targeted to investigate the phase stabilities at pressure and temperature conditions relevant for/to some of the southern Italy volcanoes such as Vulcanello and, possibly, to other chemically similar volcanic systems. We discuss experimental results in terms of phase equilibria but we also address how both H2O and CO2 volatiles affect rheological properties of the magma depending on their content.
1.1. Vulcanello magmatic source and products
Based on the analysis of fluid inclusions in quartz xenoliths, Zanon et al. [2003] provided evidence that the deepest level of magma storage at Vulcanello is located between 17 and 21 km, close to the Moho [21–25 km; Falsaperla et al. 1985] and excluded significant magma ponding at mid-crustal levels. This is in accordance with the aeromagnetic data at Vulcano pointing to a magma reservoir between 18 and 21 km depth [De Ritis et al. 2013]. Moreover, Zanon et al. [2003] provided and estimate for Vulcanello magmas temperature of 1083 ± 40 °C.
The formation of Vulcanello occurred during the last Eruptive Epoch of the island of Vulcano [Eruptive Epoch 8, De Astis et al. 2013], between AD 1100 to 1250 [Arrighi et al. 2006], simultaneously to effusive and explosive activity in the La Fossa crater [Fusillo et al. 2015].
The lava platform comprises several superimposed shoshonitic lava flows, which, together with the products of explosive activity that form a scoria cone, were the first subaerial products of the peninsula (Vulcanello 1). The rocks composing the lava platform are mainly shoshonitic and contain large (up to 1.5 cm) xenocrysts of plagioclase [Davì et al. 2009, De Astis et al. 2013, Fusillo et al. 2015]. After a short time break, the activity resumed with explosive eruptions (Vulcanello 2) which led to the formation of a second cone during a single eruptive unit, showing 3-m-thick fallout deposit having shoshonitic composition [Fusillo et al. 2015]. Following Vulcanello 2, no activity took place during ∼500 years. Subsequently, lava emission resulted in the emplacement of the latitic Roveto lava flow, that was followed by three explosive phases leading to the edification of Vulcanello 3 cone. These rocks are latitic in composition with the presence of clinopyroxenes megacrysts [ca. 1.5 cm; Fusillo et al. 2015]. The activity of Vulcanello 3 ended with the emplacement of a final lava flow (Valle dei Mostri latitic lava flow), which flowed in the same direction than the Roveto latitic lava flow [Fusillo et al. 2015, Nicotra et al. 2018, Davì et al. 2009].
2. Experimental and analytical methods
2.1. Starting material and experiments
The starting material of our experiments is a natural scoria lava from Vulcanello 1. The bulk rock composition (Table 1) is characterized by SiO2 = 53.40 wt% and Na2O + K2O = 8.76 wt%. In the total Alkali-Silica (TAS) diagram this composition plots in the field of shoshonite (Table 1). The modal abundance of phenocrysts, mainly composed of clinopyroxene (Cpx) and plagioclase (Pl), is 8–11 vol%. The phenocrysts often contain inclusions of Fe–Ti oxides. As reported in Davì et al. [2009] the composition of clinopyroxene and feldspar phenocrysts ranges between Wo49–44En36–42–36Fs9–20 and An5–46Ab51–52Or3–43, respectively. Feldspar microphenocrysts show a similar composition to that of phenocrysts (An3–35Ab51–61Or4–46). Olivine has a compositional range Fo42–62 and the Fe–Ti oxides have Usp content close to 14 mol%. The groundmass consists of glass, leucite (Lc), Fe–Ti oxides, Cpx, Pl and small amount of olivine (Ol).
Compositions of starting glass
| VL0 (wt%) | std | Vetere et al. [2007] (wt%) | |
|---|---|---|---|
| n | 100 | 100 | |
| SiO2 | 53.40 | 0.41 | 53.47 |
| TiO2 | 0.70 | 0.04 | 0.71 |
| Al2O3 | 15.78 | 0.24 | 15.48 |
| FeO | 8.04 | 0.36 | 8.39 |
| MnO | 0.10 | 0.12 | 0.10 |
| MgO | 4.88 | 0.15 | 4.88 |
| CaO | 8.81 | 0.22 | 8.51 |
| Na2O | 3.66 | 0.23 | 3.66 |
| K2O | 3.71 | 0.13 | 4.72 |
| P2O5 | 0.62 | 0.21 | |
| LOI | |||
| Total | 99.76 | 99.92 |
Notes: Oxide components are given in wt%. Errors represent one standard deviation (std). Shoshonite studied by Vetere et al. [2007] is also reported for comparison.
Sample preparation prior to high-pressure experiments was performed at the Petro-Volcanology Research Group laboratories of the University of Perugia (PVRG; http://pvrg.unipg.it). About 100 g of crushed bulk rock was melted in a Pt crucible in air at 1600 °C for 4 h in a Pt80Rh20 crucible. Melting was performed in a Nabertherm HT 04/17 MoSi2-heated box furnace. The melt was quenched to a glass by pouring it on a brass plate. The glass was crushed, re-melted and quenched again using the same procedure. This technique ensured compositional homogeneity of the glass and avoided crystallization [Vetere et al. 2015a]. The composition of the glass and the absence of crystals were controlled by electron microprobe imaging and measurements with a CAMECA SX 100 at the Institute of Mineralogy University of Hannover (see details below; Table 1).
The NBO/T parameter corresponds to the number of non-bridging oxygens (NBO) per tetrahedrally coordinated cation (T) and is a good proxy to depict the structure of silicate melts in terms of polymerization [Mysen and Richet 2005]. This ratio can be calculated as follows:
| (1) |
In order to prepare volatile-bearing charges, we used the following procedure:
The capsules (Au80Pd20; 5 mm diameter, 3 cm in length, previously annealed at 1100 °C for 10 min and then welded on one end) were filled with the following procedure: (a) the capsule was charged with the desired amounts of ±H2O ± Ag2C2O4 + glass powder (Ag2C2O4 is the source for CO2 as the silver oxalate decomposes during heating and generates the carbon dioxide); (b) a steel piston was used to gently compact the charge; (c) to avoid any volatiles release, the capsule was tightly squeezed on top, rolled up in a wet tissue, and frozen by placing it into a bath of liquid nitrogen; (d) the upper end of the capsule was welded shut with a conventional graphite-arc welder. In agreement with literature data on the Vulcanello magmatic source (21–17 km depth and 1083 ± 40 °C, see above) we performed experiments at 500 MPa and 1080 °C for 70 h, in order to shed light on processes relevant to the magmatic source of Vulcanello magma.
A total of 13 experiments with variable volatile contents (see Figure 1) were performed at 500 MPa and 1080 °C (Tables 2 and 3). Experiments were done in an internally heated pressure vessel (IHPV) equipped with a rapid-quench sample holder at the Institute fur Mineralogy, Leibniz University of Hannover (Germany). Details for the IHPV are provided in Berndt et al. [2002]. Temperature was measured using four unsheathed S-type thermocouples (precision of temperature was ±5 °C). The IHPV was pressurized with argon. Pressure was monitored using digital pressure transducers having an uncertainty of about 1 MPa. The variation of pressure during the experiments was ⩽5 MPa. Some experiments were performed at the intrinsic oxygen fugacity (fO2) conditions of the pressure vessel which was found to be close to QFM+4 (the intrinsic fO2 corresponding to H2O-saturated conditions), with QFM being the quartz–fayalite–magnetite equilibrium [Berndt et al. 2002]. At H2O-undersaturated conditions, fO2 is lower, depending on the prevailing water activity [QFM−0.8 to QFM+3; Botcharnikov et al. 2005]. In our experiments fO2 was calculated using the following relation:
| (2) |
H2O and CO2 concentrations added to the capsules before experiment (at 500 MPa and 1080 °C). The shaded area represent the undersaturated conditions in accord with the modeled H2O and CO2 concentrations at fluid saturation obtained by Vetere et al. [2014, 2011] for the same composition is also shown (solid black curve). Orange and blue symbols indicate experiments performed at reduced and oxidized conditions, respectively, (see Table 3). Green and black circles are nominally anhydrous VL46 and 47 experiments, respectively (Table 3). Red dot refers to the sample with the highest water content.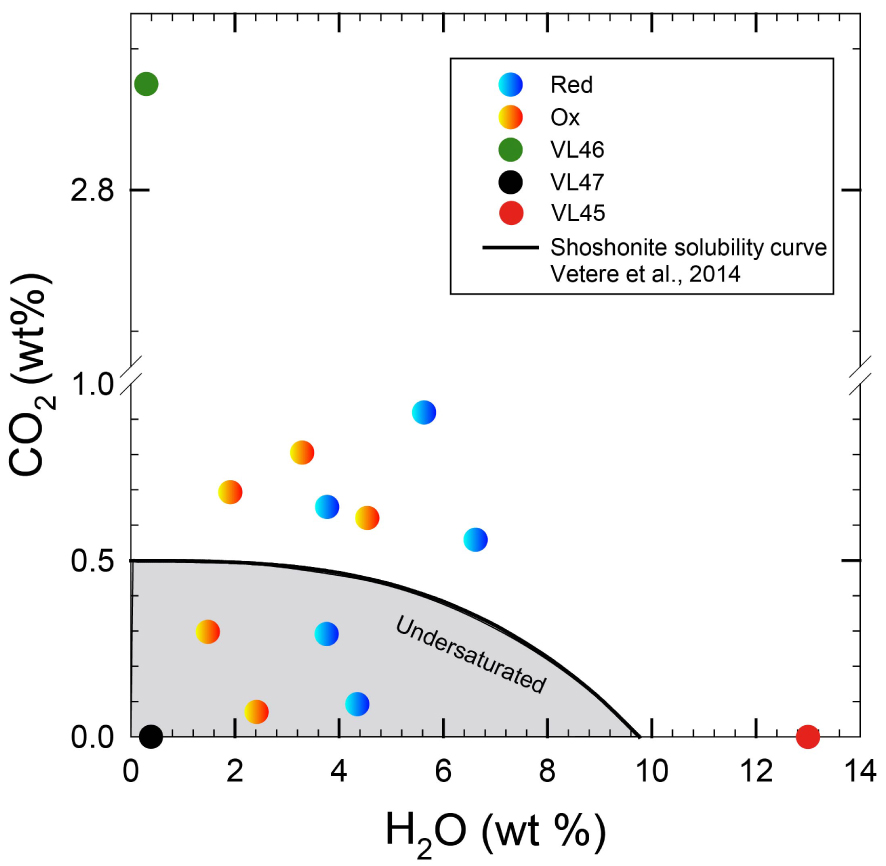
Results of microprobe analyses of residual glasses
| VL32 | std | VL33 | std | VL34 | std | VL36 | std | |
|---|---|---|---|---|---|---|---|---|
| SiO2 | 54.86 | 0.39 | 55.53 | 0.47 | 54.28 | 0.60 | 52.17 | 0.55 |
| TiO2 | 0.71 | 0.05 | 0.73 | 0.04 | 0.73 | 0.06 | 0.71 | 0.04 |
| Al2O3 | 20.61 | 0.26 | 20.71 | 0.34 | 19.87 | 0.22 | 17.99 | 0.23 |
| FeOT | 1.81 | 0.57 | 1.21 | 0.27 | 1.99 | 0.31 | 2.95 | 0.18 |
| MnO | 0.10 | 0.06 | 0.09 | 0.04 | 0.15 | 0.09 | 0.13 | 0.11 |
| MgO | 1.72 | 0.15 | 1.51 | 0.57 | 2.13 | 0.37 | 3.07 | 0.46 |
| CaO | 4.70 | 0.31 | 4.13 | 0.27 | 5.16 | 0.27 | 6.23 | 0.10 |
| Na2O | 6.32 | 0.26 | 6.66 | 0.16 | 6.08 | 0.21 | 5.42 | 0.17 |
| K2O | 4.91 | 0.39 | 5.11 | 0.21 | 4.82 | 0.28 | 4.25 | 0.32 |
| P2O5 | 0.49 | 0.14 | 0.56 | 0.21 | 0.45 | 0.10 | 0.46 | 0.16 |
| Total | 96.23 | 96.24 | 95.66 | 93.38 | ||||
| H2O | 3.77 | 3.76 | 4.34 | 6.62 | ||||
| VL37 | std | VL38 | std | VL39 | std | VL41 | std | |
| SiO2 | 55.50 | 0.68 | 56.03 | 0.47 | 55.72 | 0.91 | 53.90 | 0.21 |
| TiO2 | 0.45 | 0.13 | 0.49 | 0.10 | 0.49 | 0.09 | 0.62 | 0.05 |
| Al2O3 | 20.35 | 1.03 | 20.67 | 0.62 | 20.18 | 0.72 | 18.57 | 0.27 |
| FeOT | 4.32 | 1.07 | 4.12 | 0.70 | 3.96 | 0.58 | 4.64 | 0.23 |
| MnO | 0.12 | 0.05 | 0.09 | 0.10 | 0.09 | 0.10 | 0.10 | 0.11 |
| MgO | 1.29 | 0.38 | 1.14 | 0.23 | 1.10 | 0.32 | 2.00 | 0.37 |
| CaO | 3.99 | 0.40 | 3.69 | 0.42 | 3.60 | 0.32 | 4.66 | 0.17 |
| Na2O | 6.65 | 0.35 | 6.74 | 0.38 | 6.95 | 0.17 | 5.87 | 0.10 |
| K2O | 4.86 | 0.27 | 5.04 | 0.24 | 5.07 | 0.26 | 4.65 | 0.18 |
| P2O5 | 0.57 | 0.23 | 0.51 | 0.16 | 0.50 | 0.17 | 0.46 | 0.12 |
| Total | 98.10 | 98.52 | 97.66 | 95.47 | ||||
| H2O | 1.90 | 1.48 | 2.34 | 4.53 | ||||
| VL45 | std | VL46 | std | VL47 | std | |||
| SiO2 | 51.36 | 0.99 | 56.02 | 0.83 | 55.69 | 0.44 | ||
| TiO2 | 0.63 | 0.02 | 0.76 | 0.02 | 0.75 | 0.04 | ||
| Al2O3 | 15.01 | 0.24 | 18.10 | 0.34 | 18.55 | 0.64 | ||
| FeOT | 7.29 | 0.41 | 7.15 | 0.46 | 6.75 | 0.41 | ||
| MnO | 0.10 | 0.10 | 0.13 | 0.08 | 0.18 | 0.09 | ||
| MgO | 4.19 | 0.29 | 2.40 | 0.10 | 2.23 | 0.39 | ||
| CaO | 7.34 | 0.44 | 4.33 | 0.12 | 4.48 | 0.66 | ||
| Na2O | 2.81 | 0.39 | 6.07 | 0.26 | 6.21 | 0.20 | ||
| K2O | 3.61 | 0.13 | 4.01 | 0.08 | 4.01 | 0.27 | ||
| P2O5 | 0.51 | 0.04 | 0.74 | 0.03 | 0.75 | 0.07 | ||
| Total | 91.85 | 99.70 | 99.61 | |||||
| H2O | 8.15 | 0.30 | 0.39 | |||||
Notes: H2O represent the water content estimated by difference methods. Microprobe data are reported for all the residual glasses investigated in wt% together with errors represented by one standard deviation (std).
Phase assemblage results derived from image analyses methods
| H2Oin (wt%) | CO2 (wt%) | aH2O£ | log fO2 | 𝛥QFM | CPx | Plg | Ox | 𝛷tot (area%) | |||||||
|---|---|---|---|---|---|---|---|---|---|---|---|---|---|---|---|
| Fs | Wo | En | (area%) | An | Or | Ab | 𝛷Plg (area%) | 𝛷Ox (area%) | |||||||
| VL32# | 3.5 | 0.651 | 0.36 | −10.80 | −1.37 | 17.31 | 46.40 | 36.28 | 16.1 | 16 | |||||
| VL33# | 3.5 | 0.291 | 0.35 | −10.82 | −1.39 | 13.25 | 47.03 | 39.71 | 16.3 | 16 | |||||
| VL34# | 4.2 | 0.092 | 0.44 | −10.64 | −1.21 | 16.11 | 45.87 | 38.00 | 14.3 | 14 | |||||
| VL35# | 5.5 | 0.919 | 0.61 | −10.35 | −0.92 | 10.7 | 11 | ||||||||
| VL36# | 6.5 | 0.558 | 0.74 | −10.18 | −0.75 | 10.2 | 10 | ||||||||
| VL37 | 2.0 | 0.693 | 0.14 | −7.64 | 1.79 | 15.8 | 1.7 | 17 | |||||||
| VL38 | 1.5 | 0.297 | 0.09 | −8.01 | 1.42 | 18.1 | 1.7 | 22 | |||||||
| VL39 | 2.5 | 0.070 | 0.19 | −7.38 | 2.05 | 18.7 | 1.9 | 21 | |||||||
| VL40 | 3.0 | 0.805 | 0.31 | −6.94 | 2.49 | 15.67 | 41.34 | 42.96 | 17.0 | 1.5 | 18 | ||||
| VL41 | 4.5 | 0.620 | 0.48 | −6.57 | 2.86 | 16.45 | 47.85 | 35.68 | 14.0 | 1.4 | 15 | ||||
| VL45$ | 13.0 | 0.000 | 1.00 | −4.94 | 4.49 | 3 | |||||||||
| VL46* | 0.0 | 2.830 | 0.01 | −10.26 | −0.83 | 17.33 | 42.91 | 39.75 | 15.3 | 33.58 | 9.60 | 56.82 | 5.9 | 21 | |
| VL47* | 0.0 | 0 | 0.02 | −8.92 | 0.51 | 17.90 | 42.42 | 39.68 | 21.6 | 32.91 | 9.40 | 57.69 | 8.8 | 30 | |
Crystals composition are also reported.
Note: Crystallinity (𝛷) is reported in vol% and derived from 500 MPa and temperature of 1080 °C experiments. H2O and CO2 are reported in wt%. Water activity is also reported for all run while phase compositions are reported for most of the experimental runs except for those were crystal size was too small in order to be analyses. #Denote experiments performed at controlled fO2. *Denote experiments were no water was added to the charges. $Denote experiments with quench crystals. £Water activity is calculated from the amount of water estimated by the difference method (see Table 2).
2.2. Electron microprobe and image analyses
All run-products were mounted in epoxy, ground flat and polished for textural and chemical analyses. Glasses and minerals produced during the experiments were analysed using a Cameca SX100 microprobe at the Institute of Mineralogy. An accelerating voltage of 15 kV was used with a beam current of 15 nA for silicate minerals and oxides and 6 nA for glasses. The beam was defocused to at least 15 μm for glass analyses and focused to <2 μm for the analysis of crystal phases. All elements were analysed with a counting time of 10 s on peak. Standards used for calibration were Fe2O3, MgO, MnTiO3 (Mn and Ti), albite (Na), wollastonite (Si for mineral and glass and Ca for glass), apatite (P and F for glass and F, Ca and P for apatite), orthoclase (K), anhydrite (Ca and S). Standard deviations reported in Table 2 were calculated based on 10 to 20 analysed spots on the same sample. Raw data were corrected with the software “Peak Sight” and “PAP” matrix [Pouchou and Pichoir 1991]. Precision and accuracy were determined by measuring reference glasses VG-568 (rhyolite) and VG-2 (basalt) from Smithsonian standards collection [Jarosewich 2002].
Due to the presence of crystals in experimental charges, the water content of the glasses was estimated following the “by-difference” method described in Devine et al. [1995]. Following Parat et al. [2008], we estimate that the error on determination of H2O content is ∼0.5 wt%. CO2 in glasses were not determined but estimated from the solubility curve in Figure 1.
Back-scattered electron (BSE) images were collected with a Philips FEG (Field Emission Gun) Quanta 200F equipped with a Si/Li-SUTW detector (EDAX, Philips Electronics) installed at the University of Calabria (Italy). Representative BSE images were collected at different magnifications (400× up to 1600×) depending on the crystal size. Surface percentage of the different phases was determined for all images using grey levels with Image-ProPlus 6.0 [see details in Vetere et al. 2015a]. Seven to ten BSE images obtained in different parts of the same section were evaluated for homogeneity. We quantified surface fractions of glass, clinopyroxene, spinel, plagioclase and gas bubbles. In total, 110 BSE images were analysed.
3. Results
The crystalline phases observed in our experiments are clinopyroxene (Cpx), plagioclase (Pl), and Fe–Ti oxides (Ox) in various proportions, depending on the fraction of volatiles dissolved in the melt. The results show that Cpx is the main phase with abundance increasing from 10.2% to 21.6% as aH2O decreases from 0.74 to nearly zero (Table 3). Water activity also plays a major role on the stability of Pl that is only present in experiments with a melt H2O content ⩽1 wt% (Table 3). Plagioclase has a maximum abundance of 8.8% in the volatile-free sample (VL 47∗ in Table 3). Minor Fe–Ti oxides (⩽2%) are present in samples equilibrated under relatively high oxygen fugacity conditions.
Based on the amounts of added volatiles and in agreement with solubility model and data [e.g. Vetere et al. 2014] one can distinguish between fluid-saturated (fluid present) and fluid-undersaturated (fluid absent) runs with respect to H2O + CO2 (Figure 1).
Quenched melt (residual glass) is present in all run products with a mode ranging from 70% in VL47∗ to 97% in VL45$ (Table 3). This wide range of melt fraction at constant pressure and temperature shows the importance of water activity (aH2O) on the liquidus temperature and crystallinity. All glass compositions, including the starting composition, are listed in Tables 1 and 2 and are illustrated in Figure 2. The compositions of residual glasses range from 51 to 56 wt% SiO2 (Table 2 and Figure 2). Glass compositions evolve as a function of the degree of crystallinity. We however note that a larger crystallinity does not always correspond to an enrichment of SiO2 in the residual glass (compare Table 2 and 3). We also note that in the experiment performed under oxidizing and water-saturated (no CO2) conditions, the conditions are close to the liquidus and the melt has a composition very similar to that of the starting glass (although comparing alkali content in the VL45 and starting material we do note a difference of ca. 0.5 wt% of Na2O possibly due to the EPMA measurements conditions; red point in Figures 1 and 2). Experiments performed at reducing conditions and containing both water and CO2 show a SiO2 trend that increases nearly linearly as the MgO content decreases. The same observation can be done for, Na2O and K2O. The total FeO decreases with decreasing MgO but FeO concentrations are always higher in oxidized experiments than in reduced experiments at a given MgO content, suggesting a possible Fe-loss to the capsule wall at reducing conditions, as discussed below. TiO2 is relatively constant in reduced experiments but decreases with decreasing MgO in oxidized runs. Due to the crystallization of the main phase Cpx, CaO continuously decreases with MgO (with increasing crystallinity).
Change of the residual glass composition (in wt% of element concentrations) in the silicate melts. The analyses are recalculated to a total of 100%. The arrow on the CaO vs. MgO plot indicates the vector pointing to the Cpx composition. The grey triangle refers to the starting material composition while reddish and bluish circles indicate experiments performed at oxidized and reduced conditions, respectively, as reported in Tables 2 and 3. Red dot as in Figure 1.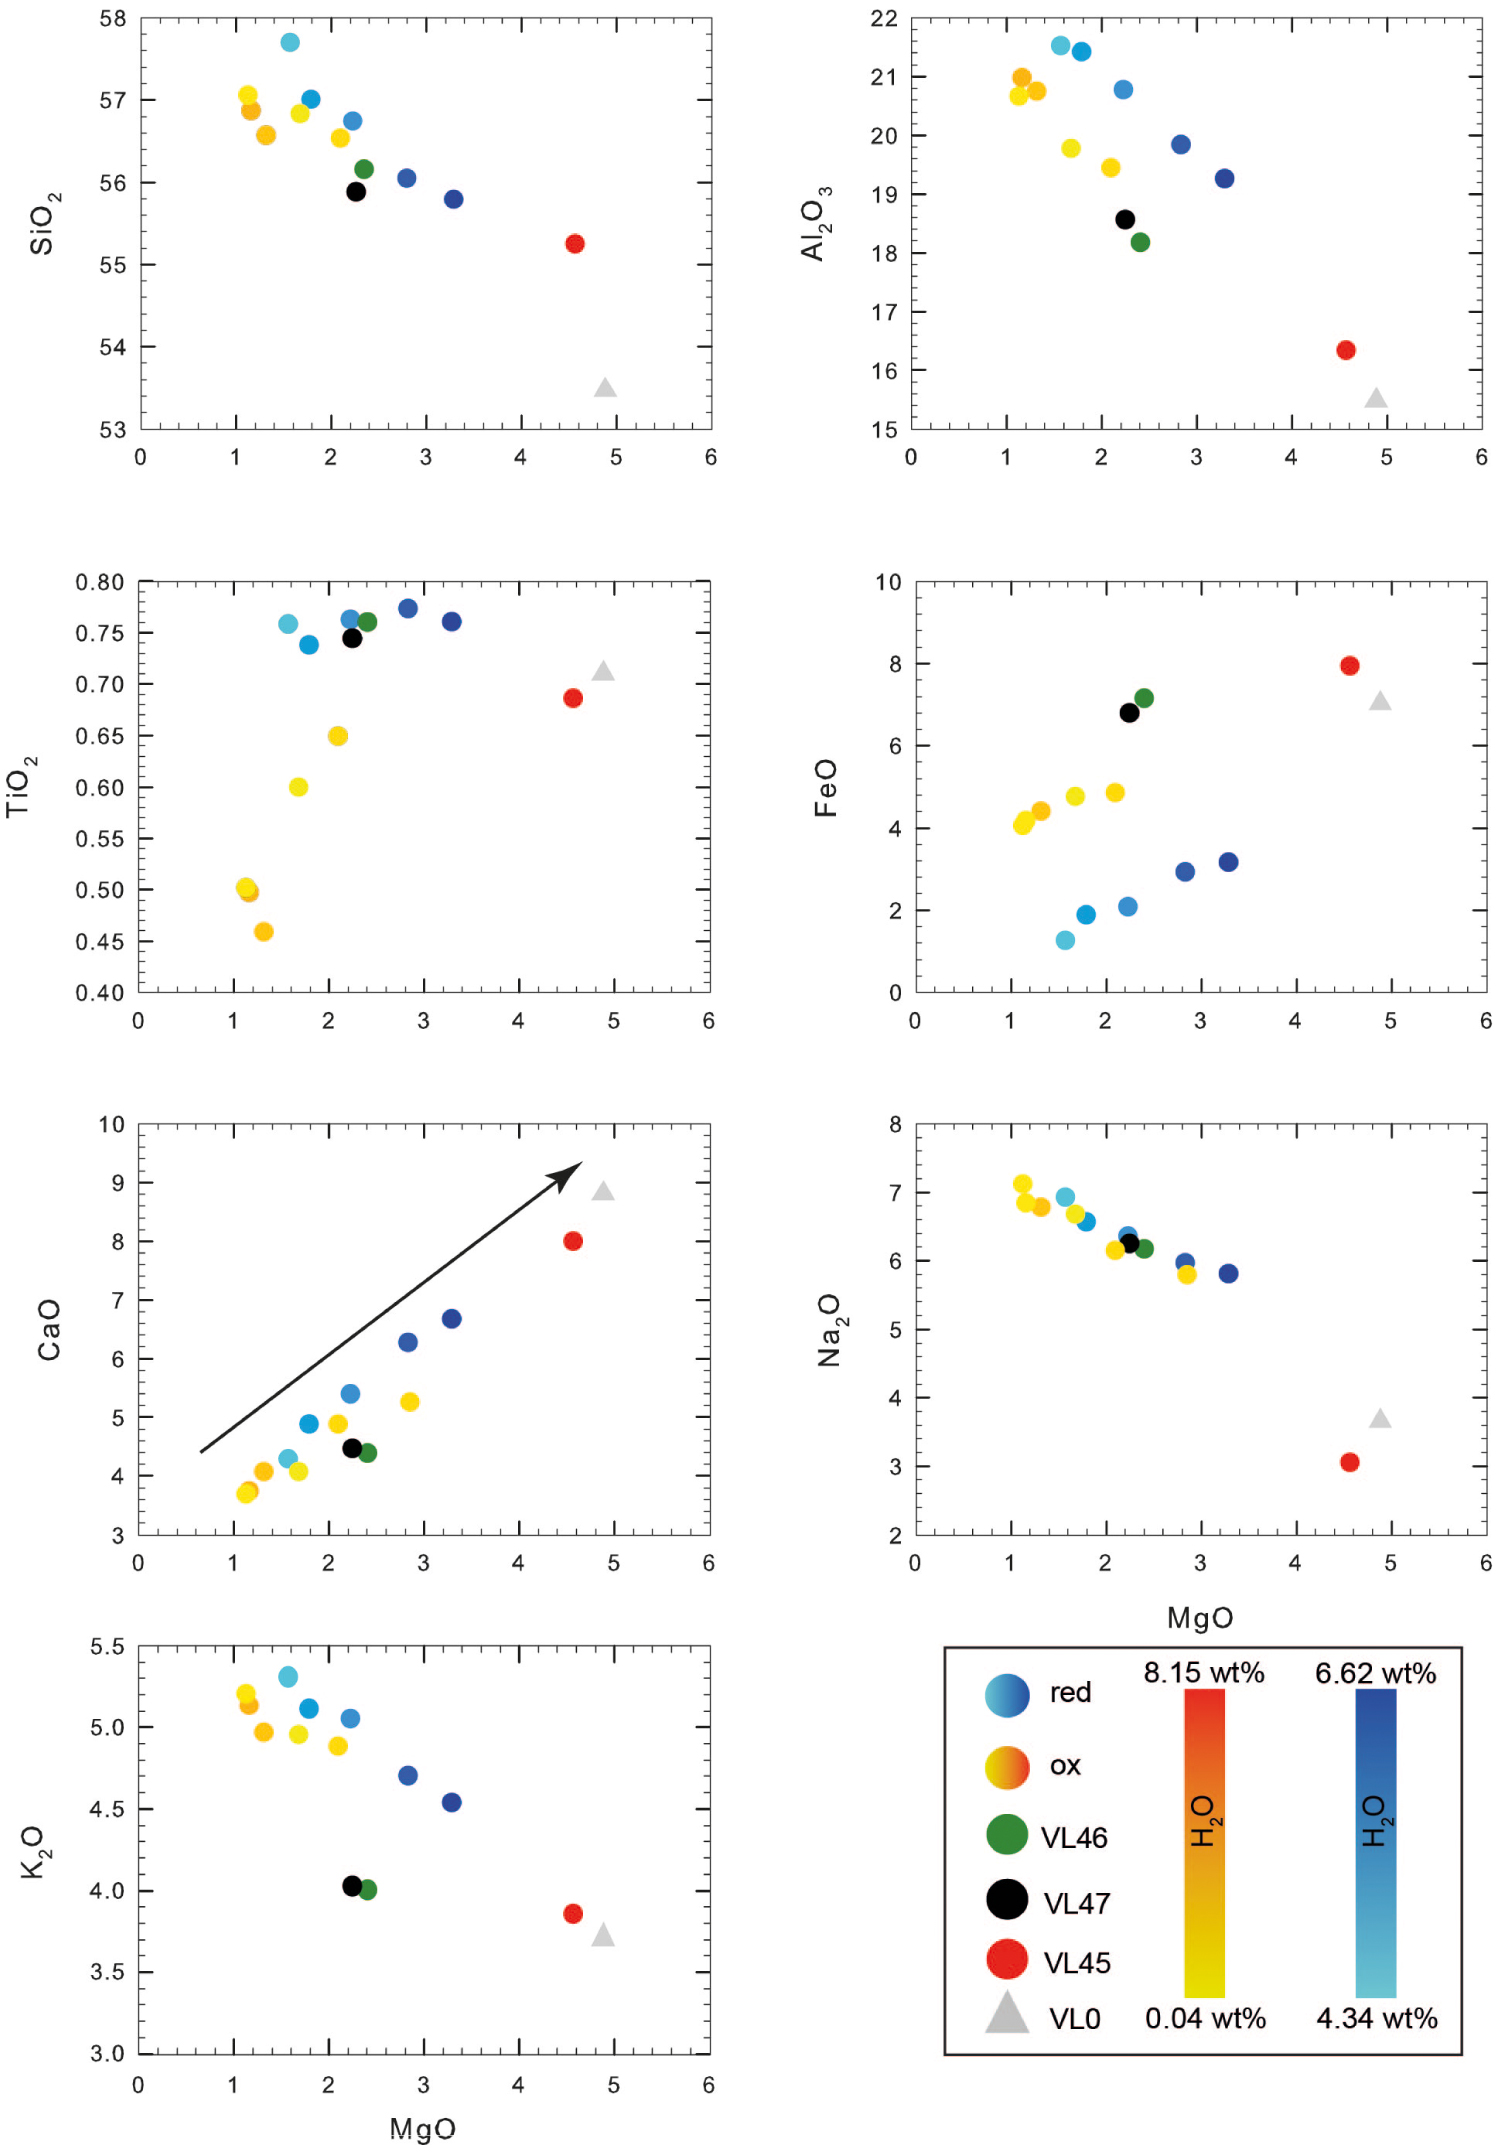
Eight experiments were performed at volatile saturated conditions and six at volatile undersaturated conditions (Figure 1). Figure 3 shows the variation of crystal content as a function of water content. The general trend indicates that the higher the amount of water in the melt, the lower the amount of crystals, as expected from the numerous previous phase relationships conducted so far. No significant difference between fluid-absent and fluid-present runs is detected in terms of crystal content in samples with an amount of water added to the system that is larger than 1.0 wt%. Thus, we did not detect a substantial difference in crystal content between experiments performed at fluid-saturated and fluid-undersaturated conditions if the aH2O is similar. For example, we investigated the effect of increased CO2 concentration in water-rich samples (i.e. up to 3.7 wt% H2O; sample VL32 and VL33, see Table 3) by performing two experiments with a total amount of CO2 from 6500 ppm (fluid-saturated) and 2900 ppm (fluid-undersaturated). No difference between CO2-rich and CO2-poor samples was observed in terms of crystallinity. In particular, both melts showed Cpx contents of ∼16% (Table 3). In contrast, our experiments show that, at very low H2O content, the presence of CO2 causes a substantial decrease of crystal content. A difference up to 10 area% in crystal content is observed between samples VL46 and VL47 (see Table 3), where the first charge contains a large amount of CO2 (2.8 wt%, nominally dry, no water added) while VL47 is nearly volatile free. It is emphasized that this difference of 10 area% in crystallinity determined by image analysis is also consistent with mass balance calculations. Using the GeoBalance program [Excel VBA program for mass balance calculation; Li et al. 2020] the residual melts in VL47 can be best reproduced if 6 wt% Pl and 30 wt% Cpx crystallize from the starting material (the mineral compositions from experimental products were considered for the calculation, see Table 3). For VL46, mass balance calculation indicates the crystallization of 3 wt% Pl and 25 wt% Cpx, pointing to the possible role of CO2 on phase proportions as discussed below.
Evolution of crystallinity vs. water content of experiments presented in Table 3. Note the variation on crystallinity between CO2 bearing and CO2 free sample in nominally dry experimental charges. Symbols as in Figure 1.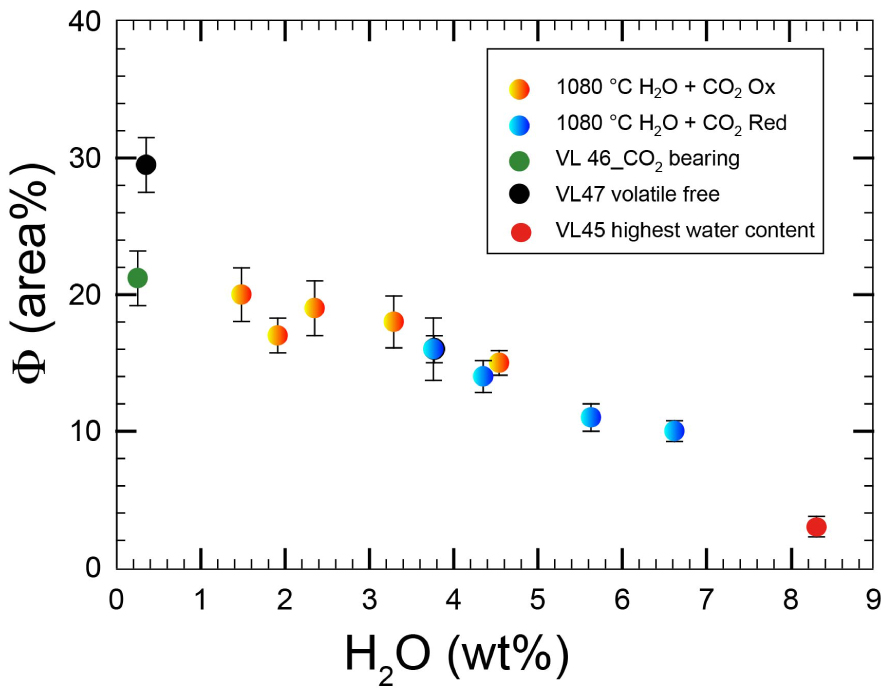
The alphaMELTS code was used to further elucidate the phase evolution observed in this study. The alphaMELTS (V. 1.9) software provides a simple text-based interface to subroutine versions of the algorithms MELTS [Asimow and Ghiorso 1998, Smith and Asimow 2005, Ghiorso et al. 2002, Ghiorso and Sack 1995]. It allows to calculate equilibrium assemblages along a thermodynamic path set by the user (details are provided by: http://melts.ofm-research.org/ and https://magmasource. caltech.edu/forum/). Results of the simulations are shown in Figure 4 comparing the crystals content measured via Image Analyses and calculated by using aplhaMELTS. There is a good correlation between calculated and measured data, although VL46 sample shows a calculated crystallinity higher than 40 vol% (expected from equilibrium thermodynamic calculation) whereas the experimentally observed crystallinity is much lower (Figure 4 and Table 3).
Comparison between Image Analyses measurements and calculat amount of crystals by alphaMELTS approach. Note the good correlation for most of the sample. VL46 sample, instead shows a large departure relatively to the 1:1 line (green circle).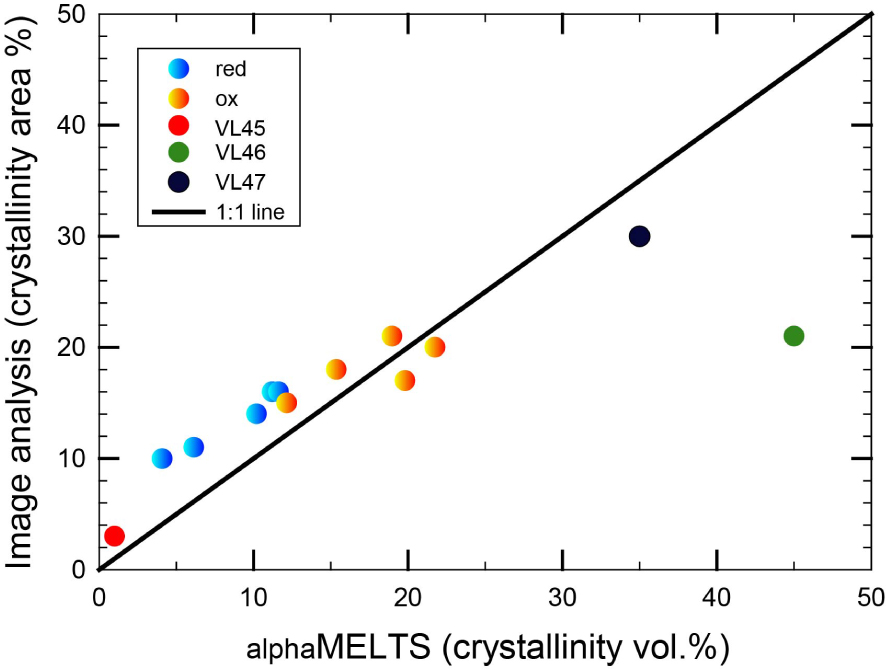
4. Discussion
4.1. Effect of volatiles on phase equilibria
In order to test for equilibrium condition in our experiments we can refer to models proposed by Putirka [2008]. Tests for equilibrium between Cpx and a coexisting liquid can be made by comparing observed and predicted values for Fe–Mg exchange, or KD(Fe–Mg)cpx–liq, which should be 0.28 ± 0.08 for Cpx (Putirka,2008; considering FeO =FeOtot). Our results show values ranging from 0.236 and 0.248 when using compositions in Table 2, indicating compositions close to equilibrium.
The glasses of our isothermal experiments show geochemical trends that are entirely controlled by the degree of crystallinity that itself depends on the composition and amount of volatiles in the system. The evolution trends for most of the elements (Ca, Mg, Si, Al) are consistent with the crystallization of Cpx (Figure 2), which predominates the solid phase. Ti is almost constant in experiments performed at reduced conditions whereas its abundance is lower in the experiments performed under oxidized conditions, due to the crystallization of Fe–Ti oxides in the latter. The composition of melts from two experiments (VL46 and VL47 at very low H2O content; Tables 2 and 3) deviates slightly from the general trend for some elements and can be explained by the presence of Pl in the run products (Figure 5).
BSE images of sample VL46 and VL47 (see Table 3) after annealing at 1080 °C and pressure of 500 MPa. In particular, as 2.8 wt% CO2 is added to the system, the crystal content decreases by about 10 area%, and also the relative amount of single crystal phases (Cpx and Pl) decreases (VL46*, Table 3). Clinopyroxene amount varies from 21.6 to 15.1 area% while plagioclase slightly decreases from 8.8 to 5.9 area% (VL46* and VL47*, Table 3).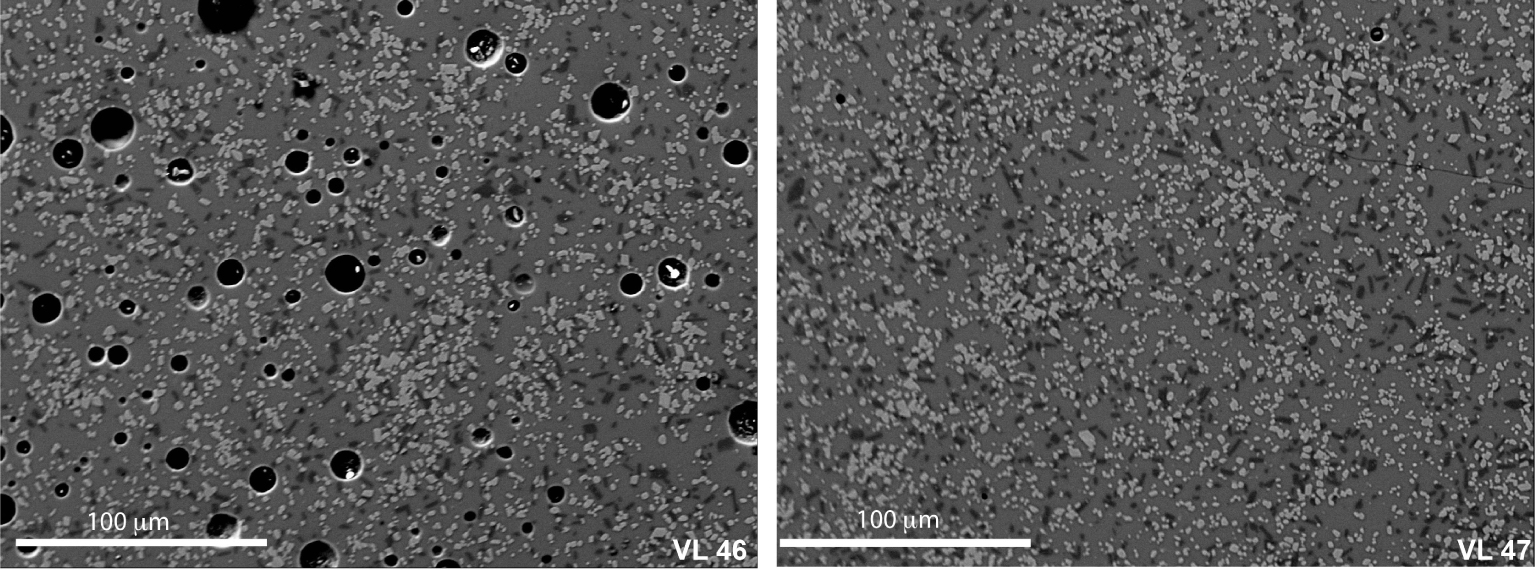
The amount of CO2 that can be dissolved in melts is lower than that of H2O and the solubility of both volatiles has been investigated as a function of pressure in a variety of melt compositions [e.g., Brooker et al. 2001, King and Holloway 2002, Holloway and Blank 1994, Dixon and Stolper 1995, Dixon et al. 1995, Jakobsson 1997, Morizet et al. 2010, Baker and Alletti 2012, Schanofski et al. 2019]. Carbon species (CO2, CH4, and CO) have low solubility in basalt and shoshonite melts [at 500 MPa < 4500 ppm CO2, Shishkina et al. 2014, Vetere et al. 2014, Behrens et al. 2009, Botcharnikov et al. 2006] and carbonate minerals are not stable in mafic melts. It could therefore be anticipated that (for low CO2 melt concentrations) CO2 has no effect on phase compositions and proportions when compared to CO2-free dry systems. Indeed, samples with high water contents do not show any important differences in terms of crystallinity between CO2-bearing and CO2-free samples (Figure 3). This indicates that water plays the most important role on controlling the crystallization temperatures and that the role of minor to moderate CO2 concentrations is subordinate. However, for systems with low water and relatively high CO2 levels, this observation seems not to be valid. The difference of 10% in crystallinity found between nominally dry samples (fluid absent and pure CO2 fluid) implies that CO2 does not behave as a fully inert component, only reducing water activity. Following the determinations of Husen et al. [2016], it is emphasized that the melts synthesized at nominally dry fluid-absent conditions in the internally-heated pressure vessel used at Hannover probably contain at least 0.5 wt% H2O. Absolutely dry conditions can never be realized because entrapment of adsorbed water during capsule preparation cannot be avoided and because hydrogen can diffuse through the capsule material at high temperature. This process is partially related to reduction of ferric iron to ferrous iron in the melt during the high T–P experiments following the reaction
| (3) |
Although experimental conditions are very different, our observations are in agreement with observations of Fiege et al. [2015] showing that the addition of ∼2000 ppm of CO2 to a hydrous basaltic melt (5 wt% H2O) has a small effect on crystal content (Cpx, Spl) and glass fractions (during decompression). Nevertheless, when evaluating in detail those data, we can see that samples containing only H2O show relatively higher abundance of Cpx compared to those containing both H2O and CO2. Experiments simulating the effects of CO2 fluxing conducted by Giuffrida et al. [2017] also indicate that the addition of CO2 to a partially crystallized basalt can influence the phase proportion and result in a partial dissolution of Cpx, in contrast to the common assumption. Vetere et al. [2015b] noted that the crystallinity of Etna basalt decreases as CO2 is added to the system, which is in agreement with the data from this study on a shoshonitic system. In particular, in those experiments, Pl was the most abundant mineral phase, but Pl was absent when only CO2 was added to the experimental charge. In addition, CO2 appeared to lower Cpx abundance [Vetere et al. 2015b]. Thus, CO2 may not act as a complete inert phase in mafic systems in which it is mainly incorporated as carbonate species.
A closer look on data presented in Figure 3 allows us to further discuss the effect of the CO2 in magmatic systems. In fact, Figure 3 shows, at least for added water content higher than 2 wt%, a nearly linear correlation between crystallinity and added water content, independently on fO2. In Figure 6 we show that, if the amount of added CO2 is larger than 0.65 wt% and added water content is close or lower than 2 wt%, the crystallinity of the run products becomes lower than what would be predicted from the nearly linear trend between crystallinity and added water, as highlighted by the dashed black and red lines (Figure 6).
Insight on the evolution of crystallinity vs. water content of experiments presented in Table 3. Note the variation on crystallinity (red and black dashed curves) between samples having water content lower than 3.5 wt% with CO2 > 0.65 wt% and CO2 < 0.65 wt%. Equations curves are also reported.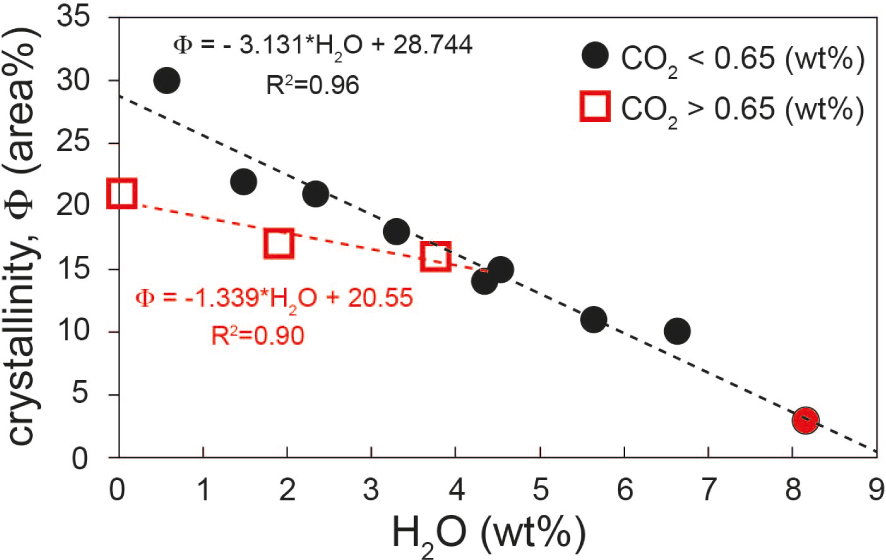
More in details, the flushing experiment performed by Giuffrida et al. [2017], showed that a CO2-rich fluid phase leads to an increase of the amount of Cpx and a decrease of the abundance of Pl at 300 MPa. This decrease of Pl proportion is associated with a change in An content. Although the conditions are very different, as described above, this proves an effect of CO2 on phase stability. Even if small, we also observed a change in An content from CO2 free to CO2 bearing (VL46 to VL47) as observed in Giuffrida et al. [2017] from high to low pressure experiments on Etna basalt. The glass compositions presented in Table 2 also highlight some differences between VL46 and VL47 samples. The SiO2 and Al2O3 concentrations are lower in VL46 whereas FeO and CaO concentrations are higher in VL46. This leads to a small variation of NBO/T (0.33 to 0.28) but could mirror the small mineral chemistry variations that we observed. Finally, a liquidus temperature depression, caused by dissolved CO2 in melt, is expected and this depression may range from negligible to several hundred degrees depending on silicate melts composition and pressure [Eggler 1975, 1976, Mysen and Boettcher 1975, Eggler and Kadik 1979, Eggler and Rosenhauer 1978, Boettcher et al. 1987, Boettcher 1984]. The extent of this depression is linked to the solubility and solubility mechanism(s) of CO2 in the melt. For instance, the liquidus temperature depression of the CaMgSi2O6–CO2 system compared to the volatile free system illustrates this mechanism [Eggler and Rosenhauer 1978, Mysen and Richet 2005].
Finally, it is emphasized that the difference in liquidus temperature for the CO2 bearing and CO2 free compositions (samples VL46 and VL47) observed experimentally at 500 MPa could not be reproduced with alphaMELTS, with TL of 1223 °C and 1231 °C, respectively. Thus, the application of thermodynamic models to predict the role of high CO2 concentrations on phase stability in water-poor systems needs to be reconsidered. This appears to be particularly relevant in Italians volcanic systems, which are often reacting with carbonates.
4.2. Implications for magma dynamics
The data presented above (literature data and our new experimental results) can have profound implications upon the rheological behavior of magmas. In particular, viscosity is highly influenced by the amount of solid phases. This, in turn, might influence the way magma ascends towards the Earth surface and eventually erupts.
The Vulcanello peninsula formed by effusions from a 600 m long, 0.5 to 1.5 m wide eruptive fissure (dike) [Vetere et al. 2007, and reference therein]. Based on the analysis of fluid inclusions in quartz xenoliths we assume for the storage of the shoshonitic magma a trapping depth between 21.5 and 17 km (corresponding to the Moho depth) [Zanon et al. 2003, Peccerillo et al. 2006]. As such, a possible deep storage reservoir could be hypothesised from which, during the eruptive phase of Vulcanello 1, the magma moved directly to the surface, without intermediate storage into the crust [Davì et al. 2009, Nicotra et al. 2018]. Taking into account the water free samples VL46 and VL47 (Figure 5), having a crystal content of about 20 and 30 area%, respectively, we can calculate the effective viscosity of the crystal bearing system using the models proposed by Sato [2005] and Vona et al. [2011] [𝜂r =𝜂 eff∕𝜂m where 𝜂r is the relative viscosity, 𝜂eff is the effective viscosity of the liquid containing a fraction of crystals, and 𝜂m is the viscosity of the melt using the model of Vetere et al. 2007]. Moreover, as required by the Vona et al. [2011] model, using image analysis technique on BSE images collected after experiments, one can extract and characterize the crystal shapes from the input grey-scale slides, without considering the possible presence of nanometric crystals [Cassetta et al. 2023]. Procedures are described in Dellino and La Volpe [1996] and Loncaric [1998]. The aspect ratio (AS = major axis/minor axis) parameter providing information on the particles elongation was determined following [Cox and Budhu 2008]. Results indicate that for our experiments the average AS for Pl is 2.5 and for Cpx is 1.7 while Fe–Ti oxides (when present) have AS close to 1. By taking into account these results, viscosity values of 104.0–104.4 Pa⋅s are obtained for system containing 20 and 30 area% of crystals, respectively by using the Vona et al. [2011] model. These values are comparable to those obtained using the model proposed by Sato [2005, i.e. 103.9 and 104.2 Pa⋅s].
Figure 7 shows the variation of viscosity of the shoshonitic magma as a function of the crystal and volatile contents. The increase in viscosity is clearly related to the decrease of the volatile content and the relative increase of solid phases.
Variation of viscosity vs. water content for samples reported in Table 3. Symbols are identical to those reported in Figures 2 and 3 (see text for details).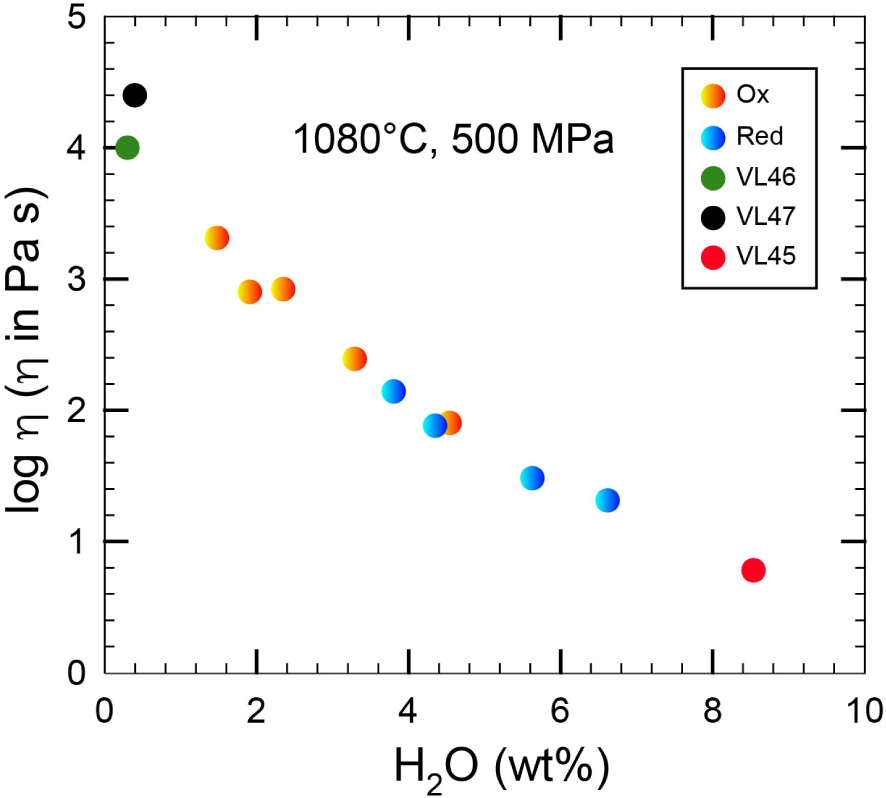
Considering that magma ascent in dykes is strongly conditioned by dyke width, magma ascent in narrow dykes could be obstructed by magma crystallization. Critical dyke widths were calculated by Petford et al. [1994] for magma with felsic composition showing similar viscosities as those investigated here [see also Scaillet et al. 1996]. Results show that dykes thinner than 1 m can hardly propagate from very large depths. We are aware that narrow dykes (<1 m) cannot be approximated to a smooth tabular shape with a constant dyke width, due to the natural roughness of rock fracture planes. However, by doing the identical exercise as in Petford et al. [1994], and taking into account (a) basaltic magma temperature, (b) freezing point, (c) rock country temperature (1200 °C, 700 °C and 300 °C respectively), (d) the latent heat for basalt (400 J/g) and (e) the specific heat of basaltic magma (1.0 J⋅g−1⋅°C−1), the critical size for dikes reduces to 0.3 m. Thus, we have some constrains for the following discussion.
In order to calculate a possible ascent velocity (u; m⋅s−1) of these magmas we can use the relation of Lister and Kerr [1991] for laminar flow:
| (4) |
As stated above, the eruptive fissure at Vulcanello has width ⩽1.5 m. If now we consider a density contrast between magma and country rock of 𝛥𝜌 = 275 kg/m3 as reported in Vetere et al. [2007], and 𝜂 = 103.5 Pa⋅s for a system containing melt with 0.3 wt% H2O (see also Table 3 samples VL46, VL47), we can estimate a possible rise velocity of such magmas, assuming that the width of the conduits varies from 0.1 to 1.5 m. Results are presented in Figure 8a where the ascent velocity is found to vary in the range u(CO2 free) = 1.5 × 10⁻⁴–3.5 × 10⁻² m/s, and u(CO2 bearing) = 5.7 × 10⁻⁴–1.3 × 10⁻¹m/s. The estimated velocity is subject to an abrupt increase if we consider H2O–CO2 bearing systems. Considering that at Vulcanello the water content is estimated between 0.3 and 1.9 wt% [analysis of melt inclusions from shoshonitic samples of Vulcanello in Gioncada et al. 1998 and Clocchiatti et al. 1994a, b] and considering a temperature of 1080 °C [the estimated temperature for Vulcanello magmas is 1083 ± 40 °C, Zanon et al. 2003], a crystallinity of 17 area% can be expected for H2O- and CO2-bearing samples (e.g. VL37; Table 3). At these conditions the magma viscosity is about 102.8 Pa⋅s and its ascent velocity (1.5 × 10⁻²–3.3 m/s as w varies from 0.1 to 1.5 m, respectively, Figure 7) would be faster than in a volatile-free magma (see u(CO2 free) given above). Thus, in case of a nominally dry magmatic system rising in conduits having width 1.5 m, the time to reach the surface starting from a depth of 20 km is slightly lower than 4 years. However, if CO2 is present, this duration decreases to ∼300 days, and <2 h are estimated assuming that 2.0 wt% H2O + 0.6 wt% CO2 are dissolved in the melt. Although these short timescales cannot be applied to the Vulcanello magma, which has lower volatile [Clocchiatti et al. 1994a, b], they could be relevant to other shoshonitic volcanic systems.
(a,b) Velocities and ascent times evolution vs. conduits size for Vulcanello (a) and hypothetic volcanic systems with dike widths ⩽3 m and a density contrast between magma and country rock 𝛥𝜌 = 200 kg/m3 (b). Please refer to text for details.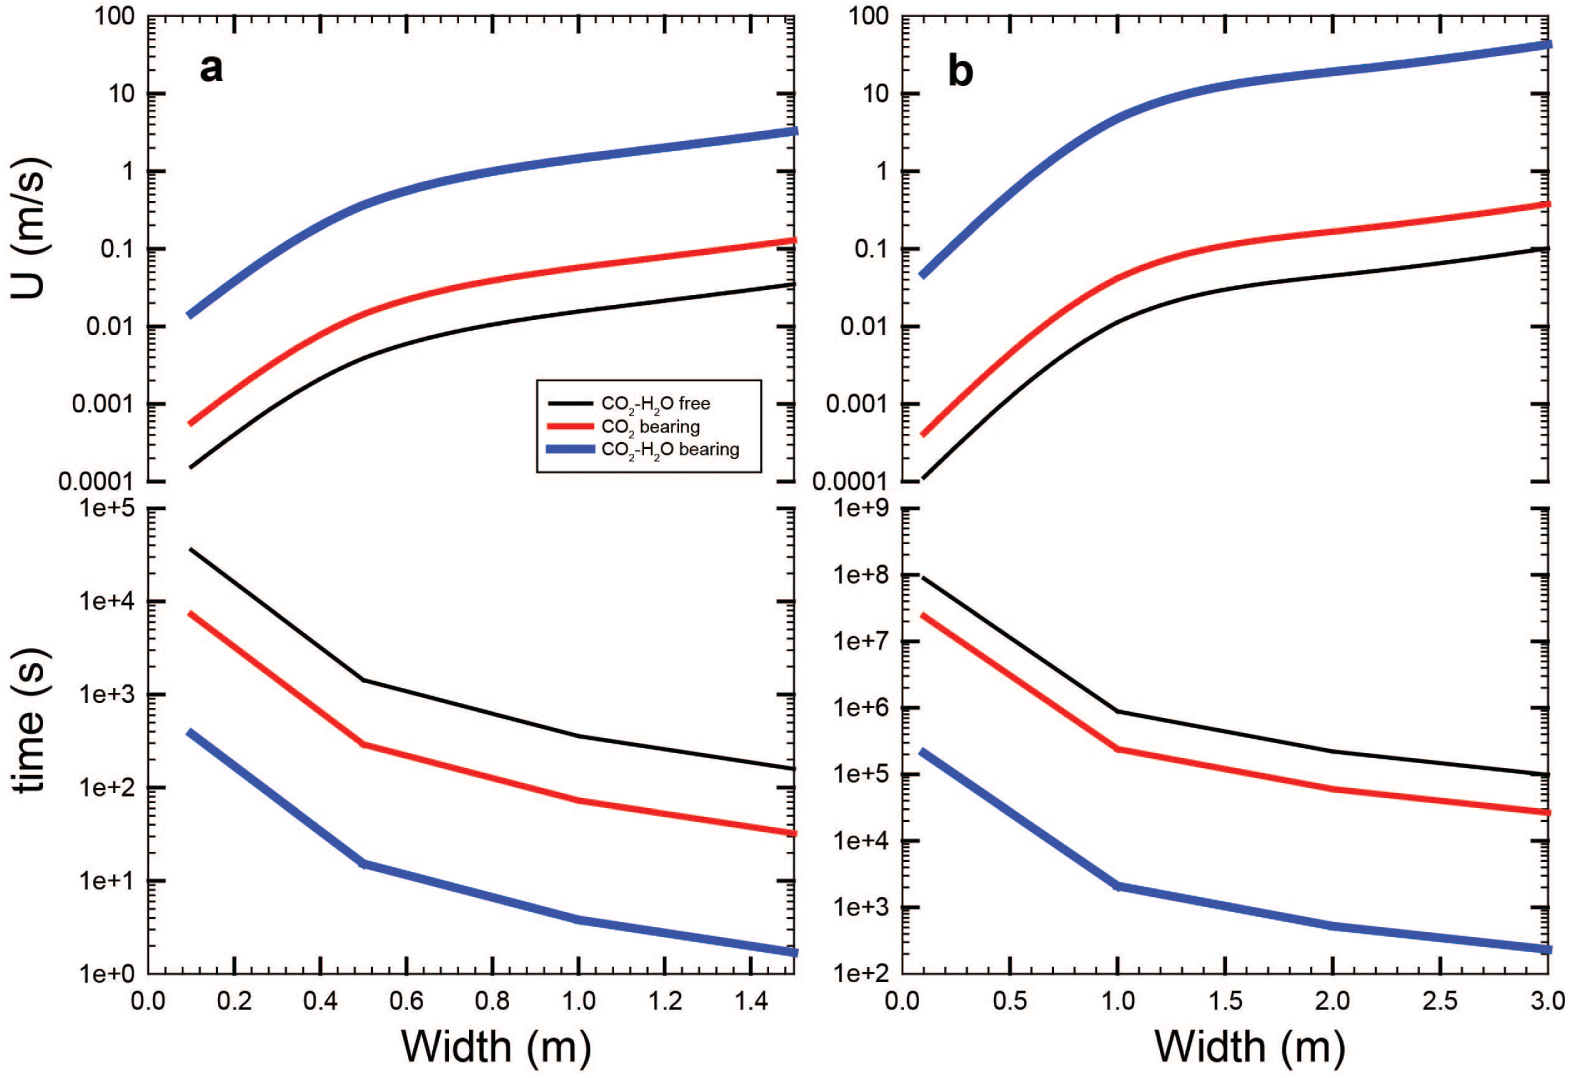
As a further example, by making identical considerations as above, we can consider a hypothetic scenario with a viscosity 𝜂 = 103.5 Pa⋅s (for a system containing melt + 0.3 wt% H2O see Table 3, samples VL46, VL47). Thus, if dyke widths are ⩽3 m and the density contrast between magma and country rock is 𝛥𝜌 = 200 kg/m3 and adopting Equation (4), we can have an estimate of the possible rise velocity as presented in Figure 8b. In this case, results are: u(CO2 free) = 1.1 × 10⁻⁴–1.0 × 10⁻¹ m/s, and u(CO2 bearing) = 4.2 × 10⁻⁴–3.7 × 10⁻¹ m/s. Finally, if we consider H2O–CO2 bearing systems with concentrations similar to the experiments VL32 or VL33 (Table 3) and a temperature of 1080 °C, the lower crystallinity allows magma to have viscosity in the order of 102 Pa⋅s and, as consequence, to rise much faster in the range 4.7 × 10⁻²–42.9 m/s as w varies from 0.1 to 3 m, respectively (Figure 8). It is important to keep in mind that in dynamic magmatic systems (during ascent) the CO2 release is relatively rapid and possibly can locally accelerate magma ascent.
5. Conclusions
Crystallization experiments of a natural shoshonite were performed at 500 MPa, and 1080 °C and water activities aH2O from 0.01 to 1.00. Results show that clinopyroxene is the main crystallizing phase and plagioclase is found to be a stable phase only for water activity lower than 0.1, while spinel is present in all the runs except in those where log fO2 was lower than −9 (𝛥NNO −0.11).
Interestingly, at low water activity (below 0.1) the addition of CO2 at constant water content reduces the crystallinity of shoshonitic systems. This behaviour is not predicted by classical thermodynamic models. Thus, in the case of CO2-rich and H2O-poor systems, magmas become less viscous due to the relative decrease in crystallinity. The application of viscosity models to our experimental dataset allows us to infer the possible ascent velocity and ascent time of this type of shoshonitic H2O-poor magmas from Vulcanello.
Since the magmatic composition used for our study is chemically similar to many Italian volcanic systems (Aeolian Arc, Campi Flegrei, Ischia Island, Pontine Islands, Monti Cimini, Monte Amiata, Capraia Island, Radicofani, Roccamonfina) and also to other systems worldwide (Yellowstone, Mariana Arc, Kurile Arc, Tonga Arc, Andean Arc, Kamchatka Arc), we suggest that our observations will be useful to better understand shoshonitic magma behaviour under relevant geological scenarios. The probability of very rapid ascent of less-evolved melts from depth has to be taken into account for future volcanic crisis and hazard evaluation.
Conflicts of interest
Authors have no conflict of interest to declare.
Acknowledgements
This study was funded by the “Piano di Sostegno alla Ricerca 2022 per finanziamenti a progetti di ricerca Curiosity-driven (F-CUR_CREAMI)” to FV.