


 CC-BY 4.0
1. Introduction
Increasing archaeological and paleogenetic evidence in desert areas of northern Africa and the Arabian Peninsula shows that the period spanning the time interval 59,000–29,000 years ago (i.e., Marine Isotopic Stage 3) was crucial for human history with important migration waves of Homo sapiens from Africa into the Arabian Peninsula and the Levant [e.g., Drake et al. 2013; Gracea 2016; Timmermann and Friedrich 2016]. However, the environmental conditions behind these migrations are poorly known. The time interval corresponding to MIS 3 belongs to the last glacial period (70–15 ka). The paucity of continental records corresponding to this period has been interpreted as indicating the absence of wet phases between MIS 5 and the Holocene throughout the Sahara [Causse et al. 1988]. But that conclusion has been debated ever since. Intense deflation during the last ice age [e.g., Sarnthein 1978] could have largely destroyed or severely damaged lake or fluvial sediments, which could have reflected climatic conditions favourable to the settlement or migration of human populations.
In addition to the paucity of paleoenvironmental archives, there is a major methodological limitation: due to the short half-life time of 14C (5730 years) the radiocarbon dating method reaches its limit of use around 50,000 years. Contamination of lake sediments by older carbon from groundwater or detrital material, or recrystallisation process cast doubt on the quality of the dating at the limit of the method [Fontes and Gasse 1989]. In recent decades, radiocarbon dating has been complemented by the increasing use of U/Th or luminecence methods for dating continental sediments, thereby improving significantly age reconstructions, despite the large uncertainties that can be associated with these methods. Whenever they are available, well-dated and continuous continental and marine records can shed light on the chronology of climatic events which punctuated MIS 3. However, these records are too scarce to provide a global view of the evolution of climatic and environmental conditions over North Africa and the Arabian Peninsula. In particular, they cannot address the geographical spreading and retraction of humid areas. Thus, to complement these few continuous records, we also collected published data to build a comprehensive database of well-dated samples from wet environments (lakes, paleosoils, river terraces, concretions and travertines). We interpret the number of dated samples over 1000-year time windows along the MIS 3 as an indicator of humidity. The likelihood of collecting and dating those wet paleo-environmental archives is higher for time intervals when humid conditions prevailed over North Africa and the Arabian Peninsula, thus resulting in many more sedimentation sites and higher chances that some of these archives have reached us despite the intense deflation of the last ice age. The large dating uncertainties of the continental samples do not allow us to interpret the rapid variations seen in the high-resolution continuous records, nor to confidently discuss leads and lags between climate indicators at different sites. Thus, the main objective of this article is limited to (i) evaluating whether MIS 3 was drier or wetter compared to the pre-industrial period, and (ii) comparing the climatic signals and their evolution over three regions of the northern hemisphere: (1) Tropical Africa, (2) North Africa and (3) East Africa and the Arabian Peninsula (Figure 1). Our reconstructions are compared with past climate simulations obtained with the climate model from IPSL (IPSLCM5A-LR) in order to discuss the forcings and the mechanisms involved in the climate system.
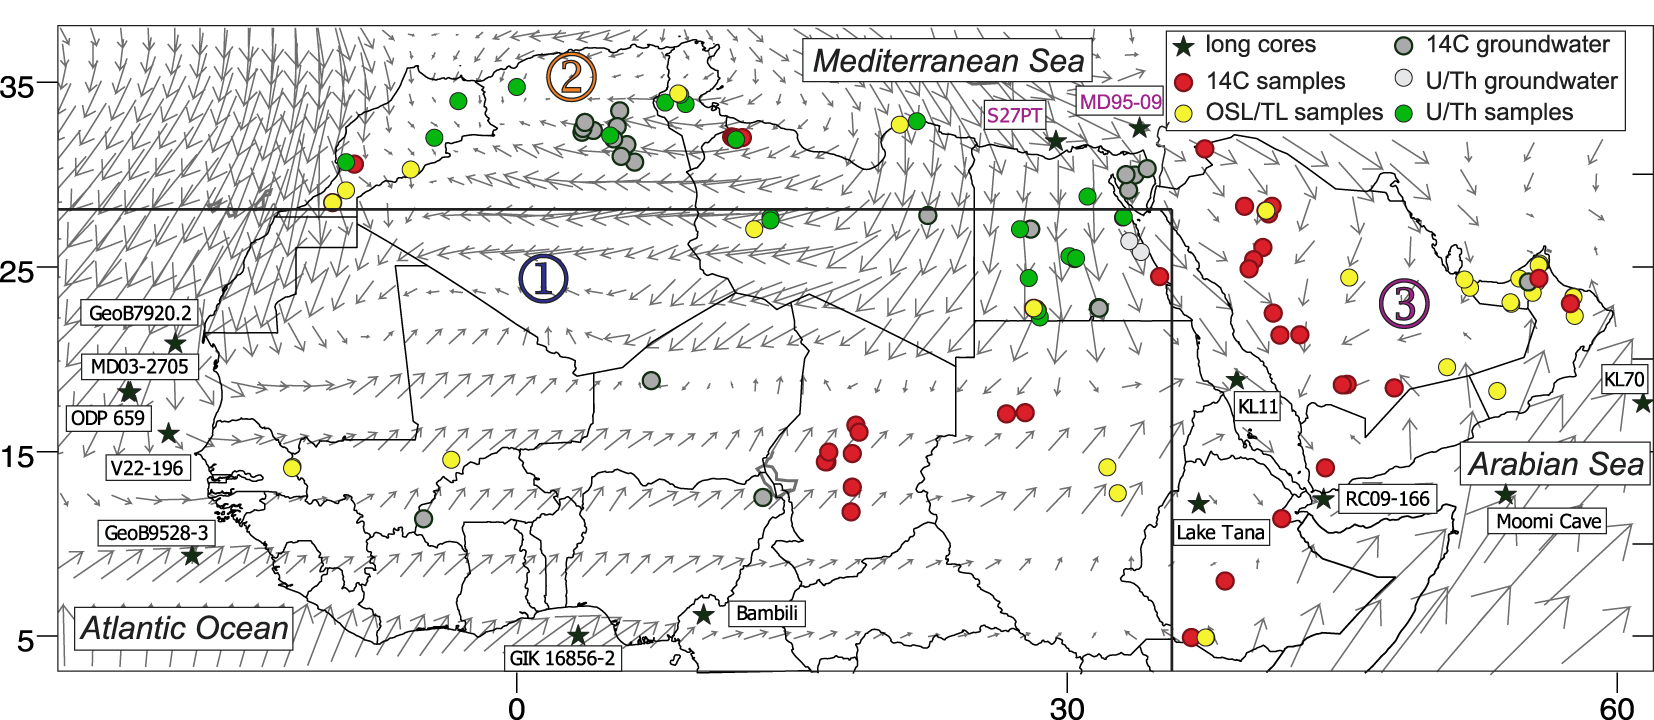
Location map of the MIS 3 dated continental records and long paleoclimatic records cited in the text. Grey arrows indicate the strength and direction of the main 925 hPa monsoonal winds during boreal summer (NCEP-DOE AMIP-II Reanalysis [Kanamitsu et al. 2002]). Numbers refer to (1) Tropical Africa, (2) North Africa and (3) Eastern tropical Africa and the Arabian Peninsula. Continuous paleo-archives from tropical Africa and eastern tropical Africa and the Arabian Peninsula are shown in Figures 4 and 5, respectively.
2. Modern climate conditions
The monsoonal climate of tropical North Africa and the Arabian Peninsula is characterised by seasonal reversal of the atmospheric circulation and migration of the intertropical convergence zone (ITCZ) associated withthe tropical rain belt. In summer, southwesterly surface winds carry moisture from the Atlantic and Indian oceans to the adjacent continents. Atlantic monsoon fluxes penetrate far northward over northern Africa to the Tropic of Cancer and eastward to eastern Sudan whereas the easternmost areas of northern Africa are mainly subjected to the Indian monsoon influence. SW Indian monsoon fluxes follow the southern Arabian coasts then penetrate eastward to southern Iran, Pakistan and western India. In winter, the atmospheric circulation reverses with the development of northeasterly winds blowing toward the ocean and resulting in dry conditions over the continents. Wet conditions are observed, however, over the Red Sea and in the Arabo-Persian Gulf corridors owing to the penetration of Mediterranean depressions during winter.
3. The data sets
In order to subdivide our dataset into internally consistent, climate areas, three main regions have been distinguished based on the respective influence of tropical and Mediterranean climates. These three regions are: (1) Tropical Africa (including the Eastern Atlantic) from the Atlantic coast to the eastern border of Sudan which encompass areas under the predominant influence of summer rains from the African monsoon, (2) North Africa influenced by winter rains from the Mediterranean area and (3) eastern tropical Africa (Ethiopia and Dibouti) and the Arabian Peninsula (including the Arabian Sea and the Red Sea), which are influenced by the Indian monsoon, and the Mediterranean rains. Marine records from the eastern Mediterranean are included in sector 3 because they are influenced by the Nile River, whose watershed includes the Ethiopian highlands.
3.1. Continuous continental and marine records
3.1.1. Tropical Africa, including eastern Atlantic Ocean sites
We selected long, published sequences from West Africa to provide us with vegetation information (pollen, plant waxes, carbon isotopes) and continental hydrology (pollen, sediments). From South to North (Figure 2):
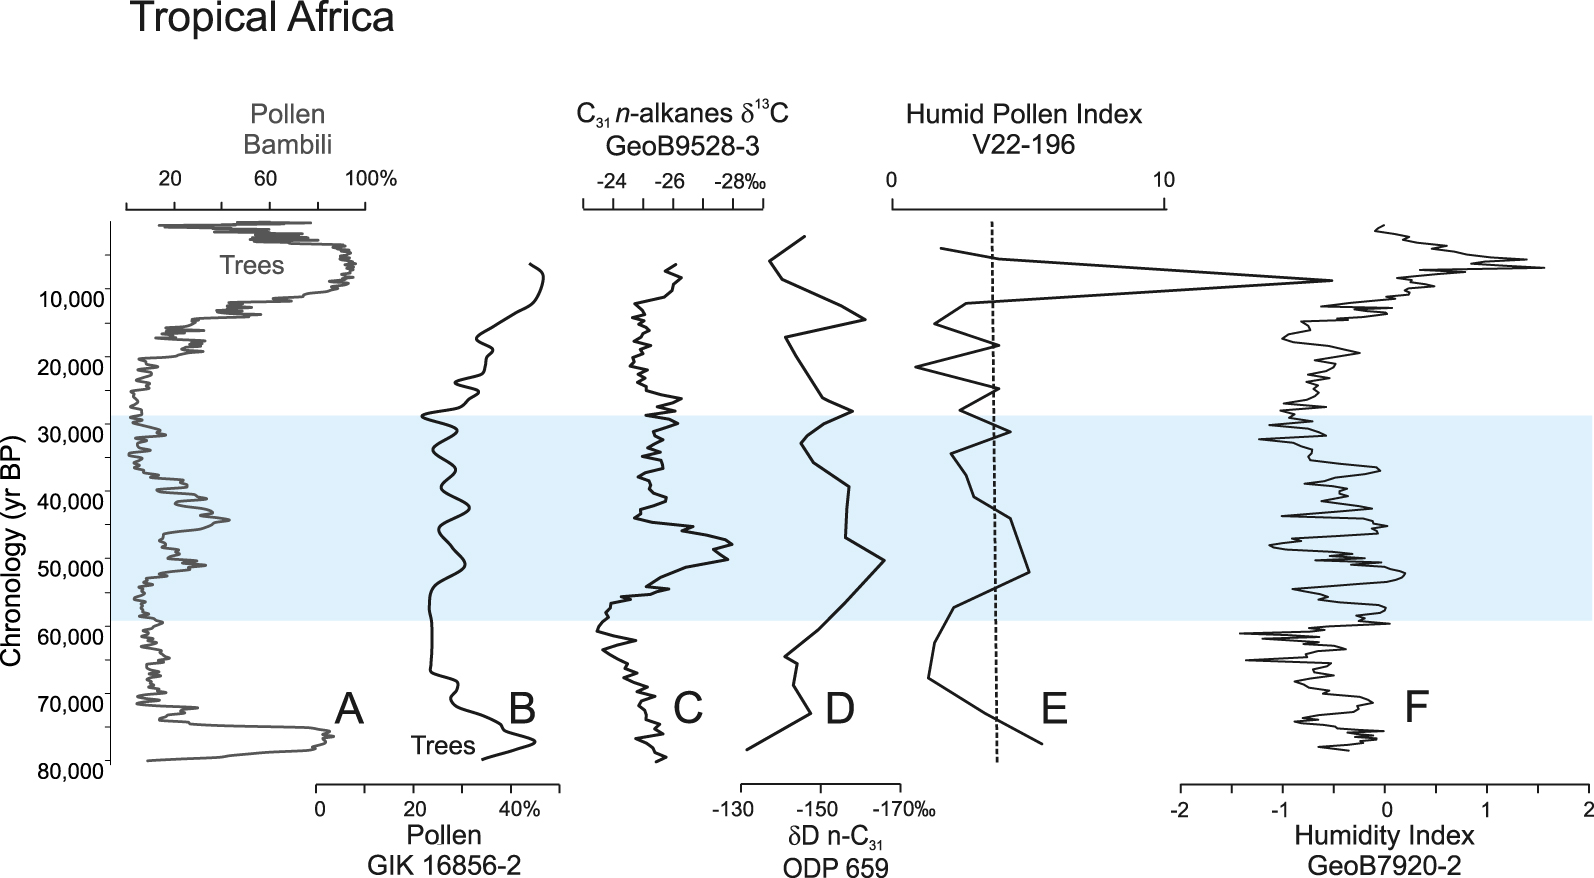
MIS 3 in North Tropical Africa: From left to right (A) tree pollen percentages (Lake Bambili, Cameroon) [Lézine et al. 2019]; (B) tree pollen percentages (Core GIK 16856-2) [Dupont and Weinelt 1996]; (C) δ13C of plant leaf waxes (Core GeoB9528-3) [Castañeda et al. 2009]; (D) δ13C of plant leaf waxes (Core ODP 659) [Kuechler et al. 2013]; (E) Humid Pollen Index (Core V22-196) [Lézine and Casanova 1991]; (F) Humidity Index (Core GeoB7920.2) [Tjallingii et al. 2008]. The blue band indicates the period corresponding to MIS 3. Masquer
MIS 3 in North Tropical Africa: From left to right (A) tree pollen percentages (Lake Bambili, Cameroon) [Lézine et al. 2019]; (B) tree pollen percentages (Core GIK 16856-2) [Dupont and Weinelt 1996]; (C) δ13C of plant leaf waxes (Core GeoB9528-3) [Castañeda et al. ... Lire la suite
- Gulf of Guinea: Pollen data were used to reconstruct phases of forest expansions in cores GIK 16856-2 (4.805 N, 3.40167 E) [Dupont and Weinelt 1996] and Bambili (5.93369 N, 10.24064 E) [Lézine et al. 2019] located off the mouth of the Niger River and off the nearby Cameroon highlands, respectively.
- Off the Sahel and the Sahara: The percentage of C4 and C3 vegetation as well as variations in continental humidity were reconstructed from (i) marine records of the δ13C of plant leaf waxes (n-alkanes) obtained on core GeoB9528-3 [9.166 N, 17.6635 W, Castañeda et al. 2009] and ODP site 659 [18.083333 N, 21.033333 W; Kuechler et al. 2013] and (ii) the pollen content of core V22-196 [15.83333 N, 18.95 W; Lézine and Casanova 1991]. Continental humidity over the Sahara was reconstructed based on the ratio of hemi-pelagic mud to Aeolian dust in core GeoB7920.2 [20.7515 N, 18.581667 W; Tjallingii et al. 2008].
3.1.2. Eastern Africa, including sites from the Indian Ocean and the Arabian Sea (Figure 3)
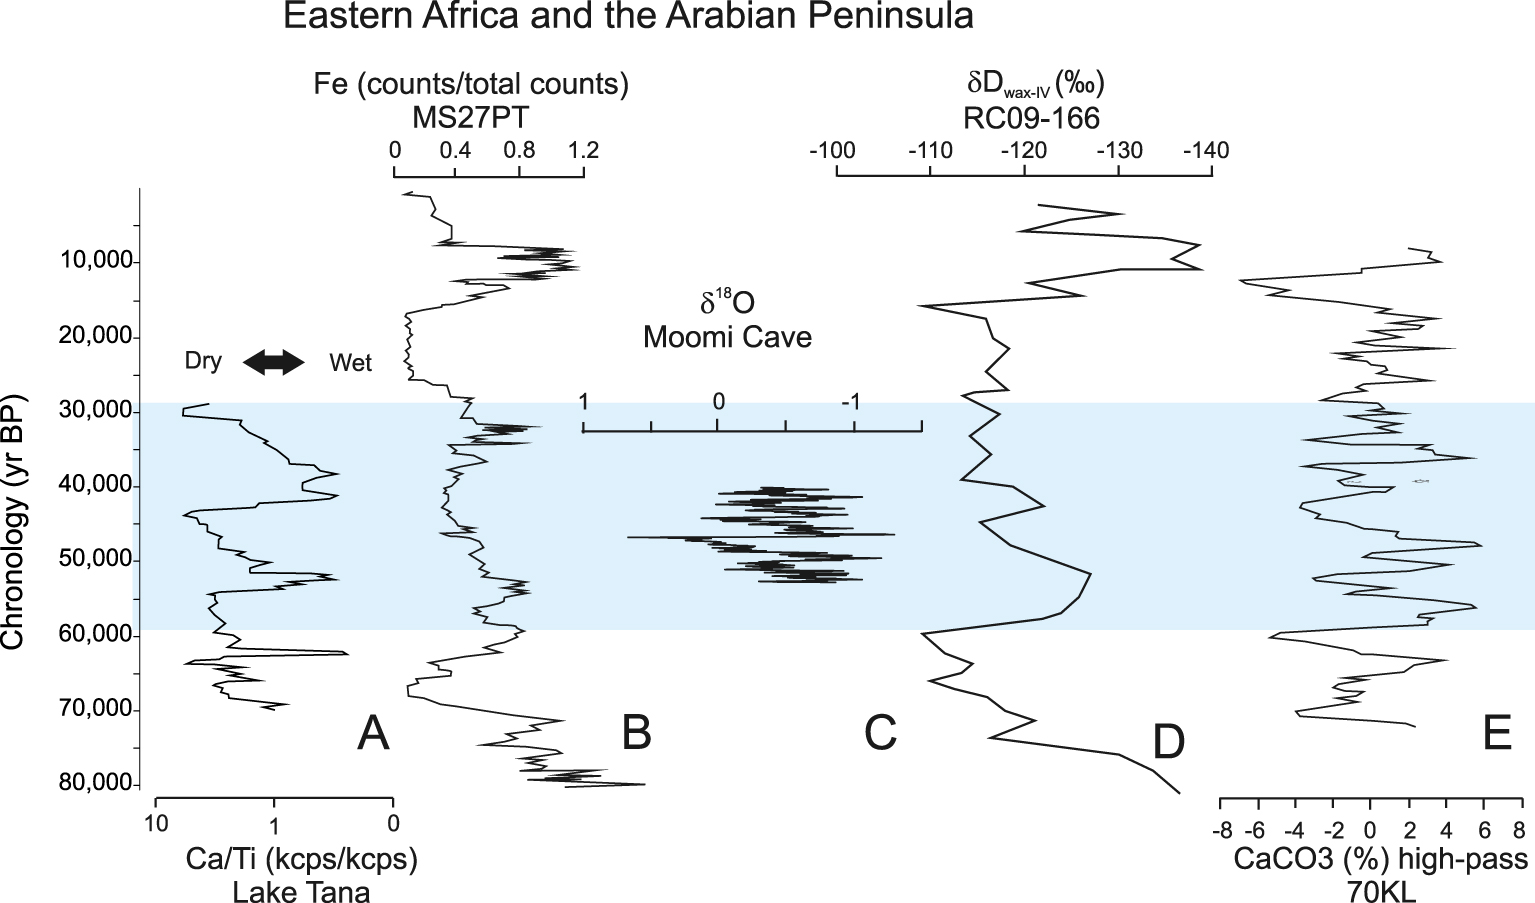
MIS 3 in Eastern Africa and the Arabian Peninsula: (A) Lake Tana (Ethiopia) Ca/Ti ratio [Lamb et al. 2018]; (B) Nile River record from core MS27PT Fe [Revel et al. 2010]; (C) Moomi Cave (Socotra Island) δ18O record [Burns et al. 2003, 2004]; (D) Stable hydrogen isotopic composition of leaf waxes from Core RC09-166 [Tierney et al. 2017]; (E) CaCO3 from Core KL70 [Leuschner and Sirocko 2000].
- Eastern Africa: At Lake Tana in northwest Ethiopia (12 N, 37.25 E) [Lamb et al. 2018] the Ca/Ti ratio was used as a proxy for the lake level change. Off the mouth of the Nile River in the Mediterranean Sea, the Fe content of core MS27PT [31.798333 N, 29.461667 E; Revel et al. 2010] was used to infer the Nile River discharges and wet phases in its watershed including the Ethiopian highlands.
- The Arabian Sea: The δ18O variations recorded in the stalagmite M1-2 from the Moomi Cave on Socotra Island [12.498168 N, 54.209132 E; Burns et al. 2003, 2004; Fleitmann et al. 2004] were used to infer past changes in precipitation in the Arabian Sea area. Past hydroclimatic variations in the Gulf of Aden and the Arabian Sea were also deduced from the stable hydrogen isotopic composition of leaf waxes from marine core RC09-166 [12.25 N, 44.0666667 E; Tierney et al. 2017] and the %CaCO3 profile of core KL70 [17.5 N, 61.5 E; Leuschner and Sirocko 2000].
3.2. Continental hydrological samples
Our data set contains 245 dated samples from lake sediments, paleosoils, fluvial terraces, speleothems and travertines/springs collected at 82 localities in North Africa and the Arabian Peninsula and published in the litterature (Figures 1 and 4; Supplementary Table 1). We also examined seventy-four dated groundwater samples from 27 localities.
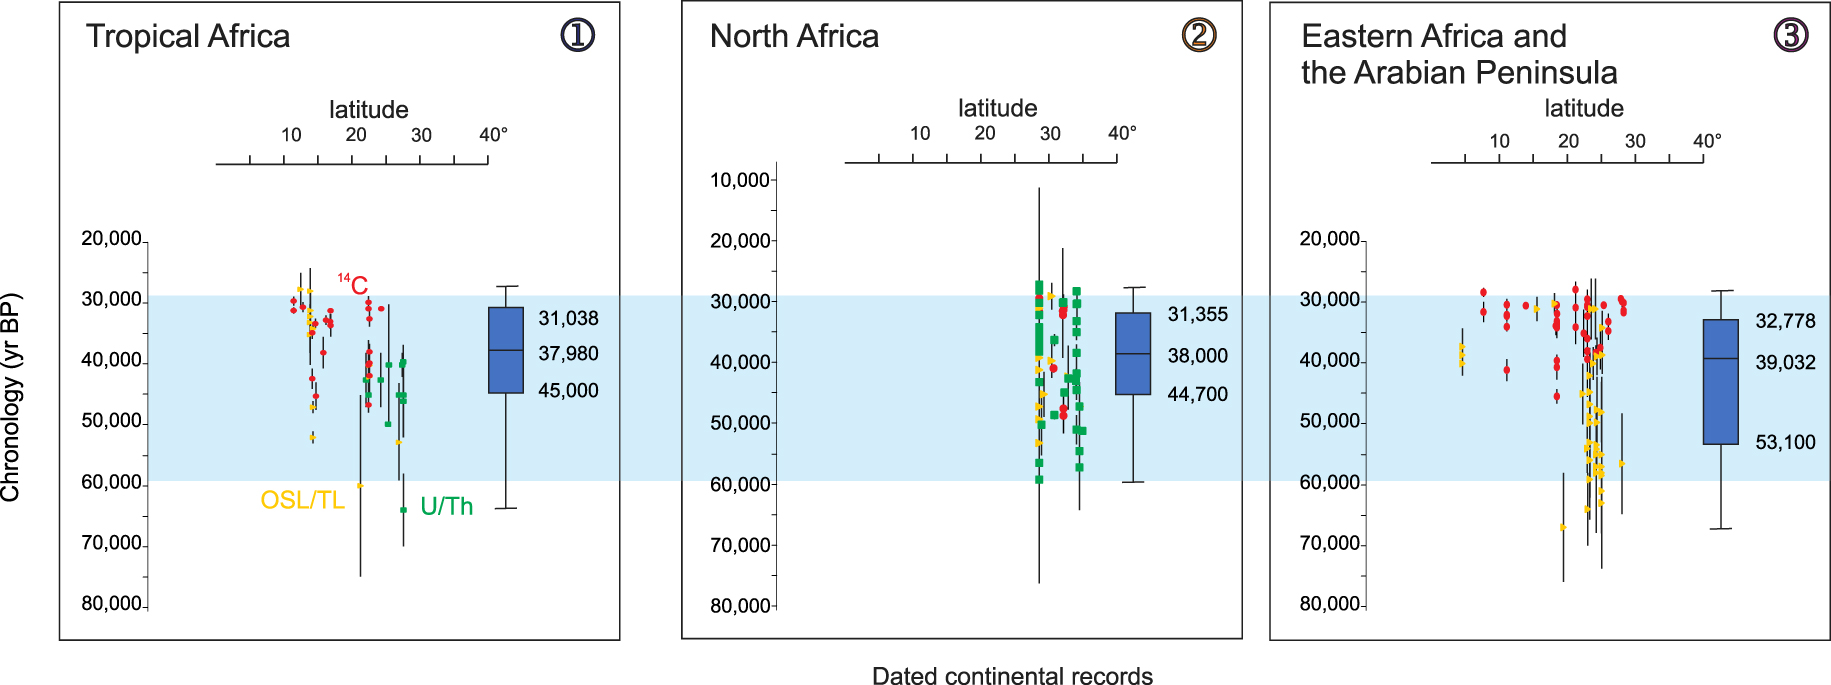
MIS 3 continental data in the three sectors shown in Figure 1. From left to right in each panel: the dated records and corresponding box plot calculated in the mean age (error bars excluded). The colours correspond to the different dating methods used: U/Th in green, OSL/TL in yellow and radiocarbon in red.
The age control is based on (i) 75 AMS and conventional radiocarbon dates and Electron Spin Resonance dates (ESR) on lake carbonates, remains of aquatic faunas and organic matter (ii) 61 luminescence (OSL, TL, IRSL) dates on quartz grains and (iii) 46 Uranium–Thorium (U–Th) dates on lake, spring and speleothem carbonates. All dates are abbreviated ka BP.
Raw 14C dates were converted to calendar ages using the CALIB 8.2 software [Stuiver and Reimer 1993]. Most of these dates originate from isolated samples or discontinuous archives, as is usual under predominantly arid climate conditions [Lézine et al. 2014]. The 14C dating of North Africa paleoarchives developed following the pioneering work of Gasse [1975] in Djibouti, Street [1979] in Ethiopia and Servant [1983] in Chad. There area total 42 14C dates in MIS 3 paleoarchives of north tropical Africa: Egypt (9), Chad (9), Ethiopia (4), Morocco (5), Libya (6), Djibouti (6) and Sudan (3). In Arabia, there are 33 published radiocarbon dates, 23 in Saudi Arabia, 8 in Oman, 1 in the United Arab Emirates and 1 in Yemen. In Africa as in Arabia, the 14C dates are mainly from lake (47) and river (18) sediments. There are only 5 14C dates obtained on palustrine sediments (including paleosoils) and 8 on speleothems. Hereafter in the text, dates were calibrated and abbreviated ka BP.
Regarding the luminescence dating method, only dates on fluvial or fluvio-lacustrine sediments were considered, as Aeolian (dune) sediments from arid periods do not concern our study. It is in the Arabian Peninsula that this method has been mostly used, since Goodall’s work [1995] at Sabkhat Matti (United Arab Emirates) (1 date), with 22 additional dates in the same sector, 16 in Oman, 5 in Saudi Arabia and 1 in Yemen. In Africa, after the early work of White et al. [1996] at Oued es Seffia (Tunisia) (1) the method has been developed in Morocco (18), Senegal (3), Sudan (4), Mali (4), Ethiopia (3), Egypt (2) and Libya (2).
The MIS 3 sediments dated by the U/Th method are only from Africa (Libya, Morocco, Tunisia, Egypt and Algeria; 46 measurements). The method was first applied to the Wadi Shati lacustrine deposits (Libya) by Gaven et al. [1981]. In addition, Rogerson et al. [2019] provided an extremely detailed chronology of MIS 3 from 35 U/Th measurements of speleothems in Susah Cave, northern Lybia. We also put in our database the ESR dates from the Kharga Oasis (Egypt) obtained on fresh-water gastropod shells [Blackwell et al. 2012].
In addition to the chronological control points listed above, we also collected 14C and U/Th measurements performed on African and Arabian groundwaters falling within MIS 3. However, the groundwater ages can be biased by the mixing of groundwaters from different layers in the stratified aquifers or the contributions of ancient carbon through the dissolution of carbonate minerals or the oxidation of old organic matter in the soil [Froehlich et al. 2007]. While there are several ways to estimate the initial 14C activity, those contamination processes remain a major source of uncertainty. Thus, these mesurements should be considered with caution.
Raw data were used to construct box-plot diagrams (Figure 4). We also combined the dated hydrological archives over 1000 yr-long time windows (Figure 7). We interpret the number of dates per interval as a proxy of climate humidity (see above).
3.3. IPSL climate model simulations
We have used the Institut Pierre-Simon Laplace (IPSL) Global Climate Model IPSLCM5A-LR [Dufresne et al. 2013]. This model represents the atmosphere, ocean, sea ice and land surface and their interactions, at a resolution of 3.5° × 2.75° in longitude × latitude for the atmosphere [LMDZ model, Hourdin et al. 2013] and land surface [Krinner et al. 2005] and of 2° for the ocean [for which the resolution is refined in key regions, Madec 2011]. The state of this system is computed as a function of the following external forcings: atmospheric greenhouse gases (CO2, CH4 and N2O), astronomical parameters (eccentricity, precession, obliquity) and boundary conditions: continental distribution, land ice distribution, bathymetry and topography. All simulations were run on supercomputers Mercure and Curie at TGCC (Très Grand Centre de Calcul du CEA). Table 1 summarises the forcing and boundary conditions for the simulations analysed in the present work. The pre-industrial simulation (PI) is described in Dufresne et al. [2013] and serves as a reference simulation for past, historical and future climate simulations.
Summary of the boundary conditions, forcings and characteristics of the IPSLCM5A-LR simulations analysed in the present work
| Simulation | PI | LGM | MIS 3—strong AMOC | MIS 3—weak AMOC | MIS 3 60 ka |
|---|---|---|---|---|---|
| Period | 1850 | 21 ky BP | 46 ky BP | 46 ky BP | 60 ky BP |
| Ice sheet | Present | PMIP3 | ICE_6G-C, 16 ka | ICE_6G-C, 16 ka | ICE_6G-C, 16 ka |
| Sea level anomaly w.r.t PI (m) | 0 | −120 | −70 | −70 | −20 |
| Eccentricity | 0.016715 | 0.018994 | 0.01384268 | 0.01384268 | 0.018469 |
| Obliquity (degree) | 23.441 | 22.949 | 24.3548 | 24.3548 | 23.2329 |
| Precession (ω—180°) | 102.7 | 114.42 | 101.337 | 101.337 | 266.65 |
| CO2 (ppm) | 284 | 185 | 205 | 205 | 200 |
| CH4 (ppb) | 791 | 350 | 500 | 500 | 426 |
| N2O (ppb) | 275 | 200 | 260 | 260 | 230 |
| Initial condition | Previous piControl simuation | Previous 1000+ year-long LGM simulation, with strong AMOC | Previous MIS 3 simulation under same boundary conditions and forcings | MIS 3 AMOC on simulaton, year 79 | Previous simulations under same boundary conditions and forcings |
| Run duration (years) | 250 | 350 | 200 | 250 | 210 |
| Years analysed (since start of run) | 150–249 | 300–349 | 10–189 | 230–249 | 110–209 |
| Run reference on supercomputer Joliot-Curie | piControl2 years 2000–2099 | lgm11f3 years 3350–3399 | MS3I46K2 years 2320–2509 | M3I46F02 years 2630–2649 | MIS4fB6 years 3100–3199 |
| AMOC (Sv) over the analysed period | 7–11.5 | 2.5–5 | 20–26 | 8.5–11 |
The AMOC value is defined as the maximum of the meridional overturning stream function along the 30° S vertical section. Minimum and maximum values of the AMOC are indicated.
The boundary conditions used for the Last Glacial Maximum run presented here are described in Kageyama et al. [2013a]. These are compliant with PMIP3 [Otto-Bliesner et al. 2009; Braconnot et al. 2012] recommendations, in particular in terms of ice sheets [Abe-Ouchi et al. 2015]. The run itself is a continuation of the LGM simulation presented in Kageyama et al. [2013a], Kageyamaet al. [2013b], in which a continuous 0.2 Sv fresh water flux is added to the North Atlantic and the Arctic Ocean so as to decrease the Atlantic Meridional Overturning Circulation to a more realistic LGM state (i.e. weak).
The boundary conditions used for the MIS 3 runs are described in Woillez et al. [2014] and Le Mézo et al. [2017]. They used smaller ice sheets than for the LGM (ICE_6G-C 16 ky BP ice sheet reconstructions from Peltier [2015] available at the time of running, which corresponded to the same global sea level as MIS 3), and intermediate atmospheric greenhouse values between those known for the pre-industrial and for the LGM, as documented by ice cores. All these runs use the same boundary conditions but differ in terms of the astronomical and greenhouse gas forcings. The “MIS 3—strong AMOC” and “MIS 3—weak AMOC” runs used 46 ka astronomical parameters and greenhouse gas concentrations while the “MIS 3 60 ka” uses 60 ka astronomical parameters and greenhouse gas concentrations [in Le Mézo et al. 2017, this “MIS 3 60 ka” simulation is named MIS4F, it actually sits at the boundary between MIS 3 and MIS 4]. The “MIS 3—weak AMOC” simulation is obtained by imposing a 0.2 Sv fresh water flux into the North Atlantic and Arctic Oceans to weaken the AMOC which is strong in the “MIS 3—strong AMOC” simulation. Indeed, this simulation was designed to study the sensitivity of the MIS 3 climate to the AMOC state. The AMOC ranges between 20 and 26 Sv in the MIS 3 strong AMOC run, while it stays between 8.5 and 11 Sv in the MIS 3 weak AMOC simulation (Table 1). We have included simulations with a weak and a strong AMOC because MIS 3 is characterised by AMOC instabilities which have been shown to have an impact on the African and Asian monsoons [Zhang et al. 2022]. Even though the resolution of most records does not allow to depict climate changes in relationship with the AMOC instabilities, their potential impact on the recorded continental climate cannot be ignored, hence the approach of considering both states in the experimental design of the numerical experiments.
4. Results
4.1. Tropical Africa and North Africa
4.1.1. Long paleoclimatic records
Marine cores and long continental series from West Africa between 5° and 20° 45 N reveal a coherent picture of higher humidity during MIS 3 than during MIS 4 and MIS 2. Such a higher humidity is responsible for the development of plant cover and is therefore readily seen in pollen and leaf wax records (Figure 2). Lézine and Casanova [1991] and Castañeda et al. [2009] observed a wet period between 51 (52) and 44 (45) ka with the expansion of C3 plants in the Sahel [Castañeda et al. 2009]. In addition, Kuechler et al. [2013] noted the expansion of C4 herbaceous plants in the Sahara, between 61 and 40 ka with a peak at 51 ka. High-resolution analyses show that the climate was highly variable with significant phases of climatic degradation punctuating MIS 3, coeval with the Heinrich events of northern latitudes [Tjallingii et al. 2008]. In the highlands of Cameroon [Lézine et al. 2019], forest trees around Lake Bambili increased as early as 53 ka and reached a maximum between 46 and 41 ka with a peak at 43.9 ka. The forest phase that extended up to 30.9 ka was punctuated by phases of disruptions at 48–46 ka (H 5), 41–39 ka (H 4), 37–34.5 ka and then 26–30 ka (H 3).
4.1.2. Continental records
Continental data from MIS 3 are extremely rare in tropical Africa west of Chad (Figure 1), which gave substance to the assumption by Causse et al. [1988] that there were no wet phases between MIS 5 and the Holocene throughout the Sahara. However, the unique 40 ± 20 a U/Th age initially measured by Gaven et al. [1981] at Wadi Shati, Southern Libya, was later confirmed by Armitage et al. [2007] who provided an OSL age of 52.8 ± 6.3 ka on lake deposits in the same area. In Senegal and Mali, OSL ages measured on fluvial deposits in the Falémé River [Lebrun et al. 2017; Mayor et al. 2018] and at Ounjoungou [Rasse et al. 2004] fall within the interval 38–25 ka and 52–33 ka, respectively. As expected, given the limitations of the method and the old origin of the data [Gasse 1975; Street 1979; Servant 1983; Pachur and Hoelzmann 1991; Szabo et al. 1995], the radiocarbon measurements do not extend beyond 47 ka. Two intervals around 40 and 31 ka show a high density of dates obtained in sediments from Chad, Egypt, Sudan and East Africa (Djibouti and Ethiopia). The oldest ages are recorded in Chad (45 ka) and Egypt (47 ka), while the oldest records from Eastern Africa only date from 37.6 ka (Ethiopia) and 41 ka (Djibouti). In Ethiopia, the 14C age provided by Street [1979] in the Ziway-Shala Basin (31.5 ka) is of the same order as those recently provided by Viehberg et al. [2018] at Lake Chew Bahir by both 14C (33.8 and 37.6 ka) and OSL methods (40, 38.6 and 37.2 ka). In North Africa (Libya and Morocco), radiocarbon dates clearly show two wellidentified periods: an early one in Libya at 48.5–47 ka [Gracea and Giraudi 2006], and another one common to both countries at 34.5–29.2 ka [Giraudi 2005; Gracea and Giraudi 2006; Mercier et al. 2009; Barich et al. 2010]. In addition, Occhietti et al. [1994] note an age of 40.7 ka in the Souss river valley (Morocco).
U/Th dating is mainly concentrated in North Africa from Morocco to Egypt and is distributed over the entire MIS 3. The periods where U/Th ages are most concentrated are between 45 and 38 ka [Egypt—Hamdan 2000; Sultan et al. 1997; Szabo et al. 1989; Churcher et al. 1999; Algeria—Fontes et al. 1992; Tunisia—Causse et al. 1989, 2003; Lybia—Macklin et al. 2002; Gaven et al. 1981; Morocco—Mercier et al. 2009] and around 30 ka [Morocco—Boudad et al. 2003; Mercier et al. 2009; Rousseau et al. 2008; Tunisia—Causse et al. 2003; Libya—Barich and Garcea 2008; Barich et al. 2010]. In addition to these fluviatile and lacustrine records, Rogerson et al. [2019] published a well-dated U/Th series on a speleothem from northern Libya showing three major periods of speleothem growth at 56, 51 and 36 ka.
OSL dating is divided into four major groups at 53–52 ka [Mali—Rasse et al. 2004; Libya—Armitage et al. 2007; Morocco—Mercier et al. 2009], at 47 ka [Mali—Rasse et al. 2004; Morocco—Mercier et al. 2009; Tunisia—White et al. 1996]; between 42 and 37 ka with a peak at 39 ka [Morocco—[Mercier et al. 2009; Weisrock et al. 2006; Thorp et al. 2002]; Libya—Macklin et al. 2002] then between 34 and 30 ka [Morocco—[Mercier et al. 2009; Weisrock et al. 2006]; Senegal—[Lebrun et al. 2017]; Mali—Rasse et al. 2004].
4.2. Eastern Africa, the Arabian Peninsula and the Indian Ocean
4.2.1. Long paleoclimatic records
In Eastern Africa and the Arabian Peninsula, the Ca/Ti ratio at Lake Tana [Lamb et al. 2018] clearly shows two phases of high lake level at 54 ka and then between 42 and 31 ka, which is consistent with the periods of strong Nile River discharges recorded in core MS27TP between 60 and 50 ka and then between 38 and 30 ka [Revel et al. 2010]. A wet period between 53.4 and 40.4 ka also isat the origin of the formation of the Moomi stalagmite on Socotra Island [Burns et al. 2003, 2004]. This early humid phase is also recorded in core RC09-166 showing two wet phases in the Gulf of Aden, between 57.7 and 50.8 ka, then around 41.9 ka [Tierney et al. 2017].
In detail, high-resolution studies of the Arabian Sea [KL70—Leuschner and Sirocko 2000; Moomi Cave—Burns et al. 2003, 2004] show that environmental variability during MIS 3 is consistent with the Greenland δ18O ice record. In these high-resolution records, Dansgaard–Oeschger cycles and Heinrich Events were identified and H 4, in particular, revealed a strong peak in wind activity in the Red Sea [Rohling et al. 2008].
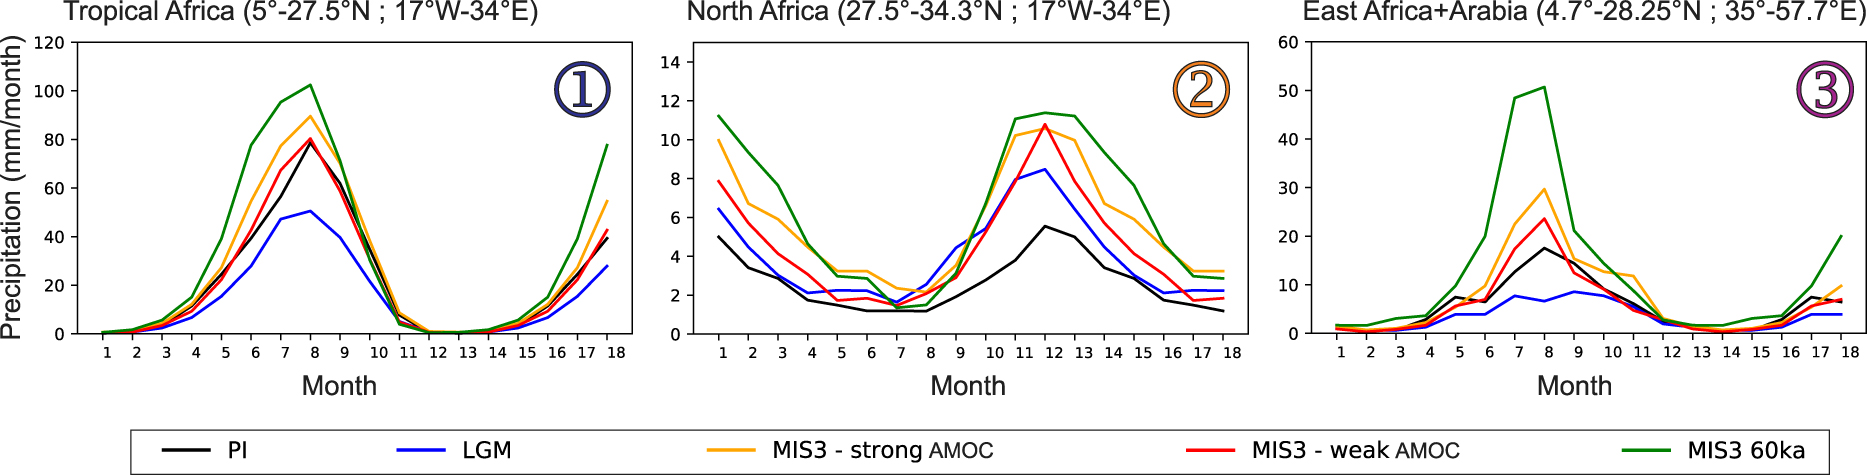
Mean seasonal cycle of continental precipitation (mm/month) over regions 1, 2 and 3, as simulated by the IPSLCM5A-LR climate model for the five sets of forcings and boundary conditions summarised in Table 1. The results for months 13 to 18 replicate those for months 1 to 6, in order to better show the seasonal cycle for region 2, which peaks during the winter season.
4.2.2. Continental records
Regarding continental data, early studies in Arabia, since McClure [1976] [in e.g., Sanlaville 1992, and reference therein], provided radiocarbon dates for MIS 3 lacustrine deposits distributed across the Peninsula between 18 and 31° N and ranging from 40.5 ka at Mundafan [McClure 1976] to 27.7 ka at Harrat Nawasif [Zötl 1984]. The 14C ages obtained on speleothems from Oman by Clark and Fontes [1990] also fall within this interval and range from 39.2 to 29.3 ka. However, most of these 14C dates have probably been subject to contamination processes by younger 14C that would have resulted in considerable age rejuvenation. At Mundafan (Saudi Arabia), Rosenberg et al. [2011] obtained OSL dates that challenge the older 14C measurements from McClure [1976, 1978] and place the Pleistocene Lake of Mundafan during MIS 5.
OSL ages on fluvio-lacustrine sediments indicate humid environmental conditions between 61–55 ka around the Aqaba paleolake (UAE) [Parton et al. 2013]: and between 59–42 ka at Wadi Mistal (Oman) [Hoffmann et al. 2015]. However, younger ages spanning the radiocarbon period are also recorded in the easternmost sector of the Arabian Peninsula in Al Ain, Liwa [Glennie and Singhvi 2002] (31 ka) and Jebel Faya [Bretzke et al. 2013] (34 ka) as well as in southern Oman, in the Dhofar region [Rose et al. 2019] (30 ka) and in Yemen at Wadi Dawan [Amirkhanov 2020] (33 ka).
4.3. Model simulations
The results of the IPSLCM5A-LR climate model simulations show that for all the conditions summarised in Table 1, the seasonal cycles of continental precipitation are characterised by a summer, monsoon-related peak for sectors 1 and 3, which contrasts with no precipitation in December and January, while for sector 2, the cycle is dominated by a wet winter and a dry summer, which still receives some rain.
For all sectors, the amplitude of the wet season is strongly sensitive to the boundary conditions and forcings for the different periods. The driest period is the LGM for all three sectors. In Tropical Africa (sector 1) the precipitation values for the MIS 3—weak AMOC run are close to the PI values, peaking at about 80 mm/month, whereas the MIS 3—strong AMOC run and the MIS 3 60 ka run are much larger than the PI values, in particular during spring and summer. The peak value for the MIS 3 60 ka run reaches more than 100 mm/month. The largest differences with the PI control simulations are for the month of June, for which the precipitation doubles in MIS 3 60 ka compared to PI (Figure 5). This corresponds to a northward extension of the monsoon region, in particular for the MIS 3 strong AMOC and MIS 3 60 ka simulations (Figure 6).
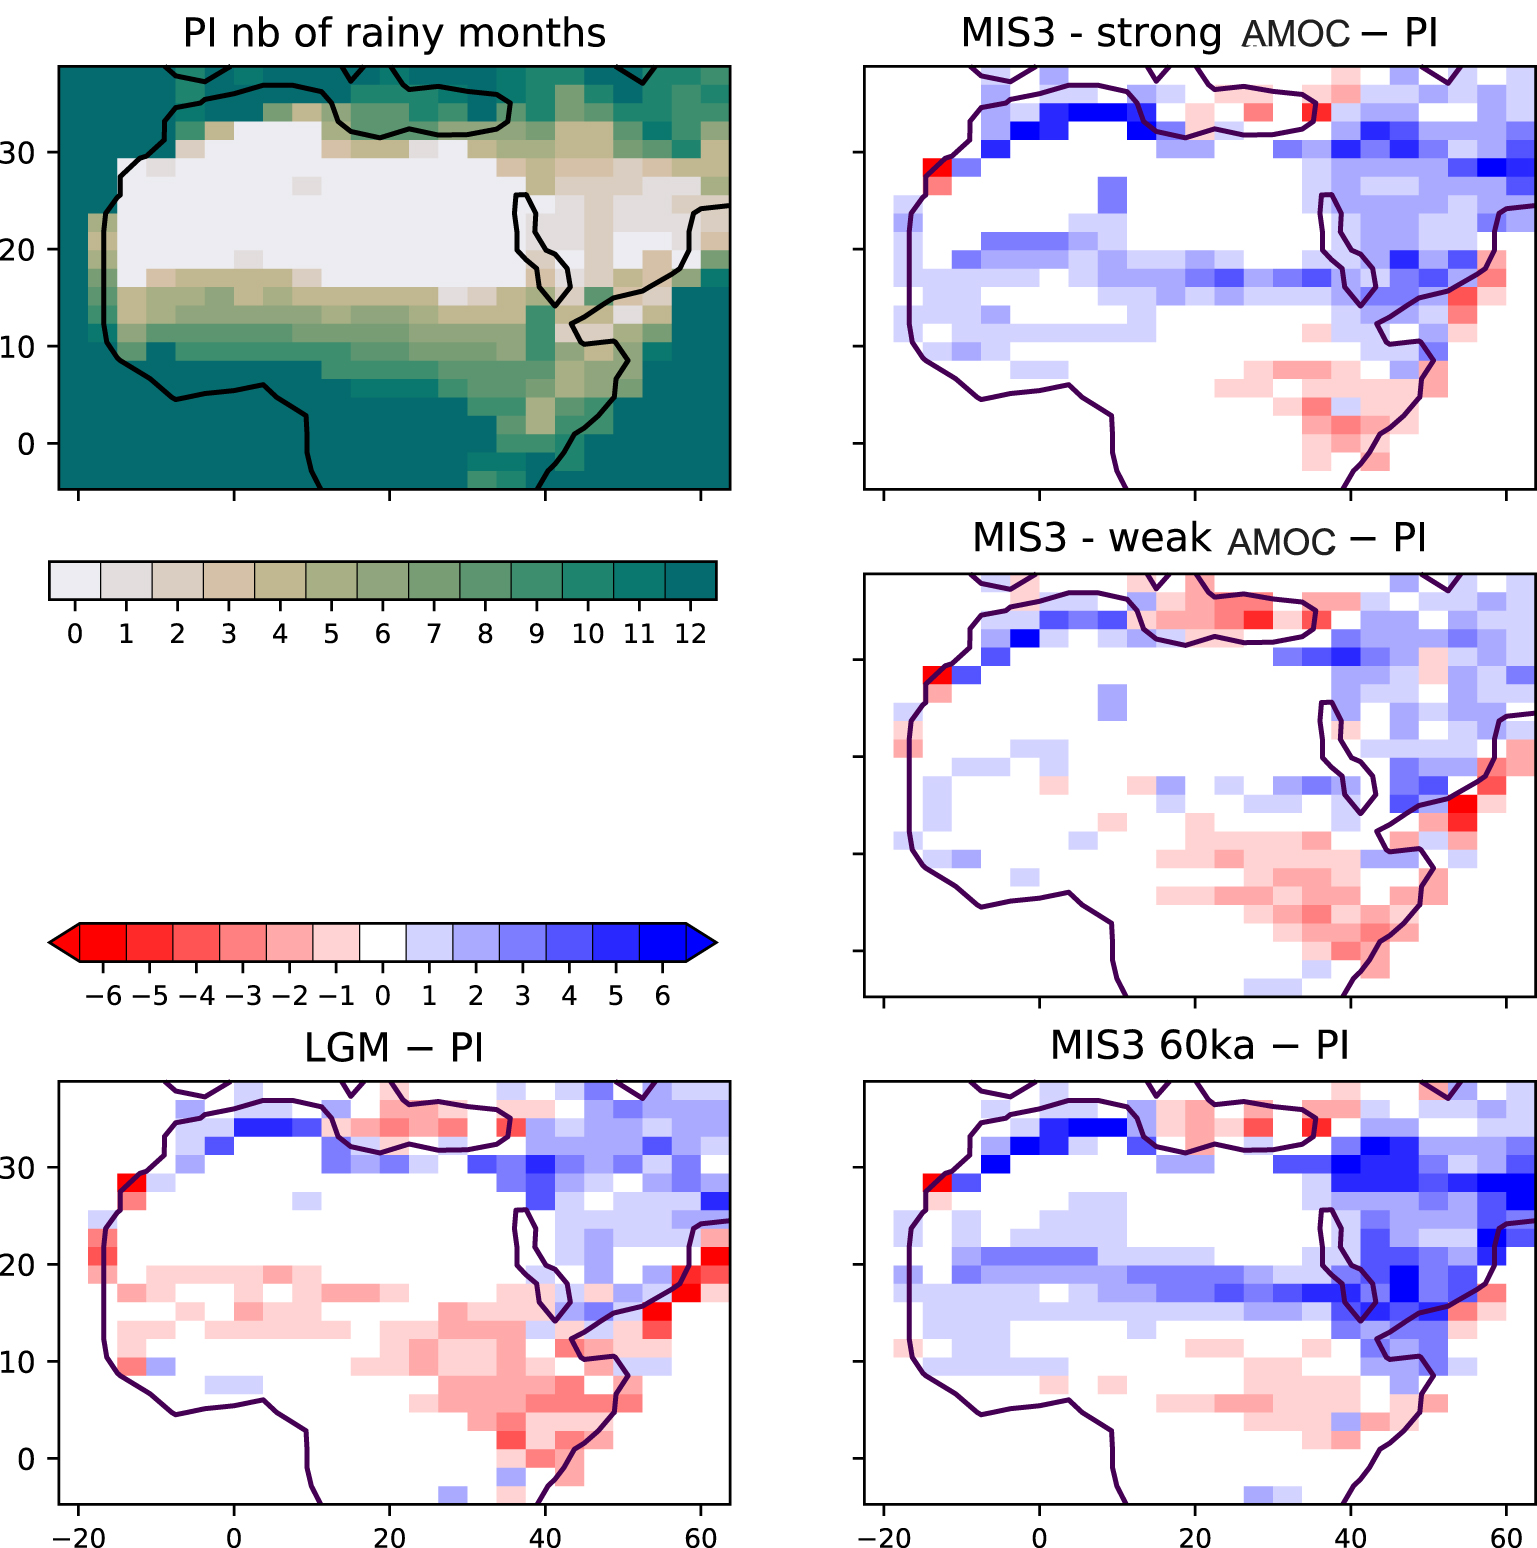
Number of months, in the average seasonal cycle of continental precipitation, with precipitation larger than 3 mm/month. The results are shown in absolute value for the PI simulation (top left) and as anomalies with respect to this reference for all other simulations.
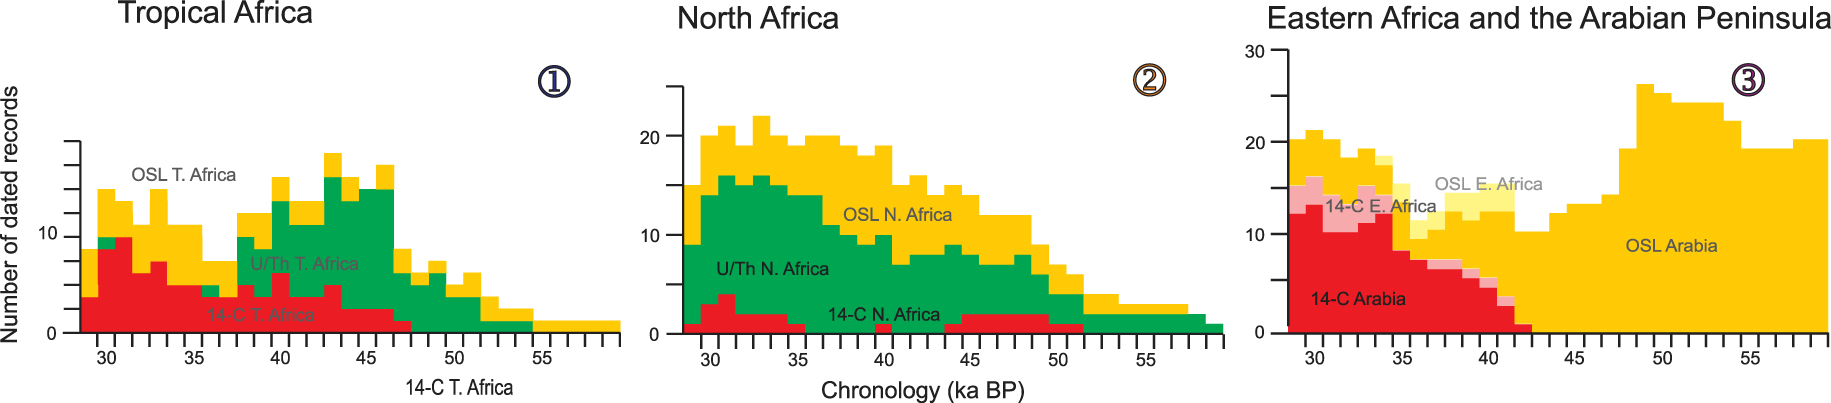
Number of dated records (vertical axis) of humidity during MIS 3 by 1000-year time steps. Ages are considered with their error bars (horizontal axis) in the three sectors shown in Figure 1. Underground waters are not shown in this figure.
For East Africa and the Arabian Peninsula (sector 3) all MIS 3 simulations show wetter conditions than for PI, from June to August for the MIS 3 strong and weak AMOC runs, and all year round for the MIS 3 60 ka run. The MIS 3 strong AMOC simulation shows a lengthening of the precipitation season until November. The MIS 3 60 ka results are much wetter than for all other simulations, with a maximum at 50 mm/month for August, w.r.t. between 20 and 30 mm/month for the other MIS simulations, less than 20 mm/month for the PI run and less than 10 mm/month for the LGM run. These wetter conditions in the MIS 3 simulations are due to a northward extension of the monsoon region on both sides of the Red Sea and the southern part of the Arabian Peninsula, as well as a southward extension of the rainbelt extending eastward from the Mediterranean Sea, which results in wetter conditions in the northern part of the Arabian Peninsula (Figure 6). This corresponds to autumn and winter precipitation (not shown).
Over North Africa (sector 2), the precipitation seasonal cycle is dominated by fall, winter and spring rainfall (Figure 5). The maxima are reached in December, with values of 8 mm/month for the PI run, between 10 and 11 mm/month for MIS 3 strong and weak AMOC and between 11 and 12 mm/month for MIS 3 60 ka. In addition to showing the strongest winter values, MIS 3 60 ka also displays the longest rainy season in spring. The spring season is the one for which there are most differences between the simulations, with low values for LGM and PI, and higher and higher values for MIS 3 weak AMOC, MIS 3 strong AMOC, and maximum values for MIS 3 60 ka. This longer duration of the rainy season is also illustrated in Figure 6.
5. Discussion
Despite the scattered nature of the records and the large chronological uncertainties, continental sediment dating and long paleoclimate series allow us to identify several key aspects:
(1) Numerous indicators of wetness (lakes, playas, rivers…) are recorded in Africa north of the Equator and in the Arabian Peninsula during MIS 3.
(2) A clearly differentiated distribution of these humid indicators is observed between sector 3 (Eastern Africa and the Arabian Peninsula), on the one hand and the two other sectors of Tropical Africa (sector 1) and North Africa (sector 2), on the other hand (Figure 7).
- In sector 3 the onset of humid conditions during MIS 3 occurred earlier than in sectors 1 and 2, starting at 64 ka in Eastern Arabia and about 10 ka later in tropical and North Africa. Wet conditions were also probably more intense during the first half of MIS 3, as shown by the number of dated records. These wet conditions lasted until the end of MIS 3. These results are consistent with previous observations from Preusser et al. [2002] who noticed the absence of aeolian remobilisation in the “Wahiba sands” area (Oman) between 64 and 22 ka reflecting a long, wet period. At Lake Chew Bahir (Ethiopia), Viehberg et al. [2018] also noticed a long period of climatic stability between 58 and 32 ka allowing the maintenance of a lake despite intense evaporation. Although our study shows that humid indicators were continuously present throughout MIS 3, this period was climatically far from stable. Two periods of marked humidity emerge: (1) an early wet phase is attested by the peak of OSL-dated records between 59 and 48 ka; (2) a second wet phase is revealed by the distribution of 14C records from both Eastern Africa and the Arabian Peninsula between 42 and 29 ka with a maxium between 39 and 34 ka. This second wet phase is confirmed by 14C ages on groundwaters at Liwa (South-Eastern Arabian Peninsula) starting from 43 ka and peaking ca. 30 ka [Wood and Imes 1995]. These results are also consistent with the Lake Tana (Ethiopia) and the eastern Mediterranean records [Lamb et al. 2018; Revel et al. 2010; Langgut et al. 2018] which reveal two periods of enhanced humidity in eastern Africa and the Levant at 54 ka (56–44) then between 42 and 30 ka, bracketing a dry period peaking ca. 44–42 ka. Marine cores from the Arabian Sea and the Red Sea (KL11 and 70KL), as well as the Socotra stalagmite show that climatic variability also occurred at a shorter timescale, resulting in a succession of wet and arid periods that seem to mimic Dansgaard/Oeschger events at high latitudes although chronological uncertainties do not currently allow to correlate them unambiguously [Svensson et al. 2008].
- In Tropical Africa and North Africa (sectors 1 and 2) there is a near absence of dated wet records prior to 53 ka (Figure 7).
- In North Africa, the number of OSL and U/Th dates increases steadily after 52 ka, reaching a peak between 42 and 37 ka (OSL) and 36–32 ka (U/Th). Radiocarbon dates, in limited number, show two humid periods between 51 and 44 ka and then between 35 and 29 ka. These results are consistent with U/Th measurements from Susah Cave in northern Libya [Rogerson et al. 2019]. This record shows that humid conditions started from 53 ka and that the major phase of speleothem growth was dated from 36 ka that closely corresponds to the last period of aquifer recharge in northern Africa [Edmunds and Wright 1979; Guendouz et al. 1997; Abouelmagd et al. 2014].
- In Tropical Africa, two peaks of humidity are distinctly identified: the first peak is revealed by U/Th and OSL-dated continental deposits at Wadi Shati and in Egypt/Sudan between 47 and 37 ka, the second peak is observed in the distribution of OSL-dated deposits in Senegal and Mali between 36 and 30 ka, consistent with the 14C records in both Chad and Egypt/Sudan. These results are consistent with groundwater records, which show two major phases of aquifer recharge between 55 and 42 ka in Eastern Egypt, [Sultan et al. 1997; Osmond et al. 1999] and in the Taoudenni basin [Huneau et al. 2011] then between 39 and 29 ka in Niger [Dodo and Zuppi 1999], Burkina Faso [Huneau et al. 2011], Nigeria [Edmunds et al. 1998] and Egypt [Patterson et al. 2005; Froehlich et al. 2007]. The long sedimentary series from the Sahara and Sahel reveal an increase in humidity and vegetation cover between about 55-53 and 42 ka, coeval with a reduced Aeolian circulation over the Sahara [Core MD03 2705—Matsuzaki et al. 2011]. Near the equator, this wet period lasted until 30 ka, albeit to a lesser degree. There were several variations responsible for the degradation of the forest cover. They are coeval with Heinrich events in northern latitudes (H 5, 4 and 3). High amplitude climate variability in the eastern Atlantic domain during MIS 3 is moreover confirmed by Tjallingii et al. [2008].
(3) Modelling results are broadly consistent with the data showing a wet MIS 3 in all three sectors, despite the fact that this period was globally colder and drier than the pre-industrial period. In fact, favourable obliquity (for MIS 3 strong and weak AMOC runs) or precession parameter (MIS 3 60 ka) outweigh the impact of these globally colder and drier environment and favour strong monsoons both over West Africa and East Africa and the Arabian Peninsula. This confirms results obtained by other models for periods close to those analysed here [e.g. Jennings et al. 2015; Singarayer and Burrough 2015]. The impact of the AMOC strength is clearly visible for both regions, a strong AMOC being favourable to stronger monsoon. This was already shown in several earlier works performed with different types of climate models, e.g. Tjallingii et al. [2008] with the CLIMBER Earth System Model of Intermediate Complexity (EMICs), or in the review by Kageyama et al. [2013a], Kageyamaet al. [2013b], based on Global General Circulation models and EMICs. Compared to these works, the simulations presented here, performed with a GCM for different periods within MIS 3, are either more detailed [compared to Tjallingii et al. 2008] or using a more realistic set up for MIS 3 [the experiments analysed by Kageyama et al. 2013a; Kageyamaet al. 2013b used the Last Glacial Maximum as a reference]. Singarayer and Burrough [2015] insist on multiple factors forcing the response of the African monsoon. This is also the case here, with the combined effects of the orbital parameters, ice sheet state and AMOC state which result in the MIS 3 simulation with a weak AMOC showing wetter conditions than for the pre-industrial, for instance. The conditions at the start of MIS 3 are particularly favourable to both monsoons too, in particular for East Africa and the Arabian Peninsula, as found by the previous studies cited above. This brings an explanation for the record of wet conditions for this period compiled here. For Tropical Africa, the model simulates slightly wetter conditions for the beginning of MIS 3 than for the middle of this period, but the differences between the periods are not as large as for East Africa and Arabia. In North Africa, the reasons for MIS 3 being wet are associated with a strengthening of the winter rain and an extension of the rainy season over spring for the wettest periods (MIS 3 strong AMOC and beginning of MIS 3). This could be due to a southern position of the mid-latitude jet stream, which would have to be confirmed by further analyses. All in all, these simulations offer possible explanations for the recorded wet conditions over tropical Africa, northern Africa, East Africa and the Arabian Peninsula during MIS 3. Additional feedbacks (e.g. vegetation and lake cover) could enhance the simulated response to astronomical parameters, greenhouse gas and ice sheets depicted by the simulations shown here.
6. Conclusion
Our results show that, contrary to what had been concluded in previous studies, MIS 3 was a relatively wet period in tropical Africa, North Africa and the Arabian Peninsula compared to MIS 4 and MIS 2. This brings important environmental constraints when trying to understand the migratory waves of Homo sapiens from Africa to the Arabian Peninsula and the Levant. Our results show in particular that there are significant differences between regions, with a clear East–West contrast. The most striking breakthrough of our study is to show that eastern tropical Africa and the Arabian Peninsula were particularly humid from the end of MIS 4 already, thus well ahead of the humidification that took place over western Africa.
Numerical simulations are in agreement with the data and make it possible to specify the processes at work. From a hydrological point of view, MIS 3 in the Arabian Peninsula is characterised by a lengthening of the rainy season due to the combined effects of the Indian monsoon and Mediterranean depressions. These evolutions are, in the first place, linked to the orbital forcing. Model results suggest that precession had a major impact on monsoon intensity through its control of the northern hemisphere, low latitude summer insolation. But the simulations also suggest that obliquity may have played an important role as well, through its impact on the AMOC. The available data do not currently allow us to test this hypothesis but the question of AMOC impact on the precipitation dynamics during MIS 3 will have to be addressed in the years to come.
Declaration of interests
The authors do not work for, advise, own shares in, or receive funds from any organization that could benefit from this article, and have declared no affiliations other than their research organizations.
Acknowledgements
We would like to thank the editors of this special volume in honour of Professor J. Dercourt for inviting us to contribute. The computing time was provided by GENCI (Grand Equipement National de Calcul Intensif) and the simulations were performed using Curie at TGCC (Très Grand Centre de Calcul du CEA). M.-N. Woillez and P. Le Mézo are thanked for taking part in this endeavour, as part of their post-doctoral and PhD projects, respectively. The MIS 3 60 ka simulation was initially run for the European Research Council TracSymbols project led by C. Henshilwood and F. D’Errico (Grant no. 249587).