


 CC-BY 4.0
1. Introduction
Megacities present numerous socio-environmental problems associated with the patterns of development and transformation of space. One of the main concerns from scientists has been identifying, monitoring, and understanding the impacts of mitigation and/or environmental restoration processes, and possible future changes in climate and land in urban areas and their peripheries. In studies of climate and anthropogenic impacts on the environment, the concept of a critical zone and its monitoring are important instruments for understanding the growing influence of humans.
The “Critical Zone” (CZ), i.e., the zone between the inner atmosphere and the rocks through which the groundwater circulates, supports all the complex interactions between rocks, soil, water, air and organisms that sustain life on Earth (Banwart et al., 2012). The concept encompasses its physical boundaries, the knowledge developed about its functioning, and its recognition as a system vulnerable to human activities (Lee et al., 2023). Nevertheless, most studies still focus on low-impact environments. Urbanization, although a major driver of land-use and socioeconomic change, remains weakly integrated into Critical Zone research (Yu et al., 2024). This limitation restricts a more comprehensive understanding of how urban transformations affect the structure and functioning of this system.
Urbanization drives changes in hydrological and biogeochemical cycles (ibid.). At the same time, fluvial corridors connect terrestrial and aquatic environments and play a central role in mass and energy exchanges. These environments include the active river channel, the hyporheic zone, and the floodplain. Although geology and climate are recognized as primary controls, the physical effects of human interventions remain underrepresented in conceptual models of the Critical Zone (Wymore et al., 2023).
The challenge of crossing disciplines and scales of time and space to understand the CZ has motivated scientists to establish networks of Critical Zone Observatories (CZO) to investigate CZ processes in different environments, covering gradients of various environmental variables (e.g., climate, topography, lithology, land use, biology and time). CZOs became an international initiative for developing observatories along global gradients, through collaborative and multidisciplinary research, aiming to understand the chemical, physical, geological and biological processes that shape the Earth’s surface and sustain terrestrial life.
Multidisciplinary investigations explore specific topics that contribute to important questions of the Critical Zone Science (CZS): (1) What controls the properties and processes of the CZ? (2) What will be CZ’s response to climate change and land use? (3) How can advancing knowledge of CZ be used to increase the resilience and sustainability of ecosystems? These wide-ranging questions allow for diverse approaches to quantify the role of environmental forces in the biogeochemical processes that govern the long-term sustainability of soil and water resources, and their responses to anthropogenic forces.
Soil’s biogeochemical processes have a wide influence on the function of the CZ, structured by flows of energy and matter. Although (bio)geochemical reactions occur on a molecular scale, they have implications on the CZ’s ability to sustain human life (Perdrial et al., 2015). In soil, water meets various exposed surfaces, which affects the transfer of solutes in the heterogeneous environment, driving different biogeochemical reactions which in turn control the quality of the surface and groundwater. Geochemical gradients develop due to spatial and temporal heterogeneity and are therefore affected by groundwater and precipitation events.
The redox processes control the fate and toxicity of the elements in the CZ, as well as of numerous organic pollutants. The dissolved oxygen present in the upper parts of the soil quickly depletes in the saturated zone. As a result, redox gradients develop. In this environment, minerals that carry iron are of particular interest, because they are abundant in soil and because they contain iron in different redox states, thus functioning as donors and recipients of electrons (Liu, Roberts, et al., 2012). In addition, natural organic matter plays a key role in electron transfer with mineral surfaces, as well as the various microbial communities found in soils. More broadly, the processes of transfer of electrons in soil can impact the redox state and the bioavailability of nutrients such as N, S, Fe or Mn.
In the CZ, iron occurs in two main redox states: oxidized, being ferric iron Fe (III), and reduced, ferrous iron Fe (II) (Kappler, Bryce, et al., 2021). Under aerobic conditions, Fe (II) is rapidly oxidized to Fe (III), forming insoluble oxides and hydroxides, reducing the bioavailability of iron in the aqueous phase and limiting biological production in ecosystems (Kendall et al., 2012). Under anaerobic conditions, Fe (II) is used as an electron source by phototrophic bacteria to fix CO2 (Weber et al., 2006). Magnetic phases such as ferrihydrite also help to stabilize organic matter (OM) against microbial degradation, influencing soil carbon storage (Eusterhues et al., 2011). On the other hand, alteration processes of magnetic minerals can also degrade OM, releasing CO2 and CH4 into the atmosphere (H. Dong et al., 2023). Therefore, because they are coupled to the cycle of other elements, such as carbon (C), transformations of iron (hydr)oxides can be an indicator of biogeochemical changes in terrestrial ecosystems (Raiswell and Canfield, 2012).
In contaminated soils, Fe- and Mn-bearing minerals, as well as organic matter, are key compounds because they interact with each other and constitute important electron shuttles. Their solubility and structure control the mobility of many essential and toxic elements. For example, Mn (IV) oxides, which are among the strongest oxidants in nature, control the redox state of elements such as Cr, and are frequently associated with the release of toxic Cr (VI) in natural systems. Mixed-valence Fe minerals carrying both Fe (II) and Fe (III) (e.g., green rusts and magnetite) are of major interest, particularly in redox transition zones within the CZ, and are reported in numerous studies to act as strong reducing agents for nitrite, chlorinated and nitroaromatic compounds, as well as elements such as Cr (VI), Se (VI) or U (VI) (Davranche et al., 2020).
The formation of iron oxides and hydroxides in soils results from biogeochemical interactions between biotic (microorganisms and vegetation) and abiotic (minerals, pH, O2 and water) factors (Jordanova, 2017). In addition to environmental conditions, soil magnetic mineralogy also strongly depends on the origin and, consequently, on the initial mineralogical composition of the particles (Maxbauer et al., 2016).
Magnetic particles present in soils can be of lithogenic, pedogenic, biogenic, or even anthropogenic origin. Lithogenic minerals are inherited from the parent rock and usually have larger grain sizes. Due to their smaller surface area and greater surface stability, primary iron oxides are less influenced by chemical weathering. Pedogenic magnetic minerals are formed by the transformations of mineral phases during soil development (Jordanova, 2017). Iron-reducing bacteria are capable of precipitating magnetic minerals, degrading organic matter (Lovley et al., 1987) or transferring electrons through the process known as Direct Interspecies Electron Transfer (DIET) (Xiao et al., 2018). Like pedogenic particles, particles originated by microbial processes are also nanometric (5–15 nm in diameter) (Cornell and Schwertmann, 2003). Magnetic particles formed because of human activities, such as combustion processes, can be dispersed as atmospheric dust and deposited in the most superficial layers of the soil. They are micrometric particles (2.5–10.0 μm), reactive and with significant potential for adsorption of heavy metals, which can cause serious impacts on human health and significant contamination of soil and water (Cornell and Schwertmann, 2003; Grobéty et al., 2010).
Environmental magnetism plays an important role in the study of variations in soil magnetic properties, due to the sensitivity of iron oxides and hydroxides to changes in environmental conditions (Liu, Roberts, et al., 2012). The joint application of environmental magnetism parameters aims to identify the mineralogical composition, concentration, and granulometry of magnetic minerals in each environment (Evans and Heller, 2003). These parameters have been used in studies of soil pollution (Barbosa et al., 2019), biogeochemical processes in contaminated areas (Moraes et al., 2022; Ustra et al., 2021), and correlation between magnetic mineral content and environmental parameters, such as precipitation (Balsam et al., 2011). However, few studies have taken an integrated approach in the context of critical zone science. A multi-technique and transdisciplinary analysis allow a deeper understanding, or new insights into the processes related to the iron biogeochemical cycle.
In this paper, we show the results of the environmental magnetism study of two land impacted sites of the São Paulo CZO seed site. Inspired by existing CZO networks, this project aims to establish a stable research infrastructure for long-term monitoring to study anthropogenic impacts on CZ. We hope environmental magnetism techniques can help to understand biotic/abiotic processes and redox changes in degraded urban sediments.
2. São Paulo CZO seed site
The São Paulo CZO aims to understand how soil, water and vegetation resources in a tropical megacity are responding to natural and anthropogenic drivers. We explore the hypothesis of biotic and abiotic redox controls the fate of pollutants and organic matter in CZ. Redox reactions nourish iron-bearing minerals transformations, affecting carbon, sulfur, and nitrogen cycles. Even though there is good knowledge about soil reactions, there is great concern about how these reactions will be impacted by climate and anthropogenic perturbations, over long-time scales. In degraded land environments, Fe- and Mn-bearing minerals and organic matter (OM) interact constitute important electron shuttles. In fact, the diversity of microbial metabolisms in soil originates from the energy source these organisms need, as well as from the redox conditions.
CZOs can better identify and monitor biogeochemical processes in an urban environment, where land is severely degraded by the presence of different contaminants (organic and inorganic). A better understanding of biogeochemical processes can be incorporated into quantitative models and predict soil responses to land degradation and to climate changes in urban areas in tropical climate. That is, to “earthcast” the CZ in the urban environment.
The CZO is structured in the disciplinary axes of geophysics, biogeochemistry and hydrogeology. The database of the implementation phase is composed of: geophysical imaging, soil geochemistry and magnetic properties, groundwater geochemistry, atmospheric and biological. We hope the observations enable the conception of soil response models to anthropogenic impacts and may lead to earth cast the CZ at a subtropical megacity.
3. Methods
3.1. Site introduction
This CZO is composed of three sites: Campus Capital USP Leste and Parque Ecológico Tietê (PET) as the impacted environment and Parque Natural Municipal Fazenda do Carmo (PNMFC) as the natural environment.
USP Leste/PET location is under the Tietê River influence area, where historical data indicate intense anthropic activity. The studied site is situated at a floodplain of the Tietê River, in São Paulo—SP, Brazil (Figure 1). The area contains a series of anthropogenic deposits (∼4 m) that overlies Quaternary fluvial sediments (∼6 m) and Neogene sandstones. The entire site was formerly used as a large drying pool for dredged sediments when a nearby channel was opened. The sediments settled in the pool kept under anoxic conditions the organic-rich sediments of the fluvial plain inducing methanogenic processes and methane trapping within sandy lenses at different depths of the section (Mendonça et al., 2015). PNMFC (not shown here) on the other hand, is in the same hydrographic context, but the area is a Mata Atlântica biome preservation unity.
São Paulo CZO seed site localization. EACH (USP Leste campus) is indicated by the white polygon. Red, yellow, and green pins indicate the location of the drill cores.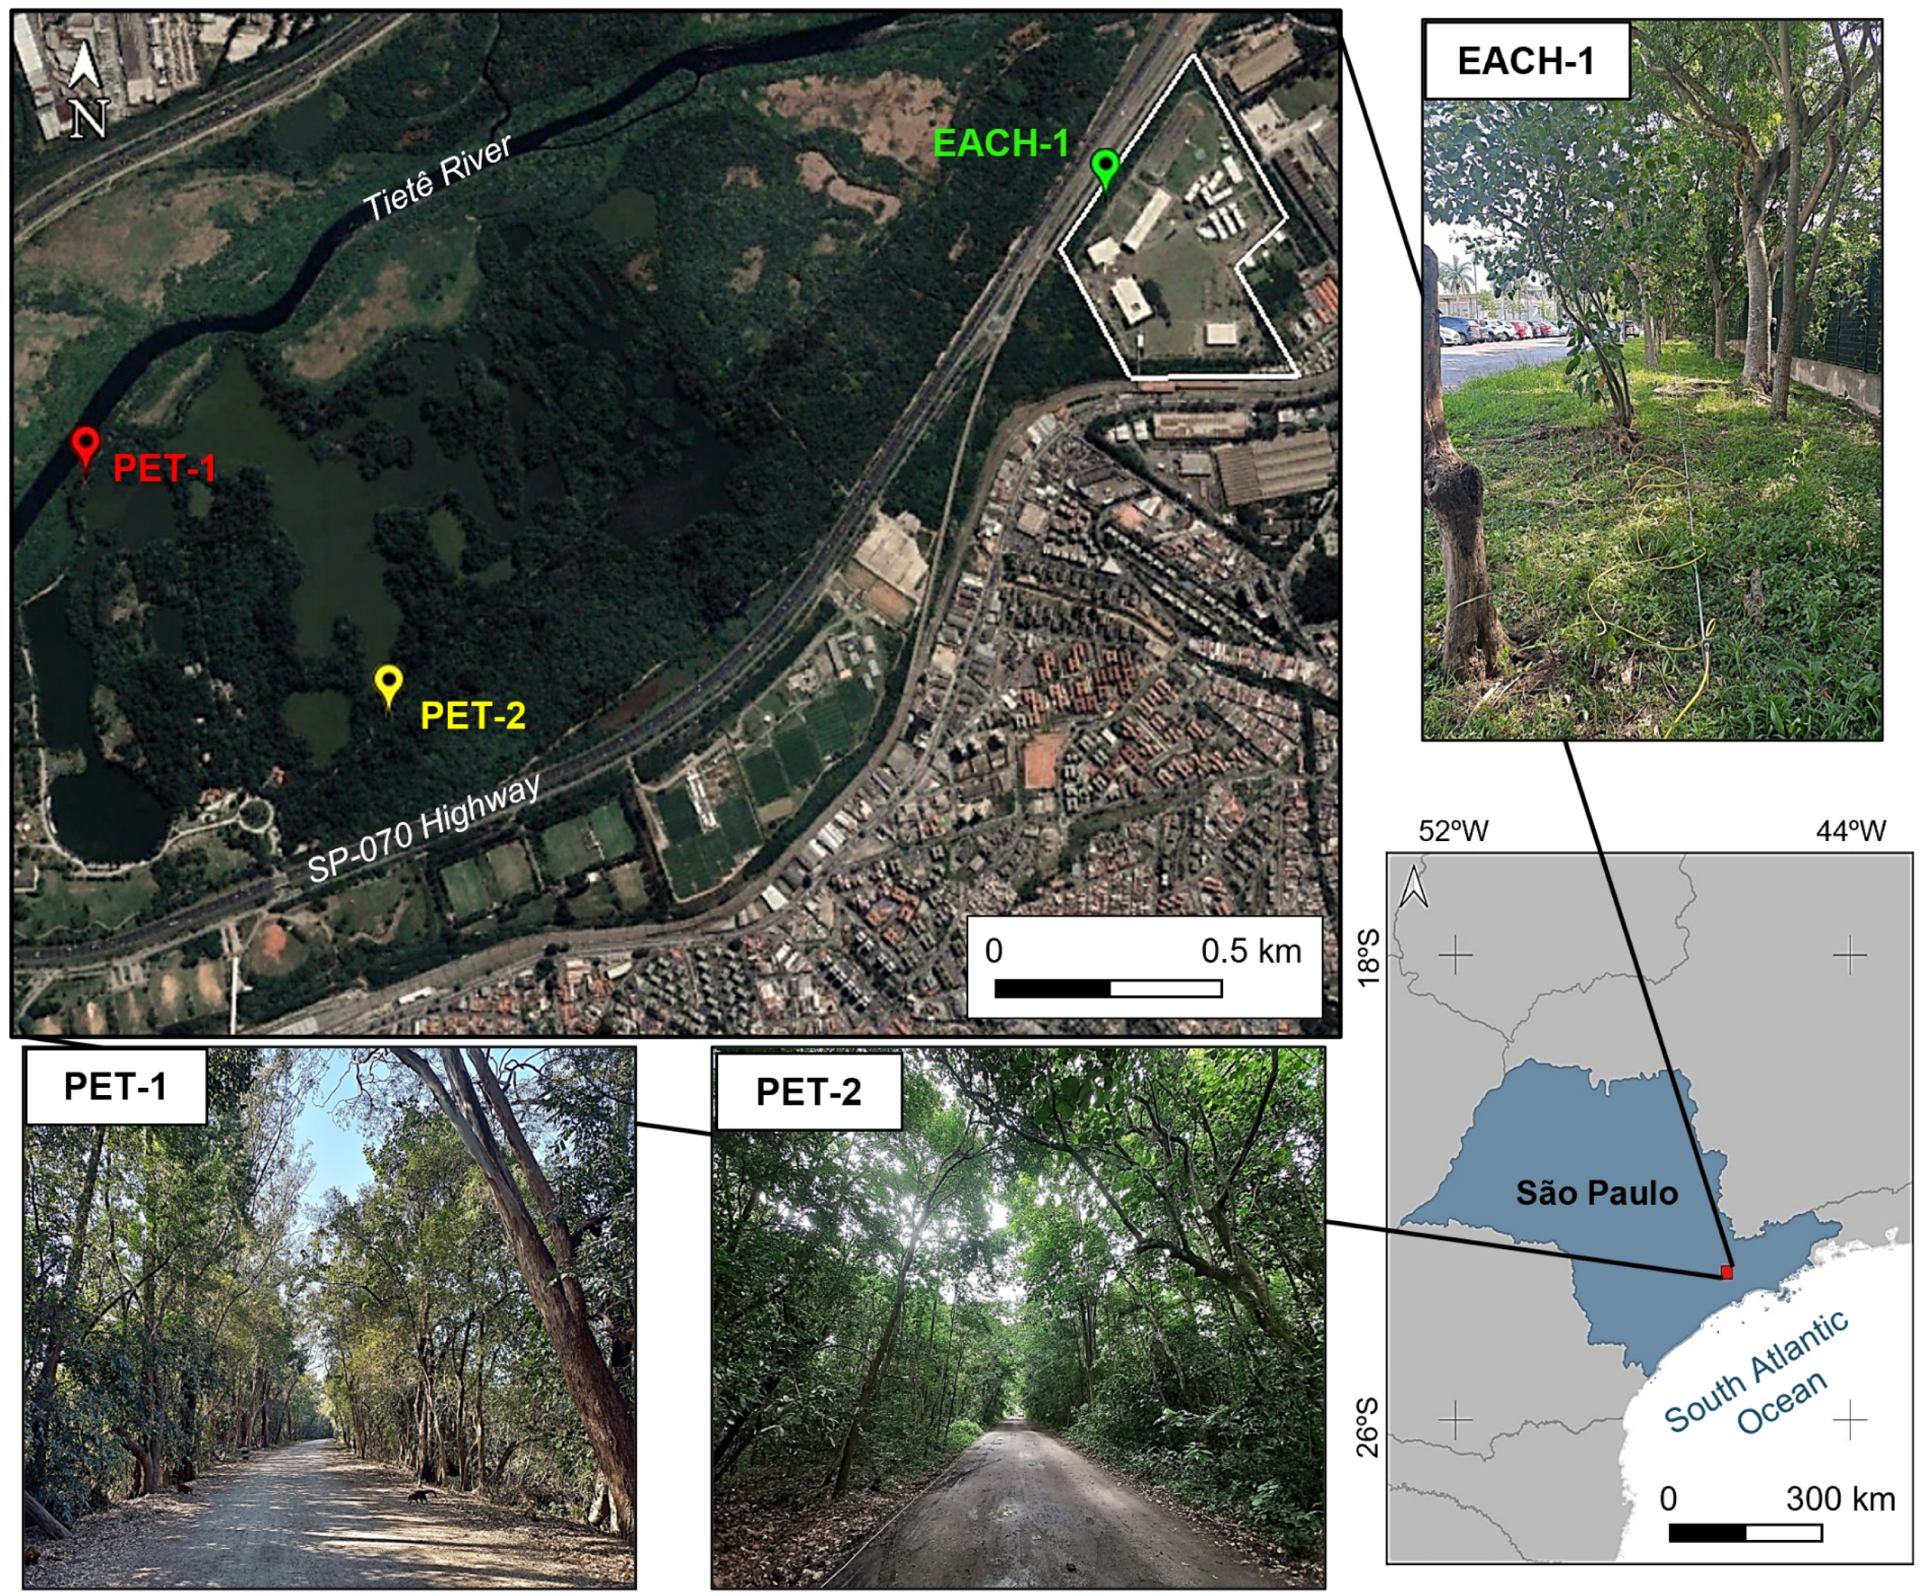
3.2. Soil sampling
Soil samples were collected on 11/08 and 11/09/2022 during the drilling of water monitoring drill cores, whose locations were defined by previous geophysical acquisitions. Parameters were obtained for soil samples from three drill cores, two in the Tietê Ecological Park (PET-1 and PET-2) and one in the School of Arts, Sciences and Humanities (EACH-1). For the characterization of magnetic minerals, samples were collected every 0.5 m. For the chemical analyses, sampling was based on changes in color and texture observed during drilling, with depth intervals ranging from 0.5 to 1.0 m for most samples. Until the start of data acquisition for magnetic characterization, the soil was stored in a refrigerator to minimize the alteration processes of the magnetic minerals. Wet samples were prepared in cubic acrylic boxes (7.0 cm3) and capsules (only for measurement on a vibrating sample magnetometer). Wet samples were used in order to minimize the alteration processes of the magnetic minerals. The mass of the samples was measured before acquisitions for subsequent data normalization.
3.3. Soil geochemical
All samples were dried in an environment free of dust, gas, etc., at room temperature, and then they were distorted, quartered, and milled with ceramic balls up to 200 Mesh (74 μm) granulometry. The samples were analyzed by X-ray fluorescence spectrometry. The levels presented were measured in a pressed sample, in the Standardless calibration, relative to the analysis without standards of the chemical elements comprised between fluorine and uranium, in an X-ray fluorescence spectrometer, Malvern Panalytical brand, Zetium model. The values were normalized to 100%.
Geochemical analyses were used to determine the content (%) of major elements expressed in terms of oxides. In this work, only the contents of SiO2, Al2O3, Fe2O3, K2O were used as indicators of chemical weathering intensity, mineralogical composition and granulometry, to corroborate the textural analyses. A loss of ignition (LOI) was performed at 1020° for 2 h. This parameter represents the difference in the material weight, in percentage. This difference is due to the loss of structural water from clays or organic matter.
3.4. Environmental magnetism
Magnetic properties of soil vary according to magnetic mineralogy, magnetic minerals content and grain size. Magnetic susceptibility (MS) variations can provide important information on minerals transformations that result from (bio)geochemical changes. Laboratory additional techniques are needed to provide specific information, unraveling the magnetic minerals environment and fingerprints of biogenic minerals.
Magnetic susceptibility (𝜒) is influenced by all magnetic behaviors in the sample, such as diamagnetism (e.g., quartz), paramagnetism (clay minerals), ferri- and antiferromagnetism (iron oxides and hydroxides), associated with the total mineralogical composition. Percent frequency-dependent magnetic susceptibility (𝜒FD%), is sensitive to ferromagnetic particles with grain size in the range of superparamagnetic to stable single domain (SSD) (Dearing et al., 1996).
Magnetic susceptibility (MS) is the capacity of a material to acquire magnetization during the application of a uniform magnetic field. Mass-normalized MS is given by 𝜒 (in m3/kg). Frequency-dependent magnetic susceptibility is a technique particularly used to identify the presence of superparamagnetic (SP) particles (Dearing et al., 1996; Evans and Heller, 2003). SP particles can be identified by their fast magnetization relaxation, observed by the loss of MS with the increase of the external field oscillating frequency. We carried out frequency-dependent MS measurements with MFK1 (AGICO Ltd.) at two frequencies (F1 = 976 Hz and F2 = 15616 Hz), operating at room temperature and in an AC field of 200 A/m. Each sample was measured 10 times, for each frequency, and then normalized by mass, with the data expressed in m3/kg. To quantify the SP response contribution to magnetic susceptibility, 𝜒FD% was estimated as the relative percentage of MS loss between the measurements at the different frequencies.
Thermomagnetic curves are useful for identifying magnetic mineralogy by identifying magnetic properties changes that occur at specific temperatures, such as the Curie temperature TC = 580 °C (from which ferri or ferromagnetic minerals lose magnetization) or the Néel temperature TN = 675 °C (used for antiferromagnetic minerals).
Magnetic minerals can be altered during the heating steps, giving rise to secondary minerals. Low-temperature acquisitions avoid this change, allowing primary minerals to be identified by their low-temperature transitions, such as the Morin (for hematite) and Verwey (for magnetite) transitions, respectively (Dunlop and Özdemir, 1997). Thermomagnetic curves were acquired in two intervals: from room temperature to 700 °C (high temperature curve, with heating and cooling of the sample); and below room temperature (low temperature curve). The measurements were carried out on the Kappabridge KLY-4 equipment (AGICO Ltd.), in an argon atmosphere to minimize sample oxidation.
Magnetic carriers’ size and mineral phase will influence the way magnetic particles acquire remanent acquisition. Isothermal remanent magnetization (IRM) can be measured after exposure to a field at ambient temperature. Depending on the magnetic coercivity of the mineral and the artificial field intensity, all magnetic moments will be magnetized in alignment with the external field, and the induced magnetization will not change when increasing the applied field, reaching saturation isothermal remanence (SIRM). The anhysteretic remanent magnetization (ARM) is a stable magnetization used as a proxy for magnetite concentration. The ARM measurement involves magnetizing a sample using a low field in the presence of an alternating magnetic field that is smoothly reduced to zero.
The ARM/SIRM ratio can be analyzed as an indicator of magnetite grain size. Higher values of the ratio indicate a decrease in grain size, while lower values indicate an increase in the size of the magnetic population (Evans and Heller, 2003). For ARM acquisition, the samples were subjected to a 100 mT AF superimposed on a constant field of 50 μT. IRM acquisition was performed, inducing magnetization in the following steps: 1000 mT and backfield 300, and 100 mT. Measurements were performed at Laboratório de Paleomagnetismo of Universidade de São Paulo (USPMag). Remanence was measured in a cryogenic magnetometer type SQUID (Superconducting Quantum Interference Device), model 755U (2G-Enterprises), and induction by a pulse magnetizer model MMPM10 (Magnetic Measurements Ltd.), located in a shielded room with ambient field of less than 200 nT. The values obtained were used to calculate environmental magnetism parameters (S-ratio, HIRM and SIRM).
S-ratio provides an estimate of the relative number of grains with high and low coercivity remanence, such as hematite (antiferromagnetic) and magnetite (ferrimagnetic), respectively (Bloemendal et al., 1992). It is defined by Equation (1):
| \begin {equation}\label {eq1} \mbox {S-ratio} = 0.5\times (({\mathrm {IRM}}_{1000\,\mathrm {mT}} -{\mathrm {IRM}}_{-300~\mathrm {mT}})/{\mathrm {IRM}}_{1000\,\mathrm {mT}}) \end {equation} | (1) |
HIRM parameter represents the absolute concentration of antiferromagnetic minerals in natural samples. It is given by Equation (2):
| \begin {equation}\label {eq2} \mathrm {HIRM} = 0.5\times (\mathrm {IRM}_{1000~\mathrm {mT}} + \mathrm {IRM}_{-300~\mathrm {mT}}). \end {equation} | (2) |
The behavior of magnetic minerals can be identified by the shape of the hysteresis curves, defined by the following parameters: saturation magnetization (Ms), saturation remanent magnetization (Mrs), coercivity or coercive field (Hc) and remanence coercivity (Hcr) (Dunlop and Özdemir, 1997; Tauxe, 2008). From these curves, it is possible to differentiate the influence of the magnetic phenomena present in the mineralogical assembly, namely: diamagnetism, as in quartz and feldspar; paramagnetism, as in clay minerals, biotite and pyroxenes; and ferromagnetism. The latter is observed in ilmenite (antiferromagnetism), hematite (parasitic ferromagnetism), magnetite and pyrrhotite (ferrimagnetism).
Hysteresis curves also provide information about the domain structure of the magnetic minerals present in the samples and, consequently, about grain size. Ratios calculated from the hysteresis parameters (Mrs/Ms and Hcr/Hc) were used as estimates of the domain states of the magnetic carriers and, consequently, of the grain sizes present in the samples. It is important to highlight that the Hcr parameter is obtained during the acquisition of the IRM curves.
The hysteresis curves were obtained using a MicroMag Vibrating Sample Magnetometer (Princeton Instruments corp.). A maximum field of 1000 mT was used, and, after data acquisition, the paramagnetic effect was corrected for the maximum magnetic field of 700 mT.
IRM curves were also obtained using MicroMag Vibrating Sample Magnetometer. Magnetization acquisition was performed at 200 points, with nonlinear distribution, and the maximum applied field was 1000 mT. Data were analyzed using the online software MAX UnMix (Maxbauer et al., 2016). The program was built using the shiny package for R studio and allows the quantification of the contribution of the magnetic phases that make up the IRM acquisition curve of each sample. This is done by fitting the curve using log-Gaussian functions, separating components with different coercivity spectra (Kruiver et al., 2001; Robertson and France, 1994).
Parameters based on anhysteretic remanent magnetization (ARM) are influenced by SSD ferromagnetic particles (Egli and Lowrie, 2002), functioning as a qualitative indicator of magnetic grain size contribution. Saturation isothermal remanent magnetization (SIRM) is associated with the remanence-bearing minerals contribution, encompassing grains of low and high coercitivities. HIRM refers to minerals of high coercivity (e.g., hematite and goethite). The S-ratio is a qualitative indicator of the relative proportion of low and high coercivity minerals.
4. Results
4.1. Textural and geochemical soil characterization
Profiles of geochemical and textural variation at depth were generated from soil samples collected during drilling of monitoring wells in PET-1, PET-2 and EACH-1 (Figure 2).
Distribution of geochemical and textural parameters in PET-1 (close to Tietê River), PET-2 (close to SP-070 highway) and EACH-1.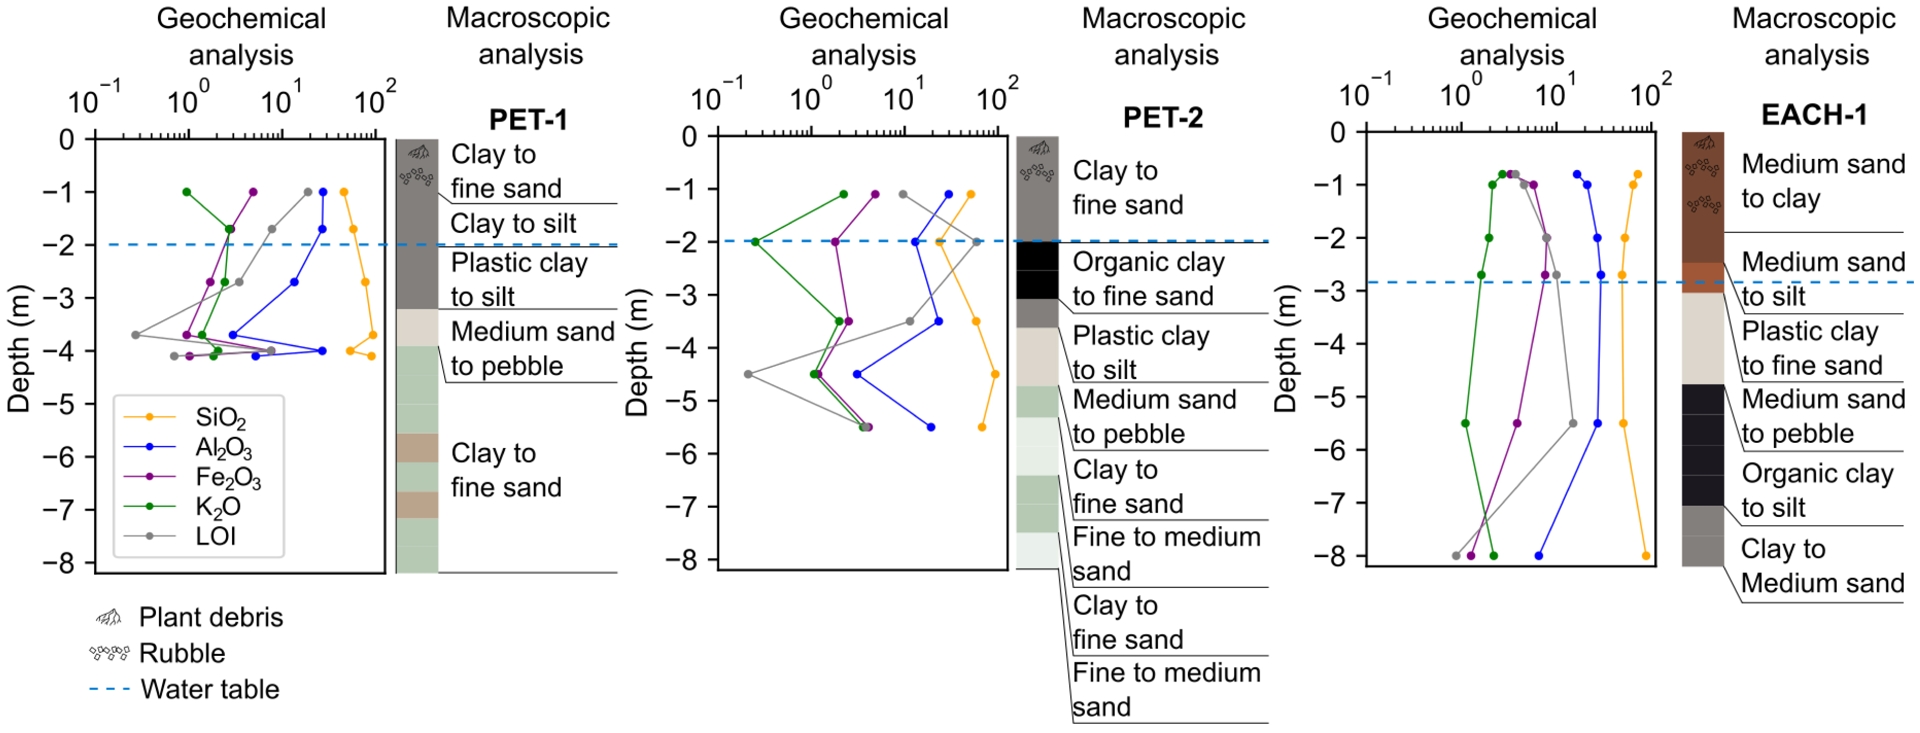
In PET-1, the sandy-silty to fine sandy texture occurs up to approximately 2.5 m in depth. In the most superficial samples (up to 1.0 m), the presence of processed wood and debris was observed. This is consistent with previous environmental assessment reports in the PET region, which identified a fill thickness of less than 2.0 m in depth (CONAM—Consultoria Ambiental Ltda, 2017). At 4.0 m, the transition from coarse sandy sediment to gravelly to clayey occurs. The latter presents a greenish-gray coloration, indicating reduced sediment. After some time exposed to atmospheric air, the formation of an outer layer with a yellowish color change was noted. However, during sampling, reddish portions were observed in the reduced sediment at 5.5, 6.5 and 7.0 m. This suggests that the material was already in these conditions in the subsurface.
Geochemical data also show a well-marked contrast at 4.0 m depth. SiO2 content ranges from 45.80% to 93.90%, increasing with depth. Al2O3, Fe2O3 and the loss of ignition parameter (LOI) show a decreasing trend. Their values range from 27.40% to 2.97% (Al2O3), 7.65% to 0.95% (Fe2O3), and 18.90% to 0.25% (LOI). On the other hand, the K2O content shows a more expressive decrease in the vadose zone and a more subtle decrease in the saturated zone, with values between 2.70% and 0.95%. An increase in the SiO2 content associated with the decrease in the others is compatible with the leaching process and predominance of silicates that are more stable to chemical weathering, such as quartz, muscovite and heavy minerals. This is corroborated by the subtle decrease in K2O values and the identification of muscovite in the finer-grained samples, in addition to the observation of partially prismatic minerals in the coarser-grained samples. Loss of ignition values are higher below 3.0 m depth, where clayey material predominates, and may be associated with dehydration of clay minerals or organic matter content. The same does not occur at the sandy-gravelly level, where there is a sharp decrease in LOI, which increases again at the reduced clayey level.
In PET-2, the soil has a sandy-silty to fine sandy texture up to approximately 2.0 m in depth. The presence of processed wood and debris was also observed in samples up to 1.0 m. At 2.0 to 2.5 m, a predominantly black clayey layer occurs, possibly associated with variations in the water table. Clayey-silty sediments occur up to 4.4 m in depth, followed by a sandy-gravelly level of up to 5.5 m. Above this depth, clayey levels are observed interspersed with levels of predominantly fine sand texture, both with color indicative of reduced sediment.
SiO2 content ranges from 23.60% to 93.80%. Al2O3, Fe2O3 and LOI range from 29.70% to 3.09%, 4.84% to 1.18%, 59.10% to 0.21%, respectively. K2O content presents higher values in the more clayey levels, ranging from 3.59% to 0.25%. All oxides of major elements show a decrease, while there is an increase in the LOI value, in the water table variation zone, suggesting a layer rich in organic matter. Increase in the SiO2 content together with the decrease in the other oxides is compatible with the predominance of silicates that are more stable for chemical weathering, with their peak value in the sandy-gravelly level.
In EACH-1, the soil has a sandy-clay texture (up to 2.3 m) and sandy-clay to silty-clay in the water table variation zone (up to 3.0 m). During sampling, the presence of debris, processed wood, and plastic waste was also frequently observed. Above 4.0 m in depth, dark clayey to silty-clay layers occur, with a sandy level close to 5.0 m. Previous studies identified a fill thickness of around 4.0 m (CONAM—Consultoria Ambiental Ltda, 2017). Dark clayey to silty-clay layer has been associated with sediments rich in organic matter (TOC > 40%), removed from the Tietê River channel during its rectification process (Mendonça et al., 2015).
Major element contents range from 49.10% to 88.10% (SiO2), 29.40% to 6.52% (Al2O3), 7.90% to 1.26% (Fe2O3), while the variation of the loss of ignition (LOI) parameter is from 15.00% to 0.88%. The variation of these values is relatively homogeneous along the profile, except for LOI (at 5.5 m), due to the presence of organic matter. The subtle increase in Al2O3 and decrease in SiO2 at this depth is also associated with the increase in clay content.
4.2. Magnetic properties distribution
Figure 3 shows profiles of magnetic parameters variation at depth that were generated from soil samples collected during drilling of monitoring wells in PET-1, PET-2 and EACH-1.
Distribution of magnetic, and textural parameters in PET-1 (close to Tietê River), PET-2 (close to SP-070 highway) and EACH-1. 𝜒F1 = low frequency susceptibility (976 Hz); 𝜒F2 = high frequency susceptibility (15616 Hz); 𝜒FD% = percent frequency-dependent magnetic susceptibility; ARM = anhysteretic remanence acquired at 100 mT; SIRM = isothermal remanence acquired at 1000 mT; S-ratio = low coercivity minerals contribution; HIRM = isothermal remanent magnetization of high coercivity minerals; w.t. = water table.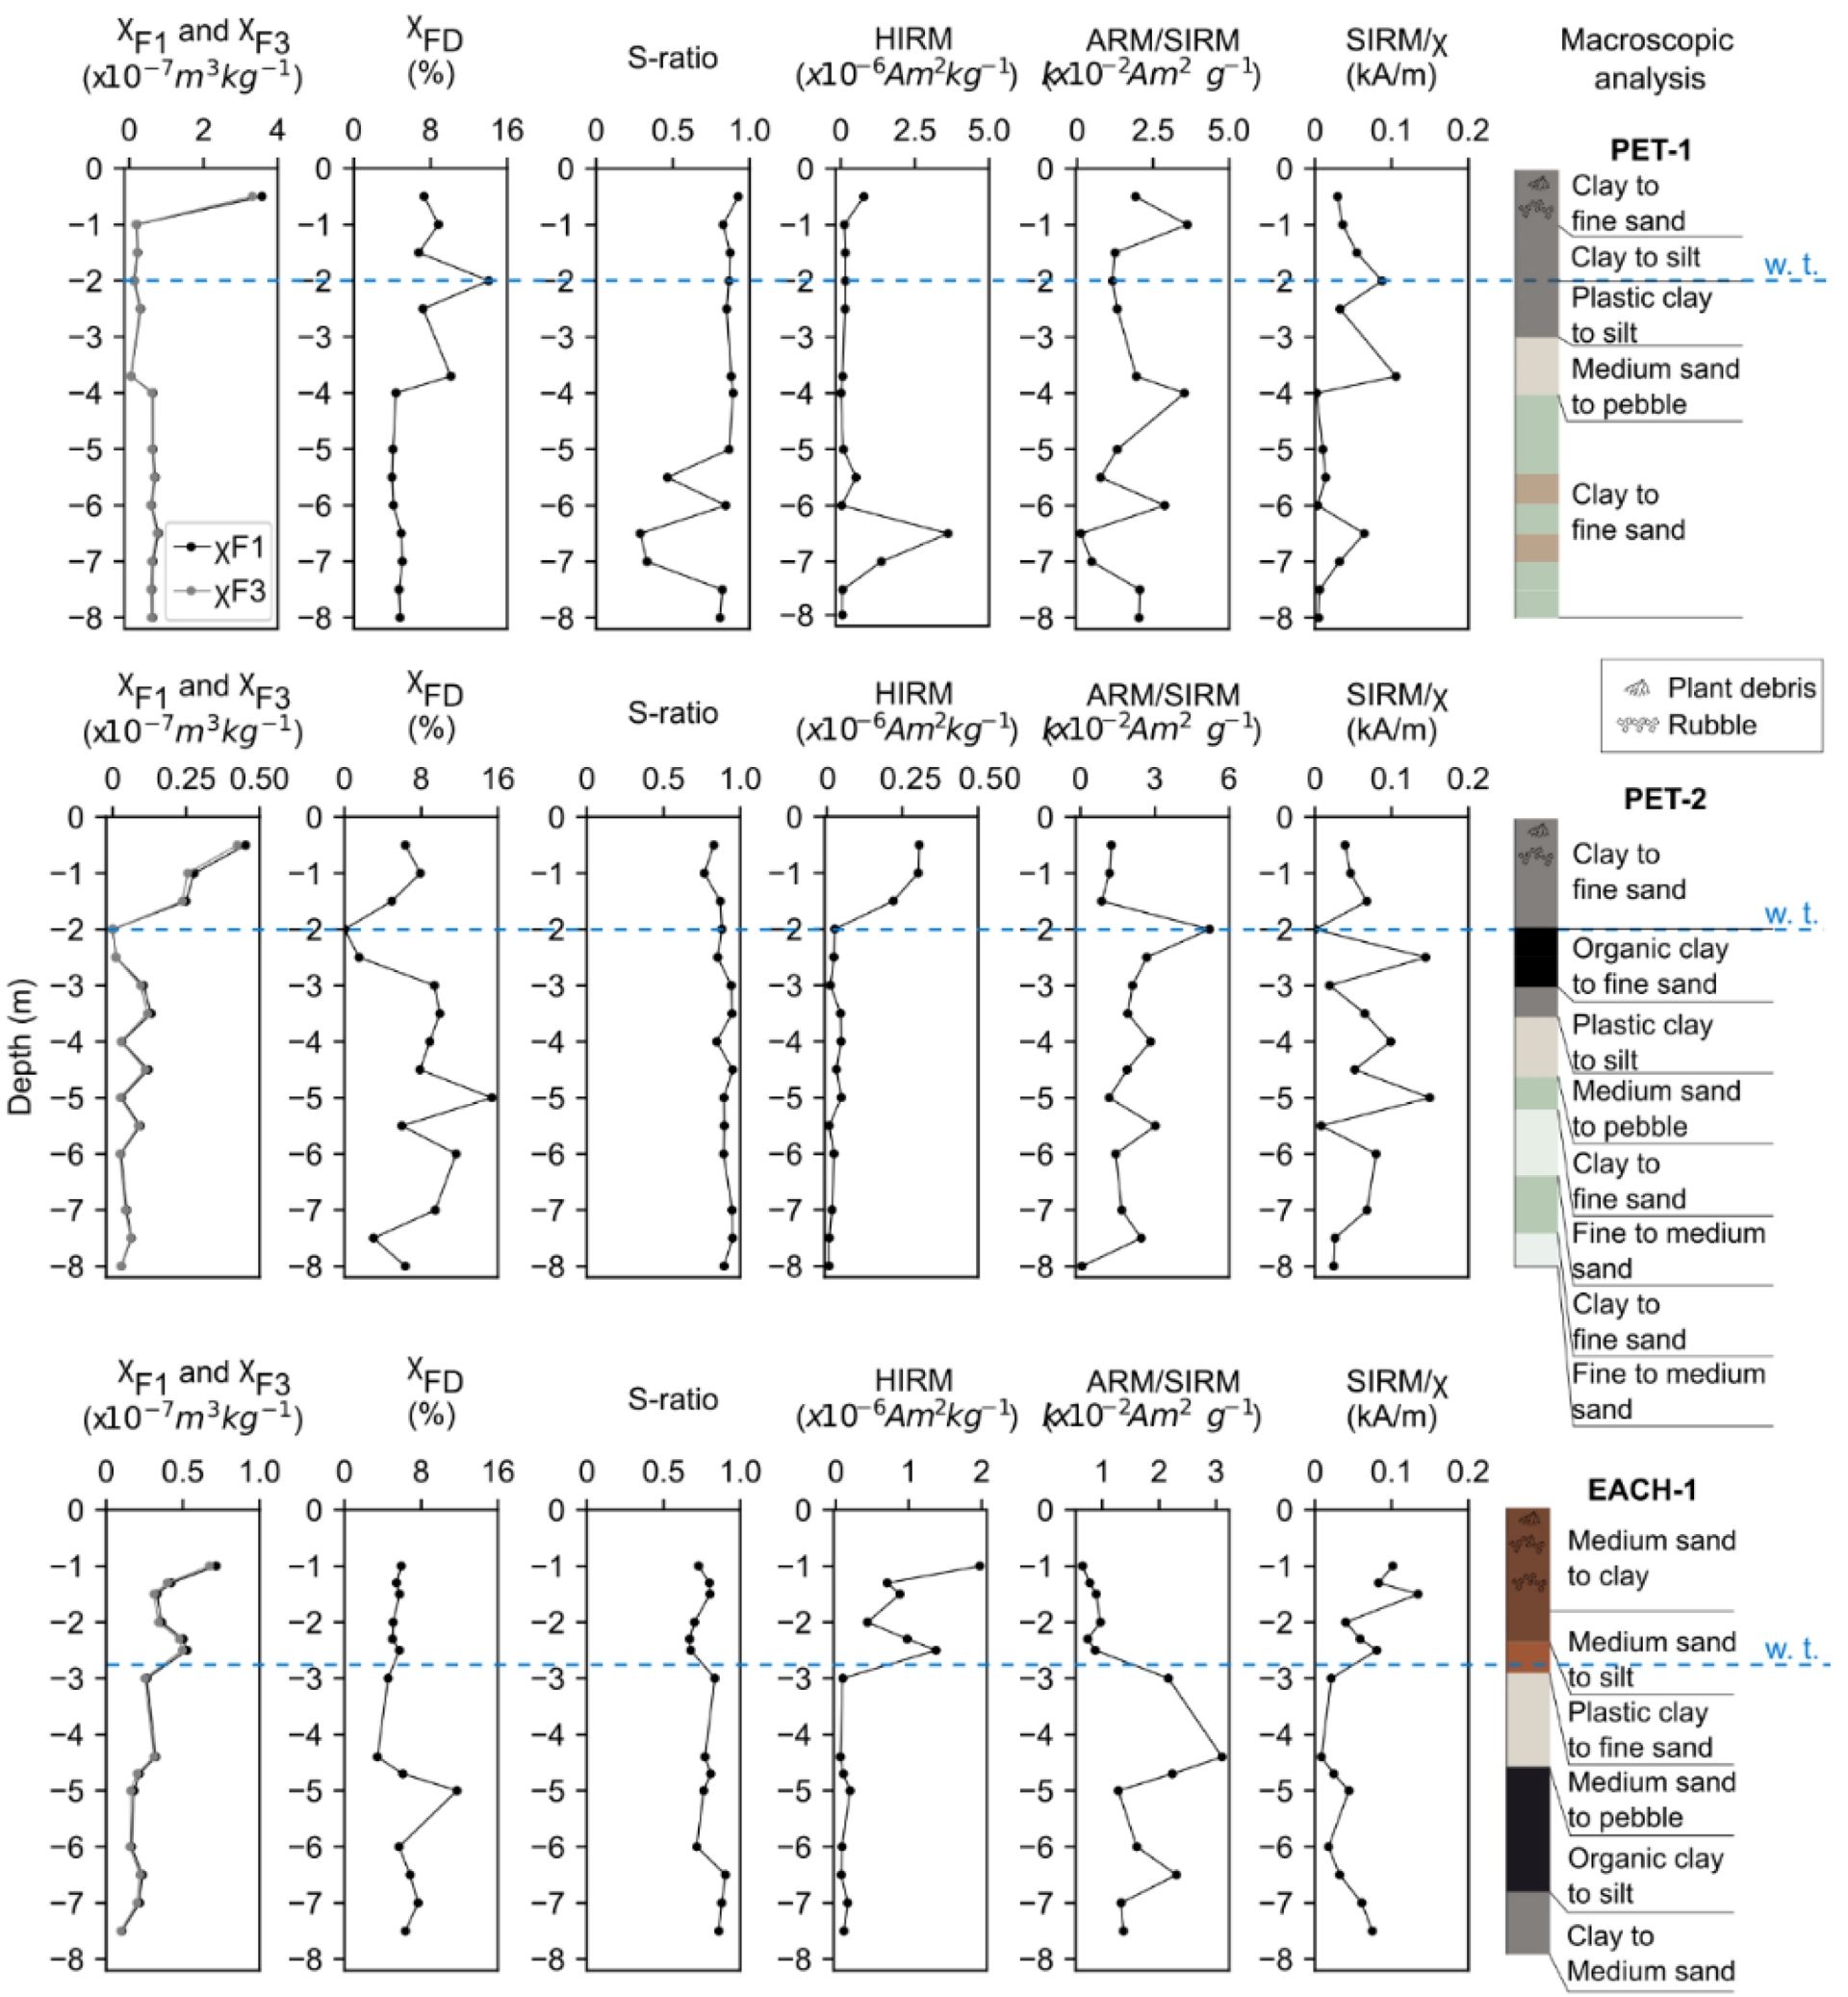
In PET-1, low-frequency magnetic susceptibility profile (𝜒F1) shows three sets of well-pronounced values are observed, higher (3.58 × 10⁻⁷ m3/kg) from surface to 1.0 m, lower (2.02 × 10⁻⁸ to 5.14 × 10⁻⁹ m3/kg) between 1.0 and 3.7 m, and intermediate (6.37 × 10⁻⁸ to 6.29 × 10⁻⁸ m3/kg) from 4.0 m depth. Higher values close to the surface may be associated with the magnetic enhancement of the soil profile, mainly due to the presence of pedogenic magnetite and/or maghemite (Jordanova et al., 2017). The contrast at 4.0 m depth may be directly associated with the transition from sandier to clay material. This can also be observed in the ARM/SIRM profile, which is sensitive to stable particles that retain remanence (SSD grain).
In 𝜒FD%, the distribution of the proportion of superparamagnetic (SP) nanometric particles is more heterogeneous (6.8 to 14.1%) up to 4.0 m, and more homogeneous (4.0 to 5.1%) above this depth. 𝜒FD% > 6% suggests a significant proportion of SP grains, while 𝜒FD% < 5% indicates a predominance of SSD grains or extremely fine grains (<5 nm) of the SP fraction (Dearing et al., 1996). 𝜒FD% > 10% indicates a predominance of SP grains. The main 𝜒FD% peak is in the transition zone from the vadose zone to the saturated zone, which may indicate the influence of possible fluctuations in the water table, and consequent redox variations, on the formation of SP particles. Lower ARM/SIRM values, above 4.0 m, also indicate the presence of ultrafine particles.
Higher S-ratio values (above 0.8) are relatively constant, indicating that more than 50% of the remanence is retained by low-coercivity minerals, which are corroborated by the lower HIRM values. In contrast, the HIRM peaks indicate that high-coercivity particles are predominant in such deep samples. This is also evidenced by ratio values lower than 0.5, corresponding to more than 50% of the remanence retained by high-coercivity particles. The ARM/SIRM values are also consistent with the S-ratio values, indicating that more than 50% of the remanence is retained by low-coercivity SSD grains.
SIRM/𝜒 is used to indicate the presence of iron sulfides (Peters and Thompson, 1998). However, the increase in 𝜒 values, associated with the presence of paramagnetic and superparamagnetic minerals, reduces the ratio, which may mask the presence of sulfides, when they occur in smaller quantities. SIRM/𝜒 < 4 kA/m indicates low-coercivity magnetite/titanomagnetite, while SIRM/𝜒 > 500 kA/m indicates pyrrhotite. In the latter case, greigite presents slightly lower values, but like the more coercive magnetite. In PET-1, the values range from 2.02 to 105.66 kA/m, indicating that there is no presence of sulfides in the samples.
In PET-2, 𝜒F1 values show a more heterogeneous distribution. However, higher values (from 2.49 × 10⁻⁸ to 4.53 × 10⁻⁸ m3/kg) are observed above the water table, and lower values (from 1.10 × 10⁻⁹ to 1.31 × 10⁻⁸ m3/kg) are observed in the saturated zone. At a depth of 2.0 m, 𝜒F1 = −2.73 × 10⁻⁹ m3/kg and is associated with a clayey material rich in organic matter (diamagnetic behavior). The contrast between the more sandy and clayey sediments is not as expressive in the magnetic parameters of this well. This may be due to the greater number of intercalations, making the difference in susceptibility more subtle.
𝜒FD% shows a larger (6.0 to 15.4%) and more heterogeneous distribution of SP particles from 3.0 to 7.0 m depth, compared to the PET-1 samples. 𝜒FD% < 5% are observed in the vadose zone (1.5 m) and in the saturated zone (7.5 m), which may indicate a greater influence on SSD grains or finer grains of the SP fraction, based on the higher and lower ARM/SIRM values, respectively. 𝜒FD% < 2% appears only in the organic-rich interval. This suggests the predominance of particles that do not exhibit superparamagnetic behavior, such as coarser grains multidomain (MD) (Dearing et al., 1996).
S-ratio values (0.77 to 0.95) present a homogeneous distribution, with lower values more concentrated above the water table. In other words, the influence of low coercivity minerals predominates, mainly in the saturated zone. The HIRM profile shows a bimodal distribution, with higher values predominantly in the vadose zone, indicating a higher concentration of high coercivity minerals in this environment. ARM/SIRM values are partially compatible with the S-ratio values, indicating that more than 50% of the remanence is retained by low coercivity SSD grains, mainly in the saturated zone. It is also noted that the peaks of the S-ratio occur mainly in the water table variation zone and in more clayey levels in the saturated zone.
SIRM/𝜒 ranges from 7.93 to 149.41 kA/m, indicating the absence of iron sulfides in the PET-2 samples.
In EACH-1, 𝜒F1, in addition to a heterogeneous distribution, also shows a concentration of higher values (from 3.31 × 10⁻⁸ to 7.17 × 10⁻⁸ m3/kg), above the water table, and lower values (from 1.03 × 10⁻⁸ to 3.23 × 10⁻⁸ m3/kg), below. No significant contrasts are observed that could be associated with the granulometric variation of the material, although the lower 𝜒F1 values at depth may be related to the clearer, reduced intervals.
In 𝜒FD%, the distribution of the proportion of superparamagnetic (SP) particles is more homogeneous in the vadose zone (5.0 to 5.9%). These values, compared with the variations in the ARM/SIRM profile, may indicate a lower influence of SP particles in the intervals with a higher ratio. In the saturated zone, lower (3.4 and 4.6%) and higher (5.7 to 11.7%) values of 𝜒FD%, associated with low ARM values, may indicate variation in the granulometry of SP grains, with significant proportions above 5.0 m depth.
S-ratio values can be divided into three intervals. The first, above the water table, with values from 0.67 to 0.80. The second and third, in the saturated zone, with values from 0.72 to 0.83 and from 0.86 to 0.90, respectively. Lower S-ratio values are associated with higher HIRM values, indicating an influence of high-coercivity minerals, mainly in the vadose zone. Below the water table, the opposite relationship suggests that more than 50% of the remanence is retained by low-coercivity grains, with their predominance above 6.5 m depth. In the ARM/SIRM profile, a well-marked contrast can be observed by the vadose zone/saturated zone transition zone, below which the highest values are associated with higher S-ratios, indicating the presence of low-coercivity SSD particles. On the other hand, in the vadose zone, there is less influence of these particles on the ARM/SIRM ratio.
SIRM/𝜒 parameter presents values from 8.27 to 134.34 kA/m, suggesting the absence of iron sulfides.
4.3. Magnetic grain size evaluation
Hysteresis loops were obtained for soil samples collected during drilling of the monitoring wells PET-1, PET-2 and EACH-1. Subsequently, mass normalization and correction of the paramagnetic effect were performed, with a maximum magnetic field of 700 mT to better observe the influence of ferromagnetic particles. The curves exhibit para- and ferromagnetic behaviors, with a significant influence on paramagnetic minerals, such as micas and clay minerals, a result consistent with the description of the soil samples.
Figure 4 shows examples of hysteresis curves for samples from the three drill cores, at different depths.
Hysteresis curves of soil samples from drill cores in the Tietê Ecological Park (PET-1 and PET-2) and the School of Arts, Sciences and Humanities (EACH-1), close to surface (vadose zone) and at depth (saturated zone). Ms = saturation magnetization; Mrs = saturation remanent magnetization; Hc = coercivity.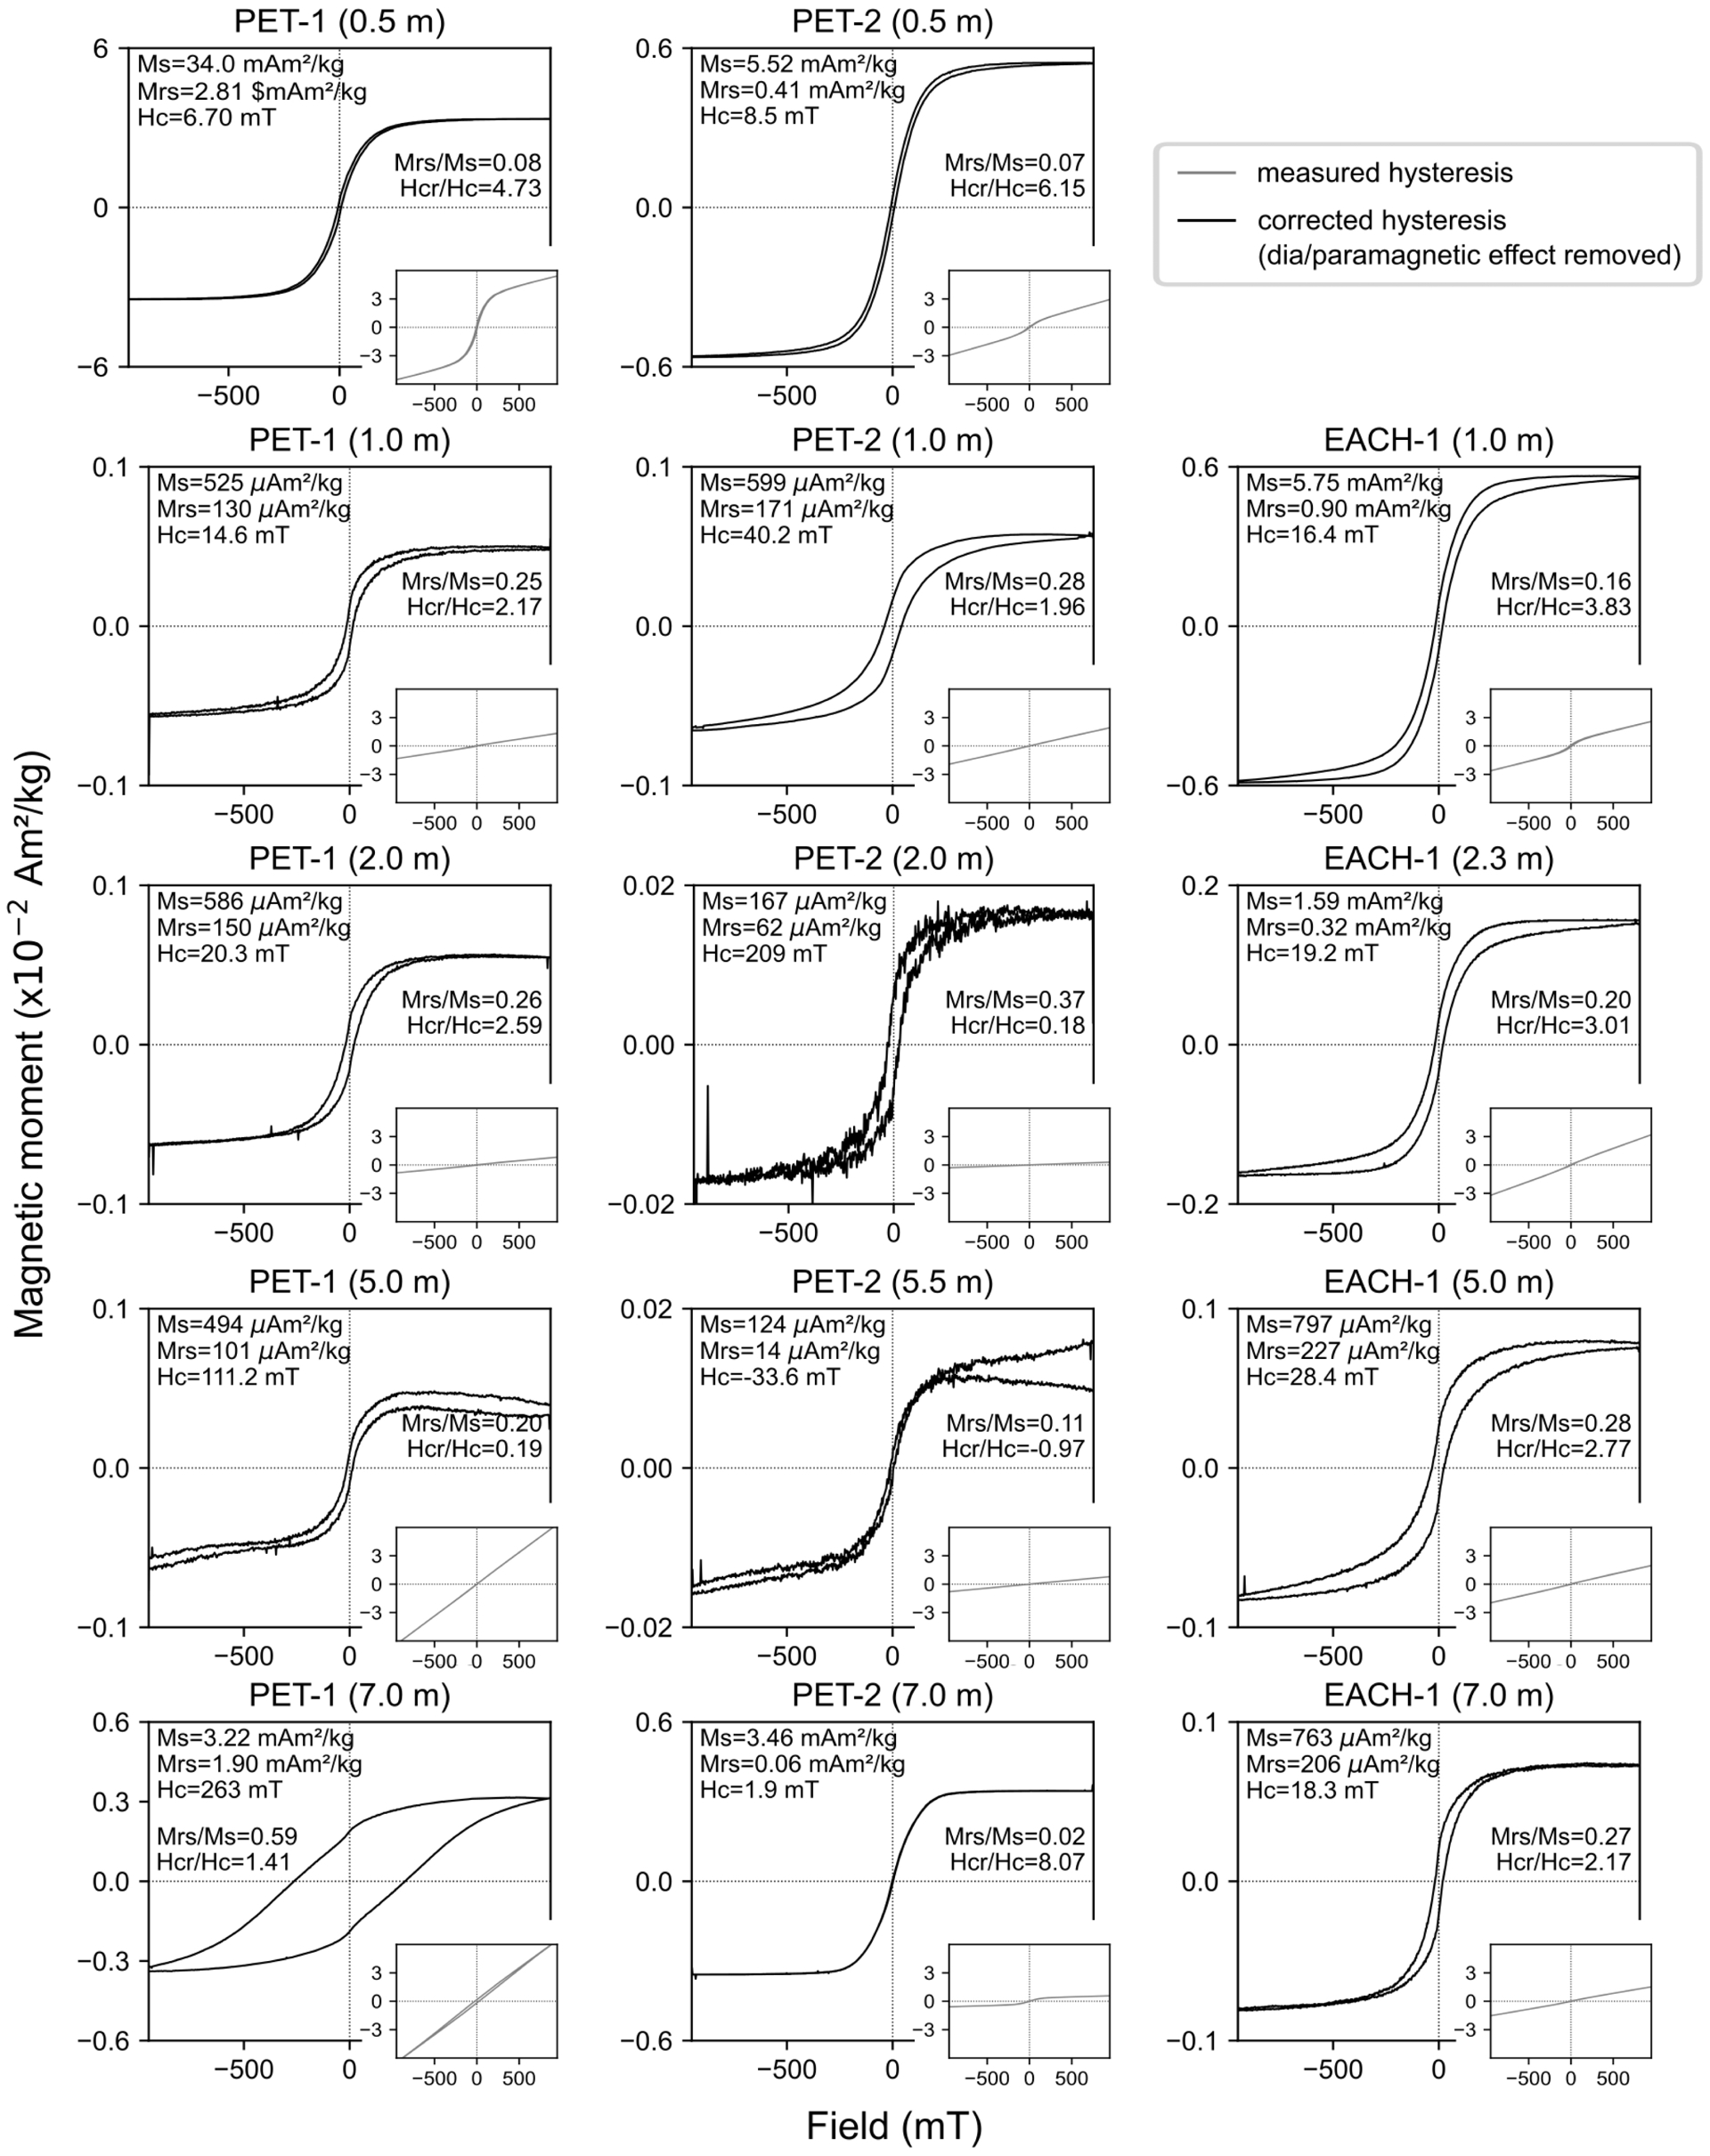
In PET-1 and PET-2, the Mrs/Ms and Hcr/Hc values indicate mixtures of low coercivity particles (such as magnetite) in the SP-SSD interval. In contrast, in EACH-1, the ratios suggest PSD magnetite particles. In the saturated zone, the soil samples from drill cores PET-1 and PET-2 present distinct behavior both in terms of composition and grain size. In the first case, the curve and ratios are compatible with MD hematite grains (Özdemir and Dunlop, 2014), while in the second case, they indicate the presence of MD magnetite particles.
4.4. Magnetic mineralogy
Isothermal remanent magnetization (IRM) acquisition and demagnetization curves were acquired for soil samples from drill cores PET-1, PET-2, and EACH-1. Representative samples were selected from each well, two in the vadose zone, one in the transition zone (∼2.0 m) and the other in the saturated zone, which exhibits two main patterns (Figure 5). The sample at 0.5 m was not recovered in EACH-1. IRM curves indicate contributions from low (magnetite) and high coercivity minerals (such as hematite and goethite), in which the magnetization does not saturate below 1000 mT. The exception is PET-2 and EACH-1 (7.0 m), in which the curve saturates below 300 mT, suggesting only a contribution from low coercivity minerals.
Isothermal remanent magnetization (IRM) acquisition curves of samples from drill cores in the Tietê Ecological Park (PET-1 and PET-2) and the School of Arts, Sciences and Humanities (EACH-1), close to the surface (vadose zone) and at depth (saturated zone). Hcr = remanence coercivity.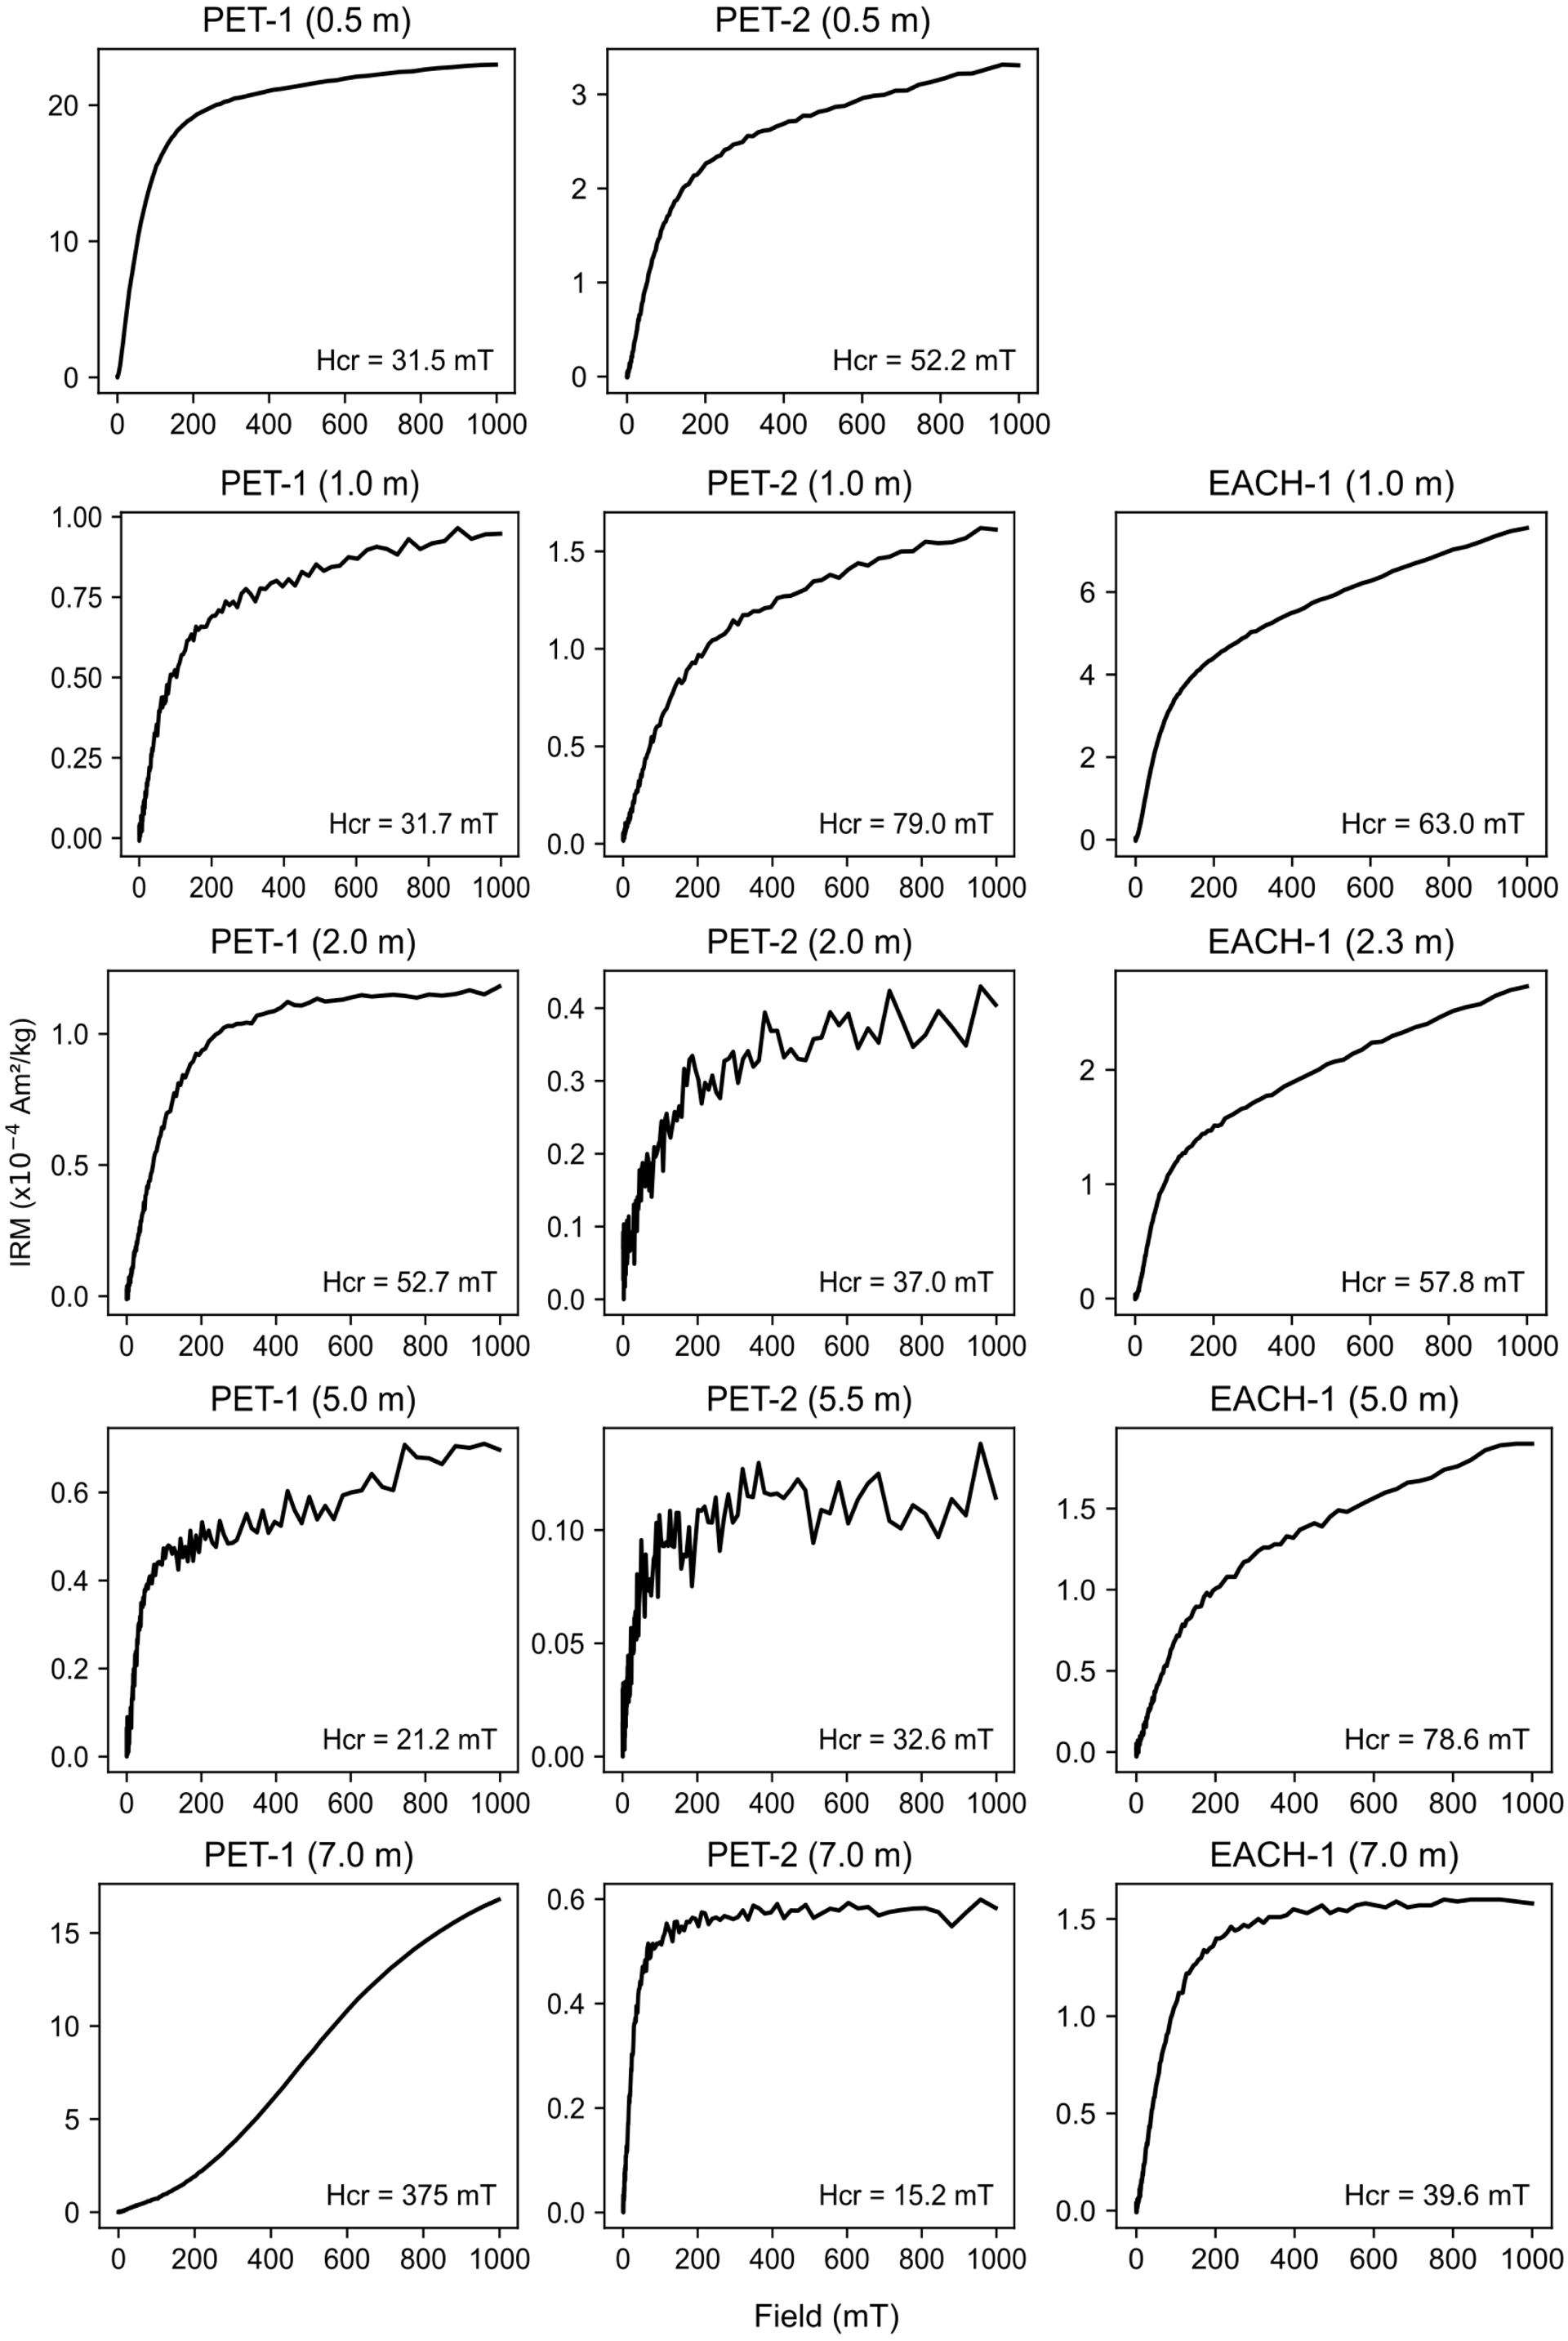
In the PET-1 well samples, the influence of high coercivity minerals is more evident at depth. It is also important to highlight that the contribution of the magnetization of low-coercivity magnetic carriers, for a field of 300 mT, represents more than 90% of the total magnetization for most samples up to 4.0 m deep. On the other hand, above 4.0 m, the magnetization of these magnetic carriers does not exceed 25% of the total magnetization of the samples. Well-marked contrast at this depth was also observed in other parameters, such as χF1, 𝜒FD%, and, only for some depths, in the saturated zone, in the S-ratio and HIRM.
Coercivity spectra were obtained for the IRM curves (Figure 6). Their components are obtained by fitting log-Gaussian curves, each of which is characterized by three main parameters: mean coercivity (Bh); dispersion (DP), which quantifies the scattering of coercivities; and saturation remanent magnetization (Robertson and France, 1994). Skewness (S) and observed contribution (OC) parameters also provide additional information about coercivity distribution for the same grain population (component) and relative contribution, respectively (Maxbauer et al., 2016).
Coercivity components (C) obtained from the isothermal remanent magnetization acquisition curves of soil samples from drill cores PET-1, PET-2 and EACH-1, at different depths.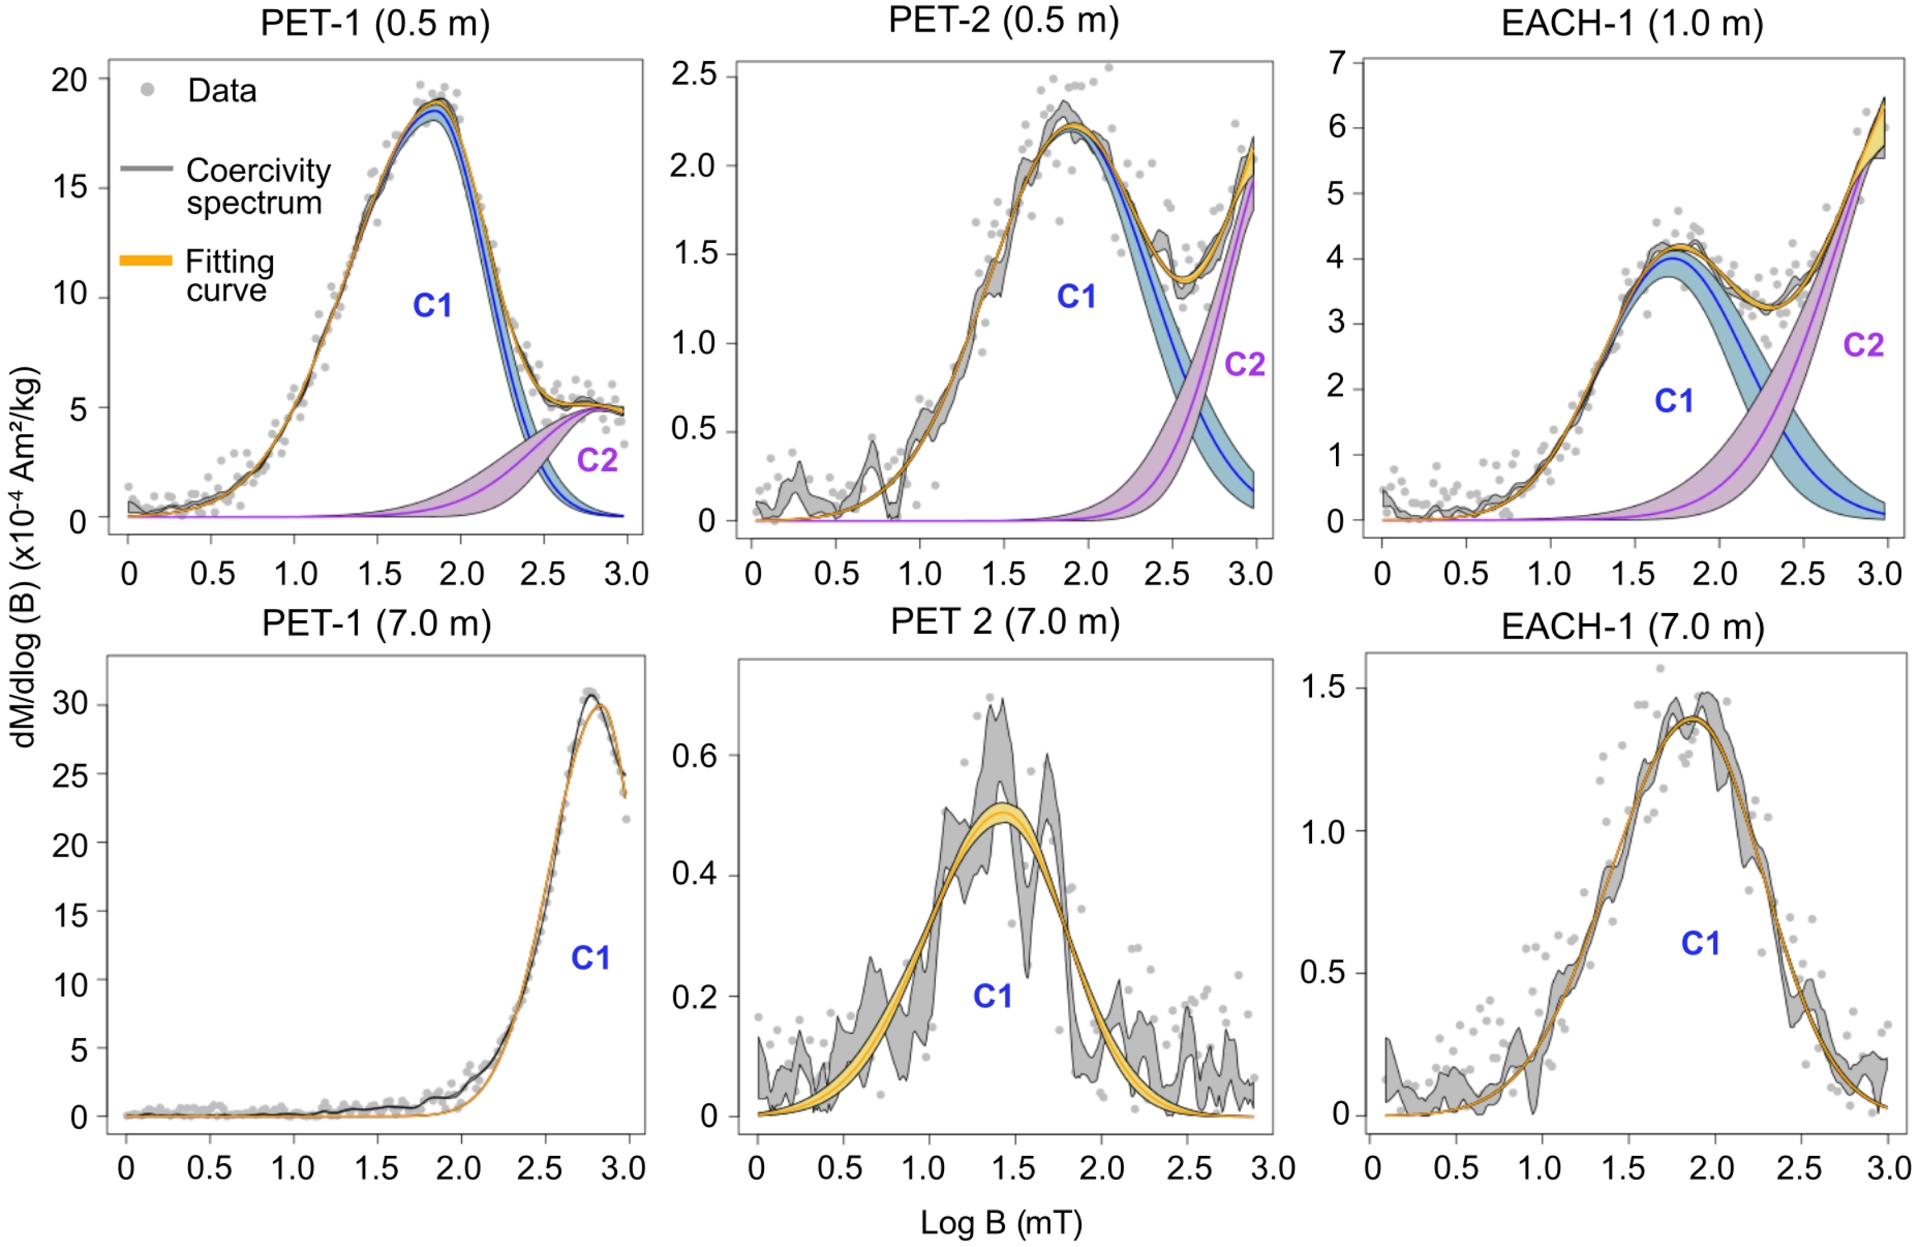
Modeling performed for PET-1, PET-2 and EACH-1 shows two low and high coercivity components in the vadose zone samples (Table 1). Samples with the lowest coercivity correspond to more than 58% of the spectrum, with values of 48 mT (PET-1), 67 mT (PET-2) and 54 mT (EACH-1). The remainder of the spectrum is influenced by the high coercivity samples, with values of 580 mT (PET-1) and 1021 mT (PET-2), and 1044 mT (EACH-1). Soil samples in the saturated zone show a common behavior for the PET-2 and EACH-1 drill cores, consisting of only one low-coercivity component (24 mT and 65 mT). On the other hand, in PET-1, one high-coercivity component (575 mT) was necessary to fit the curve.
Coercivity components for soil samples from drill cores PET-1, PET-2 and EACH-1, at different depths
| Specimen | Component 1 | Component 2 | ||||||||
|---|---|---|---|---|---|---|---|---|---|---|
| Bh (mT) | Bh (log 10 units) | DP | S | OC⋅mean | Bh (mT) | Bh (log 10 units) | DP | S | OC⋅mean | |
| PET1–0.5 m | 48 | 1.68 | 0.43 | 0.77 | 0.86 | 580 | 2.76 | 0.35 | 0.90 | 0.14 |
| PET1–7.0 m | 575 | 2.76 | 0.26 | 0.85 | 1.00 | – | – | – | – | – |
| PET2–0.5 m | 67 | 1.83 | 0.46 | 0.91 | 0.78 | 1021 | 3.01 | 0.36 | 0.73 | 0.22 |
| PET2–7.0 m | 24 | 1.39 | 0.41 | 0.99 | 1.00 | – | – | – | – | – |
| EACH1–1.0 m | 54 | 1.73 | 0.43 | 1.01 | 0.58 | 1044 | 3.02 | 0.42 | 0.79 | 0.42 |
| EACH1–7.0 m | 65 | 1.81 | 0.45 | 0.93 | 1.00 | – | – | – | – | – |
Bh = mean coercivity; DP = dispersion parameter; S = skewness; OC = observed contribution.
Low coercivity values (<25 mT and DP = 39–40) near the surface can be associated with pedogenic particles, while at greater depth (saturated zone), with particles resulting from microbial activity (Egli, 2004). Values close to 38 mT (DP = 47) can indicate detrital magnetite particles. Components with Bh equal to 57 mT (DP = 45), 69 mT (DP = 26) and 80 mT (DP = 32), despite the high dispersion, can be associated with high-coercivity magnetite. High DP values, in this case, may suggest the presence of other components (Maxbauer et al., 2016). For high coercivity components, Bh above to 200 mT (DP = 27) may be associated with hematite, while Bh well above 1000 mT (DP = 25) may correspond to goethite.
Due to the noisy coercivity spectra, it was not possible to model the sample components for all depths. However, IRM data show a contribution of high coercivity minerals also below the water table.
Thermomagnetic curves show the thermal transformations that occur during heating and subsequent cooling of the sample. Magnetic susceptibility values (κ) are plotted as a function of temperature (T). The κ − T curves of fourteen soil samples from the three drill cores were selected to provide evidence of the mineralogical composition at different depths and water saturation levels (Figure 7). It is noted that the magnetic susceptibility values of the cooling curves are higher than those of the heating curves, indicating the formation of a new, strongly magnetic phase. This behavior can be attributed to the neoformation of SP and SSD magnetite during heating of the samples in reducing conditions. This is observed in samples containing iron hydroxides, in the presence of organic matter, or Fe-bearing clay minerals, or with adsorbed iron (Hanesch et al., 2006; Hirt et al., 1993).
High-temperature curves for selected soil samples from the drill cores of the Tietê Ecological Park (PET-1 and PET-2) and the School of Arts, Sciences and Humanities (EACH-1), close to the surface (vadose zone) and at depth (saturated zone).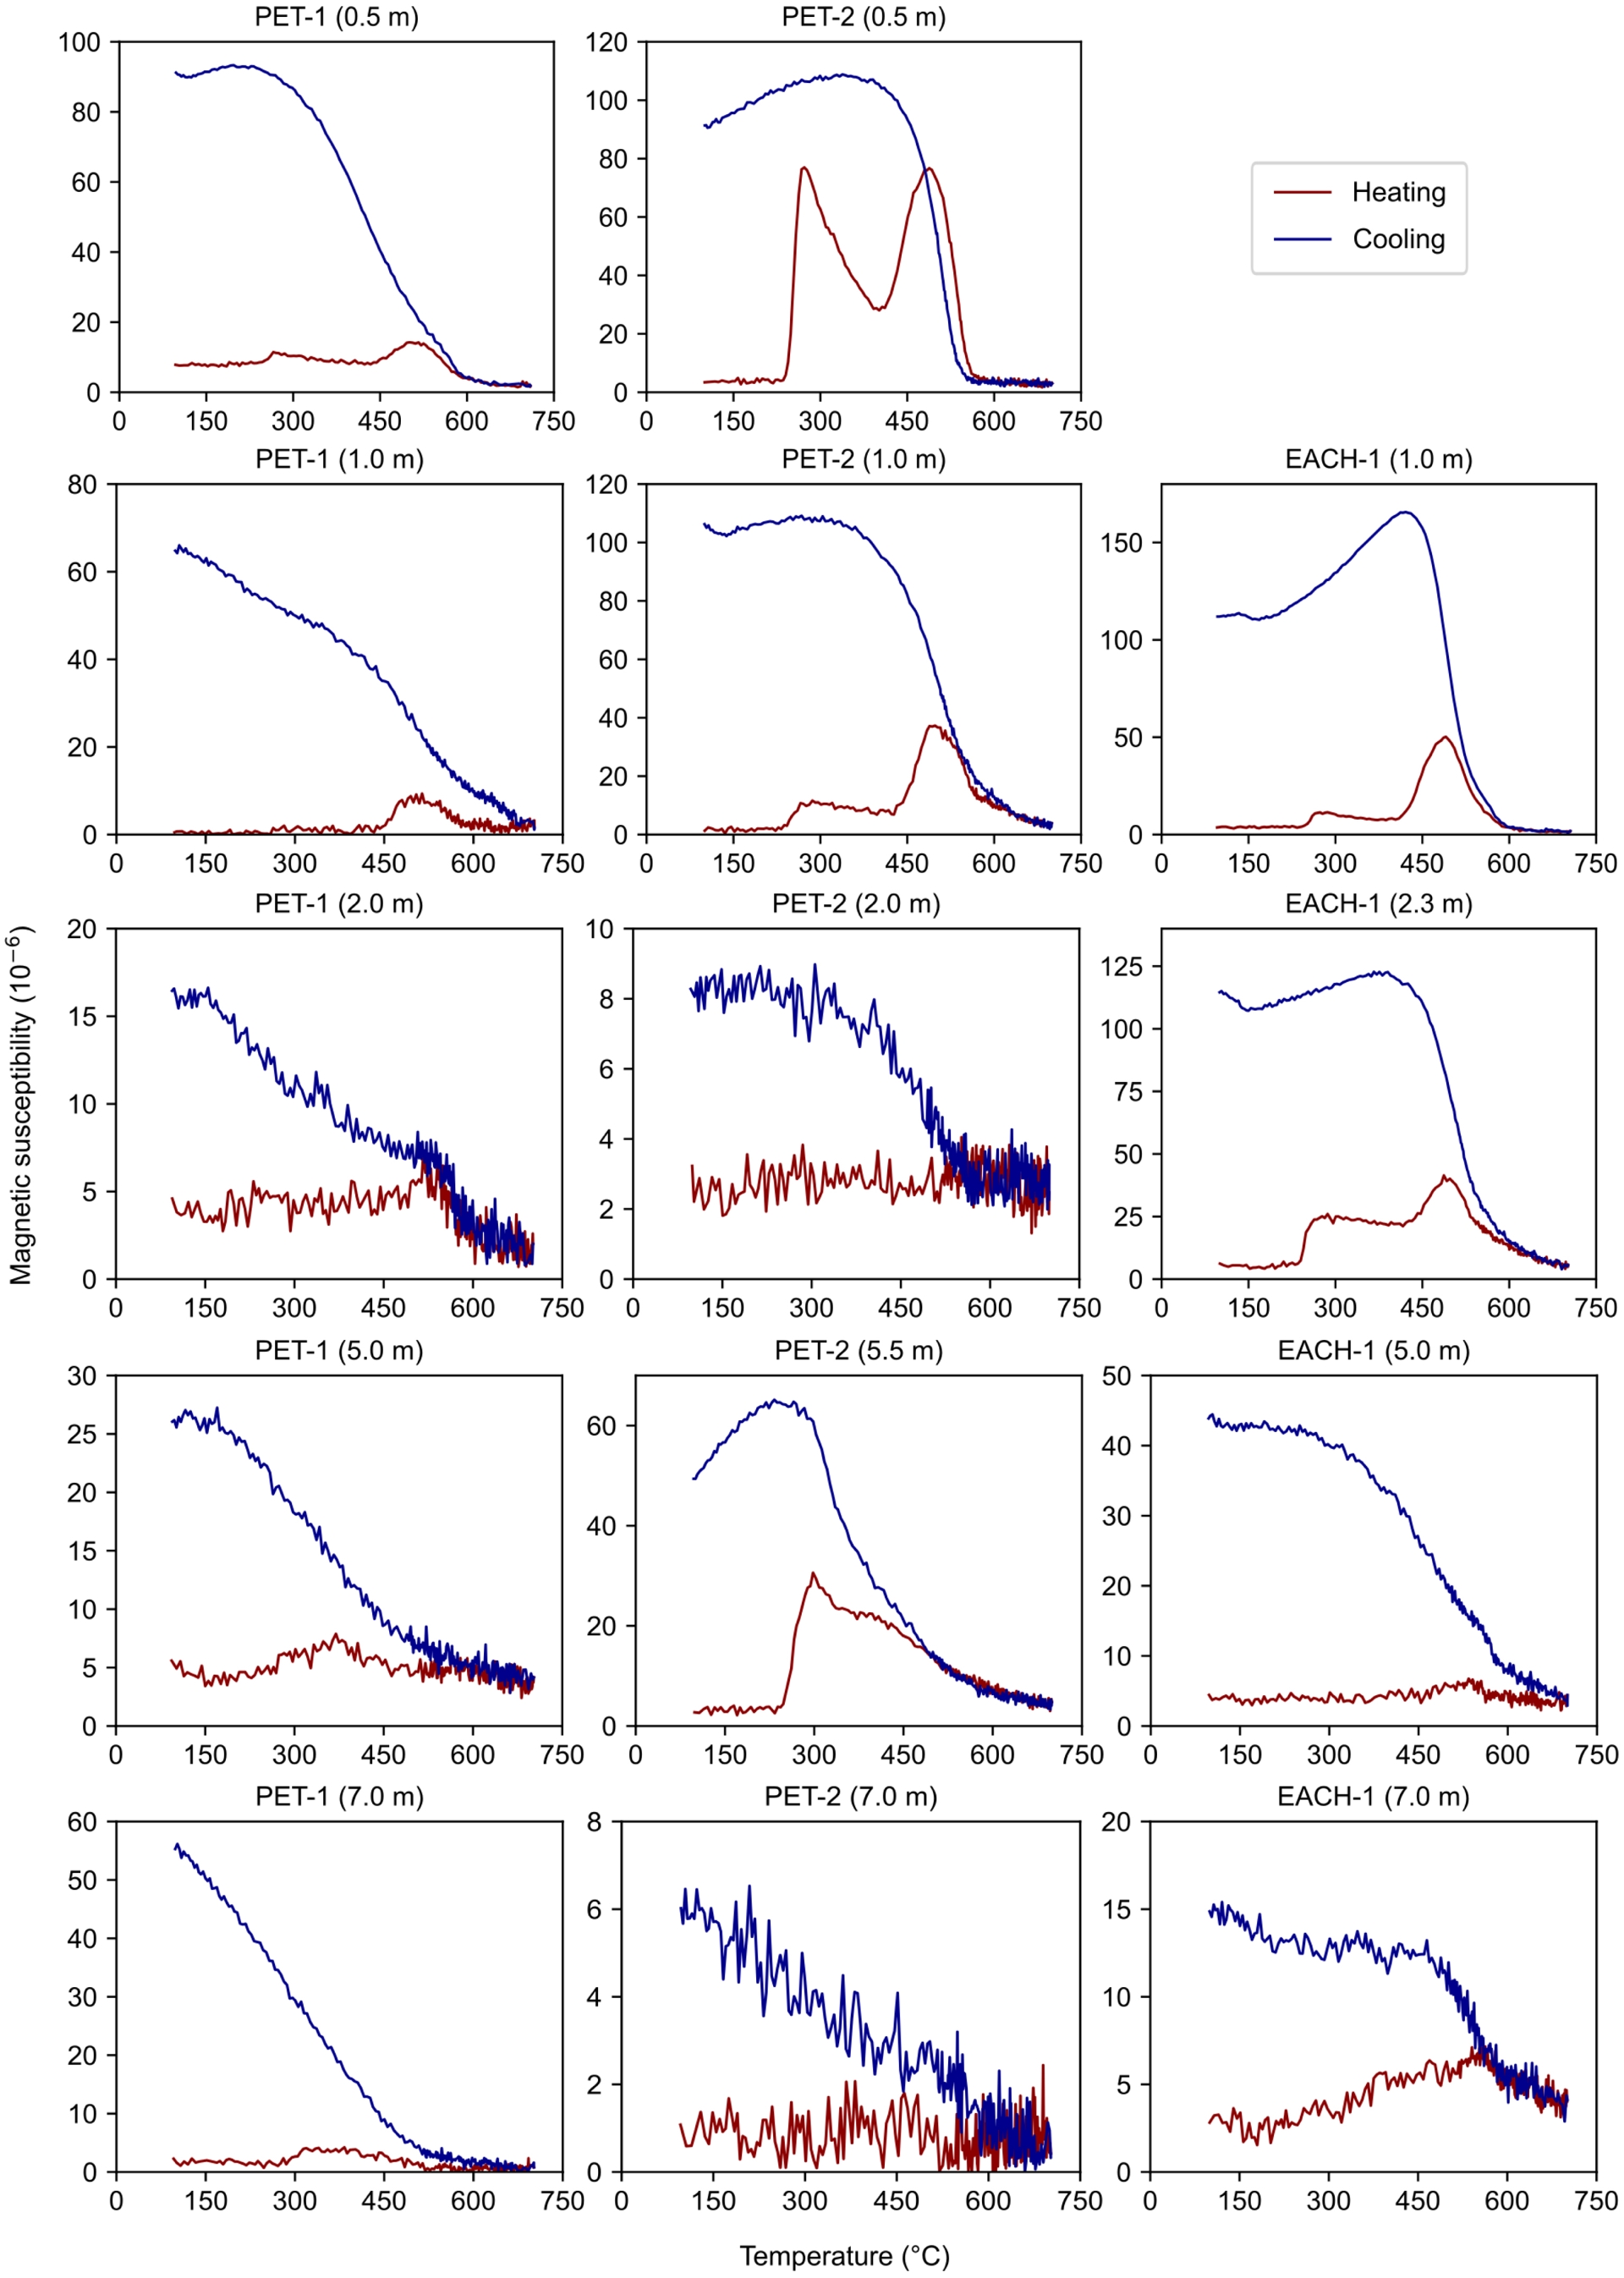
Heating curves of the soil samples at 0.5, 1.0 and 2.3 m depth (vadose zone), in the three drill cores, show the presence of two peaks during heating, although with different intensities. The increase in magnetic susceptibility occurs at temperatures of 250 °C and 500 °C. The first peak may be related to the presence of ferrihydrite being transformed into maghemite. Of the samples from the saturated zone, this peak is evident only at 5.5 m (PET-2), but it also appears at 7.0 m (PET-1). Furthermore, at 0.5 m (PET-2), the sharp loss of susceptibility between 300 and 400 °C may be caused by the inversion of fine-grained (pedogenic) maghemite to hematite (Liu, Deng, et al., 2005).
The second peak, more evident in the vadose zone soil samples (in all three drill cores) and more subtle in the saturated zone sample (EACH-1), corresponds to the reductive formation of magnetite from hematite (Dunlop and Özdemir, 1997). The behavior at 500 °C is also seen in the transformation of lepidocrocite into maghemite (Hanesch et al., 2006). Most of the newly formed SP and SSD particles with a dominant grain size around 35 nm, mainly magnetite, are produced above 500 °C (Liu, Deng, et al., 2005). This is evidenced by the decrease in magnetic susceptibility at 580 °C (Curie temperature of magnetite).
A residual magnetic susceptibility above 600 °C can also be observed at 1.0 and 5.5 m (PET-2) and 2.3 and 7.0 m (EACH-1), suggesting the presence of hematite that is more stable upon heating. Lepidocrocite can be dehydrated during heating (250 °C), becoming maghemite (450 °C) and, later, hematite. (Dunlop and Özdemir, 1997). At 5.5 m (PET-2), the loss of susceptibility from 300 °C onwards, without a subsequent increase of 500 °C, may indicate the inversion of maghemite to hematite added to the presence of fine-grained hematite particles that are not reduced to magnetite during heating (Liu, Deng, et al., 2005). The transformation of maghemite to hematite can also occur from 550 °C onwards. This is because maghemite with coarser grains, depending on the degree of crystallographic perfection, has a higher inversion temperature than finer grains (Gallagher et al., 1968). Despite the results presented, additional data from chemical analyses would be necessary to effectively determine the magnetic mineralogy. This is because the behavior of the curves may be due to different mineral interactions.
5. Discussion
In all drill cores, higher magnetic susceptibility values occur in samples closer to the surface, although in PET-1 there is a decrease from depths above 0.5 m. In this case, the magnetic parameters influenced by grain composition and size do not show the same discrepancy between the values at 0.5 m and those at subsequent depths. The higher 𝜒 value, although reflecting all magnetic contributions in the sample (para-, dia-, and ferromagnetic), is indicative of the concentration of these minerals. Furthermore, it is important to highlight that this is a backfill area (CONAM—Consultoria Ambiental Ltda, 2017), whose mineralogical and chemical composition can vary spatially, as evidenced by the geochemical data, thereby impacting the magnetic signature. High 𝜒 values at shallow depths in the other wells may be influenced by the presence of superparamagnetic (SP) ferrimagnetic minerals (magnetite and maghemite), related to magnetic enhancement during pedogenesis (Maxbauer et al., 2016). This phenomenon is related to well-drained and oxidizing environments, where the pedogenic formation of magnetite is induced by variations in soil moisture and local redox conditions (Ahmed and Maher, 2018). However, it usually occurs in the first meters of the soil (Jordanova et al., 2017), a region outside the scope of the sampling carried out in this work. Therefore, these higher magnetic susceptibility values in the vadose zone may be due to other factors. Perhaps differences in anthropogenic deposit interfaces result in the contrast of this physical property.
Despite the anthropogenic impacts on the sites, all regions are vegetated, which provides greater nutrient cycling and mobilization of chemical elements. Both organic matter and water level fluctuations can affect the redox dynamics and, consequently, the biogeochemical processes that occur in the three sites. This affects the dynamics of dissolution and precipitation of magnetic phases, since these processes are impacted by both biotic and abiotic changes.
𝜒FD% peaks, indicative of the abundance of superparamagnetic (SP) particles, are more associated with the influence of water saturation. Peaks in the saturated zone may be associated with the activity of iron-reducing bacteria that increase the amount of ultrafine magnetite particles resulting from their metabolic activity (Lovley et al., 1987). Higher values of ARM/SIRM, a parameter indicative of single domain (SD) magnetic particle size, also appear more frequently below the water table. In previous studies in the EACH area, higher content of SP particles in the saturated zone was related to methanogenic zones in the deposits of dredged sediments from the Tietê River (Ustra et al., 2021). Ultrafine particles are generated because of methane production through the coupling between iron-reducing bacteria and methanogenic bacteria, which reduces the CO2 associated with organic matter. In contrast, there is production of SP magnetite because of the reduction of phases containing Fe (III) (Lovley et al., 1987).
This signature was also observed in the PET-2 and EACH-1 profiles and may be associated with the accumulation of methane in the sandy lenses intercalated with the clayey layers (Mendonça et al., 2015; Ustra et al., 2021). Since the clayey sediments in the saturated zone of PET-2 do not indicate significant organic matter content, the higher concentration of ultrafine particles may have another origin. In fact, the iron oxidation and reduction reactions that produce the ultrafine magnetic particles are believed to occur cyclically or simultaneously in many environments. The distinct biotic and abiotic processes are actually thought to overlap and even compete with each other (Kappler, Bryce, et al., 2021). However, additional data is needed to corroborate this interpretation. Regarding PET-1, the same pattern was not observed, with a low concentration of SP particles predominating below the water table.
S-ratio values close to 1.0, associated with low HIRM values, suggest the predominance of magnetite and maghemite along the profiles of the three drill cores. In PET-2 and EACH-1, higher HIRM values indicated the significant presence of high-coercivity minerals (such as hematite) above the water table. The same does not occur in PET-1, whose S-ratio (lower) and HIRM (higher) values showed a predominance of more coercive particles at depth (7.0 m).
This suggests that proximity to the Tietê River may influence the dynamics of magnetic mineral formation. A greater occurrence of low-coercivity minerals (e.g., magnetite) is expected in saturated, more reducing environments. On the other hand, high-coercivity minerals (e.g., hematite) tend to occur in more oxidizing environments. Transformations resulting from the interaction of biogeochemical processes could alter the redox dynamics of the environment. Another possibility would be changes during sampling, however, only samples from the saturated zone of PET-1 present a different coercivity distribution.
Isothermal remanent magnetization curves and hysteresis data also corroborated the occurrence of a mixture of minerals with different coercivities in the vadose zone (PET-2 and EACH-1) and the presence of hematite at depth (PET-1). In the latter, the behavior in an apparently reducing environment may indicate the occurrence of some alteration or punctual biogeochemical process. Mn (IV), nitrate and nitrite can act as chemical oxidants of Fe (II) under anoxic conditions (Kappler and Straub, 2005). The thermomagnetic curves also indicated the occurrence of ferrihydrite in the vadose zone and in the saturated zone of PET-2. In PET-1 and EACH-1, ferrihydrite was identified only in the samples from the vadose zone. Ferrihydrite can alter to more stable minerals such as hematite or goethite.
This study allowed a better understanding of the architecture of the CZ in a floodplain impacted by urbanization. The information obtained by the macroscopic description of the samples, contents of major elements, loss of ignition and mineralogy also indicated three main interfaces: (a) vadose zone-saturated zone boundary; (b) fine-grained sediments (<fine sand)-coarse-grained sediments (>coarse sand) boundary; and (c) coarse-grained sediments (>coarse sand)-fine-grained sediments (<fine sand) boundary. These boundaries were created by antropogenic action of laying all the impacted material from the Tietê River.
Interface (a) is mainly observed in the magnetic parameters. An exception is PET-2, whose layer rich in organic matter obliterates the data dependent on magnetic susceptibility but stands out in the loss of ignition. Interfaces (b) and (c) have similar characteristics for PET-2 and EACH-1. They are mainly observed in the contrasts of the magnetic parameters, but also in geochemical data and in the textural analysis, although there is no clear correspondence with these data for the EACH-1 samples. Therefore, magnetic data are sensitive to abrupt changes in texture and mineralogical composition, which can occur in places where there is backfill deposition.
In fluvial corridors, activities such as sediment mining and channelization alter morphology, hydrological dynamics, and connectivity within the Critical Zone. Even historical interventions continue to influence stratigraphy, biota, and system resilience (Wymore et al., 2023). In urban areas, these effects combine with ongoing pressures, reinforcing the need to incorporate the human dimension into Critical Zone analysis. Magnetic properties along soil profiles help detect these disturbances and separate depositional events from post-depositional changes, making magnetic mineralogy a useful tool for interpreting recent floodplain evolution and Critical Zone responses to human impacts.
From a biogeochemical perspective, urbanization introduces pollutants and alters nutrient dynamics. Soil compaction changes pore structure, reducing permeability and gas exchange. In addition, lower inputs of plant-derived organic matter modify soil carbon storage (Yu et al., 2024).
This work also allowed the evaluation of anthropogenic impacts on the geochemical environment. Magnetic susceptibility, ARM/SIRM profiles, and the thermomagnetic curves reveal a great distinction between the PET-1 region, located very close to the Tietê River and the park’s lagoon, and PET-2, further away from the park. One hypothesis raised from this work is that the change in the magnetic properties of PET-2 reflects geochemical alterations caused by the interaction of the environment with the waters of the Tietê River, at depths greater than 6.0 m. This feature is interpreted as the hyporheic zone, a critical interface between surface water and groundwater, occurring beneath and adjacent to stream beds where dynamic mixing of these waters takes place. It is situated within saturated streambed sediments, extending laterally or vertically depending on geology (from centimeters to tens of meters).
The hyporheic zone is far more than a physical transition layer; it is a dynamic nexus where hydrology, ecology, and geochemistry converge. The dynamic interface results in distinct redox gradients, impacting the transport of redox-sensitive metals from the hyporheic zone to the local watershed, thereby influencing the overall nutrient cycling and water quality. The interaction of iron-bearing particles within hyporheic zones involves complex biogeochemical processes influenced by redox gradients, mineral solubility, organic matter interactions, and hydrological connectivity. These zones have been recognized as hotspots for biological activity and cycling of metals and nutrients (W. Dong et al., 2020, and references therein).
Redox reactions of iron widely influence the biogeochemical cycles of nutrients (e.g., carbon) as well as the transport of contaminants such as chlorinated compounds in aquifers (Kappler, Bryce, et al., 2021, and references therein). The production and release of iron are critically important for geochemical processes in hyporheic zones. For example, release rates of soluble Fe (II) species resulting from microbial dissimilatory Fe (III) reduction in these zones are not fully understood, and could be controlled by site-specific geochemical factors such natural organic matter (W. Dong et al., 2020).
Redox transformations of iron, such as dissolution and precipitation and, consequently, the availability of this element, are caused by chemical processes, generally mediated by microorganisms (Kappler, Bryce, et al., 2021). The oxidation of Fe (II) can occur under oxic or anoxic conditions, while the reduction of Fe (III) occurs in anoxic environments, influencing the dynamics of organic and inorganic pollutants (Kappler and Straub, 2005).
Based on the physical and chemical parameters measured in the water from the monitoring wells, seasonally, the environment was characterized as reducing, with circumneutral pH. In these environments, despite the low solubility of Fe (III) minerals, complexation by organic compounds can lead to high concentrations of dissolved Fe (III) (Cornell and Schwertmann, 2003), as observed in the chemical analyses of the water. The highest levels of total Fe and dissolved Fe occurred precisely in well EACH-1, where the sediments rich in organic matter are deposited.
Sampling with the Dutch auger was not very efficient for recovering the samples, especially below the water table. In addition, it did not allow for greater detailing of the profile, due to the auger’s zone of influence being approximately 20 cm high. Therefore, it was difficult to accurately define the depths at which certain behaviors occur in the magnetic signatures, beyond the limits of the critical interfaces.
To minimize the effects of alterations resulting from sample handling and exposure to atmospheric air, measurements were performed in a manner that preserved collection conditions as much as possible. However, even during sampling, the brief exposure of samples, previously in a saturated and reduced medium, may have caused alterations in less stable and more reactive magnetic phases. The real extent of this oxidation process and how much it could affect the data could not be estimated.
Another important point concerns the significant influence of the paramagnetic signal of clay minerals, especially in the most reduced soil samples. Parameters dependent on magnetic susceptibility, such as SIRM/𝜒, influenced by the paramagnetic contribution, may have been underestimated, making a more reliable characterization of magnetic mineralogy difficult. This contribution also made it difficult to process and obtain saturation magnetization and coercivity parameters from hysteresis curves. Therefore, parameters calculated/obtained from magnetic susceptibility and hysteresis curves, although in agreement with other independent data (IRM curves, S-ratio, HIRM, ARM/SIRM), must be analyzed with caution.
Based on the information and data presented above, it would be interesting to also verify the seasonal influence on the magnetic parameters of the study areas. This could be used to investigate whether variations in physical–chemical parameters, such as oxidation–reduction potential and pH, particularly in water samples from the Tietê Ecological Park, imply changes in magnetic mineralogy. On the other hand, it could also be verified whether these variations indicate an influence on surface water bodies, particularly in the PET-1 well, located between the Tietê River and a lake in the park. This could be done using tracers inserted at specific points in the lake and river (Hissler et al., 2014), considering the local topography and hydrodynamics.
It would also be important to perform sampling with higher resolution, allowing for a more detailed characterization of the successions of sedimentary deposits and, consequently, of magnetic mineralogy. Due to the problems reported above regarding sample recovery, a more detailed collection could be focused on the vadose zone. This is because, in addition to the greater ease of sampling, it would also align with other geophysical methods whose signal is significantly influenced by soil saturation. This would allow for increased resolution in data acquisition by these other methods and would also be within the zone of influence of the vegetation root system. This would allow for more detailed characterizations of the geophysical properties and, consequently, more complete interpretations regarding the interaction of processes in the vadose zone.
In summary, despite the challenges, environmental magnetism suggests transformations that provide insights into biotic and abiotic processes. These dynamic processes are often affected by anthropogenic (e.g., soil pollution) and climatic (e.g., droughts and floods) impacts. Thus, environmental magnetism is a powerful tool in monitoring and understanding the resilience of CZ. In future studies of the São Paulo CZO, magnetic properties can help build a conceptual model of the site, placing the hyporheic zone with respect to the groundwater flow, placing biogeochemical hotspots that transform iron and therefore other minerals. With this conceptual model, it is possible to pursue the main goal of a CZO, which is to predict the CZ’s evolution.
6. Concluding remaks
PET and EACH revealed striking differences between soil analyses by geochemical and environmental magnetic techniques. One important interface can be identified at around 4.0–5.0 m deep, close to the Tietê River. This interface is most clearly visualized in the environmental magnetic parameters, which show mineral phases and grain size transformations of Fe-bearing mineral below this depth. This study also presents evidence of the influence of interfaces with different granulometric contributions and water saturation on variations in magnetic grain sizes. This is particularly important when it comes to urbanized regions, where there is anthropogenic deposition of unconsolidated material.
Sampling sites show differences in sediment layers successions, resulting from anthropogenic processes, such as rectification of the Tietê River, deposition of sediments taken from the river channel and backfill. Variations in magnetic mineralogy may indicate biogeochemical hotspots associated with the activity of methanogenic and iron-reducing bacteria (EACH-1) or the influence of polluted surface waters (PET-1).
Magnetic mineralogy applied to floodplain soils provides evidence of fluvial dynamics and human influence within the Critical Zone. It supports the assessment of system evolution and resilience under increasing anthropogenic pressure. Magnetic properties along soil profiles help distinguish depositional events from post-depositional changes, offering a useful basis for interpreting recent floodplain development and the response of the Critical Zone to human impacts.
Organic rich urban tropical soils present unique challenges with respect to the role of the climate of dissolved organic carbon and its controls over ecological ecosystems and biogeochemical cycles. The integrated interpretation of magnetic properties, physicochemical and geochemical parameters can reveal others dynamic interface, including the unsaturated/saturated and hyporheic zone, a known biogeochemical hotspot that drives Fe-bearing mineral transformations.
This work presents a CZO effort, in a key site within São Paulo Megacity that has witnessed different urban settings through time. The São Paulo CZO seed site is dedicated to exploring driving questions related to anthropogenic impacts on groundwater, soil and vegetation. In this context, environmental magnetism techniques, geochemical and biological analysis provided insights into CZ’s dynamics. Our results show differences in sediments that are related to anthropogenic processes. Variations in magnetic mineralogy indicate biogeochemical hotspots associated with land degradation. Characterizing the architecture and dynamics processes in the subsurface of an urbanized region allows an integrated understanding of the role of anthropogenic changes in the natural environment and the implications for ecosystem services.
São Paulo CZO seed site is the first investigation site self-called a CZO in Brazil. Today, there are a few CZOs dedicated to studying anthropogenic impacts on soils. However, the São Paulo CZO seed site is the first observatory installed in a highly urbanized context, in a subtropical climate. This puts this research in a position to generate unique data for soil resources anthropogenic impacts. The seed site has a long road ahead, still it is already enabling a better understanding of the feedback between biotic/abiotic processes and redox changes in organic-rich sediments. Nevertheless, other CZOs dedicated to studying anthropogenic impacts on soils in different climates can contribute to a better understanding of anthropogenic impacts on this essential natural resource.
Acknowledgements
The authors thank the São Paulo Research Foundation (FAPESP Grant no. 2021-14808-6) for funding the project and Conselho Nacional de Desenvolvimento Científico e Tecnológico (CNPq grant no. 304695/2022-0) for productivity scholarship. This work has been (partially) performed at USPMag lab at Instituto de Astronomia, Geofísica e Ciências Atmosféricas (IAG) at Universidade de São Paulo (USP) funded by CAPES/FAPESP/CNPQ.
Declaration of interests
The authors do not work for, advise, own shares in, or receive funds from any organization that could benefit from this article, and have declared no affiliations other than their research organizations.