





 CC-BY 4.0
This study is dedicated to the memory of our friend, Fabrice Grégoire, a most prevailing and inspiring figure for the study of mires.
1. Introduction
Metals are recognized as markers of past human activities, whether from mining, metallurgy and/or the use of metal artefacts that are responsible for the release of contaminated particles within ancient urban and remote ecosystems (Arnaud et al., 2005; Baron, Le Carlier, et al., 2009; Delile et al., 2014; Jouffroy-Bapicot et al., 2007; Kempter and Frenzel, 2000; Mighall et al., 2002; Monna, Galop, et al., 2004; Nriagu and J. M. Pacyna, 1988; J. M. Pacyna and E. G. Pacyna, 2001; Younes et al., 2024). To depict the transport and accumulation of trace metals is key, not only to our understanding of past atmospheric circulation (F. de Vleeschouwer, Cheburkin, et al., 2009; Martínez Cortizas, Biester, et al., 2007; Shotyk, Krachler, et al., 2002; Véron et al., 2014; Weiss et al., 2002), but also to unravel the onset of human industries and its historic recurrences in Europe (Guyard et al., 2007; Le Roux et al., 2004; Monna, Hamer, et al., 2000; Novák et al., 2003). Among these metals, lead (Pb) is of particular interest due to its production associated with Silver (Ag) as a secondary cupellation product (Agricola, 1556; Doe, 1970). It is also commonly found in non-ferrous deposits like an oxide or carbonate with Copper (Cu), Gold (Au) and Zinc (Zn). Its hardness but yet malleability, its resistance to corrosion and its antibacterial and welding properties made Pb one of the most common metal used by human societies since the 5th millennium BCE (Nriagu, 1983; Wertime, 1973; Yahalom-Mack et al., 2015). Greek and Roman societies significantly enhanced its mining and usage between the 7th c. BCE and the 5th c. CE (Lessler, 1988; Pliny [the Elder], 23–79 CE; Settle and Patterson, 1980). This exploitation resulted in a factor 10 to 100 increase of Pb deposition in natural wetlands (Brännvall, Bindler, Emteryd and Renberg, 2001; Renberg, Bindler, et al., 2001; Shotyk, Weiss, et al., 1998). Lead also has 4 stable isotopes, 204Pb, 206Pb, 207Pb and 208Pb, the last three being the end product of the natural Uranium (U)–Thorium (Th) decay chains. The relative abundance of these isotopes in geological reservoirs vary according to the initial Th and U concentrations and the age of the geological bodies (Doe, 1970). As such, Lead Isotope Analysis (LIA) shall differ between various geological reservoirs, and most particularly among ores (Brill and Wampler, 1967; Gale and Stos-Gale, 1982; Gale and Stos-Gale, 2000; Stos-Gale and Gale, 2009). The imprint of the latter in sedimentary deposits allows for distinguishing the geographic provenance of the ores from which contaminant Pb originates in natural reservoirs such as lakes and peat bogs (Eades et al., 2002; Le Roux et al., 2004; Klaminder et al., 2003; Monna, Hamer, et al., 2000; Novák et al., 2003; Renberg, Brannvall, et al., 2002; Shotyk, Weiss, et al., 1998; F. de Vleeschouwer, Gerard, et al., 2007) that are suitable proxies for the record of metal imprints (Brännvall, Bindler, Emteryd, Nilsson, et al., 1997; Monna, Galop, et al., 2004; Shotyk, 1996; Shotyk, Krachler, et al., 2002; Shotyk, Goodsite, et al., 2003; G. de Vleeschouwer et al., 2010; Weiss et al., 2002; Thevenon et al., 2011). As noted by Brännvall, Bindler, Emteryd, Nilsson, et al. (1997) and Thevenon et al. (2011), both proxies offer distinctive benefits regarding dating, continuous atmospheric deposition record, geographic situation and their capabilities to accumulate trace elements and to preserve its distribution within the cores. Peats mirror atmospheric metal transient input owing to their exclusive autochthonous organic plant content and their seclusion from surface and ground water drainage. Proper 14C dating of its organic remains allow to reconstruct deposition dynamics and to decipher the source and accumulation rates of natural dust, pollutants and pollen (Chen et al., 2022; G. de Vleeschouwer et al., 2010; Jara et al., 2017; Martínez Cortizas, Pontevedra-Pombal, et al., 1997; Martínez Cortizas, Garcia-Rodeja, et al., 2002; Romey et al., 2015; Shotyk, Weiss, et al., 1998; Shotyk, Goodsite, et al., 2003). The latter are effective in order to reconstruct vegetation cover in relation to known climate eras (Iversen, 1949; Penalba, 1994; Van Geel, 1978), and therefore help establishing proper age models in peat cores.
The French Massif Central (FMC, Figure 1) is one of the oldest mining areas in western Europe (Baron, Tămaş, et al., 2019; Domergue, 1987; Milot et al., 2022). Its main mining activities were clearly identified during the Middle Ages and the modern industrial period with Antimony (Sb), Au and, more recently, U being the prime mining products (Bril et al., 1994; Ploquin et al., 2010). Fluor (F), coal and kaolin were among the other resources that complemented metal supplies (Bril et al., 1994) and were intensively excavated since at least the 19th century. Significant economic deposits of metals such as Pb, Zn, Cu and Au have likely been extracted at earlier periods during the Iron Age (Baron, Tămaş, et al., 2019; Cauuet, 2000; Trément et al., 2018), prior to the Roman occupation of which little is known regarding metal works from the FMC. Its influence on the production and export of metals has been overshadowed by other sources from Spain, Germany or Great Britain, most particularly during the Roman period. Meanwhile, recent studies have shown that metals were mined and exported from the FMC during the Roman Empire (Baron, Mahé-Le Carlier, et al., 2010; Flaux et al., 2023; Pagès et al., 2022). The Rhône River may have favoured metal trades between southern Gaul and northern territories (Bonifay et al., 2007; Domergue and Rico, 2018). Our main objectives are to decipher regional and long-distance metal contamination in a remote peat core in Massif Central and to assess their geographic source imprints using the marker capability of Pb that was almost continuously mined, at least since the Middle Ages, in the FMC (Allée et al., 2010; Bailly-Maître et al., 2013; Baron, Lavoie, et al., 2005; Elbaz-Poulichet et al., 2017). We intend to (i) decipher the contribution of various regional, and foreign ore imprints, and mix thereof, in a remote peatland within the FMC and (ii) contribute to our understanding of historical recurrences of metal extraction from the FMC, most particularly prior to the Middle Ages.
Location of the Narcettes peat core (filled black circle) in the Chassezac Valley and main regions presented in this research.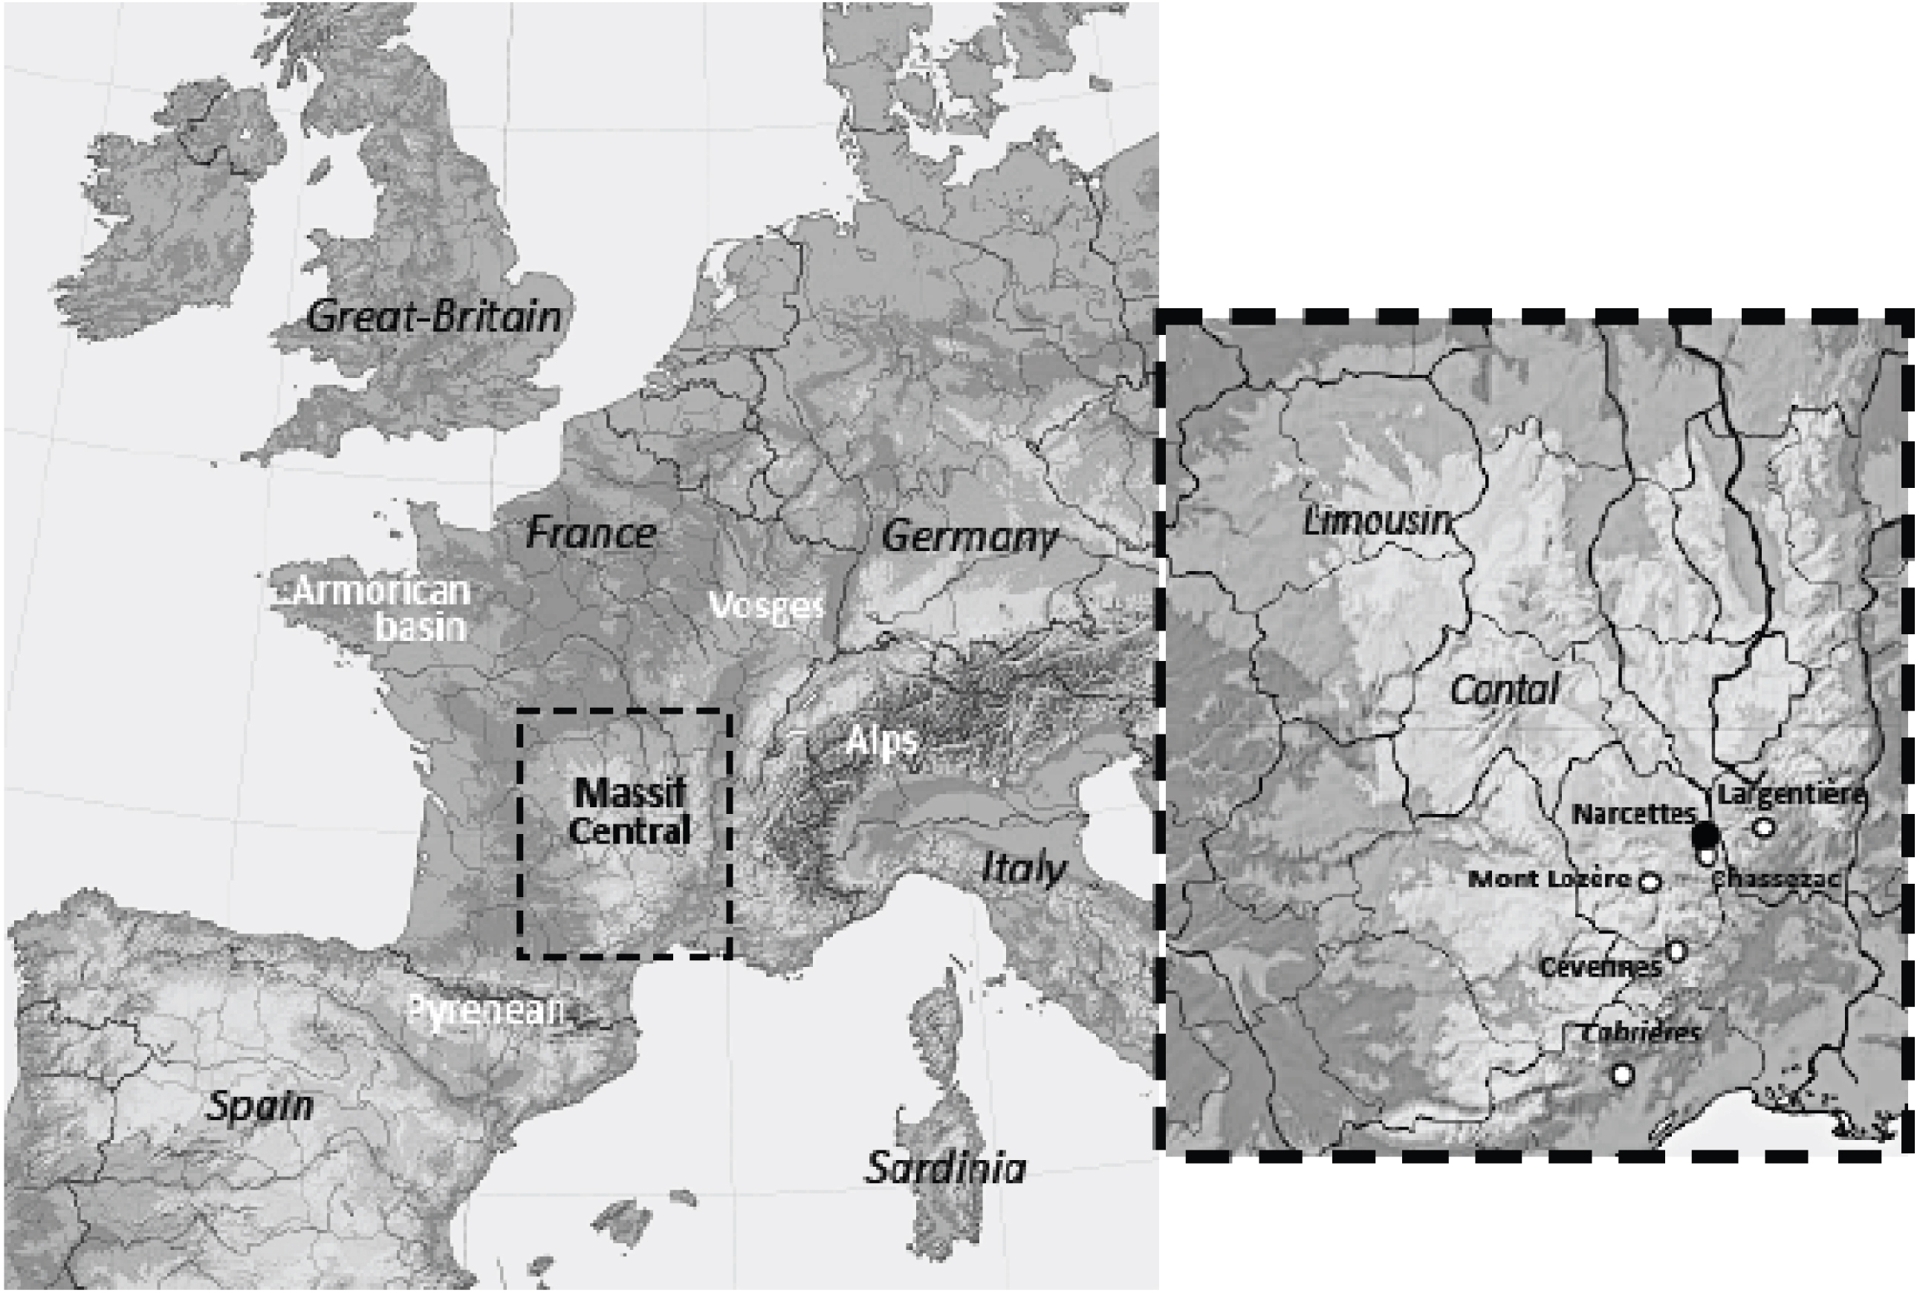
2. Coring site and methodology
2.1. The Narcettes core
Our coring site is located in the Narcettes peatland, on the Plateau de Montselgues, abruptly overhanging the Chassezac Valley (Figure 1) where discontinued minor mining activities have been described from the Middle Ages until the 20th century (Bailly-Maître et al., 2013). The altitude of this site at 1036 m (NGF) allows for the intercept of aerosols from regional and/or long-distance provenance. The Narcettes is constituted of several discontinuous peat areas over a total surface of 104 km2 with a maximum accumulation of 0.9 m. Owing to the shallowness of the peat, we expect a low stratigraphic resolution. Therefore, we shall not focus on a continuous transient accumulation of metal imprints, but rather on distinct historical periods to assess the significance of the FMC in metal production, most particularly during and prior to the Middle Ages. The occurrence of a substantial clay layer between a Triassic aquifer (sandstone slab) and the underlying granitic bedrock has greatly favored the emergence of the Narcettes humid area. The closest mining district is located 5–10 km south of the Narcettes peatland, in the villages of Sainte-Marguerite-Lafigère and Montselgues where was evidenced Pb and Ag mining between the 11th and 13th centuries (Bailly-Maître et al., 2013). In situ ore crushing and calcination were clearly attested, while little or none metallurgical processes were observed (Minvielle Larousse, Commandré, et al., 2019). Although this mining district never reached the importance of other medieval sites such as those located in northeastern Europe (Alsace, Tyrol, Bohemia), we shall investigate its potential imprint in our peat core record. Most interestingly, the Narcettes peatland is situated just 50 km from the mont Lozère mountains where a significant Pb and Ag exploitation has been evidenced during the Middle Ages (Baron, Lavoie, et al., 2005; Baron, Mahé-Le Carlier, et al., 2010; Laurent, 2005; Ploquin et al., 2010) and 20 km from the Largentière valley, where there was another significant Pb and Ag mining activity in the Middle Ages, and during the modern period (Fogliérini et al., 1980; Bailly-Maître, 1996; Girard, 2003). Our peat core (MS1) was collected with a Russian GIK-type coring system (8 cm diameter, 62 cm length, Lambert93 X780149.190 Y6379313.896) in a PVC plastic tube and kept in a refrigerated chamber (at 6 °C) before sub-sampling for palynological and geochemical analyses. The stratigraphic description of the peat clearly attests to its ombrotrophic nature (Supplementary Figure 1) with only two embedded organic clay layers that account for less than 10% of the core. More relevant information regarding the Narcettes coring site can be found in Minvielle Larousse, de Beaulieu, et al. (2016).
2.2. Subampling and analyses
Peat samples for pollen analyses were collected each 1.5 cm along the core (41 samples). Samples of 10 g each were prepared according to Nakagawa et al. (1998) using 10% HCl, 40% HF, 10% KOH and acetolysis. Palynological identification was performed using IMBE reference collections and photographic atlases (Reille, 1992; Reille, 1995; Reille, 1998). Taxa dynamics were statistically sequenced with cluster analysis using the FORTRAN 77 CONISS program from the rioja package (Grimm, 1987; Juggins, 2012).
Fifteen peat samples were collected along with pollen samples and preserved in cleaned plastic bags before drying at 60 °C before geochemical analyses (trace metals and stable Pb isotopes). Approximately 50 mg of dried peat sample were digested in a microwave nitrogen pressurized sealed chamber (UltraWave Thermo-Scientific) at high temperature (250 °C) and pressure (100 bar) with a mixture of ultrapur HNO3, HCl and HF concentrated acids. Blanks and standards were processed along with the samples. A galena sample from a nearby mining district (Le Colombier) was also processed with diluted HNO3 (1:5) before LIA. A fraction of the digested solution was analyzed for trace metals by Inductively Coupled Plasma Mass spectrometry (ICP-MS quadrupole Perkin Elmer Nexlon 300X). Processed blanks accounted for less than 0.1% of the sample content while the Analytical Relative Deviation (RSD) was less than 5% for measured elements. Accuracy is verified using the NRCC HISS-1 sediment standard (Supplementary Table 1). All trace elements are within the range of the certified value with the exception of Titanium (Ti) which is 10 to 15% lower than the certified value. Stable Pb isotope ratios were measured using a Neptune+ MC-ICPMS (Multi-Collector Inductively Coupled Plasma Mass Spectrometer) at CEREGE (CNRS, France), after Pb extraction and purification on AG1X8 resins (Manhès et al., 1978). The isotope ratios were normalized by multiple analyses of the NBS981 standard. Analytical uncertainties (one standard deviation) for the measured Pb isotope ratios were 0.01% and 0.03% for 206Pb/207Pb, 208Pb/206Pb and 206Pb/204Pb, 207Pb/204Pb, 208Pb/204Pb ratios respectively for 1 to 10 v signals. Trace metals and LIA are presented in Supplementary Tables 2 and 3 respectively. Geochemical univariate and multivariate statistical analysis (Principal Component Analysis, correlation, comparison tests, and descriptive statistics) were performed with Past4 statistical package software (Hammer et al., 2001).
Radiocarbon dating was performed on 5 organic samples at the Poznam Radiocarbon Laboratory (Poland) and is presented in Table 1. Age models were calculated using the R Clam package (Blaauw, 2010) that are discussed in the next section according to pollen records. Modelled ages are presented in year BP or age [BCE-CE] with their best estimates. Our chronology is based upon five 14C dates from which we calculated a smooth spline continuous age model (Supplementary Figure 2). Because of lacking accurate recent dating, all dates from the smooth spline model for depths above 23 cm were speculative assessments with dates younger than 250 years old (0–18 cm) and 500 years old (19–22 cm) based on 14C dates and the smooth pline model (Supplementary Table 4).
14C calibrated ages in the Narcettes peat core. The calibrated age at 12–13 cm is likely out of range with dates younger than 250 years old.
| Depth (cm) | Material dated | Lab. reference | Age uncal. BP | Age cal. (2 sig.) |
|---|---|---|---|---|
| 12–13 | Peat | Poz-105082 | 85 ± 30 | Out of range* |
| 22–24 | Peat | Poz-105083 | 420 ± 30 | 331–523 |
| 32–35 | Peat | Poz-105125 | 2410 ± 30 | 2354–2491 |
| 42–44 | Peat | Poz-105126 | 4305 ± 35 | 4831–4960 |
| 57–58 | Peat | Poz-84219 | 5960 ± 40 | 6675–6888 |
3. Palynology and age model
The pollen diagram of the MS1 core is shown in Figure 2. It describes the transient distribution of pollen grains from various taxa expressed in percentages. The fern Osmunda regalis was excluded from the pollen sums because its over-representation would have concealed other taxa. We identified 7 biostratigraphic domains that included from bottom up:
Pollen diagram (%) from the Narcettes peat core with corrected 14C dates, corresponding biostratigraphic domains and lithology.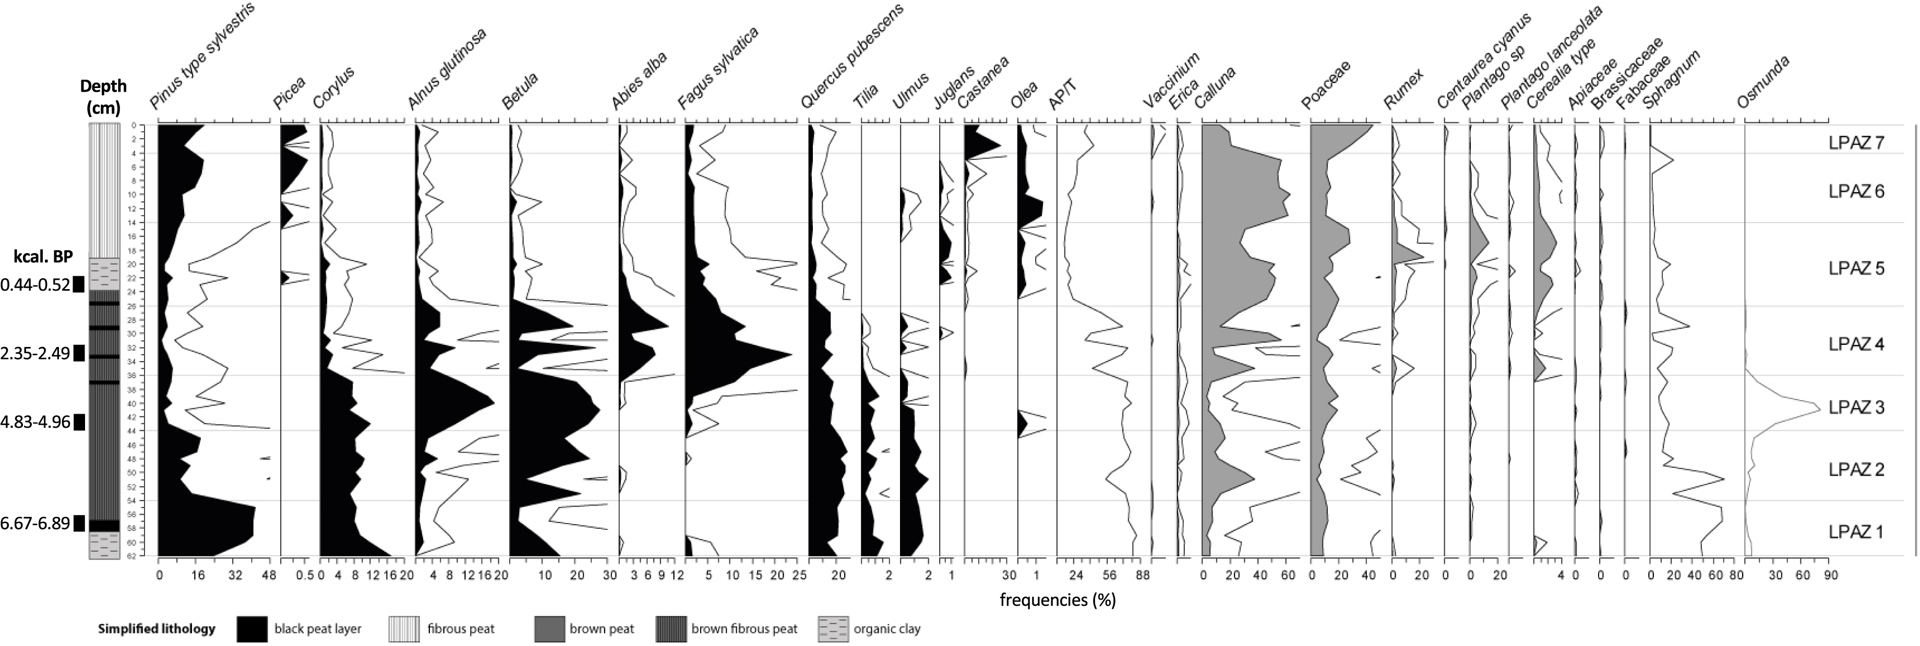
LPAZ1 (62.5–53.5 cm), a mixed temperate coniferous forest type dominated by Pinus with Quercus and Corylus. Ulmus and Tilia also contribute this woodland with Betula that slowly declines toward the top of the sequence;
LPAZ2 (53.5–43.5 cm), characterized by a significant decline in Pinus and increase in Betula that may highlight peatland expansion that seems to be characterized by oscillations between humid (Betula) and drier (Calluna) periods;
LPAZ3 (43.5–36.5 cm), a humid period during which Pinus almost vanishes and Fagus is clearly established with prevailing humid taxa (Betula, Alnus) and the disappearance of Calluna. It should be noted that the fern is abundant from 40–42 cm on. The onset of Olea (olive tree) evidenced in LPAZ3 is likely imported from the southern Mediterranean hillside of the Cévennes mountains, and may not characterize the birth of arboriculture in the vicinity of the peatland;
LPAZ4 (36.5–25.5 cm), an optimum for Pinus and Fagus, and a sharp decline in Ulmus, Corylus and Tilia. The alternate sequences of Betula, Alnus and Calluna depict hydrological oscillations within the peatland. Markers of pastoralism (Rumex, Plantago) and cultivation (Cerealia, Juglans) clearly arise;
LPAZ5 (25.5–14.5 cm), woodland declines (except for Pinus), while taxa associated with agro-pastoralism rise, as well as Calluna that pervades into deforested non cultivated areas. Juglans is at its peak and pollen from olive trees cultivated at lower altitudes also significantly rises;
LPAZ6 (14.5–3.5 cm), Calluna is at its peak while agro-pastoralism declines (except for Olea from lower altitudes). Pinus increases with small P. sylvestris pollens along with large P. nigra or maritima that may originate from artificial reforestation during the 19th century. The latter is corroborated by the occurrence of planted Picea (spruce) that was not encountered in the FMC since the last glacial maximum (de Beaulieu et al., 1988);
LPAZ7 (3.5–0 cm), is characterized by a decline in Calluna for the benefit of grassland taxa and the onset of chestnuts.
Several well-dated pollen sequences were determined in the vicinity of the Narcettes peatland which could be compared to our record. They showed the onset of beech wood between LPAZ3 and LPAZ4. According to our smooth spline model it would have occurred circa 3100 BP. Meanwhile, this beech transition is dated to 4770 ± 100 and 3862 ± 100 uncal BP in the nearby Velay and Ardèche areas (de Beaulieu et al., 1984; Dendievel et al., 2019). These results suggest that our smooth spline model may provide younger calculated ages for the level 34–36 cm. The calibrated age at 32–35 cm (2354–2491 cal. BP) (Table 1) is well comprised within the modelled smooth spline age at this depth interval (2200–2870 BP) suggesting that the smooth spline model remains valid at this depth. Including a hiatus would reduce the uncertainties in the age model. On the contrary, in LPAZ4, the relative abundance of Abies that rises during the late Iron Age (suboreal-subatlantic transition) and the onset of Carpinus at 33 cm, generally found around 2000 BP in the FMC, is found at 2270–2570 BP with our calculated age model. In this former occurrence the smooth spline model provides slightly older calculated ages. Owing to these uncertainties, we assume that both palynology and the recorded lithography (Supplementary Figure 2) cannot resolve possible lessening peat accumulation that may have resulted from less favorable geomorphological and climate settings. We therefore consider that the less accurate smooth spline age model reasonably fits the well-dated anthropogenic influence during LPAZ3 and LPAZ4 biostratigraphic zones. Supplementary Table 4 shows the corresponding modelled ages at each sample depth being analyzed for metals and stable Pb isotopes in the core. The levels from 3 to 18 cm (D1 to D4) are younger than 250 years old, while the 19 cm level (D5) is younger than 500 years old based on the uncertainties of the smooth spline model and the biostratigraphy.
4. Metal imprint and accumulation
4.1. Metal enrichments
Trace metal concentrations are shown in Supplementary Table 2. Concentration of trace elements is significantly higher in the top 25 cm, with the exception of crustal Ti and Aluminum (Al) (Supplementary Table 2) that are known to vary according to the mineral content within a core. This can be seen in the Narcettes core where Al and Ti concentration increase by about a factor 2 (Supplementary Table 2) in two organic clay layers at 21–23 cm and 58–62 cm (Supplementary Figure 2) as expected from the clay contribution. Its effect on trace element concentration is significant at 58–60 cm for Pb and Sb concentration that increase by a factor 2 to 4 (Supplementary Table 2). We need to take into account this mineralogical contribution and its effect on trace metal concentration in the core. Here we use the ratios of metals to a crustal-derived element to best evidence these enrichments above the natural background. This normalization using crustal elements allows to take into account various lithologies in the core that are characterized by different trace metal concentration. Both Ti and Al can be used as crustal markers. They are significantly correlated (r = 0.9; p < 0.001) suggesting that we do not encounter major mineral shift in the core that would not be taken into account by either of these crustal-derived elements. This normalization allows for characterizing trace metal background and to calculating excess fractions that may originate from human activities (for concentration and Pb isotopes). We choose Al as a crustal marker rather than Ti that displays a lesser accuracy than Al (Supplementary Table 1). The ratios of metals to Al are shown in Figure 3 where specific shifts can be noticed that include from top down: (A) an enrichment of all trace metals above 18 cm, i.e., younger than 250 yr (estimated age model), that would correspond to atmospheric deposits since at least the 18th century. While Pb, Nickel (Ni), Cu and Zn keep increasing up to the top of the core, Sb and Arsenic (As) display a peak between 6 and 11 cm followed by a decline in the top core. Because of uncertainties with young 14C dates and our smooth spline age model, we cannot describe with accuracy these transient shifts. It would have been necessary to use adequate radiomarkers for recent deposition stratigraphy such as 210Pb and 137Cs. Meanwhile these variations in metal content are consistent with the known pre-1950s industrial activities that may indicate both the rise and phasing out of regional mining (marked by Sb and As exploitation), and the imprint of regional contaminants; (B) slight but noticeable contamination imprints for Pb and Sb can be seen down to 31 cm at 1880–2130 BP [70 CE–180 BCE, best at 50 BCE], covering the Late Iron Age and the Early Roman period; (C) there is no further visible enrichment for As, Pb and Sb down to the bottom of the core; (D) a peak centered at 47–51 cm, i.e. 5400–6030 BP [3.2–4.1 ky BCE] is clearly discerned for Zn, Cu and Ni that shall be discussed considering regional metal mining during the late Neolithic period. Trace metal trends A and B clearly signify the input of metal excesses caused very likely by human activities. It should be noticed that the Coefficient of Variation of these ratios (CV: ratio of standard deviation to corresponding mean) vary from 85 ± 10% to 48 ± 17% for Pb, As, Sb and Cu, Ni, Zn respectively indicating the more sensitive response of the priors to anthropogenic input.
Ratios of Metals (Me) to Aluminum (Al) in the Narcettes peat core. Me/Al ratios are multiplied by 103 (Pb), 104 (As, Cu, Ni, Zn) and 105 (Sb).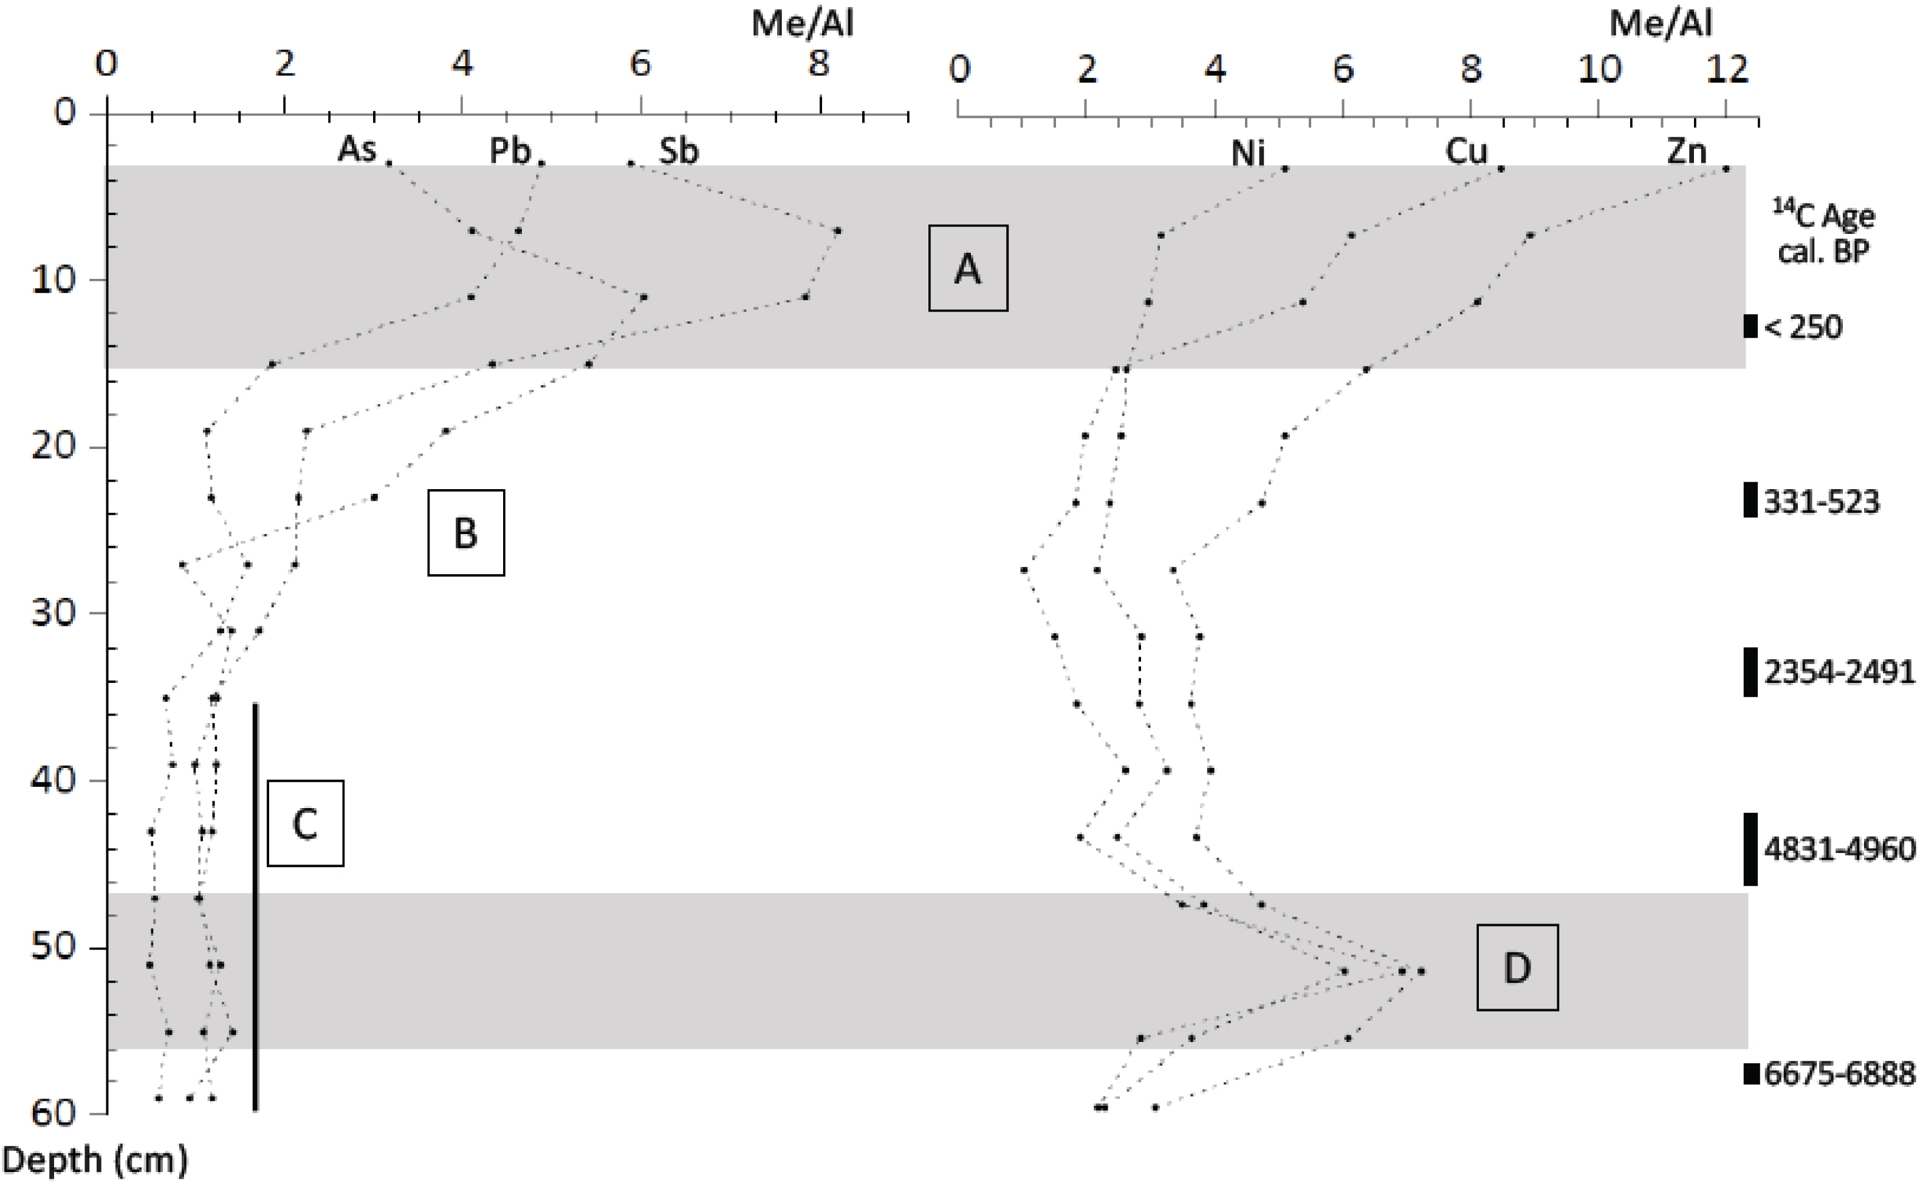
4.2. Lead imprint
Lead isotopes of which ratios are efficient markers of anthropogenic enrichments into peat cores (Le Roux et al., 2004; Klaminder et al., 2003; Monna, Hamer, et al., 2000; Monna, Galop, et al., 2004; Shotyk, Weiss, et al., 1998; F. de Vleeschouwer, Gerard, et al., 2007) allow to signify the main natural and excess fractions in the Narcettes core (Supplementary Figure 3). The 207Pb/204Pb versus 206Pb/204Pb graphic significantly seclude the top core sample (D1, 3 cm) from the rest of the samples that are aligned upon the same isochron (Supplementary Figure 3). This should be taken into account when investigating the mines from which may originate Pb accumulated at 3 cm. Furthermore, we could predict a more significant crustal fraction that is consistent with the mean crustal imprint line at a depth below 34 cm.
In order to discern the enriched and natural fractions in the core, we perform a Principal Component Analysis (PCA) that includes both Pb normalized concentration and stable isotopes (206Pb, 207Pb and 208Pb isotopes). This statistical approach has shown its usefulness in recent provenance studies using Pb and its stable isotopes (Albarede et al., 2024; Tomczyk and Żabiński, 2023). Two main components are extracted that can explain most of the data variability (PC1: 94%; PC2: 5.7%). In Figure 4, samples are identified by their mean depth and are grouped according to their scores, i.e., the contribution of each variable to PC1 and PC2 on component axes. All depths that are clearly enriched in Figure 3 display positive PC1 scores (3–31 cm, trends A and B) with the top depths (3–11 cm) being noticeably defined. Upper sections of the core and its large enrichments could not be properly dated and likely correspond to the past 250 years in coincidence with the modern industrial rise in western Europe. The A–B cluster between 15 and 31 cm covers most of the period from the so-called “industrial revolution” to the Roman period. The C trend (Figure 3) can be subdivided into 2 clusters, C1 and C2, in the PCA, (Figure 4). Cluster C1 could be altered by the D trend that shows Cu, Ni and Zn enrichments at the same depths during the 4th millennium BCE (Figure 3) while C2 may represent the depths at which the background is best expressed.
Principal Component Analysis (PCA) for Pb/Al, 206Pb/207Pb and 208Pb/206Pb ratios. Components PC1 and PC2 account for 99.7% of total variability.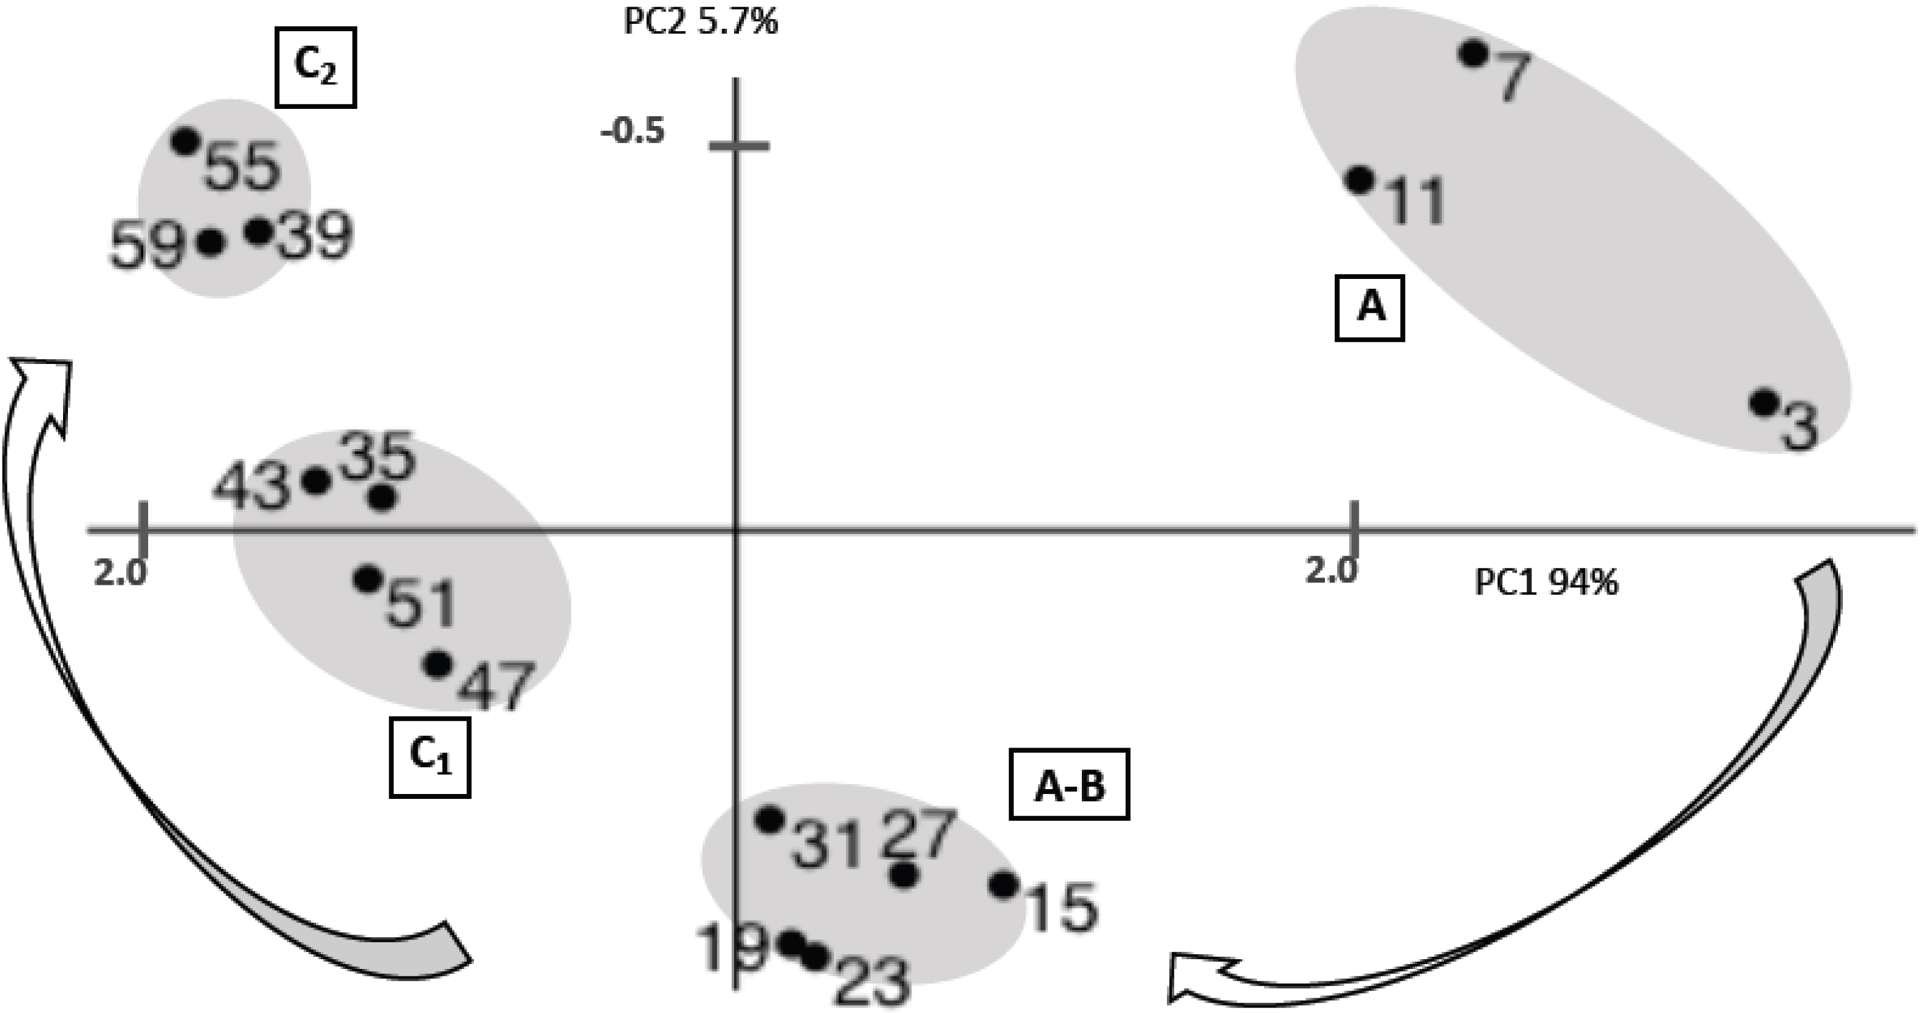
To best investigate accumulation spikes observed in the Narcettes core (Figure 3), one can calculate the contribution of excess Pb (Pbxs) above the natural imprint in the core using the background as defined by the Pb/Al ratios and the PCA:
| \begin {equation*} \mathrm {Pb}_{\mathrm {xs}} = ([\mathrm {Pb}]_{\mathrm {t}} - ((\mathrm {Pb}/\mathrm {Al})_{\mathrm {c}} \times [\mathrm {Al}]_{\mathrm {t}}))/[\mathrm {Pb}]_{\mathrm {t}} \end {equation*} |
The Pbxs (%) fraction at each level is displayed in Figure 5 along with corresponding PC1 z-scores, 206Pb/204Pb and 207Pb/204Pb ratios. The crustal isotopic imprint in Figure 5 is calculated from the largest possible natural imprint using the combined 206Pb/204Pb and 207Pb/204Pb ratios as calculated from cluster C2 (see PCA analysis, Figure 4). All of the markers show significant metal Pb excess during the past 2000 years. The human Pb imprint during the Late Iron Age and Early Roman period at 31 cm [70 CE–180 BCE, best at 50 BCE] is clearly expressed with a calculated Pbxs contribution of 50% and isotopic ratios noticeably different (p < 0.001, student t test) from the mean crustal 206Pb/204Pb and 207Pb/204Pb ratios (18.886 ± 0.031 and 15.698 ± 0.003 respectively). There is a 20% Pbxs enrichment at 39 cm [1570–2010 BCE, best at 1840 BCE] with isotopic ratios that are not statistically different from expected crustal imprint. This discrepancy raises the limits of these calculations with weak metal enrichments that are to be used cautiously. This is why we only consider possible human imprints when corroborated by several markers. At last, the D trend (46–52 cm) is clearly defined by 206Pb/204Pb and, to a lesser extent, 207Pb/204Pb ratios that are statistically different from the crustal isotopic imprint (p < 0.05, student t test) and a significant increase in the PC1 z-scores (Figure 5). Meanwhile there is no Pbxs enrichment at these depths. While plausible, this human imprint during the 4th millennium BCE remains speculative.
Calculated Pbxs fraction, PC1 z-scores, 206Pb/204Pb and 207Pb/204Pb ratio (along with crustal isotopic range) in the Narcettes core. A, B, D are enriched levels from Figure 3. See Section 5 for explanations regarding calculated indices.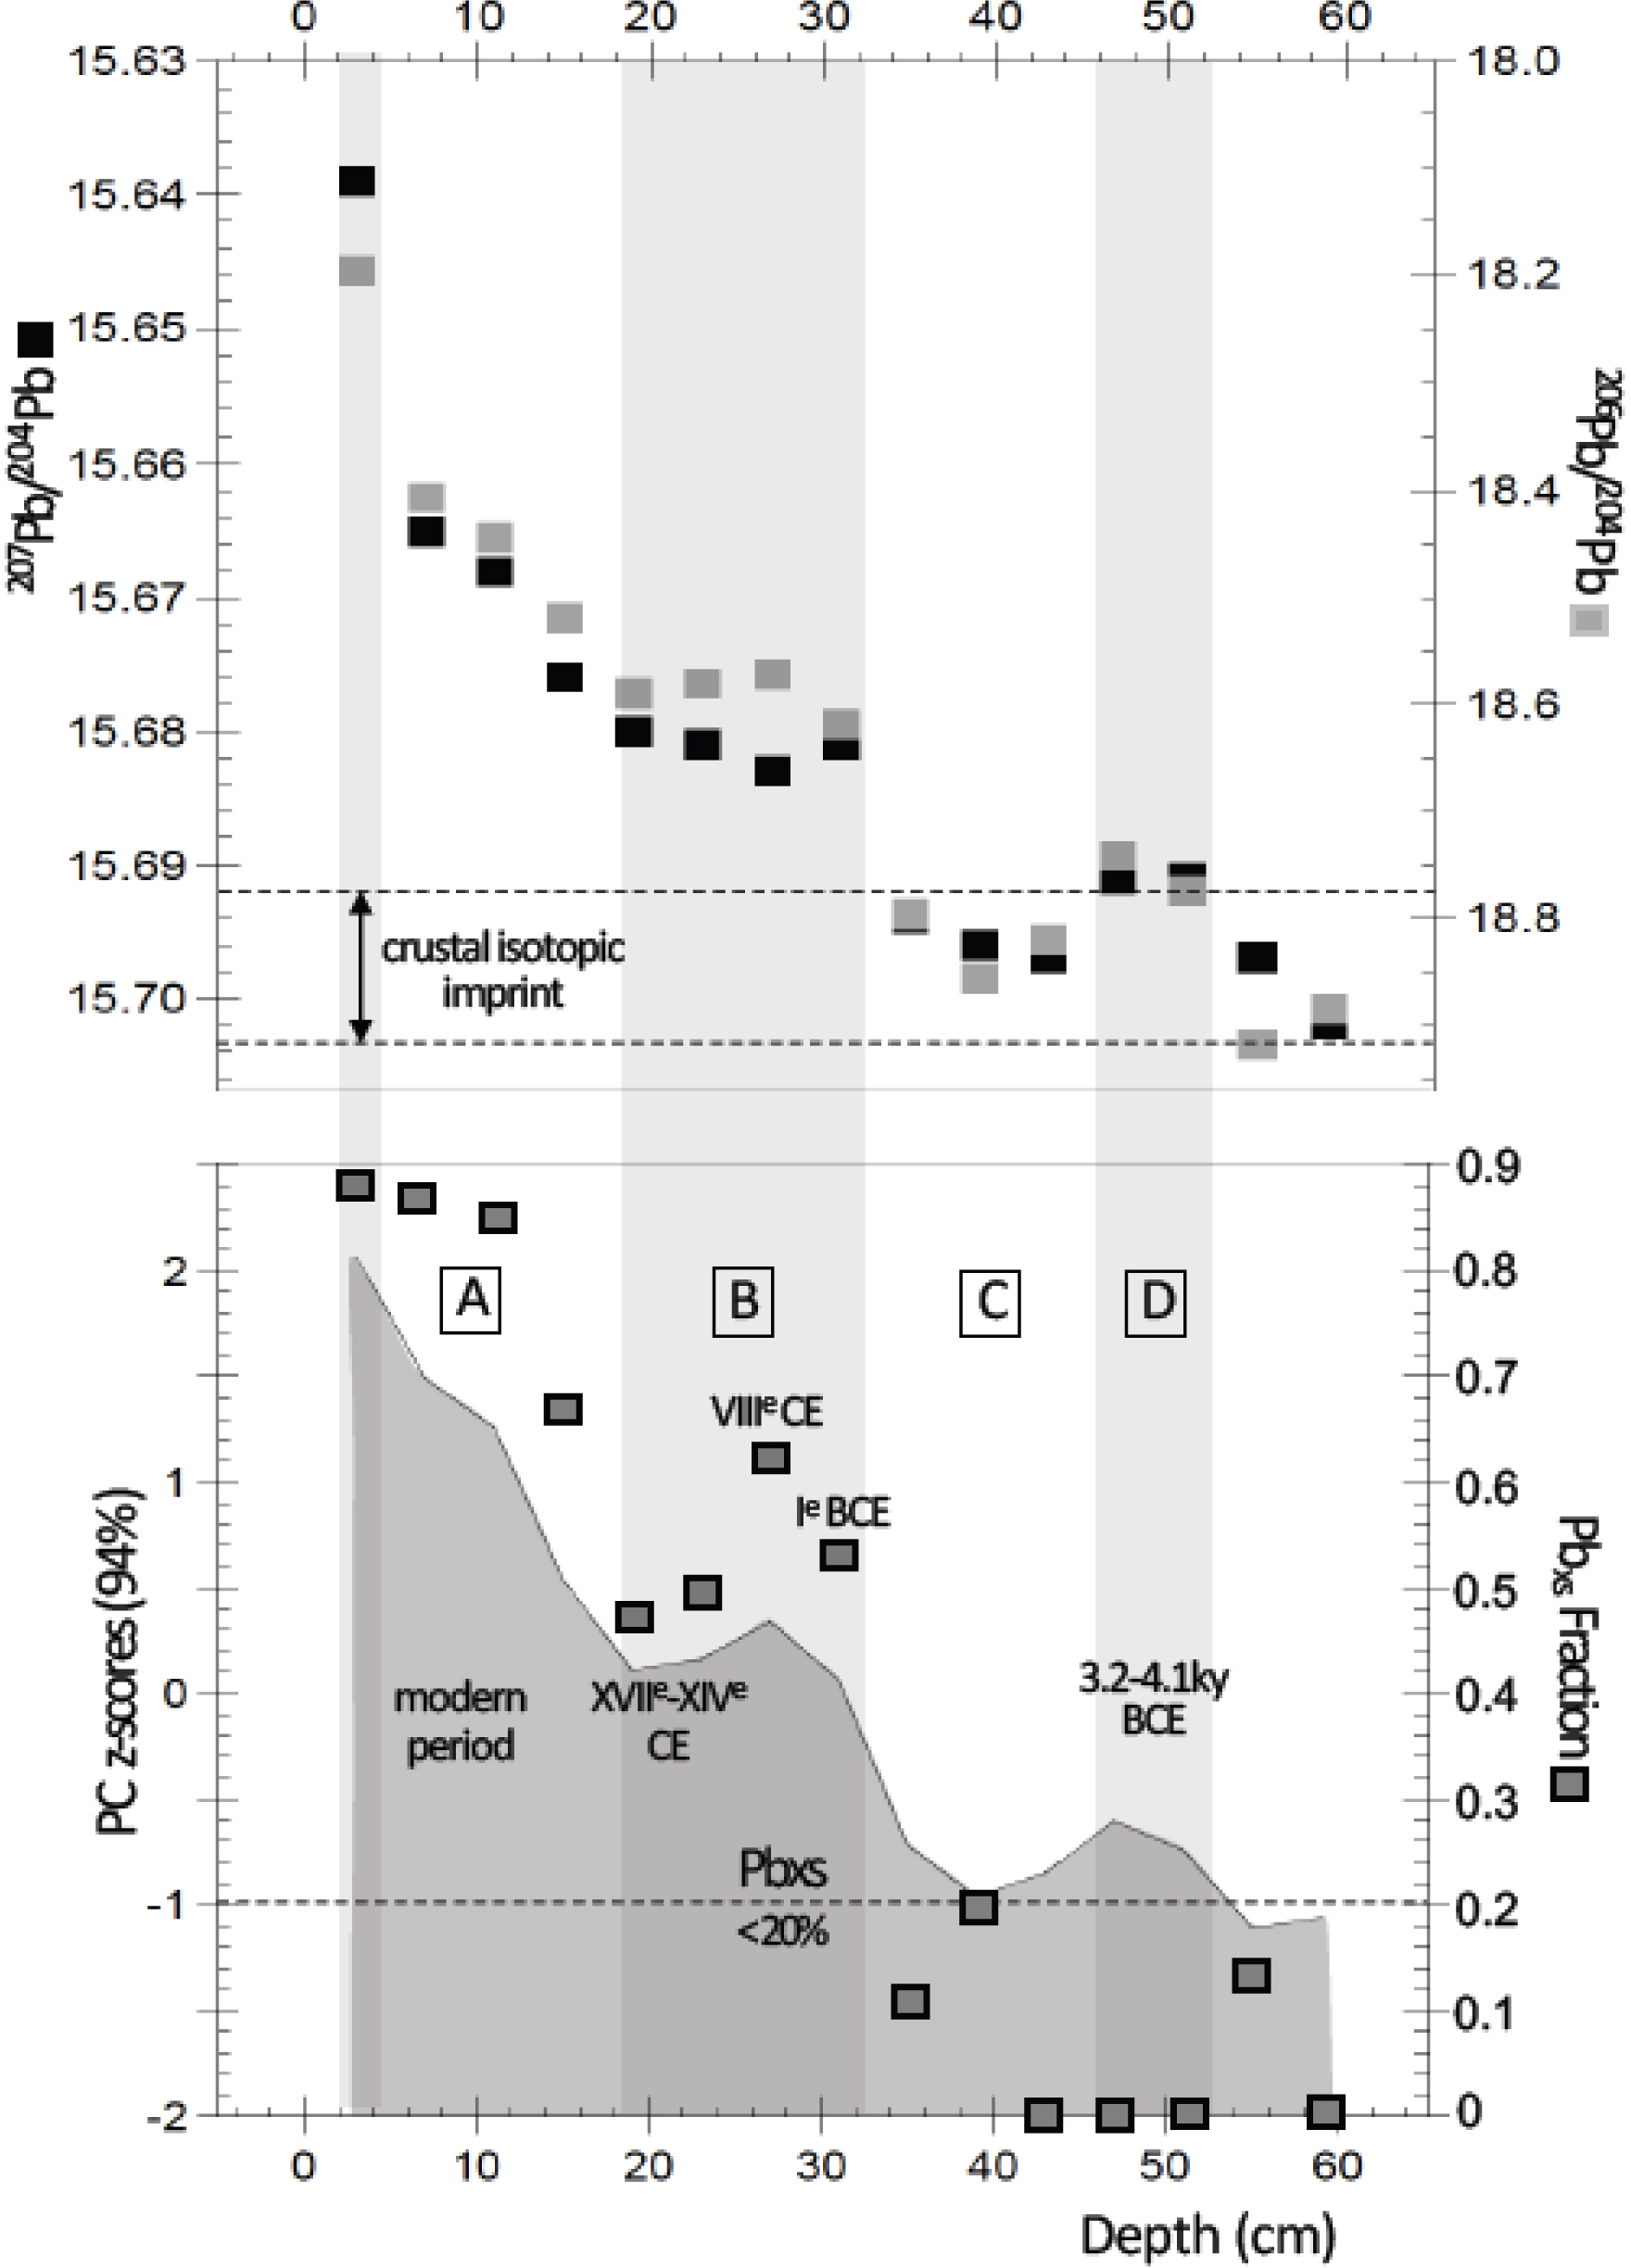
The significant Cu, Zn and Ni excesses at 46–52 cm (D trend in Figure 2) includes the D12 and D13 samples that are best dated to 4080–3450 BCE with the smooth spline model (Supplementary Table 4). While it is characterized by significantly non crustal 206Pb/207Pb ratios (Figure 5), it could not be explained with Pb systematics as there are no significant Pbxs at these depths. This lack of Pb enrichment and a non-crustal Pb isotope imprint suggest a contamination source possibly from volcanic activity and/or Cu ingots smelting rather than Pb mining. The Pb isotope radiogenic signatures from the main eruptive areas in western Europe do not comply with LIA in the Narcettes peat at these depths (Holm et al., 2001; Thirlwall et al., 2004; Wittig et al., 2007). The inception of a significant Cu metallurgy in western Europe was commonly found during the IIIrd millennium BCE onwards (Hamon et al., 2020; Raack and Risch, 2008). Earlier Cu smelting occurrences are scarce that could explain such contamination during the 4th millennium BCE in central and eastern Europe (Radivojević et al., 2010; Ryndina et al., 1999). Meanwhile there is an occurrence, just 100 km away from the Chassezac Valley, in the Cabrières mining district (Figure 1), where Cu extraction has been evidenced since at least the late 4th millennium BCE (Ambert, 1996; Ambert, 1999; Bouquet et al., 2006; Prange et al., 2003). The oldest calibrated 14C date for this chalcolithic mining district is 3310–3230 BCE at the Capitelle du Boum (Ambert, Coularou, et al., 2002) where analyzed Cu objects were isotopically associated with Cabrières Cu mines, and displayed the highest Pb content (Ambert, Laroche, et al., 2009). This result along with the finding of Cu tools dated to 3530–2880 BCE at the Neolithic settlement of Roquemengarde (Guilaine, 1992), 15 km from the Cabrières district, unveils early protohistoric Cu smelting that may have been recorded regionally during the 4th millennium BCE, most particularly in the absence of nearby Pb mining. The pollen record shows a likely exogenous Olea intrusion from the southern Cevennes as early as 3200 BCE that would support a northward regional transport of aerosols during the 4th millennium BCE (Figure 2) toward the Chassezac Valley.
5. Lead geographic provenance
5.1. Mine selection (isotope imprints and Euclidian Distances)
We use the statistical MixSIAR model, a hierarchical Bayesian mixing model to decipher the geographical provenances of Pb ore imprints and mix thereof measured in the Narcettes core (Longman et al., 2018). This model uses the well-known capabilities of Pb and its stable isotopes to label the imprint of non-ferrous ores and decipher their geographic origin (see references in the introduction paragraph). Meanwhile, this isotopic approach may be hindered by (i) the heterogeneity of ore deposits (2) isotopic fractionation during smelting that can affect isotopic ratios and, (3) recycling and pooling of various ores from different locations to produce ingots. Geological heterogeneity is generally below 0.3% for ores of archaeological significance within a given ore field (Barnes, Shields, et al., 1974; Stos-Gale and Gale, 2009). Isotopic fractionation during smelting impedes the use of Pb isotopes for provenance studies (Budd, Pollard, Scaife, et al., 1995; Pollard and Heron, 2008). This fractionation has been predicted from thermodynamic models (Mulliken and Harkins, 1922). Experimental models show that no measurable fractionation takes place during Pb smelting (Barnes, Gramlich, et al., 1978; Gale and Stos-Gale, 1996; Macfarlane, 1999; Baron, Le Carlier, et al., 2009; Stos-Gale and Gale, 2009; Cui and Wu, 2011). Metal recycling, remains an issue that cannot be easily resolved, most particularly for the characterization of artefacts (Pernicka, 1995; Sayre et al., 1995; Budd, Pollard, Scaife, et al., 1995; Gale, 2001). To achieve this statistical analysis, we first need to calculate the excess Pb isotopic imprint (ICxs) for each sample depths in order to compare them to isotopic ore signatures measured from various Pb mines as compiled in a recent database (Tomczyk, 2022):
| \begin {equation*} \mathrm {IC}_{\mathrm {xs}} = [\mathrm {IC}_{\mathrm {m}} - (\mathrm {IC}_{\mathrm {b}} \times \mathrm {Pb}_{\mathrm {b}})]/[\mathrm {Pb}_{\mathrm {xs}}] \end {equation*} |
The Pbb relative contribution for each sample is calculated from Pbxs while ICb is determined from the background defined by PCA analysis (cluster C2, Figure 4) and shown in Figure 5.
In order to minimize the number of mine entries in the MixSIAR model, we ought to reduce the ore database to a restricted number of sources that are compatible with the calculated ICxs at each level. We consider as a potential source any mine imprint that is within a two-sigma multivariate distribution of each calculated ICxs. To do so, we calculate Euclidian Distances (EDs), i.e., the distance between two points using cartesian coordinates and the Pythagoream theorem. Here, EDs are determined from two-dimensional isotopic systems that include 206Pb/204Pb–207Pb/204Pb, 206Pb/204Pb–208Pb/204Pb, and 206Pb/207Pb–208Pb/206Pb ratios. EDs are calculated at each depth between ICxs and ore imprints from various European regions. Both ICxs and isotopic ore imprints need to be normalized to 1 before ED calculation using Xi and Yi min and max for each ratio, e.g., for 206Pb/204Pb–207Pb/204Pb isotopic system:
| \begin {eqnarray*} {X}_{n} &=& [({X} - {X}_{\mathrm {min}})/({X}_{\mathrm {max}} - {X}_{\mathrm {min}})]\\ {Y}_{n} &=& [({Y} - {Y}_{\mathrm {min}})/({Y}_{\mathrm {max}} - {Y}_{\mathrm {min}})] \end {eqnarray*} |
Then EDs are calculated for each enriched sample relative to the isotopic imprints of all the major Pb ores (from the isotopic databases):
| \begin {equation*} \mathrm {ED}(i,j) = \sqrt {({X}_{ni} - {X}_{nj})^{2} + ({Y}_{ni} - {Y}_{nj})^{2}} \end {equation*} |
Lead mines are selected from France (FR, 491 data) and the neighboring significant Pb producers in western Europe, i.e., Spain (SP, 568 data), Italy (IT including Sardinia, 366 data), Germany (GE, 466 data) and Great Britain (GB, 251 data) to which we have added the Greek (GR) mines to explore the significance of long-distance transport of (and/or import from) Pb ore imprints from an historical well-known Pb–Ag producer, most particularly during the Mediterranean Antiquity. Only the mines with major Pb resources were selected from the data bases. The French database is subdivided into several regions including the Massif Central (northern MCN, eastern MCE and southern MCS regions with a focus on the mont Lozère mountain LO), the Alps, the Armorican basin, the Vosges and the Pyrenean mountain areas, the last three being abbreviated as OTH for “other”. The FMC domain is considered apart from the rest of France and, most particularly, the mont Lozère owing to its proximity to the Narcettes peatland and its well-investigated mining/metallurgical activities (Baron, Carignan, et al., 2006; Baron, Mahé-Le Carlier, et al., 2010; Ploquin et al., 2010). The distance between ore imprints and ICxs is calculated for each isotopic system and considered significantly proximate with ED < 0.02. This difference corresponds to a Δiso⩽0.06%, i.e., the highest analytical uncertainty (two standard deviation) on 206Pb/204Pb, 207Pb/204Pb and 208Pb/204Pb ratios. Although the same geographic source may appear several times with ED < 0.02 within the same or several isotopic systems at a given depth, it is only considered once at each sample depth (Di). The number of mines at Di is reported in Supplementary Tables 5 and 6 for all considered countries and French regions. The reported number of mines issued by EDs is not intended to define a single ore provenance but rather identify trends that could signify the relative influence of a region. We report EDs down to 39 cm (D10), i.e. [1570–2010, best at 1840 BCE], below which ICxs calculation is highly speculative due to small Pb enrichment (Pbxs below 20%) and/or Pb concentration below 30 ppm.
According to EDs, Spain contributes the most numerous mines to the Narcettes core imprint with a mean contribution of 49%, followed by France (22%) and Italy (18.5%) while Great Britain and Germany mean apportionment is 5%. Greece contribution remains not significant (Supplementary Table 5). These relative contributions reflect the density of existing mining districts where Pb isotopes have been measured in these countries (Blichert-Toft et al., 2016; Stos-Gale, Gale, et al., 1995; Tomczyk, 2022) and therefore should be considered with caution for provenance assessment. The top core (D1, 3 cm) displays a smaller number of European mines (less than 30, Supplementary Table 5) than the immediate underlying layers, owing likely to the predominance of other worldwide mine sources in most recent years that are not included in this study. This result is consistent with the isotopic imprints reported in Supplementary Figure 3 where D1 is clearly apart from the 300 My isochron, suggesting a different ore mixture than that of the other samples to explain its isotopic imprint. The D2 to D4 layers (i.e., younger than 250 years old) display the same relative contribution with Spain and France accounting for about 70–80% of the total mine inventory. This apportionment is also found at D7 and D8 that covers the Late and Early Roman period with an almost similar number of mines. It should be noticed that the German mines contribution is at its peak (18 mines) during this period, possibly as a response to the rise of Roman control of German mines during the Empire (Heredia et al., 2025; Kempter and Frenzel, 2000; Monna, Hamer, et al., 2000). The medieval era (D5 and D6) is characterized by the most contributing mines (150 to 169 reported mines) with a peak of the Spanish and Italian imprints. This would be consistent with the Italian and Spanish economic wealth during the 15th and 16th centuries owing to their demographic and economic growth, as well as colonization in Asia and America that paved the road to capitalism (Braudel, 1946; Luzzatto, 2013; Malanima, 2020; Maréchaux, 2023; Vives, 2015). It should be noted that half of the Italian contribution arise from Sardinia. The last investigated two levels (D9 and D10) only report 20 different mines, mostly from Spain and Italy, that explain ICxs (Supplementary Table 5). This is the lowest mine occurrence in the Narcettes core. While Pb–Ag artefacts and metallurgy were evidenced since the Nuragic period (1800–500 BCE) in Sardinia (Atzeni et al., 1990; Matta and Vandkilde, 2023), and during the 2nd millennium BCE in the Iberic peninsula (Cortizas et al., 2016; Leblanc et al., 2000; Nocete et al., 2005), its likely low intensity and not extensive aspect make it hazardous to fully establish these fingerprints in our core at these depths that would infer a long-distance conveyance by means of atmospheric and/or trade into the Massif Central region. Furthermore, there is no other metal enrichment that corroborates these findings (Figure 5). Therefore, source provenance remains highly speculative at D9 and D10 and shall not be considered with the MixSIAR statistical model.
In Supplementary Table 6, we display the number of French Pb mines that may relate to Narcettes ICxs at each depth, with a specific interest in the Massif Central. The Northern Massif Central (MCN) contributes the most numerous mines in the Narcettes core (mean contribution 50%), followed by the southern Massif Central (MCS, 27%) and the mont Lozère (LO, 23%) while the Alps and other regions (OTH) vary from 13 to 8% respectively. As for EDs analyses from western European countries (Supplementary Table 5), the uppermost D1 level likely includes worldwide influences and is only explained by 6 mines from France with no significant trend. The total number of mines reaches it maximum during the Middle Ages (D6), and, to a lesser extent, the Late Medieval-Early Modern period (D5) with an overwhelming contribution from the northern Massif Central (MCN, Supplementary Table 6). The well investigated mont Lozère mine field does not appear to significantly contribute to this maximum whereas intense smelting activities have been evidenced in this district during the Middle Ages (985–1280 CE) (Baron, Carignan, et al., 2006). Here, the mont Lozère maximum contribution to French mines occurs during the Modern period (16 mines at D3–D4, <250 yr) and at Late Roman–Early Medieval and Late Iron Age–Early Roman periods (14 mines at D6–D7) (Supplementary Table 6).
The concern raised by local contribution from the Chassezac Valley to the Narcettes peat core is addressed with the isotopic analysis of a galena ore (USS 23-238 collected in 2014) collected from the nearby mine of the Colombier that is comprised within the Sainte-Marguerite-Lafigère and Montselgues mining district (Supplementary Table 3). According to EDs, none of the Narcettes core ICxs can be explained by this mining district (the Colombier EDs are significantly above 0.02 with a median of 0.15). Based on this result, it is therefore reasonable to assume that Pb mining from the Chassezac Valley didn’t significantly influence the isotopic imprint recorded in the Narcettes core. While specific mining districts are identified from the ED analyses, it is not possible to infer which ones have been exploited in the past. The provenance estimates from EDs should be considered with caution as it may rely, to some extent, on the number of existing mines from which isotopic imprints are available. Indeed, some regions are more investigated than others due in part to the most favored cost-effective exploration of large ore bodies reopened during the 19th and 20th c. and the lack of data from hard to access forested and mountainous mining areas. As such, significant smaller mining districts like those located in the Massif Central remain to be explored. This flaw may yield a possible erroneously substantial perception of some highly explored regions and should be considered, most particularly when metal enrichments and/or models are indecisive. This is why we only emphasize results that are either corroborated by several proxies and/or statistically significant.
5.2. The MixSIAR Bayesian model
The MixSIAR Bayesian model is a flexible model structure that uses MCMC (Monte Carlo Markov Chains) algorithms to calculate posterior probabilities with Bayes rule (Lambert, 2018; Semmens et al., 2009; Ward et al., 2010). It was initially coded for stable isotopes in trophic chains and then applied to Pb isotopes (Longman et al., 2018; Stock et al., 2018). We use the R programming language (R Core Team, 2025). As such, the MixSIAR model calculates the most probable candidates for the geographic source of Pb ores. To perform a MixSIAR Bayesian model, all the mines from each French regional and European sources are pooled to minimize the influence of the number of mine isotopic imprints available from each region or country and, the number of variables that may affect the outcome of the model. MixSIAR outcomes are density probabilities reported as mean and statistical uncertainty for each source. These pooled sources allow to refine provenance estimates and constitute the candidate distributions used for Bayesian modelling using MixSIAR. The model is run with uninformative priors (each source given the same statistical weight), a 3 million iterations Markov Chain Monte Carlo and null random mixing factors. The model output is the literal mix of composition of mixture from several mine imprints. As such, the posterior probability density of potential source signatures shall diverge from the density distribution of the experimental data, e.g., a distribution similar to the uninformative prior. The latter can be estimated for densities below 1/N, N being the number of potential regional sources as determined from EDs (<0.02). As explained in the previous paragraph, D9 and D10 are not considered for this modelling. We use the 206Pb/204Pb, 207Pb/204Pb and 208Pb/204Pb isotopic ratios as variables in the model.
The density distribution for each country at various sample depth is presented in Supplementary Table 7. Figures 6, 7a and 7b show the distribution of density probabilities with means above the uninformative prior for sample depths D1–D4 (<250 yr), D5–D6 (Medieval period) and D7–D8 (the Late Iron Age–Early Roman and Late Roman–Early Medieval periods). During the Modern period (<250 yr), the French, Italian and Greek sources are the most significant. The distribution of the German and Spanish probability densities follows an almost centered uninformative null distribution that weakens the likeliness of their single occurrences (Figure 6).
Scaled posterior densities (0 to 1) of studied groups using MixSIAR. We only show countries with a significant proportion of mix in top layers (D1 to D4, <250 yr).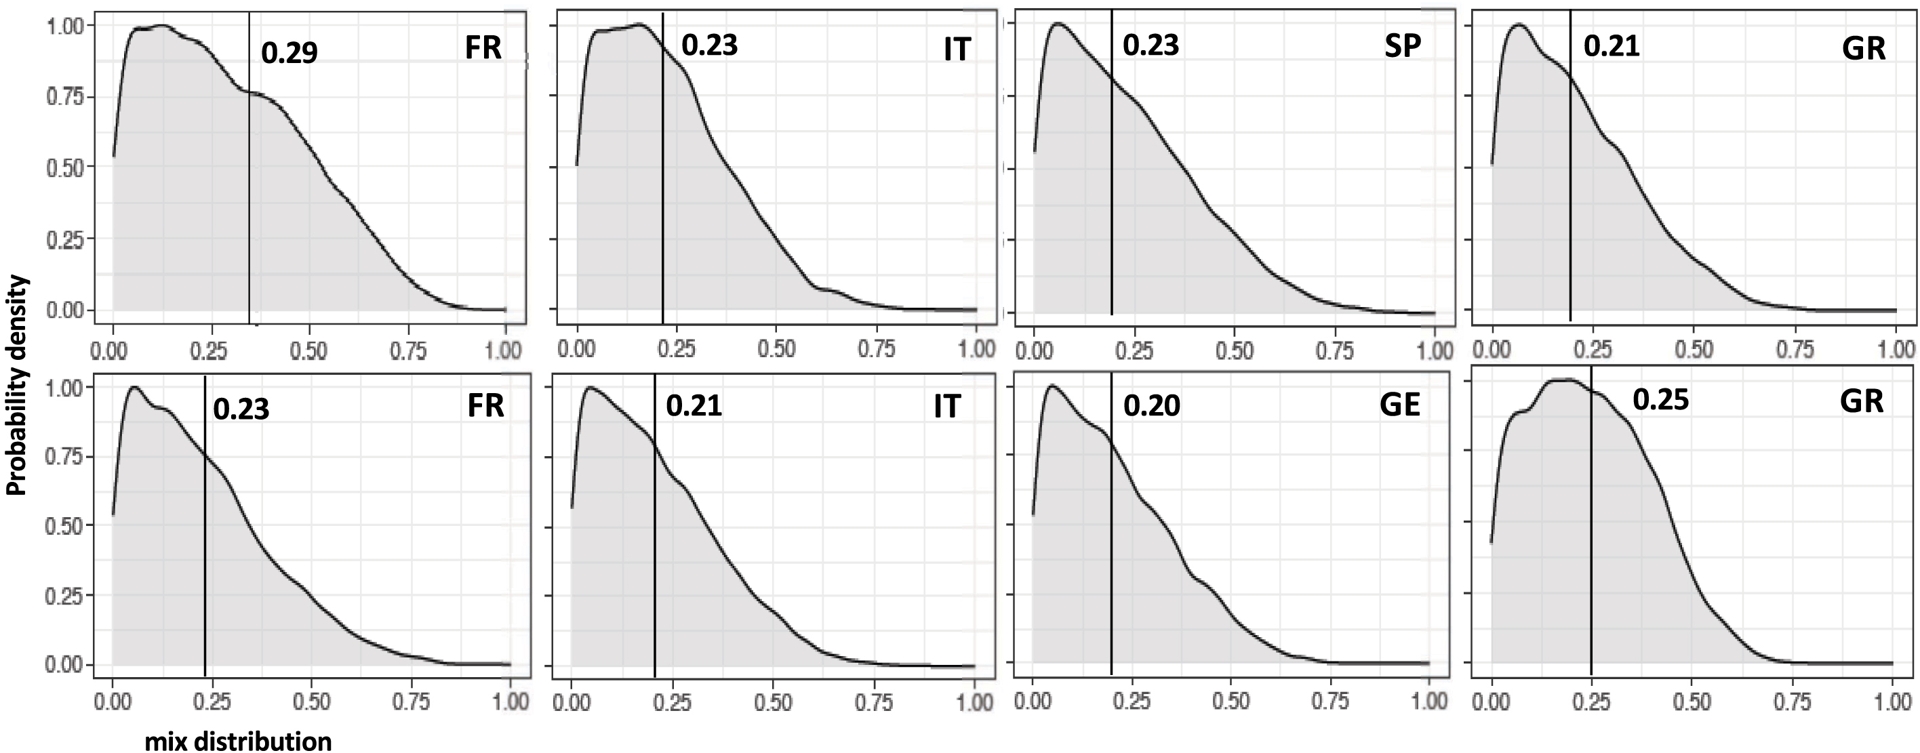
Scaled posterior densities (0 to 1) of groups investigated using MixSIAR. We only show countries with a significant proportion of mix for the sample depths D5–D6 (a) and D7–D8 (b) in the Narcettes core.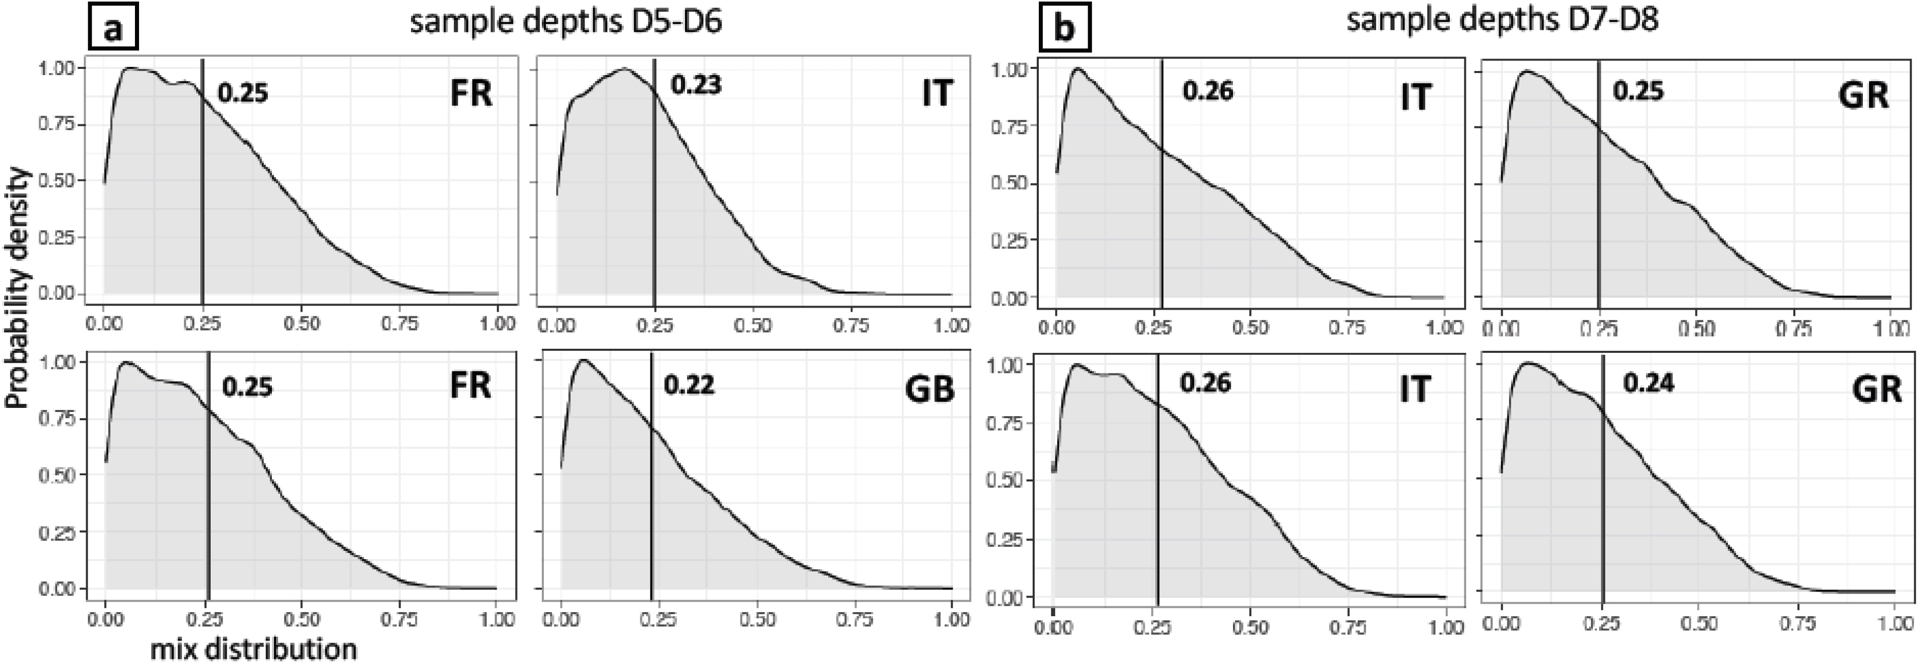
During the Medieval period (Figure 7a), the French source appears the most significant, followed, to a lesser extent, by the Italian source. As for Germany and Spain, the Great Britain source follows an almost centered uninformative null distribution that weakens the likeliness of its single occurrence during this period. The D7 and D8 sample depths that correspond to the Late Roman–Early Medieval and Late Iron Age–Early Roman epochs respectively are characterized by only two significant sources from Italy and Greece (Figure 7b).
The distribution of posterior density probabilities for country sources (Supplementary Table 7) is not overwhelming (maximum of 0.25) suggesting that the model cannot strongly signify single sources, and therefore we likely face a well distributed and mixed input. Meanwhile, significant distributions (Figures 6 and 7) emphasize the prominence of French, Italian and Greek sources. The Italian source is relevant during all of the periods while the French one is identified within the upper core and during the Medieval period. The Greek imprint is encountered during the Modern and the Antique periods. It should be noticed that the Greek imprint is driven by a single mine field (Supplementary Table 5) from the Peloponnese peninsula (Molaï), but accounts for a significant density probability still. Most amazingly, while the Spanish mines are the most numerous from the EDs, almost none is revealed with the MixSIAR model. Aggregating the sources into single isotopic imprints and corresponding standard deviation for each source does not preclude the French and Italian influence, while it emphasizes the Greek source and revokes the Spanish one. The likely rather intense mixed imprint resulting from various input to the Narcettes core does not allow MixSIAR model to discriminate highly significant single sources, but it enables to reveal the slight, but statistically noteworthy, prominence of the Greek, Italian and French sources over the other countries.
The density distribution for various French regions (as defined in Section 5.1) at each sample depth in the Narcettes core is presented in Supplementary Table 7. Figures 8, 9a and 9b show the distribution of density probabilities with means above the uninformative prior for sample depths D1–D4 (<250 yr), D5–D6 (Medieval period) and D7–D8 (Antique period) respectively. The uppermost level significantly displays OTH (for other French sources than the Massif Central and the Alps) as the most probable source with a mean mix distribution of 0.72 (Figure 8). The Armorican Massif (mine field of Porte-aux-Moines in French Britany) is the single OTH source. Archeological field investigation would be necessary to substantiate mining activities for the past 250 years. As mentioned earlier, worldwide Pb emissions may overcome French sources in the uppermost, most recent, section of the core, and therefore other mines that are not taken into account in this study may have significantly contributed to the isotopic imprint at sample depth D1. The Alps and the Massif Central (MCN and, to a lesser extent, the mont Lozère) constitute the most probable mix during the past 250 years (Figure 8). These occurrences are consistent with DE analyses (Supplementary Table 6), although the ALPS posterior densities are significantly higher than expected from the rather low number of identified mines (mostly from Montchabert, Saint-Pierre-Peone and La Plagne). This latter result substantiates again the need to strengthen provenance studies beyond the use of graphic-based estimates (like EDs) with a more advanced statistical model such as MixSIAR that is not as much biased by the number of available isotopic imprints available from the databases. During the Medieval period, the French apportionment is dominated by the Massif Central, and, to a lesser extent, the Alps (Figure 9a; Supplementary Table 7). The mont Lozère mine field displays significant mean density during the Modern period and the Middle Ages (Figures 8, 9). These results corroborate EDs estimates (Supplementary Table 6) and the known recent mining activity during the 19th and 20th centuries, as well as earlier mining activity during the Middle Ages (Baron, Le Carlier, et al., 2009; Baron, Mahé-Le Carlier, et al., 2010) that are discussed in Section 5.1. The northern Massif Central (MCN) not only displays the most numerous mines from the EDs analyses, but also the highest probable density (Figure 8) comforting as such archaeological findings regarding the importance of mining activities in this mountainous region during the Middle Ages (see Minvielle-Larousse, 2025).
Scaled posterior densities (0 to 1) of groups investigated using MixSIAR. We only show French regions with a significant proportion of mix for the upper layers (D1 to D4, <250 yr) in the Narcettes core.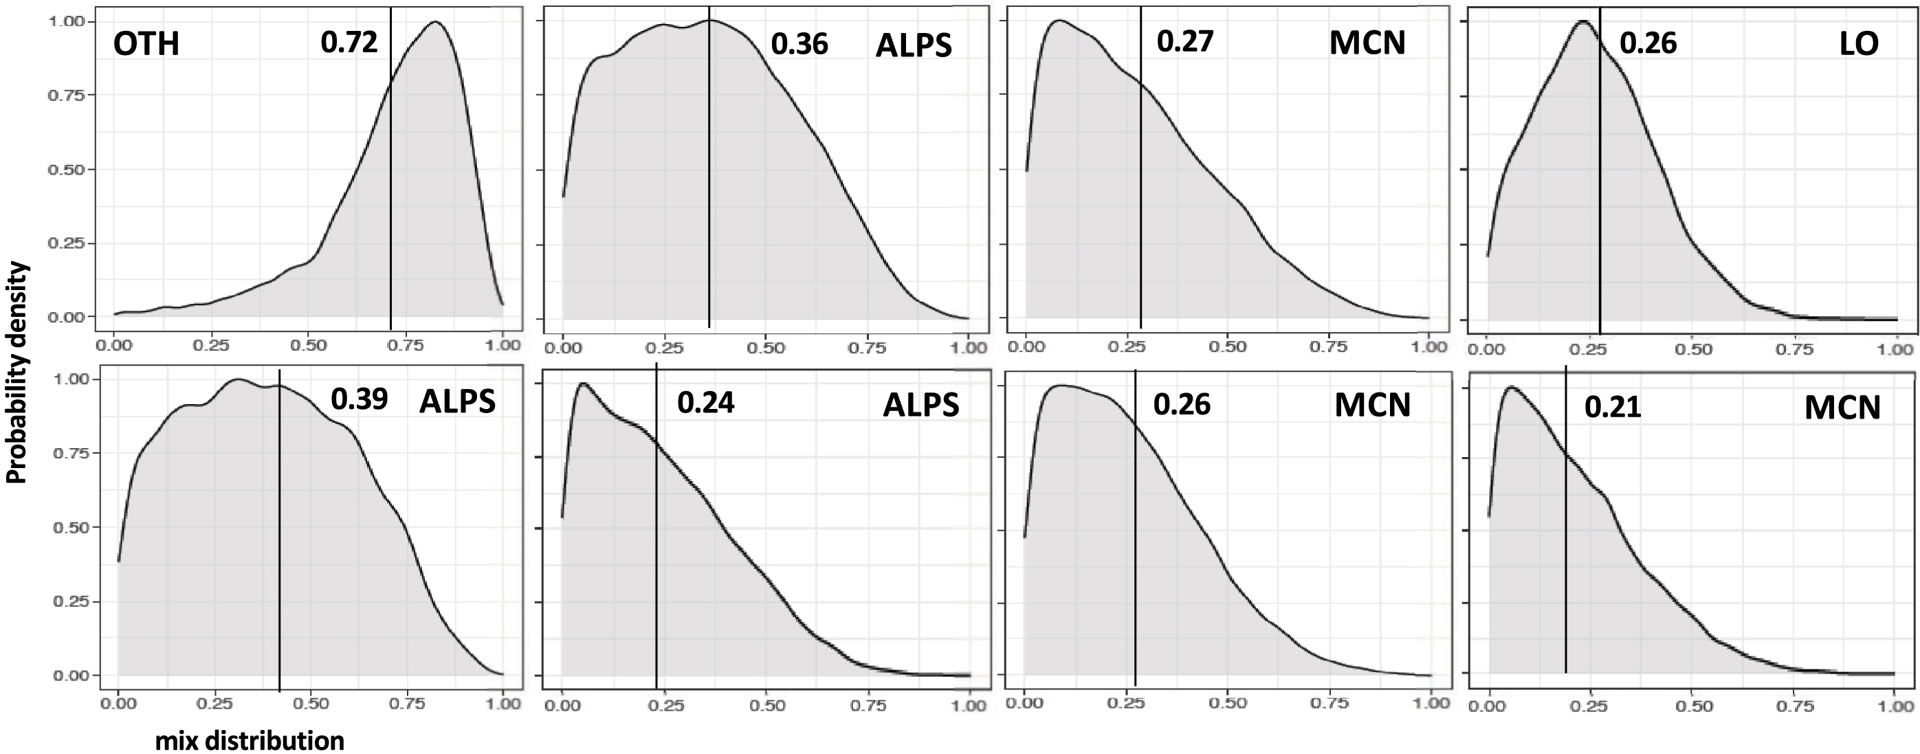
Scaled posterior densities (0 to 1) of groups investigated using MixSIAR. We only show French regions with a significant proportion of the mix for the sample depths D5–D6 (a) and D7–D8 (b) in the Narcettes core.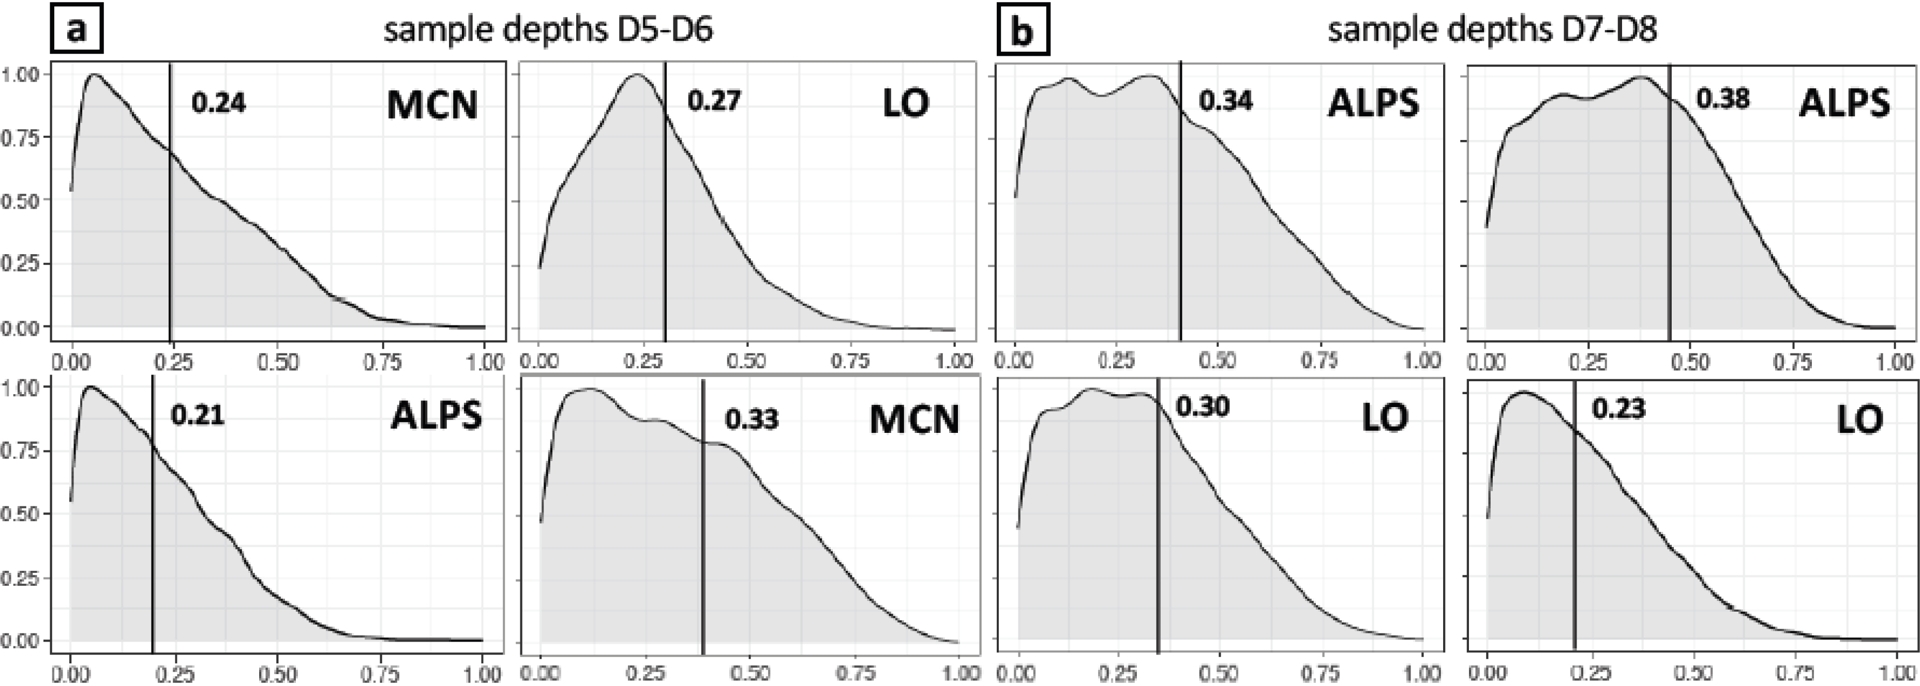
The D7–D8 levels, which comprise the Late Iron Age, the Early and Late Roman and the Early Medieval periods, highlights the Alps and the mont Lozère as the main probable sources to explain the mixed isotopic imprint recorded in the Narcettes core (Figure 9b). This result suggest that the mont Lozère mining district may have been exploited during the Roman period (Strabon, 64 BCE–23 CE, book IV, 2.2), and the Late Iron Age. Further LIA in mont Lozère peat sediments near metallurgical sites showed significant Pb enrichments during the Late Iron Age (20 CE to 300 BCE) (Baron, Lavoie, et al., 2005). The latter is corroborated by our pollen records that show the onset of local agriculture and pastoralism during the Iron Age circa 800 BCE (Figure 2) (Dendievel et al., 2019) and a sharp deforestation initiated during the 8–9th c. BCE in the Massif Central. Mine distribution from EDs is almost equally distributed between the various mining regions in Massif Central and the Alps at D7–D8. The statistical MixSIAR approach completes this latter estimate and provides valuable insights regarding regional assessment of the geographical mining district that explains pollutant Pb input into our peat core.
6. Conclusion
The Narcettes peat core records the accumulation of non-ferrous metals that extents from the Modern period to the Neolithic, at the onset of the chalcolithic period in western Europe. Metal excesses are discussed on the basis of normalized data and statistical approaches to infer human related contamination. An algebrical approach based on Euclidian Distances between Pb isotope ratios measured in the peat and source imprints from European mines allows to discriminate possible Pb–Ag mines that could contribute to the recorded Narcettes Pb imprint. This analysis evidences the overwhelming influence of Spanish mines and, to a lesser extent, French and Italian ones. When considering French sources only, the FMC (MCN, and, to a lesser extent, mont Lozère and MCS) mines prevail. While this method permits to identify specific mines, it should be considered with caution when it comes to deciphering the relative influence of mining districts. This is why we use a Bayesian model (MixSIAR) that is exclusively dedicated to assess the geographic origin of pollutant Pb accumulated into the sediment core. This statistical approach emphasizes possible mining ore districts from which Pb could originate. As for EDs, it is based on stable Pb isotope markers. The most remarkable results from this provenance model are (i) the significant signature from France and Italy that overwhelms the Spanish provenance in the core, (ii) the prominent Greek imprint, most particularly in the Late and Early Roman periods, (iii) the preponderance of the French sources from Massif Central and the Alps and, most especially, (iv) the mont Lozère imprints during the Roman period and the Iron Age suggesting that mining exploitation of this site has significantly predated its well-known medieval metallurgical activities. At last, Cu, Ni and Zn enrichments exhibit one of the earliest metal contaminations at a French remote site during the 4th millennium BCE that may result from the atmospheric transport of these metals from regional Neolithic copper metallurgical districts located at Roquemengarde and Cabrières (Languedoc).
Acknowledgments
We thank the institutions and colleagues who made this study possible: the Service Régional de l’Archéologie Rhône-Alpes (French Ministry of Culture), the Conservatoire d’Espaces Naturels Rhône-Alpes and the Groupe d’Étude des Mines Anciennes. We acknowledge the support of Pierre Deschamps and Hélène Mariot (CEREGE ENVITOP). Comments from three anonymous reviewers help to greatly improve this manuscript.
Declaration of interests
The authors do not work for, advise, own shares in, or receive funds from any organization that could benefit from this article, and have declared no affiliations other than their research organizations.
Supplementary materials
Supporting information for this article is available on the journal’s website under https://doi.org/10.5802/crgeos.339 or from the author.