


 CC-BY 4.0
1. Introduction
Eutrophication is the process by which nutrients, mostly nitrogen (N) and phosphorus (P), accumulate in a body of water, as defined by Smith et al. [1999]. A typical result of coastal eutrophication is the growth of dense macroalgal mats observed in shallow waters worldwide near industrial, agricultural and urban areas [Gladyshev and Gubelit 2019; Morand and Briand 1996; Valiela et al. 1997]. This phenomenon was given the evocative name “green tides” because of the visible proliferation of Ulva sp. in both estuarine and coastal marine ecosystems [Perrot et al. 2014; Pinay et al. 2018]. The subsequent decay of the macroalgal biomass has harmful environmental consequences through changes in the microbial and macrofaunal food web in the sediment [Davoult et al. 2017; García-Robledo et al. 2008; Hardison et al. 2013; Valiela et al. 1997] and an accumulation of toxic hydrogen sulfide [Nedergaard et al. 2002]. Even though river nutrient loading, especially N, is the main cause of green tides [e.g. Perrot et al. 2014], coastal sediments could be an additional source of nutrients for macroalgae, thus contributing to eutrophication [Sundbäck et al. 2003; Engelsen et al. 2008; Robertson and Savage 2018]. For example, it has been shown that benthic nutrient effluxes could supply up to 55–100% and 30–70% of the N and P requirement, respectively, needed to initiate the growth of filamentous green algal mats in shallow microtidal embayments on the west coast of Sweden [Sundbäck et al. 2003].
In order to improve our understanding of coastal eutrophication, mathematical models have been developed by coupling hydro-biogeochemical and ecological mechanisms [Le Moal et al. 2019 and references therein]. Models such as the “Mars-Ulves” [Perrot et al. 2014] and “ECO-MARS3D” models [Ménesguen et al. 2019] predict fine-scale algal blooms based on nutrient loading from rivers, pelagic nutrient cycling and the primary production of a coastal system, whereas the benthic compartment is represented in less detail. Currently, a constant benthic flux of N and P is used to take the nutrient exchanges between the sediment and bottom waters into account, but this remains limited due to the lack of suitable data for a given area. Determining the spatial variability of the benthic nutrient fluxes requires a large analytical effort, and may be high according the variations of environmental factors (e.g. hydrodynamism, anthropogenic pressures) of coastal ecosystems. This could be facilitated by using sedimentary proxies, which are easily measurable and directly related to benthic fluxes.
Benthic N and P fluxes, through the regeneration of ammonium (
The composition of SOM is influenced by a mixture of organic matter (OM) inputs from both autochthonous (e.g. microphytobenthos and sediment-attached bacteria) and allochthonous sources (e.g. algal and vascular plant detritus from terrestrial and marine origins). It is generally accepted that a high contribution of algal biomass relative to terrestrial detritus in the SOM composition enhances its biodegradability [e.g. Arndt et al. 2013]. Two markers can be used to assess the labile OM flux in sediment: the chla and phaeopigment contents in surface sediment. They are good tracers of OM produced by photosynthetic organisms [Dell’Anno et al. 2002]. Whereas the chla content in surface sediment would be mainly related to the microphytobenthos biomass, the content of its breakdown product, phaeopigment, would indicate the sedimentation of phytoplankton and macroalgal detritus from the water column [Therkildsen and Lomstein 1993].
The SOM composition may also be characterized by the elemental C:N:P ratios. The C:N ratio is widely used to discriminate the sources of OM in the surface sediment [e.g. Dubois et al. 2012; Galois et al. 2000; Gu et al. 2017]. Typically, C:N values > 20 can be used to distinguish terrestrial higher plants from macrophytes (from 10 to 20) and phytoplankton (from 6 to 10) [Dubois et al. 2012; Liénart et al. 2017; Meyers 1994]. Therefore, it is assumed that when the C:N ratio is lower, the organic matter is more easily biodegradable [Enríquez et al. 1993]. Conversely, the N:P ratio in SOM is not commonly used to describe the origin and biodegradability of SOM. Nevertheless, an increase in the N:P ratio in the surface sediment could reflect the enrichment of OM via the decay of macroalgae, as observed in the eutrophic lagoon of Venice [Sfriso et al. 1988].
Physical sediment properties, such as the grain-size distribution and porosity, also affect SOM mineralization and the transport processes of solutes, and thus benthic fluxes. Fine-grained sediment, reflecting a high proportion of clay minerals, may prevent the microbially mediated OM degradation through a physical protection of the OM [e.g. Arndt et al. 2013 and references therein; Rasheed et al. 2003]. Porosity, which is generally inversely related to grain-size [Meade 1966], is a key parameter driving the sediment–water exchanges of solutes, including diffusion, advection and bio-irrigation [Boudreau 1996, 1997]. Therefore, a high porosity could, for example, enhance the diffusive fluxes across the sediment–water interface.
The present study was based on the hypothesis that benthic nutrient fluxes may be directly related to the sedimentary characteristics. Two previous studies carried out in temperate estuaries showed relationships between
The aim of the present study was to investigate the relationships between benthic nutrient fluxes and the surface sediment characteristics from intertidal mudflats. Our objective was to answer the following questions: (1) What are the main drivers of benthic nutrient fluxes? (2) Are these drivers similar with regards to the
To this end, a broad sediment sampling campaign was carried out in the spring of 2019 on the Brittany coast (France). Since the 1970s, the Brittany coast has been particularly affected by green tides; this timeline coincides with changes in agricultural practices and an increase in anthropogenic nitrogen loading in the watersheds [Morand and Briand 1996]. Many surface and subsurface waters in Brittany have nitrate concentrations which exceed the European Community 50 mg⋅L−1 drinking standard.
A total of 200 sediment samples collected from 45 sites were analyzed for their
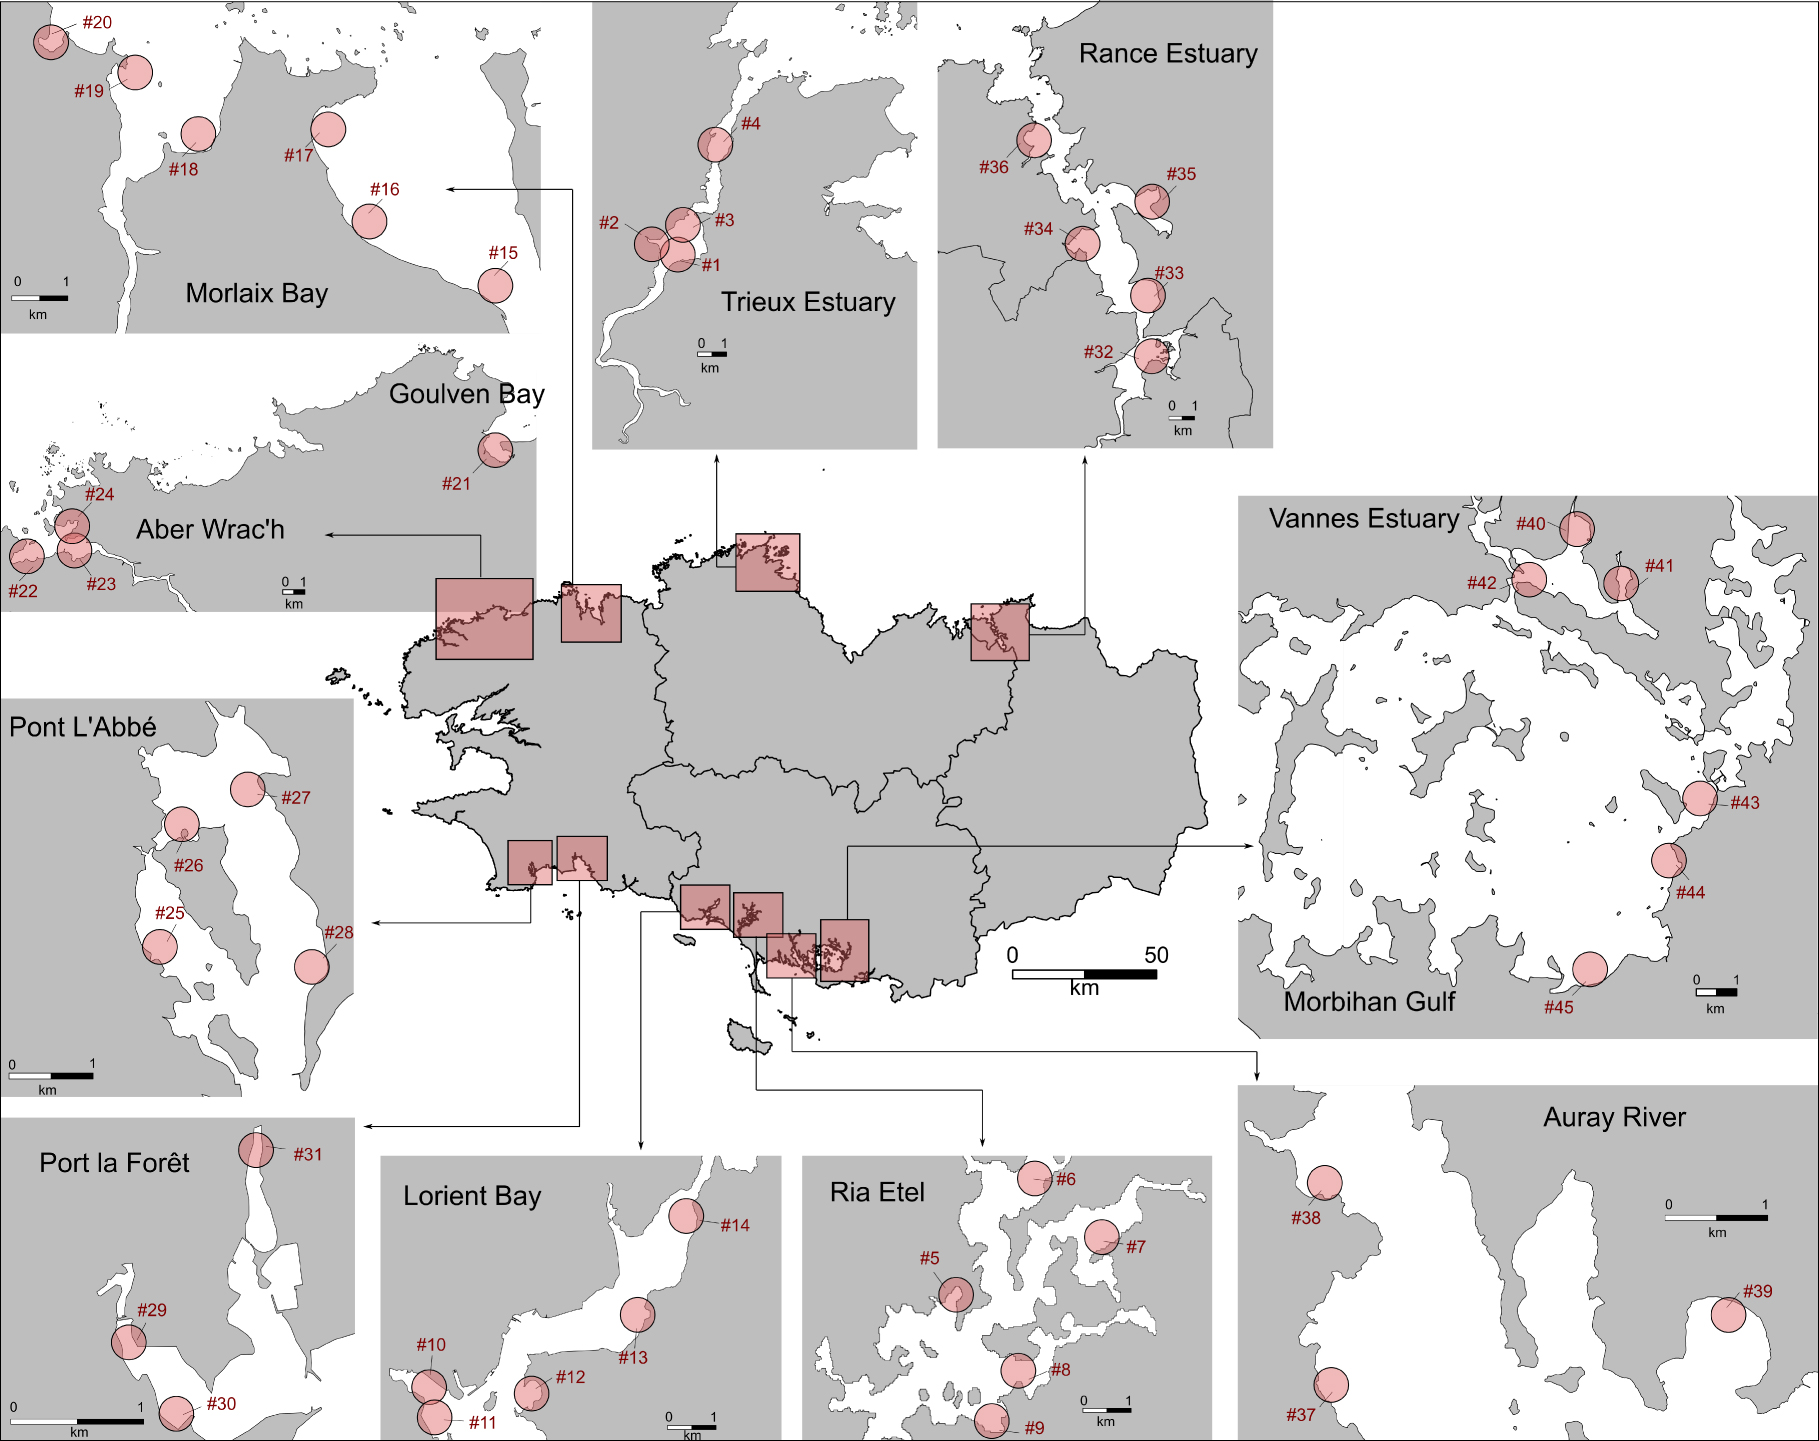
Location of mudflats (n = 12) and sites of sampling (n = 45) in spring (April until June) 2019. See the list of sites and sampling plan in Supplementary annex Table 1.
2. Materials and methods
2.1. Study sites and sampling
The study sites were located in macrotidal mudflats in Brittany (north-western France) under eutrophic conditions where green algae mats are observed (https://bretagne-environnement.fr/donnees-algues-vertes-bretagne). The mudflats that we selected for our study are the mudflats that are regularly monitored as part of the green tide monitoring programs set up by the Loire-Bretagne Water Agency (CEVA], final report, 2015]). Over the sampling period (between mid-April to mid-June 2019), the tidal range fluctuated from 2 to 9 m. Overall, 200 sediment samples were collected from 45 sites (Figure 1, Table S1) at mid–low tide. Sediment cores were sampled with a PVC core (diameter = 6 cm,h = 20 cm) in the upper 10 cm sediment layer for the benthic flux measurements, and another core (diameter = 9 cm, h = 5 cm) was sampled in order to analyze the surface sediment characteristics (Figure S1). For the benthic flux measurements, the cores were incubated in the dark directly on site in a mobile laboratory under controlled temperature (19 ± 2 °C) within one hour following sampling (see below). Based on the sample collected using the PVC core with a height of 5 cm, an aliquot of the wet sediment, with a known volume and weight, was maintained at 4 °C and used to determine the porosity. The remaining sediment was frozen at −20 °C in order to analyze the pigment content (chla and phaeopigment), phosphorus speciation, elemental composition and grain-size.
2.2. Benthic fluxes
The cores were incubated in the dark during 4 hours for the
The
All of the values are reported in Supplementary Table S1.
2.3. Analysis of the sedimentary characteristics
The porosity was calculated by drying a previously weighed wet aliquot sediment at 60 °C. The water loss, determined by mass difference, and the sediment density set at 2.55 were used to calculate the porosity [Krom and Berner 1980]. The particle-size distribution (<2 mm) was measured using a laser diffraction instrument (Malvern Mastersizer). The particles were classified as either sand (63 −−2000 μm), silt (3 −−63 μm) or clay (<3 μm) fractions [e.g. Keil and Hedges 1993; Pye and Blott 2004]. “Mud” is defined as the sum of the clay and silt particles. The percentage of mud was used as a sedimentary parameter thereafter.
The pigment content (chla and phaeopigment) was measured in freeze-dried sediment (0.5–1 g) extracted in 90% acetone (10 mL) in the dark (18–20 h) at 4 °C. Each sample was previously gently ground using an agate pestle and mortar. After centrifugation, the chla and phaeopigment contents were measured in the supernatant using the spectrophotometric method of Lorenzen [1967] at 665 and 750 nm (Uvikon spectrophotometer), and expressed in μg⋅g−1 of dry sediment. The detection limits of the chla and phaeopigment contents were 2.7 and 12.9 μg⋅g−1, respectively.
The total organic carbon and nitrogen (TOC and TN) contents were determined using an element analyzer (FLASH™ 2000 OEA). An aliquot of freeze-dried and crushed sediment was acid-treated with 2N HCl to remove the carbonate and was subsequently rinsed with deionized water. After centrifugation, the carbonate-free sample was dried at 60 °C, and ground before being placed into a tin capsule for the TOC analysis. A second aliquot without an acidification treatment was used to determine the TN analysis.
The iron oxide-bound P (Fe-P) content was determined using a Dithionite-Bicarbonate solution [Ruttenberg 1992], as described in Andrieux-Loyer et al. [2008]. The total P (Ptot) content was determined using a 1 mol⋅L−1 HCl treatment overnight after sediment ignition at 550 °C (4 h), while the inorganic P content refers to the sum of the P-forms (Fe-bound P, Ca-bound P and detrital P), that was extracted with 1 mol⋅L−1 HCl before sediment ignition [Aspila et al. 1976]. The organic P (Org-P) content was then quantified by calculating the difference between the total P and inorganic P contents [Andrieux-Loyer et al. 2008]. The phosphorus-form extracts were subsequently analyzed using segmented flow analysis (SFA) [Aminot and Kérouel 2007]. The Org-P and Fe-P represented the pool of potentially bioavailable P.
The TOC, TN, Ptot, Org-P and Fe-P contents were expressed as the mass of the carbon, nitrogen and phosphorus in the total dry mass of the sediment.
The C:N and TN:Org-P ratios (mol:mol) in SOM were calculated from the TOC, TN and Org-P contents.
All of the values are reported in Supplementary Table S1.
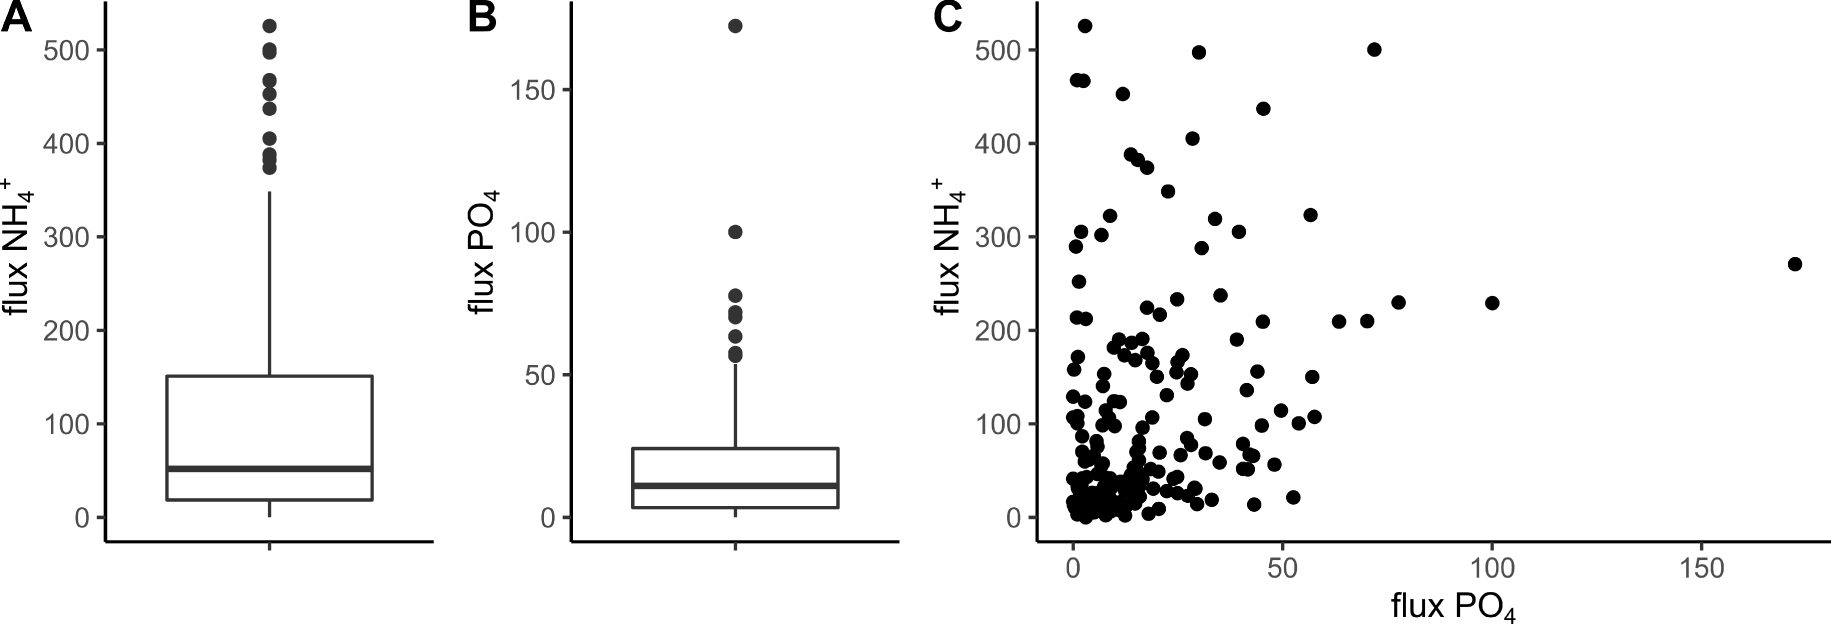
Boxplot of
2.4. Statistical analysis
Pearson’s correlation matrix was calculated to establish the pairwise correlations between the sedimentary characteristics of the sediment. The relationships between the benthic nutrient fluxes and the sedimentary characteristics were assessed through multiple linear regressions. To better predict
3. Results
3.1. Benthic nutrient fluxes
Taking the entire data set into account, the average
The variability of both
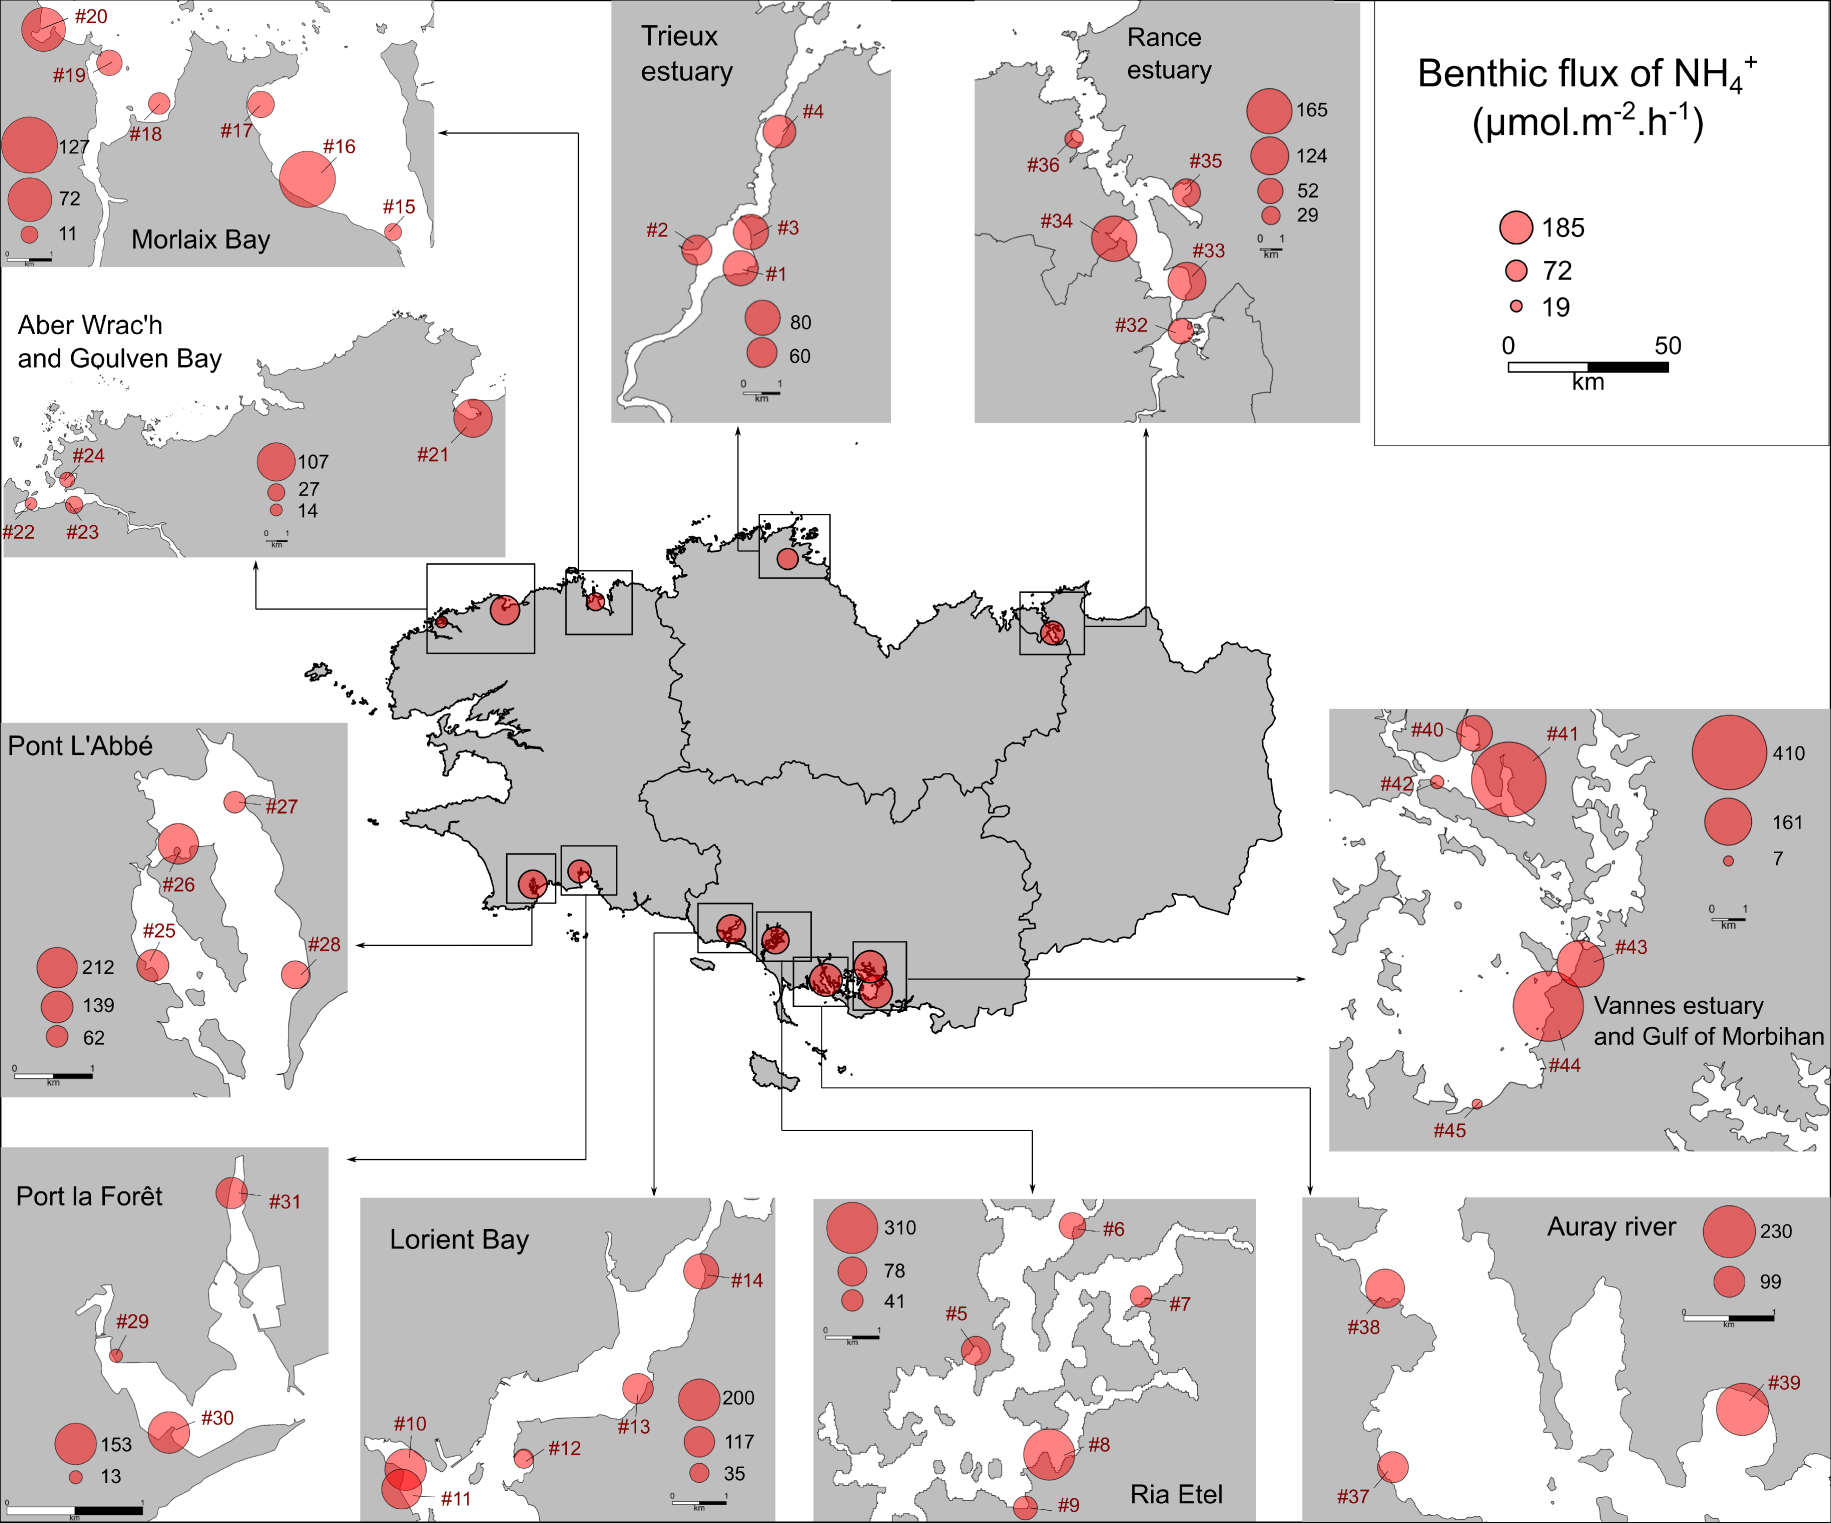
Spatial variability of the
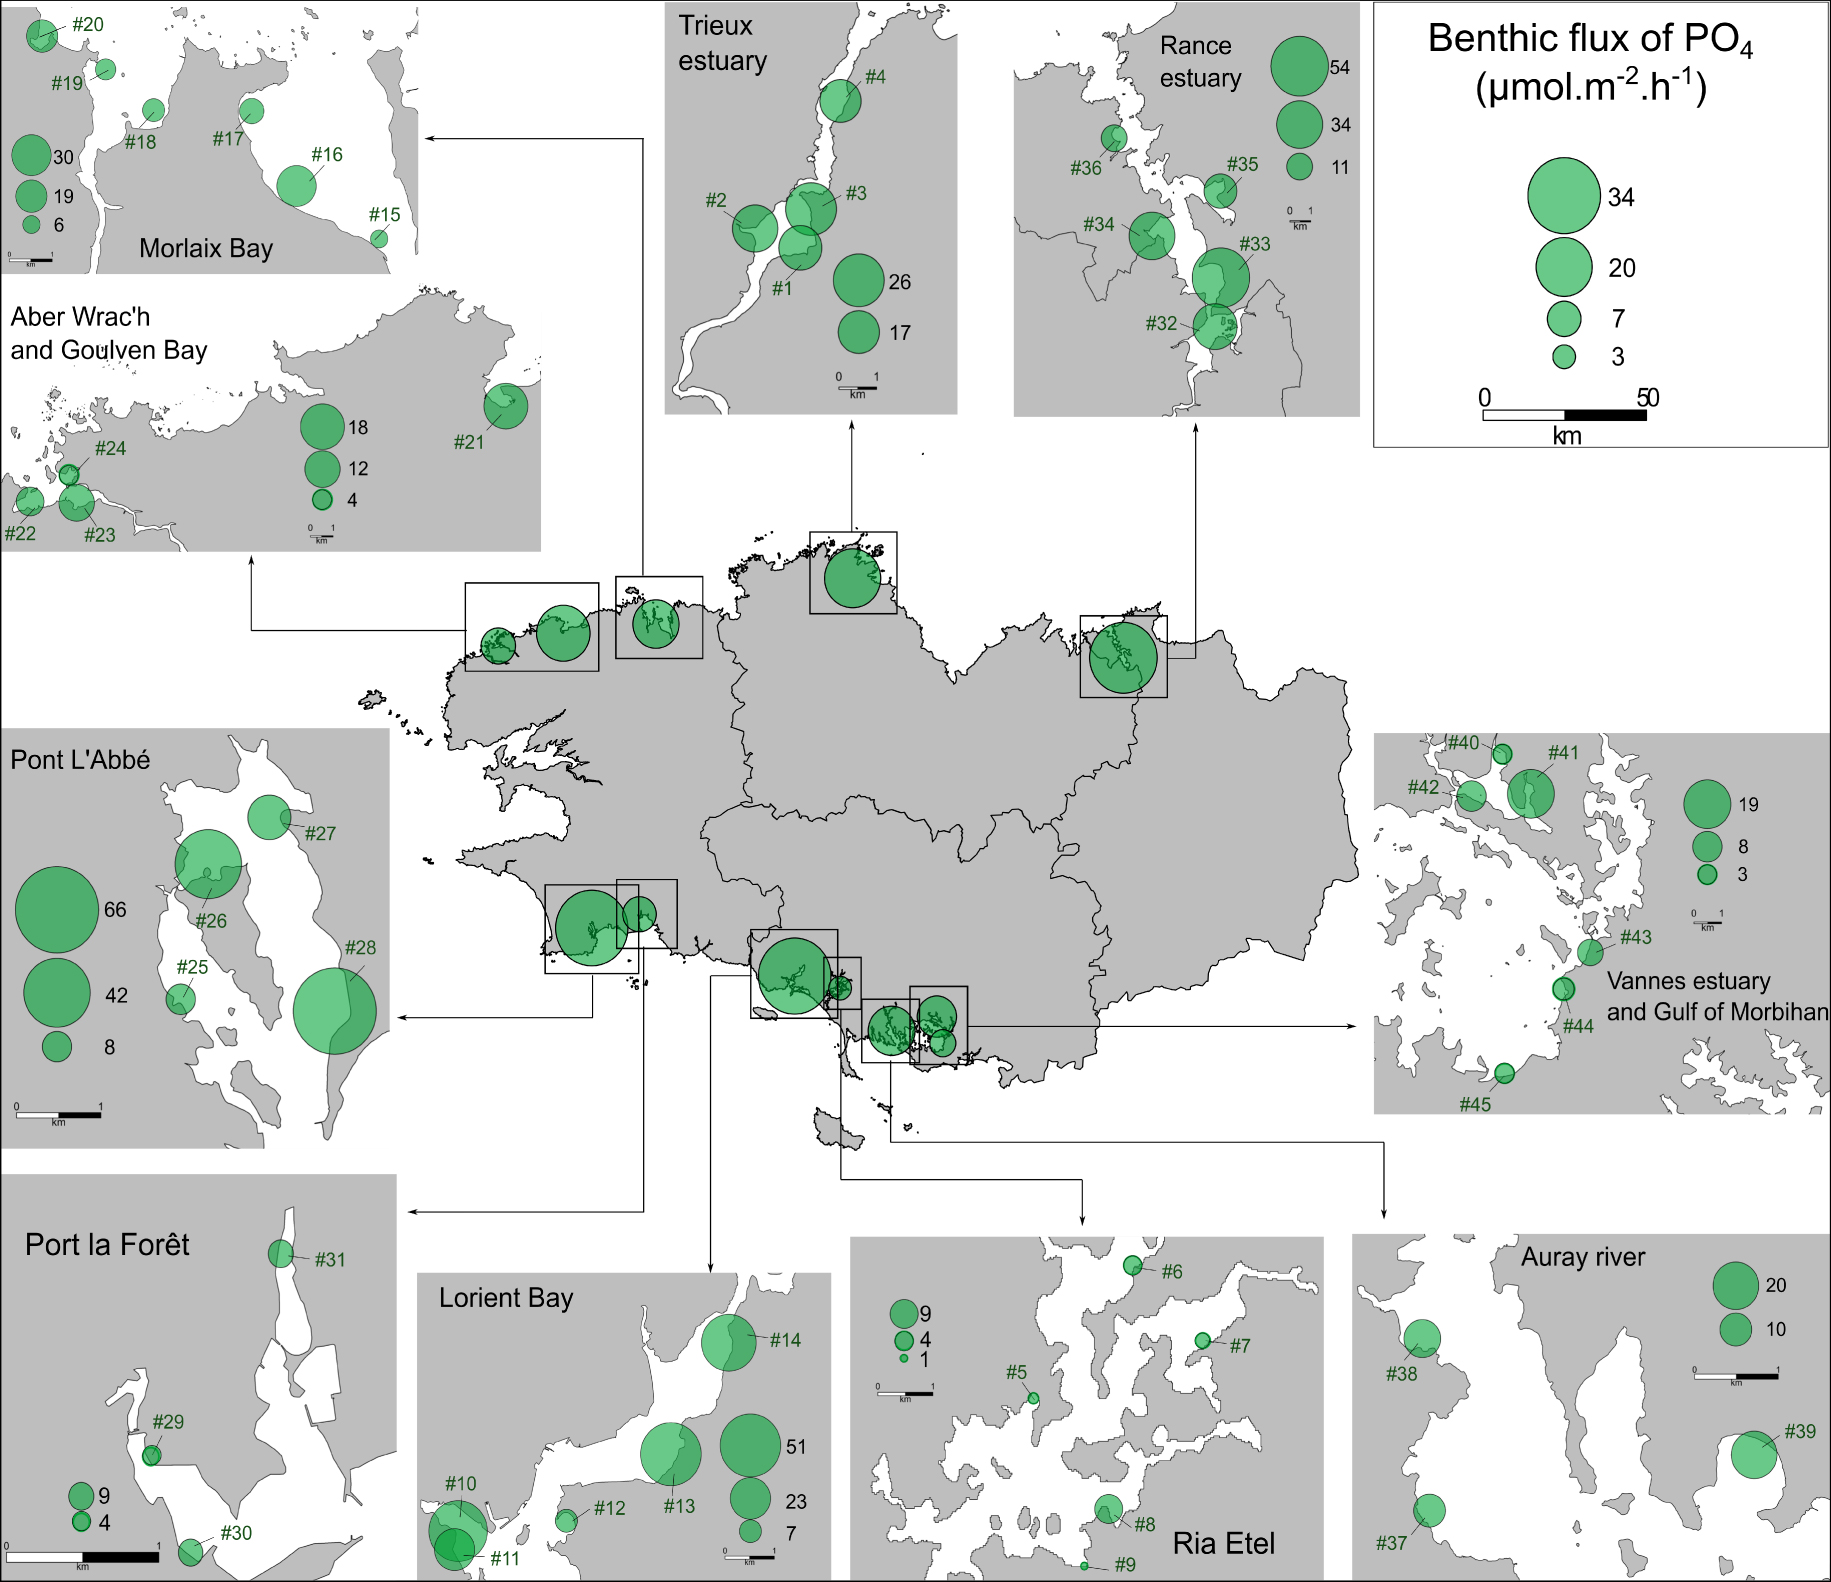
Spatial variability of the PO4 effluxes (μmol⋅m−2⋅h−1) from the sediment collected on 45 sites in Brittany (France). The values represent the average flux of PO4 for each sampling site and for each intertidal area as a whole (n = 12).
3.2. Surface sediment characteristics
The distribution and pairwise correlations with Pearson’s coefficient for the surface sediment characteristics measured in the present study are presented in Tables 1 and 2.
Sediment properties of all samples (n = 200)
| Mean (±sd) | Median | Min–Max | Q1–Q3 | |
|---|---|---|---|---|
| Mud [clay + silt] (%) | 68.3 (±17.2) | 72.6 | 15.4–92.8 | 56.2–81.9 |
| Porosity (%) | 69.8 (±10.3) | 70.1 | 46.1–86.5 | 62.2–78.8 |
| Chla (μg⋅g−1) | 5.8 (±4.8) | 4.9 | 0–27.8 | 3.1–8.4 |
| Phaeopigment (μg⋅g−1) | 28.0 (±18.7) | 26.1 | 0–107.0 | 15.2–39.7 |
| TN (%) | 0.24 (±0.12) | 0.22 | 0.06–0.64 | 0.15–0.32 |
| TOC (%) | 2.2 (±1.2) | 2.1 | 0.2–7.7 | 1.1–3.0 |
| C:N (mol⋅mol−1) | 10.0 (±2.4) | 9.8 | 1.0–21.9 | 8.7–10.9 |
| Ptot (%) | 0.055 (±0.022) | 0.051 | 0.011–0.131 | 0.038–0.070 |
| Org-P (%) | 0.026 (±0.014) | 0.023 | 0.004–0.065 | 0.014–0.034 |
| Fe-P (%) | 0.008 (±0.005) | 0.007 | 0.001–0.033 | 0.004–0.010 |
| TN:Org-P (mol⋅mol−1) | 23.1 (±6.9) | 22.9 | 5.0–65.9 | 19.1–25.3 |
Molar C:N and TN:Org-P ratios were calculated from TOC, TN and Org-P content. Q1 and Q3 represent the 25th and 75th percentile respectively.
Pearson’s correlation matrix
| Porosity | chla | Phaeo | TN | TOC | C:N | Org-P | Fe-P | TN:Org-P | |
|---|---|---|---|---|---|---|---|---|---|
| Mud | 0.82 | 0.44 | 0.70 | 0.73 | 0.64 | 0.30 | 0.72 | 0.54 | −0.20 |
| Porosity | 0.57 | 0.76 | 0.87 | 0.78 | 0.35 | 0.73 | 0.54 | −0.04 | |
| chla | 0.64 | 0.66 | 0.62 | 0.26 | 0.60 | 0.45 | −0.04 | ||
| Phaeo | 0.86 | 0.79 | 0.31 | 0.70 | 0.53 | 0.04 | |||
| TN | 0.91 | 0.32 | 0.82 | 0.58 | −0.02 | ||||
| TOC | 0.66 | 0.75 | 0.58 | −0.02 | |||||
| C:N | 0.31 | 0.33 | −0.05 | ||||||
| Org-P | 0.65 | −0.48 | |||||||
| Fe-P | −0.23 | ||||||||
Bold values were coefficients ⩾ 0.70. “mud” represents the percentage contribution of clay and silt particles (diameter < 0.63 μm). “chla”, “phaeo”, “TOC”, “TN”, “Org-P” and “Fe-P” corresponds to the content of chlorophyll a, phaeopigment, total organic carbon, total nitrogen, total phosphorus, organic phosphorus and phosphorus associated with iron oxides respectively in the upper 5 cm of sediment. Molar C:N and TN:Org-P ratios were calculated from TOC, TN and Org-P content.
The particle-size distribution of the samples indicates that the median grain-size (D50) ranged from 16 to 519 μm. With an average mud content of 68.3 ± 17.2% for all of the samples, the clay and silt particles represented 4.7 ± 2.1 and 63.6 ± 15.4% of the particle-size distribution, respectively. According to the ternary diagram based on the sand/mud ratios proposed by Flemming [2000], a large proportion of the surface sediments collected in the present study were classified as sandy mud (38%) and slightly sandy mud (49%). As expected, the mud content was positively correlated with the porosity of the sediment (Pearson’s coefficient = 0.82, p-value < 0.05). The average porosity was 69.8 ± 10.3% with values that ranged from 46 to 87%.
The mud content was also positively correlated with the TOC (Pearson’s coefficient = 0.64, p-value < 0.05), TN (Pearson’s coefficient = 0.73, p-value < 0.05) and Org-P contents (Pearson’s coefficient = 0.72, p-value < 0.05) in the surface sediment. The TOC, TN and Org-P contents averaged 2.2 ± 1.2%, 0.24 ± 0.12% and 0.026 ± 0.014%, respectively. With an average Ptot content of 0.055 ± 0.022%, the amount of Org-P was 45 ± 12% of the Ptot content compared to 14 ± 6% for the Fe-P (average content of 0.008 ± 0.005%).
The C:N and TN:Org-P ratios in the SOM averaged 10.0 ± 2.4 and 23.1 ± 6.9, respectively. The C:N ratios reached up to 21.9 with half of the values ranging from 8.7 to 10.9. The highest values corresponded to the sediment samples collected in the Goulven Bay (mean = 17.8 ± 3.9).
The accumulation of OM from the algal biomass (which included microphytobenthos, pelagic phytoplankton, macroalgae) in the surface sediment was described by the chla and phaeopigment contents, with a mean value of 5.8 ± 4.8 and 28 ± 18.7μg⋅g−1 of dry sediment, respectively. The chla and phaeopigment contents were positively correlated with the TOC, TN and Org-P contents (Pearson’s coefficient > 0.6, p-value < 0.05).
3.3. Relationships between the sedimentary parameters and benthic nutrient fluxes
The stepwise multiple linear regression (MLR) allowed to select the best combination of sedimentary characteristics to predict the
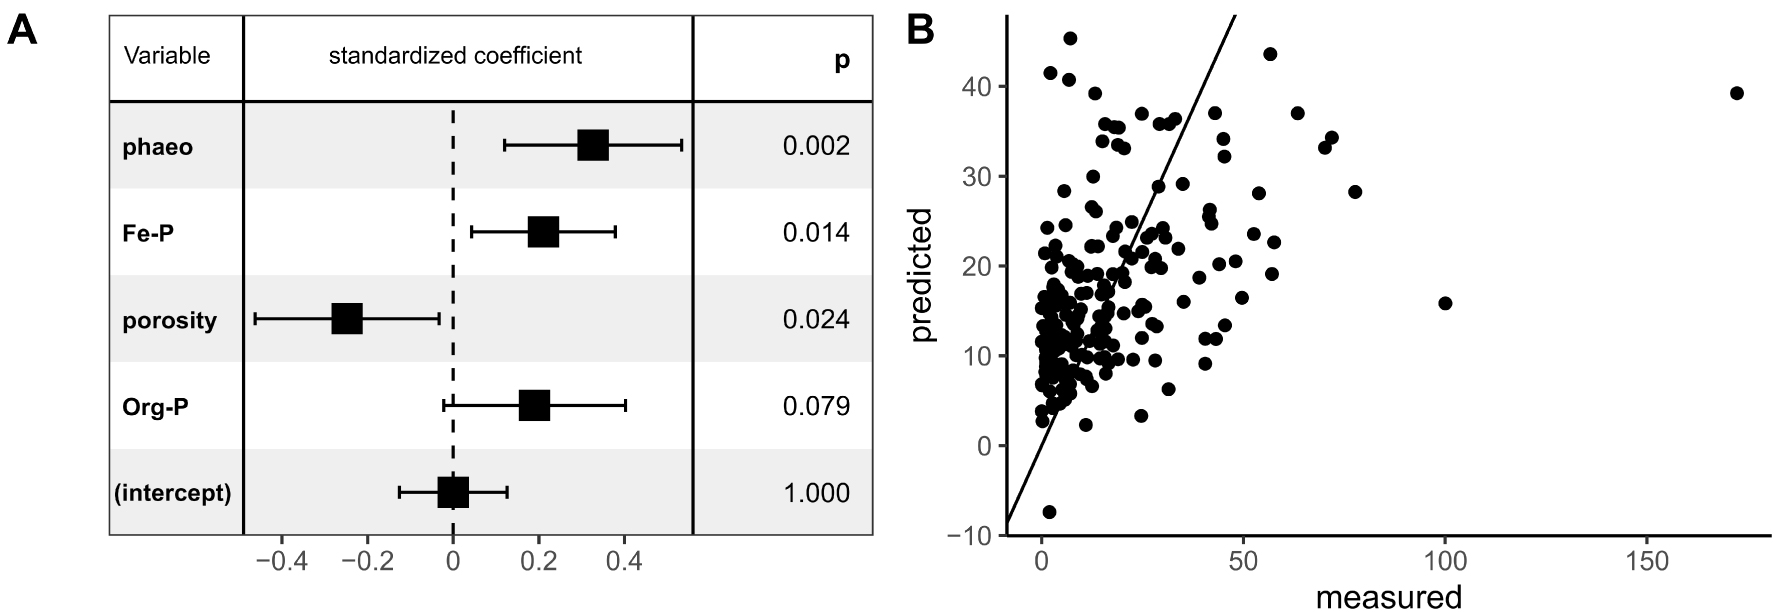
Parameters selected during the stepwise selection procedure by multiple linear regression (MLR) to predict PO4 flux (A). The effect of each parameter on the model was characterized by the standardized coefficient and its significance by the pvalue of F-test. The fitted values of PO4 flux by the model were plotted versus PO4 fluxes measured by core incubations (μmol⋅m−2⋅h−1) (B). The straight line represents the slope 1:1.
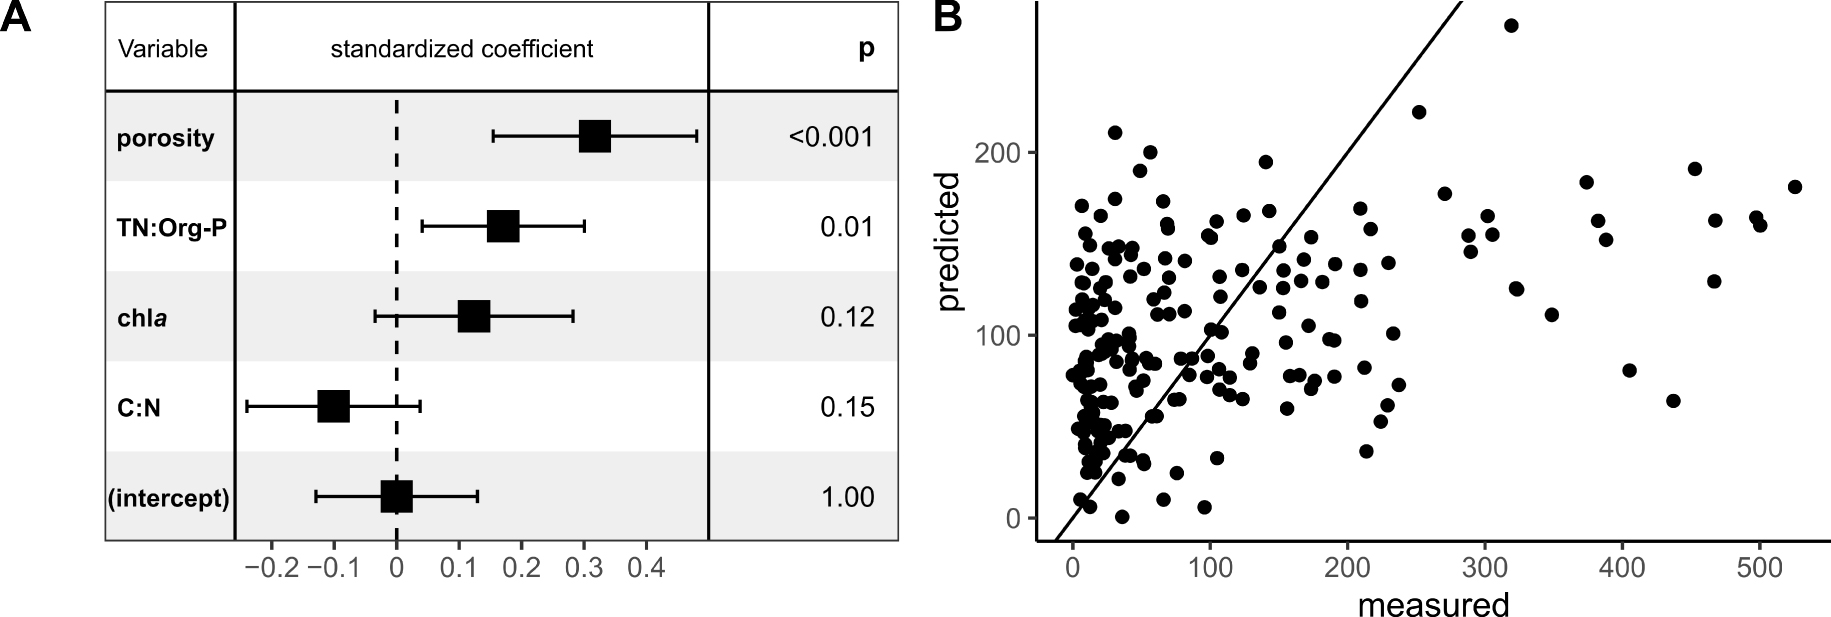
Parameters selected during the stepwise selection procedure by multiple linear regression (MLR) to predict
The accuracy of the prediction remained low for both models, with only 18 and 24% of the
4. Discussion
In the present study, 75% of the
Estimations of
| Location | Method | Period | PO4 flux | Reference | |
|---|---|---|---|---|---|
| Brittany mudflats, France | Core incubation | Spring 2019 | 101 ± 117 | 17 ± 20 | Present study |
| Aber Benoît, Brittany, France | Calculation from porewater profiles | May 2008 | 39 ± 16 | <6 | Andrieux-Loyer et al. [2014] |
| The Auray River, Brittany, France | Calculation from porewater profiles | May 2009 | 206 ± 47 | <6 | Andrieux-Loyer et al. [2014] |
| The Penzé River, Brittany, France | Core incubation | March 1985 July 1985 | 48 21 | 5 2 | Lerat [1990]; Lerat et al. [1990] |
| Marennes-Oléron Bay, France | Core incubation | March 1999 June 1999 | 138 ± 75∗ 58 ± 25∗ | Laima et al. [2002] | |
| Rågårdsvik and Bassholmen, Sweden | Core incubation | April–June 2000 | <70 | <5 | Sundbäck and Miles [2002] |
| Palmones River, Spain | Opaque PVC benthic chamber | May 1997 | 187 ± 18∗ | 1 ± 2∗ | Clavero et al. [2000] |
All incubations were carried out in the dark.
4.1. What are the main parameters of surface sediment driving the PO4 fluxes?
Four parameters were selected via the final MLR model in order to predict the PO4 fluxes: porosity, phaeopigment content, Fe-P content and Org-P content. Among the four selected parameters, the correlation between the Org-P content and the PO4 flux was not significant (F-test p-value > 0.05). Therefore, the porosity, phaeopigment and Fe-P contents were considered as the key variables for predicting PO4 fluxes.
The parameter presenting the most significant positive correlation for the PO4 fluxes was the phaeopigment content (F-test p-value = 0.002). The phaeopigment content is an indicator of algal biomass detritus in the SOM composition [Dell’Anno et al. 2002; Therkildsen and Lomstein 1993]. In the present study, the significant and positive correlations between the phaeopigment content and that of the TOC, TN and Org-P contents indicated that the organic matter was enriched in the surface sediment due to the accumulation of algal detritus. In the Auray River (Brittany, France), Andrieux-Loyer et al. [2014] also observed that the increase in the phaeopigment, TOC, TN and Org-P contents in the surface sediment was fueled by the occurrence of green macroalgae. An accumulation of algal OM most likely results in intense SOM mineralization, leading to both oxygen depletion in porewater and a shift in anaerobic mineralization from iron to sulfate reduction thereby enabling iron-sulfide formation [Lehtoranta et al. 2009]. Under these anoxic conditions, the adsorption of PO4 onto iron oxides would be less efficient, increasing the upward diffusion of PO4 from the sediment [Ekholm and Lehtoranta 2012 and references therein; Lehtoranta et al. 2009; Rozan et al. 2002]. Thus, surface sediment that is rich in algal detritus would be a more effective source of PO4 due to the creation of anoxic conditions and the subsequent desorption of P (Figure 7A). The solubilization of Fe-P has been shown to be a main process in PO4 release in overlying water from sulfidic sediments during macroalgal blooms [Rozan et al. 2002]. Consequently, sediment that is rich in Fe-P would represent a potentially bioavailable source of P under anoxic conditions. This is in good agreement with our results which identify the Fe-P content as the second main driver, and which was positively correlated with the PO4 flux.
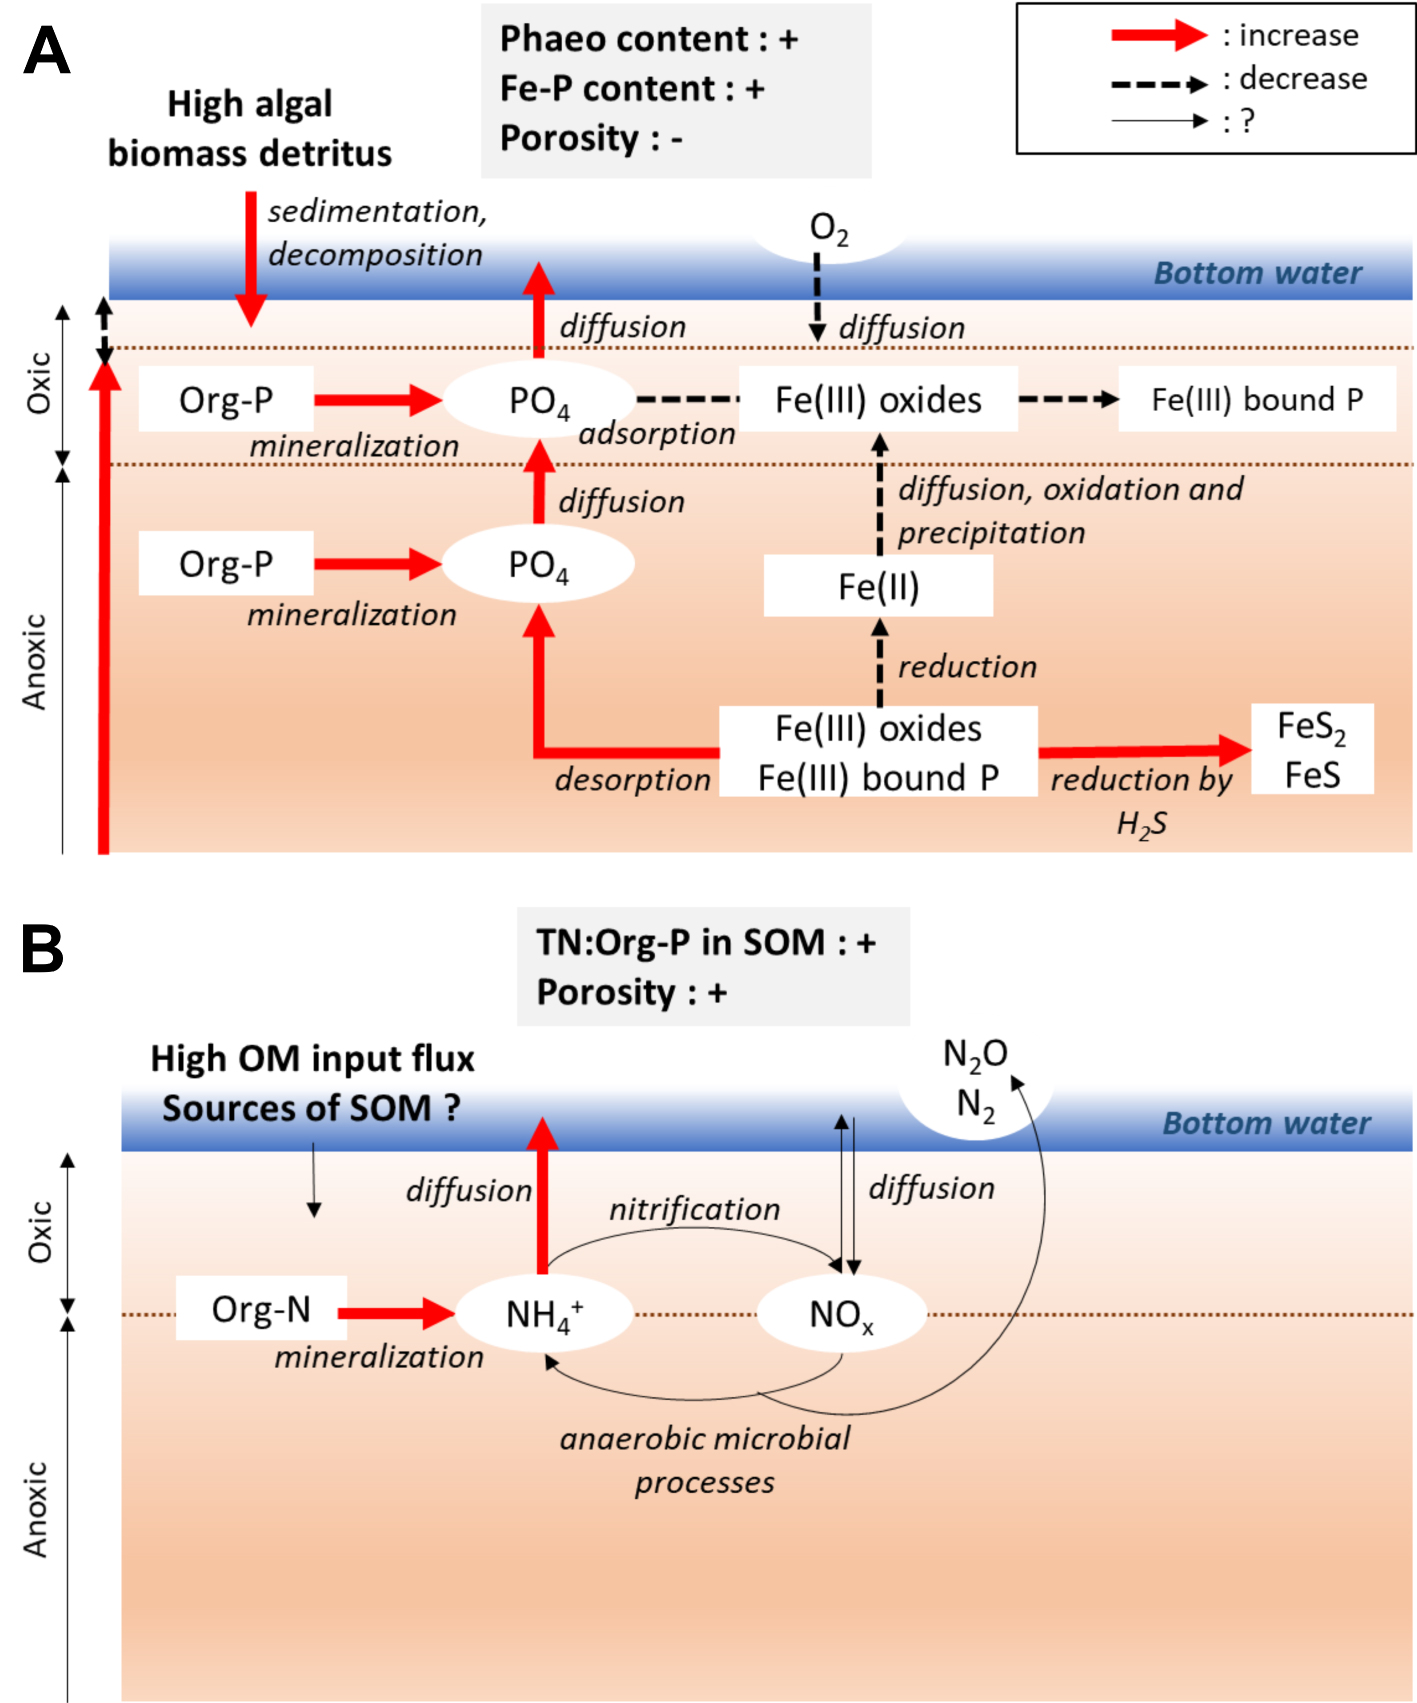
Stimulation of PO4 effluxes by an increase in phaeopigment and Fe-P content, and a decrease in porosity of surface sediment. A high algal biomass detritus and a low porosity decrease the oxic surface layer of sediment, and modify the anaerobic microbial reduction. This enhances the solubilization of Fe(III)-bound P, and avoids the re-adsorption of PO4 on Fe(III) oxides at the interface sediment–water (A). Stimulation of
Stimulation of PO4 effluxes by an increase in phaeopigment and Fe-P content, and a decrease in porosity of surface sediment. A high algal biomass detritus and a low porosity decrease the oxic surface layer of sediment, and modify the anaerobic ... Lire la suite
In contrast to the previous variables, porosity, the third main driver, was negatively correlated with the PO4 flux. An increase in porosity favors the diffusion of solutes through the sediment [Boudreau 1996], and as a result, a positive effect on the PO4 fluxes could be expected due to an upward diffusion from the sediment. On the other hand, high porosity may also improve the oxygen diffusion across the sediment–water interface [House 2003]. The ferrous ion (Fe2+) oxidation followed by the re-precipitation of iron oxides at the oxygenated interface, would increase the adsorption sites for PO4 [e.g. Krom and Berner 1980; Gunnars et al. 2002; Mayer and Jarrell 2000; Zhang et al. 2010]. This may limit the release of PO4 into the overlying water, thereby explaining the negative correlation between the porosity and the PO4 flux observed in the present study.
4.2. What are the main parameters of surface sediment driving the
The parameters selected by the final MLR model for predicting the
Contrary to the PO4 flux, the
The positive correlation observed between the porosity and the
In addition to the porosity, the
4.3. Sedimentary proxies: a good tool to predict
We hypothesized that the chla content and the C:N ratio, i.e. tracers of labile OM input fluxes explain the spatial variability in benthic nutrient fluxes and therefore allowing them to be used as proxies. Such correlations between these two parameters and the
In the present study, the stepwise MLR allowed to select the best combinations of parameters to predict
In addition, the contribution of biological parameters was not considered in the present work, which could explain the weak accuracy of prediction for both models of
5. Conclusion
The broad sediment sampling carried out at the regional scale in the present study has allowed to determine the main parameters of the surface sediment driving the
Acknowledgments
This work was funded by Loire-Bretagne Water Agency and the Regional Council of Brittany (France). It was carried out as a part of the IMPRO research project. The authors would like to thank O. Jambon and C. Roose-Amsaleg for their assistance in the field. The CEVA, the Syndicat Mixte EPTB Rance-Fremur, the Pays de Guingamp, the Syndicat Mixte des Bassins du Haut-Léon, the Syndicat des Eaux du Bas-Léon, Lorient-Agglomération, the Syndicat Mixte du SAGE Ouest-Cornouaille (OUESCO), Concarneau-Cornouaille-Agglomération, the Syndicat Mixte de la Ria d’Etel (SMRE) and the Syndicat Mixte du Loc’h et du Sal (SMLS) are acknowledged for their help in preparing the field campaign. The authors would also like to thank O. Lebeau (Plateforme Isotopes Stables, IUEM) and Marie-Claire Perello (EPOC, University of Bordeaux) for the elemental and particle-size analyses, respectively. S. Mullin is acknowledged for carefully checking the English content. The authors would also like to thank C. Rabouille for his constructive comments and suggestions in order to improve the quality of the paper.