


 CC-BY 4.0
1. Introduction
Southwestern France is at the boundary between a tectonic zone that has been stable for hundreds of millions of years, in the north, and a zone of recent tectonic activity, in the south. Current horizontal deformations measured by GNSS, either from campaign surveys [Asensio et al. 2012; Rigo et al. 2015], or from permanent station records [Nocquet 2012; Masson et al. 2019] are small. Even in the Pyrenees, the suture resulting from the collision between the Iberia and Eurasia plates, they are probably around 1 mm/year.
Despite this almost extinct current dynamic, the territory is classically described as having moderate seismicity, and displays a historical record over several centuries with important crises, such as the one of 1427–1428 on its southern border (Figure 1). An exploration of the SisFrance database (https://sisfrance.irsn.fr) reveals nearly 90 events of intensities larger than or equal to VI (MSK 64 scale) since the end of the Middle Ages. Several studies of the regional seismicity have already been conducted, principally focused on the active Pyrenean range [Pauchet 1998; Souriau and Pauchet 1998; Souriau et al. 2001; Rigo et al. 2005; Lacan and Ortuño 2012]. Due to less activity, the other regions of southwestern France have received less attention than the Pyrenees mountain range, and only studies on a national scale are recently available [Cara et al. 2015; Duverger et al. 2021].
(a) Main structural units of southwestern France. SH: Sillon Houiller; NPFT: North Pyrenean Frontal Thrust; SPFT: South Pyrenean Frontal Thrust; NPZ: North Pyrenean Zone; SPZ: South Pyrenean Zone; NWPZ: Northwestern Pyrenean Zone. (b) Historical seismicity (SisFrance database).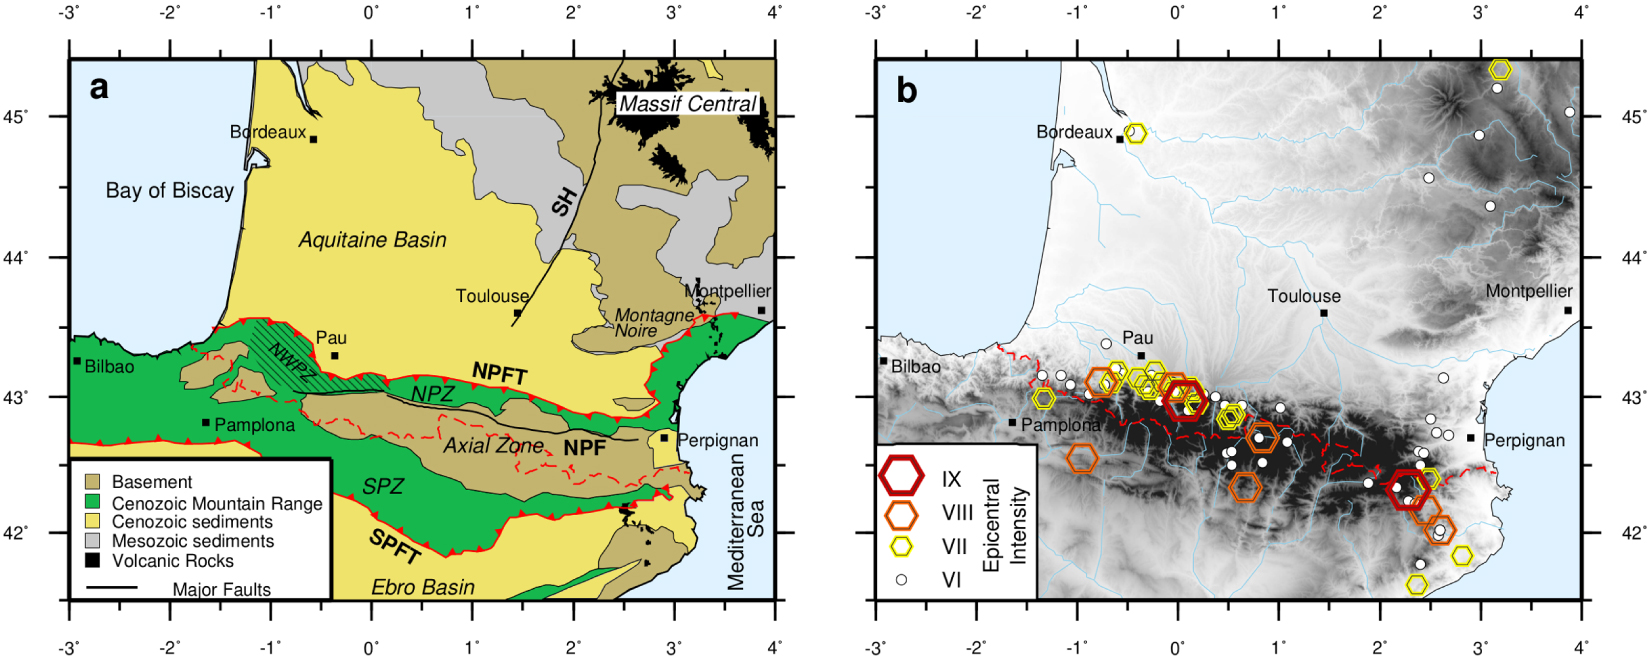
With a seismic monitoring that goes back to about 50 years ago, and the existence of a homogeneous network for almost 25 years in the Pyrenees, the seismicity catalogs now allow an interesting hindsight, all the more so over the Pyrenean chain. They consistently reveal new, increasingly clear, and most probably significant geographical patterns.
The present work reassesses the regional seismicity, taking advantage of the catalogs collected in recent years. It confirms the results discussed in previous works on the Pyrenees, such as the density of seismicity in a longitudinally elongated zone to the west of the chain, and two salient characteristics of this seismicity stripe: its northward deepening, and its segmentation into many clusters with well-defined contours. Futhermore, this clustering is not the prerogative of the western Bigorre–Basque Country zone, but it is observed over the entire Pyrenean chain, and even in the Massif Central and associated structures. A large part of this paper will be dedicated to detailed insights at many of the Pyrenean clusters.
Among the main clusters, two have a special status. The activity in the Lacq seismic zone, north of the Pyrenees, is undoubtedly of anthropogenic origin, linked to gas exploitation and more recently injection into wells. This zone has been the subject of specific studies and is currently experiencing renewed interest. South of the Pyrenees, the cluster that can be observed close to Pamplona, active since 2004, is probably linked to the impoundment of an artificial lake. Nonetheless, a recent increase in activity (summer/autumn 2020) needs to be analyzed in order to clarify this hypothesis.
A very interesting review of the tectonic activity in the Pyrenees has been proposed by Lacan and Ortuño [2012]. It compiles the potentially seismogenic faults, and subdivides the Pyrenees into active neotectonic domains, whose drivers it tries to understand. Our study will often rely on this synthesis.
Our study zone will encompass not only the southwestern quarter of France, but also the conterminous parts of Spain, and the whole territory of Andorra. It will be henceforth referred to as “southwestern France”. This territory is rectangular, and defined by its boundaries: 3° W/4° E and 41.5° N/45.4° N. The present paper will however primarily reflect the preponderant part of the Pyrenean chain in terms of regional seismicity (density, magnitudes, and thus hazard). Nevertheless, secondary seismicity foci exist in southwestern France, in particular in the extension of the Armorican seismicity (northwestern Aquitaine basin), and in the south of the Massif Central (Saint-Flour region, and down south to the Montagne Noire). The activity further north and west of these secondary foci is discussed in other papers of the same issue.
Many geographic or tectonic units (regions, cities, mountains, faults) are cited in this paper. Figure S1 (Supplementary material) allows the positioning of these units on maps.
2. Geological history and geodynamic context
Southwestern France can be divided into several areas (Figure 1). Its southernmost part, the one with the richest recent tectonic history, is occupied by the Pyrenees mountain range. The Pyrenees are bordered to the south by the Ebro plain and to the west by the beginning of the Cantabrian mountain range. To the north of the Pyrenees is the Aquitaine basin, the second largest sedimentary basin in France. It is itself bounded to the northeast by the Massif Central, of which the Montagne Noire, between Toulouse and Montpellier, is a part, geologically speaking.
The entire area under consideration, from the Massif Central to the Pyrenees, initially had a common geological history during the Hercynian orogeny. The destinies of the different units then diverged, notably from the opening of the Bay of Biscay in the Cretaceous between 115 and 80 Ma, according to a scenario that is still strongly debated. Several types of models are considered [e.g. Choukroune and ECORS, 1989, Olivet 1996; Sibuet et al. 2004; Jammes et al. 2009; Angrand et al. 2020], giving more or less importance to the North Pyrenean Fault, a Mesozoic left-lateral strike-slip plate boundary fault, and to the Ebro continental block [Angrand et al. 2020]. The large-scale (plurikilometric) sedimentary deposits that cover the Aquitaine basin, the southern Massif Central, and the northern and southern Pyrenean zones date from this period. The Eurasian margin was hyper-extended during an Aptian–Albian phase, and experienced massive uplift and exhumation of subcontinental mantle along the axis of the present chain [e.g. Jammes et al. 2009; Lagabrielle et al. 2010; de Saint-Blanquat et al. 2016]. The Alpine collision (Mesozoic/Cenozoic) between the Eurasian and Iberian continental margins took over about 65 Ma ago. The north–south shortening that operated during this collision leads to a consensus on its total balance, about 180 km, although differences exist between models, particularly concerning the vertical distribution of this shortening [Mouthereau et al. 2014]. The uplift of the Pyrenees was accompanied by a northward and southward discharge of meso-cenozoic marine sediments accumulated from the extension phases. The current division of the Pyrenean chain, schematically in three main areas (Figure 1), results from this history: (i) to the north, the North-Pyrenean zone (NPZ), heir to the central part of the rift, composed of Mesozoic flysch deposits [Puigdefabregas and Souquet 1986] overrides to the north the Aquitaine molasse basin. It is bounded to the north by the North-Pyrenean Frontal Thrust (NPFT), to the south by the North-Pyrenean Fault (NPF) and its western extension, the so-called Nappe des Marbres. It includes some paleozoic massifs: Agly and North-Pyrenean massifs in the east, Labourd and Basque massifs in the west; (ii) in the center, the heart of the chain, or axial Paleozoic zone, composed of uplifted Hercynian structures; (iii) in the south, the South Pyrenean Zone (SPZ), composed of Mesozoic sediments and Tertiary molasses, overrides to the south the Ebro basin; its southern limit is the South-Pyrenean Frontal Thrust (SPFT). Note the strong north–south asymmetry of the chain, apparent from the great difference in width of the northern (20–70 km) and southern (over 100 km) Pyrenean zones. Also noteworthy is one of the major structural characteristics of the Pyrenees: the vertical offset of the Moho at the level of the North-Pyrenean fault (abrupt thickening of 15–20 km towards the south), revealed by the active seismic experiments of the 1980s [e.g. Hirn et al. 1980; Gallart et al. 1981]. Interpreted as a northward underthrusting of the Iberian crust beneath the European plate [Roure et al. 1989; Choukroune et al. 1990], this asymmetry has recently been confirmed and specified by seismological imaging campaigns [PYROPE and OROGEN projects; [Chevrot et al. 2014, 2015, 2018; Wang et al. 2016; Diaz et al. 2018]. In particular, these campaigns have demonstrated, through receiver functions and full waveform tomography along 6 different transects, that the crustal architecture of the chain is resolutely moving away from the apparent first order cylindricity suggested by the surface morphology. One of the lessons of these studies is the probable existence, under the North-Pyrenean zone along the western half of the Pyrenees, of a continuous mantle body, although with pronounced lateral variations. This mantle body is at the origin of anomalies in the gravity field that we will discuss later. Another important feature is the disappearance in the east of the Moho jump. In their 2018 paper, Chevrot et al. assign this assymetry to the Cretaceous rifting history, and discuss at length the influence of structural inheritance on the deep orogenic architecture of the Pyrenees.
In the eastern part of the Pyrenees, and along the coasts of Roussillon and Languedoc, the alpine structures have been reworked by the Neogene, post-orogenic Mediterranean rifting, which gave birth in particular to intramontane (Cerdanya, Conflent, Capcir on the French side) and marine basins [e.g. Mauffret et al. 2001].
To the northeast of the Pyrenees, the Massif Central and its southern termination (Montagne Noire) were affected more indirectly by the thrust of the Alpine orogeny, which had as its main consequence a Cretaceous uplift of the Hercynian Massif from its eastern (Alpine influence) and southern (Pyrenean influence) borders. Another consequence is the formation of grabens related to the Western European rift, at the front of the Alpine chain, which is at the origin of the French Cenozoic volcanism. In our field of study, this volcanism manifests itself from the Miocene at the level of the Cézallier plateau, the Plomb du Cantal stratovolcano, the Devès plateau, but also further south (Aubrac region), and then through a string of small Oligocene to Pliocene volcanoes extending to the Languedoc coast (Agde).
Finally, it should be kept in mind that the area has been subjected to glacial influence over the course of time, including several phases of Plio-Quaternary glaciation on the Pyrenees. The influence of this overload and its evolution should be considered when looking at deformations, especially vertical ones. Indeed, vertical movements caused by isostatic reajustments are more and more often considered as linked to crustal density constrasts, and as a potential driving force for current seismicity, since horizontal deformations seem near zero [Asensio et al. 2012; Vernant et al. 2013; Rigo et al. 2015; Masson et al. 2019; Mazzotti et al. 2021].
3. Monitoring history
Seismic monitoring in southwestern France (and northeastern Spain) has had a long and complex history, since the installation of the first stations at the beginning of the 20th century. There are six main operators at stake, four on the French side, and two on the Spanish side:
- Commissariat à l’Énergie atomique (CEA), and Instituto Geográfico Nacional (IGN), two nationwide operators in France and Spain, respectively.
- Institut Cartogràfic i Geològic de Catalunya (ICGC), responsible for the monitoring of Catalonia.
- Institut de Physique du Globe de Paris (IPGP), responsible for the small Arette network, now discontinued.
- Observatoire de Physique du Globe de Clermont-Ferrand (OPGC), responsible for the monitoring of the Massif Central.
- Observatoire Midi-Pyrénées (OMP), responsible for the monitoring of the French Pyrenees; the networks set up by OMP and OPGC are related to the Réseau National de Surveillance sismique, a federation of networks held by academic partners.
These various operators deployed, maintained and dismantled more than 200 long-term monitoring stations in our study area over time, in 5 different periods (before 1970, 1970–1985, 1985–2000, 2000–2010, 2010–present), following local, regional, and national logics. The interested reader will be able to find the details as Supplementary material S3. Temporary experiments are not mentioned, although they provided part of the data.
By 2021, the deployment of the rejuvenated and homogeneized French permanent broadband network (RLBP), within the framework of the RESIF-EPOS Research Infrastructure (Réseau Sismologique et Géodésique Français, www.resif.fr), is almost complete. Figure 2 shows the status of the seismological observation system over southwestern France and the associated study area at the beginning of 2021. 47 modern velocimetric stations are presently deployed in France, complemented by about half that amount in Spain.
Permanent seismological stations in southwestern France and neighboring countries in 2021. Only velocimetric stations are displayed, whatever their owning institution. The color code represents the date of the first set-up. Dismantled stations are not reported on this map.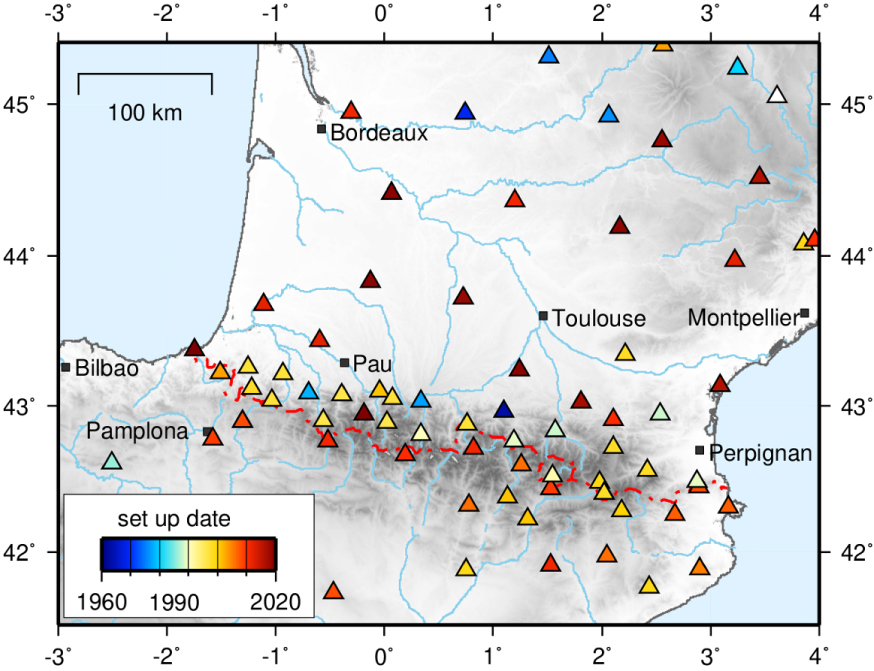
4. Seismicity catalogs
In light of the network monitoring history, it seems impossible to rely on a single catalog to describe the instrumental seismicity of southwestern France. Indeed, the evolution of monitoring networks as well as the heterogeneity of their station density imposes a spatio-temporal division of this catalog, with in particular a separate treatment of the Pyrenean zone.
For the period 1962–2009, a comprehensive synthesis work was carried out by Cara et al. [2015] at the scale of metropolitan France. The resulting catalog compiles the preferred locations of the various contributing organizations (including OMP), and introduces a new homogeneous Mw magnitude scale. Following a similar procedure, it has since been later completed by integrating the locations made using the data of the RéNaSS and CEA stations. It will be referred to hereinafter as the “SIHEX-BCSF catalog”, and covers the period from 1962 to 2019. On our study area, it counts 21,128 events. Because of the inhomogeneity in the spatial coverage of the observation networks, as well as their evolution in time, it cannot be used for fine studies. In addition, the location procedures of the different contributors are highly variable, which makes comparisons difficult. We will only use it to construct the most general, large-scale maps (Figures 4 to 7). Note that for the Lacq gas field area, the 1974–1997 database recorded by Strasbourg and Grenoble local networks has been homogeneously analyzed (including picking, localisation based on 3D velocity model, waveform analyses, focal mechanism—see Section 6.3.3). This subcatalog comprises 1721 events which are included in the “SIHEX-BCSF” catalog.
On the Pyrenean zone sensu stricto, rather than considering the SIHEX-BCSF catalog, we preferred to limit the duration of observation, and to privilege the original work by using a local catalog which we name hereafter OMP catalog. Three periods must be considered, linked to the evolution of the networks. For the first two epochs, the location procedures are detailed in Souriau and Pauchet [1998].
∙ For the period 1978–1988, only the dense network of Arette was operating in addition to the few CEA stations. We will use the catalog of the IPGP, homogeneous between 1978 and 1992 [see Souriau and Pauchet 1998]. The seismicity of this period is thus essentially centered on Béarn (northwestern Pyrenees). The magnitudes have been aligned with those of the CEA.
∙ For 1989–1996, the pickings of all available stations from the various networks (essentially IGN, ICGC, IPGP, CEA, OMP) were collected, and the earthquakes for which there was more than one contributing network, relocated [Pauchet 1998; Souriau and Pauchet 1998]. The qualities of the solutions were estimated in a qualitative way (labels A to D), similar to that of the HYPO71 procedure [Lee and Lahr 1975]. The magnitudes were aligned with those of the CEA, using linear regressions between magnitude scales.
∙ From 1997, the redeployment of the OMP network on the whole French Pyrenees allows the assembled catalog to be considered homogeneous, at least on the French side and in Catalonia. This is less true on the Spanish side, in Navarra and Aragon, due to a sparser coverage. The procedure implemented consists, as for the 1989–1996 period, in collecting all the parametric data available from the different operators, and in relocating the earthquakes in the same way. Thus, the catalog obtained presents an optimal coherence over time. The data used are the arrival time picks and magnitudes from the CEA, ICGC, IGN, RéNaSS bulletins, as well as the pickings made by OMP. The localization procedure is described in Cara et al. [2015]. It involves multiple runs of the HYPO71 software, with different starting depths for the trial hypocenter. It adopts a unique 1D crustal model determined from seismic profiles [Daignières et al. 1981; Njike-Kassala et al. 1992]. The accuracy of the locations was evaluated by Sylvander [2013] and Souriau et al. [2014], comparing the results obtained by this procedure with reference locations of the Lourdes–Argelès seismic crisis, carried out in a local 3D model and with temporary stations at very short distances [Sylvander et al. 2008]. These authors allowed key parameters (distance to the nearest station, first azimuthal gap, number of P and S picks, crustal model) to vary in the localization procedure, simulating realistic configurations relevant for the whole catalog, and they examinated the resulting trends of the deviation to reference locations. Therefore, their results are not limited to the Lourdes–Argelès crisis. The conclusions are that the horizontal uncertainties are less than 2 km for 75% of the earthquakes in the catalog, and greater than 4 km for only 3%. When at least one station is available at a distance of less than 20 km, the vertical uncertainties are of the same order (2 km). Note however that for earthquakes outside the network, or at a significant distance from the nearest station, these uncertainties increase. Theunissen et al. [2018] showed that in that case, and in that case only, locations in a 3-D model become more accurate.
The local magnitudes of ML type provided by the different network operators are all aligned, via annual linear regressions, with respect to the CEA magnitude, which is considered to be the most homogeneous over the long term. This procedure results in a multi-organism average magnitude, aligned on the CEA scale. Figure S2 (Supplementary information) shows as an example the annual regressions for year 2014. As for the SIHEX-BCSF catalog, special attention is given to the elimination of artificial events from the OMP catalog [Cara et al. 2015].
Note that the SIHEX-BCSF and OMP catalogs coincide over the period 1989–2009, which results from the choice adopted for the construction of the SIHEX catalogue, i.e. to select as a “best quality” solution the localization performed by local institutes, when available [Cara et al. 2015]. For the period 2010–2019, the qualities of the OMP solutions should be better overall than those of the SIHEX-BCSF catalog, particularly due to the inclusion of Spanish pickings. They should therefore be included in a future version of the SIHEX catalog to achieve homogeneity.
Frequency/magnitude (Gutenberg–Richter) relationship for the homogeneous catalog OMP 1997–2019. Left: whole Pyrenees; right: French side of the range only.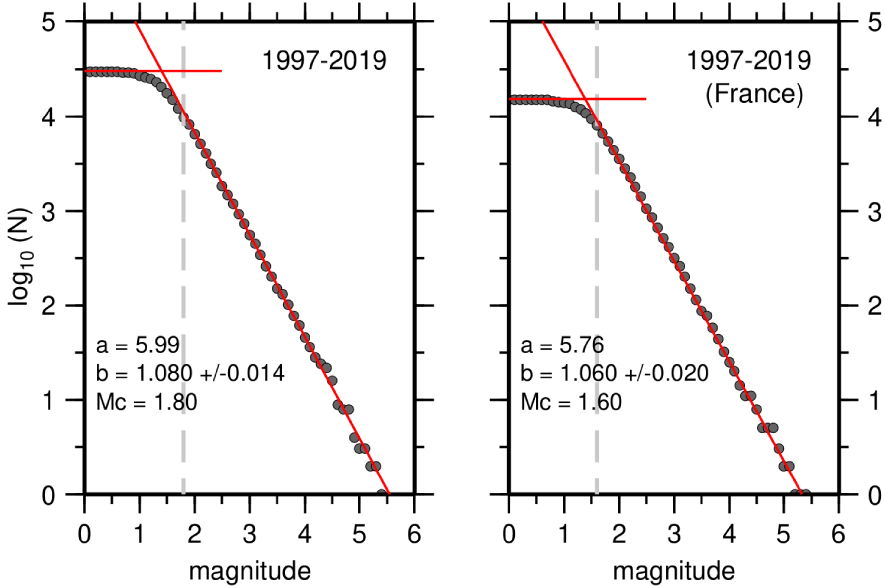
On such a homogeneous catalog, a Gutenberg–Richter law can be calculated without risk. Rigo et al. [2018] used this same catalog to study the depth dependence of this relationship, and its spatial variations—we therefore refer the reader to their study for more focused results. Here, over the entire period considered (1997–2019), we obtain a slope (b parameter) of 1.08 if we consider the whole Pyrenees, and of 1.06 if we limit ourselves to the French territory sensu stricto (Figure 3). This value is closely similar to that obtained by Marin et al. [2004] for the Pyrenees (b = 1.062) in spite of very different data sets. An extrapolation to large magnitudes suggests a return period of earthquakes of magnitude MLCEA = 6 (Mw = 5 according to the law derived by Cara et al. [2017] of the order of 70 years for the whole Pyrenees, 90 years for the French side. For an earthquake of magnitude MLCEA = 6.5 (Mw ∼ 5.5), we reach an interval close to 380 years for the French territory. These numbers are consistent with our knowledge of the historical seismicity.
The average hypocentral depth over this 1997–2019 catalog is 6.5 km (std 4.1 km).
In the end, the catalog of Pyrenean earthquakes of the OMP contains about 35,900 events: 30,000 for the period 1997–2019, 3100 for the period 1989–1996, and 2800 for 1978–1988 (Béarn).
Depending on the case, the figures shown in the rest of this paper will be based on one or the other of these catalogs: SIHEX-BCSF or OMP, and in the latter case on one period or another. The chosen catalog and the reasons for this choice will be explained each time.
5. Focal mechanisms
A number of studies have investigated the focal mechanisms of Pyrenean events. Rigo et al. [2015] have established a compilation of focal solutions, based on earlier work by Nicolas et al. [1990], Delouis et al. [1993], Souriau et al. [2001], Dubos et al. [2004], Ruiz et al. [2006b], Sylvander et al. [2008], and Chevrot et al. [2011]. Stich et al. [2018] computed the moment tensor of the 1923 Berdún (Navarra) earthquake from ancient recordings. Mazzotti et al. [2020] have added about fifteen additional novel solutions computed by the Observatoire Midi-Pyrénées. In total, about 200 mechanisms are available in the most complete of these compilations, which however does not claim to be exhaustive. Indeed, there is no systematic calculation of the focal mechanisms of earthquakes for southwestern France, except for a few events of sufficient magnitudes to be considered via moment tensor approaches [Delouis 2014].
Instrumental seismicity in southwestern France between 1962 and 2019. File from the Si-Hex project [Cara et al. 2015] completed for the period 2010–2019 with BCSF-RéNaSS catalogue (from renass.unistra.fr). Magnitudes are Mw magnitudes. Faults are from Baize et al. [2013] and Jomard et al. [2017].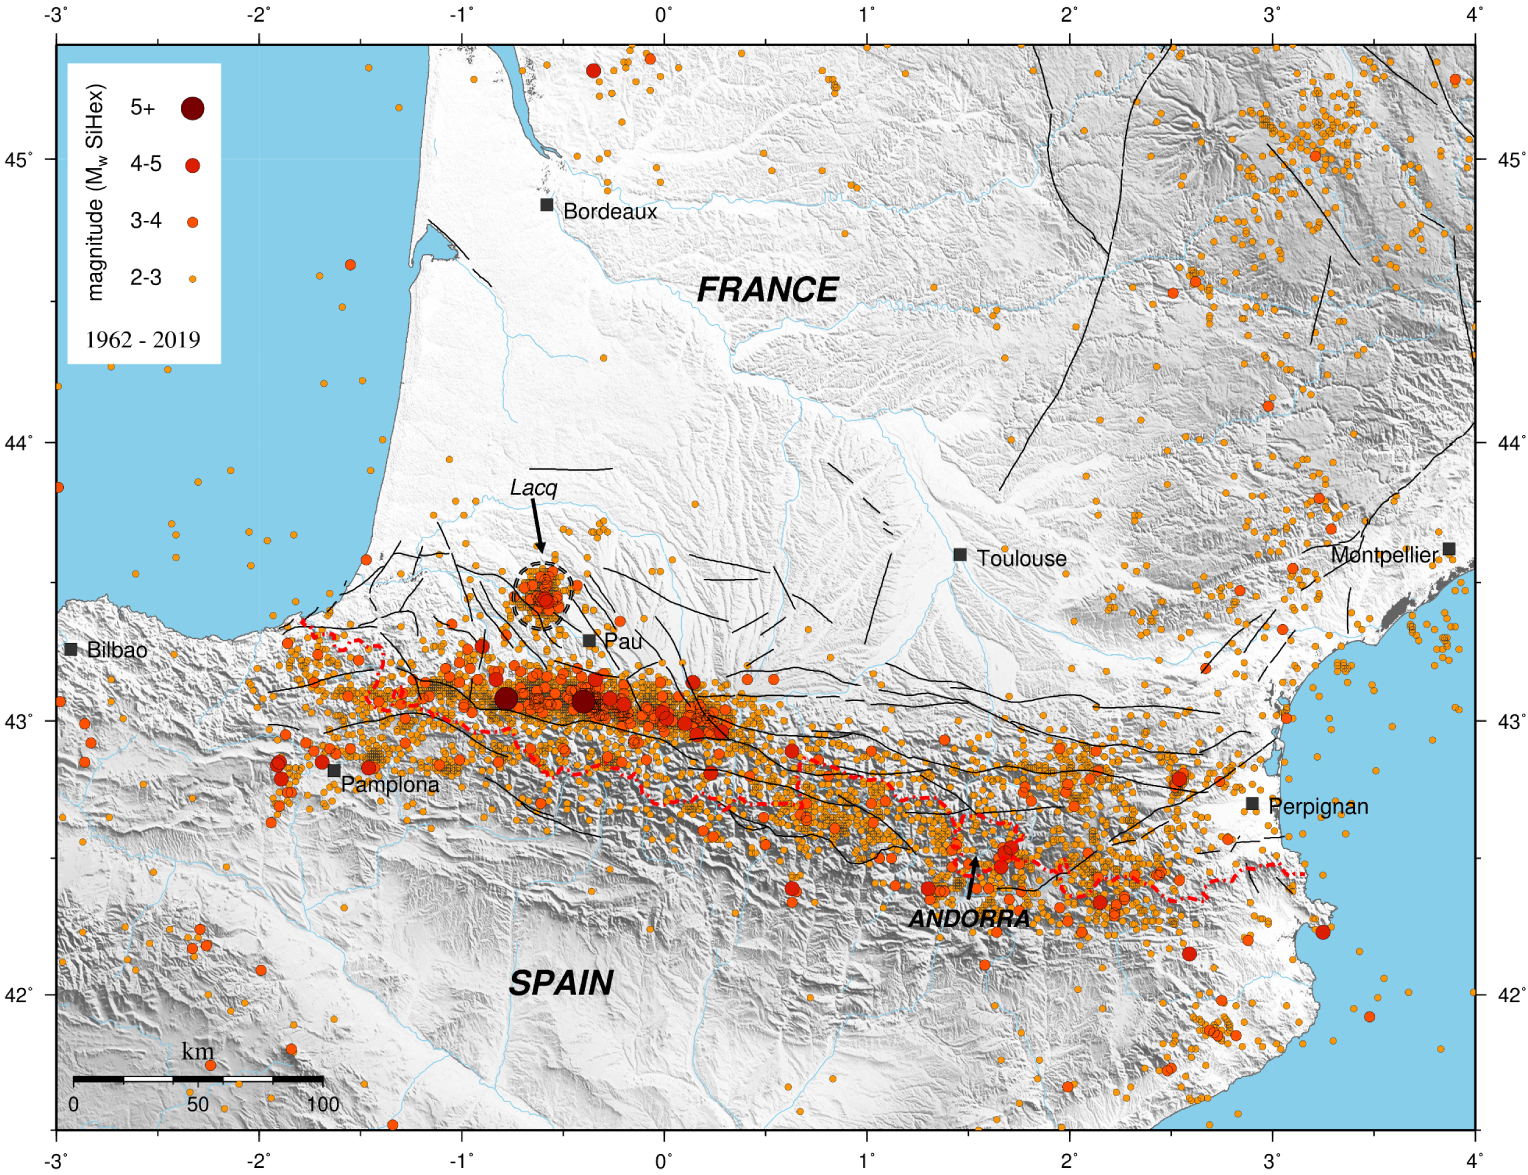
The study of these focal mechanisms in the Pyrenees reveals a great diversity of faulting styles. Whatever the scale of observation, this diversity does not make it possible to highlight any particular coherence by inversion of the stress tensor or of the deformation rates tensor [Rigo et al. 2015]. Only the Central Pyrenees zone shows a certain homogeneity, with an extension perpendicular to the axis of the range, compatible with the results obtained on the horizontal deformations observed by GNSS [Asensio et al. 2012; Rigo et al. 2015; Masson et al. 2019]. Our study does not bring many new elements in this field compared to the very comprehensive studies by Rigo et al. [2015] and Mazzotti et al. [2020]. However, our description of seismicity clusters in Section 6.3, and the discussions therein, will address some style-of-faulting aspects in and around these groups. Figure 12 displays significant events with their mechanisms, in relation with the clusters.
6. Results
6.1. Global maps
At the scale of the whole study area, the SIHEX-BCSF catalog is of course privileged.
Figures 4 and 5 show the seismicity obtained over the period 1962–2019. Figure 4 is a classical representation, where each event is shown on the map. However, this type of plot quickly becomes unreadable with prominent catalogs. One solution is to show only events above a certain magnitude threshold, but this choice is debatable, as it may lead to the visual elimination of clusters or swarms dominated by small sources. Instead, we have chosen to represent on Figure 5 the density of earthquakes, i.e. very simply at any point of a regular 1 km × 1 km grid, the total number of events (whatever their magnitudes or depths) within a given distance. The choice of this distance is the result of a compromise between coverage and precision. Knowing the large ( >10 km) uncertainties of the SIHEX-BCSF catalog on periods when coverage was sparse, it would be illusory to look for too high a resolution. We retained a search radius of 5 km.
Seismicity density in southwestern France, expressed as the number of events within a distance of 5 km, whatever their magnitudes or depths. Same database as Figure 4. The grid node spacing is 1 km. A and B denote the two regions highlighted in Figures 6 and 7 (see text).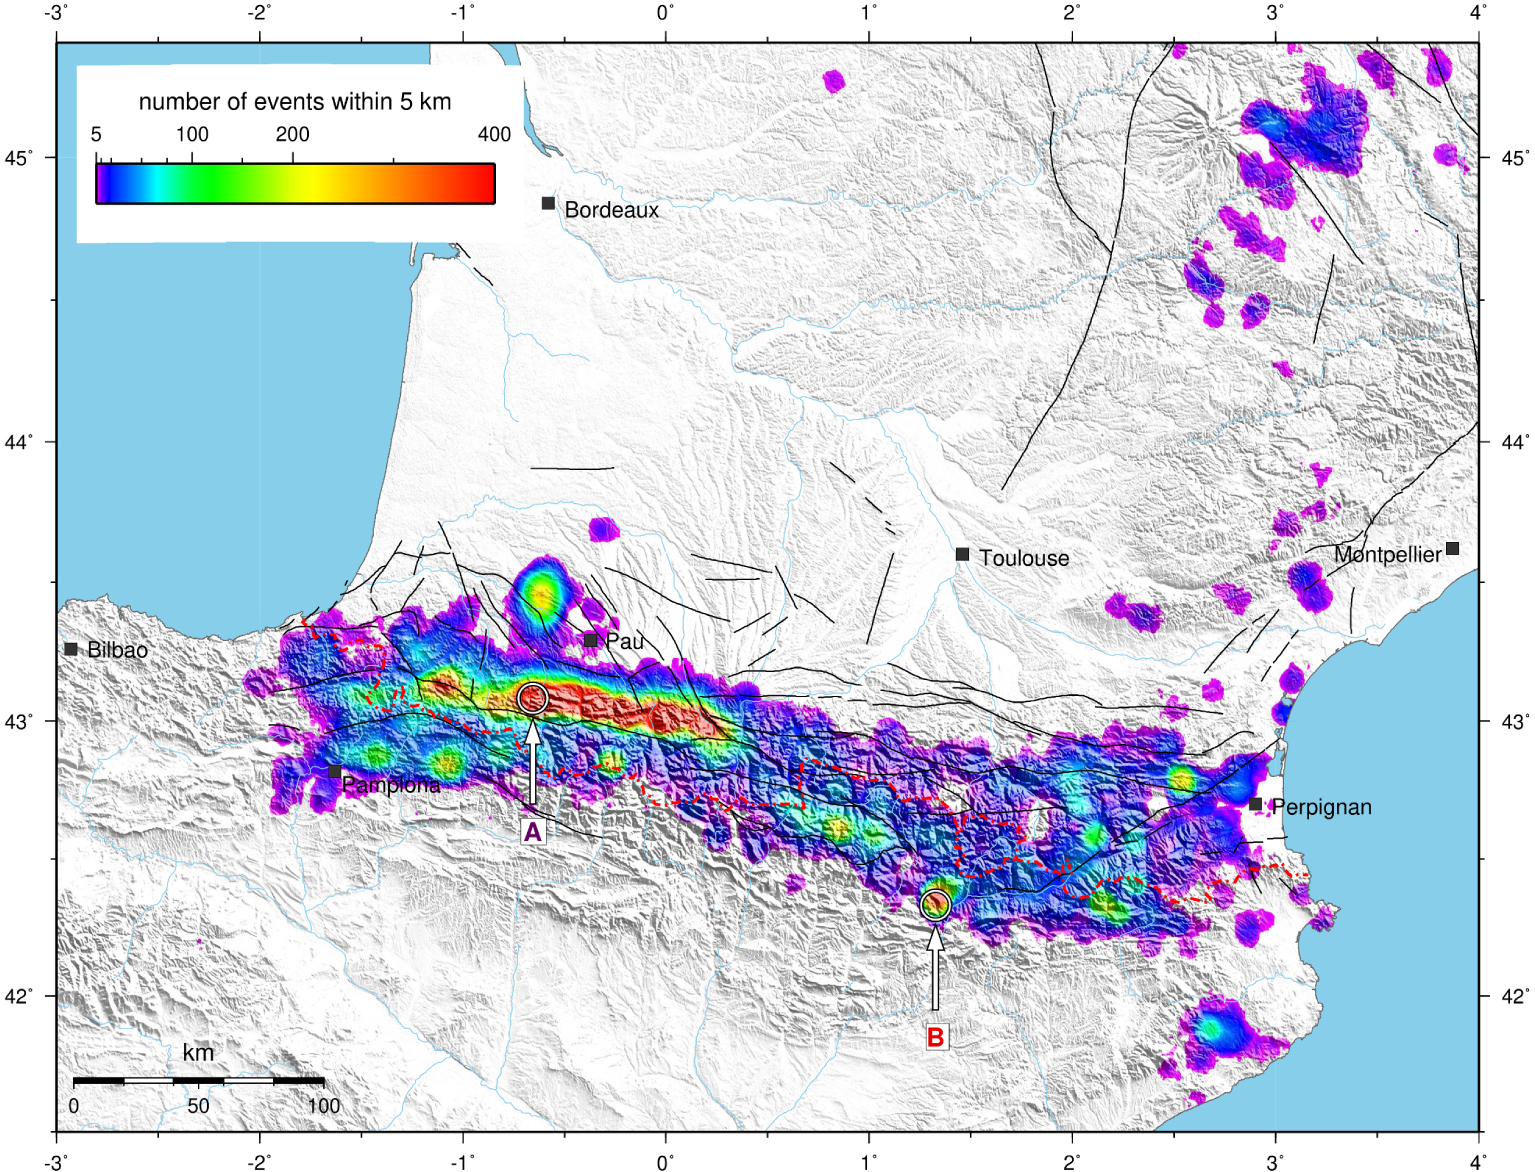
The first-order observations that can be made from these two maps, individual events and density, are the same as in previous studies [e.g. Souriau et al. 2001; Lacan and Ortuño 2012; Stich et al. 2018]. Firstly, a dichotomy is apparent between the east and west of the Pyrenees. The usual seismicity stripe between Bigorre and Béarn (North Western Pyrenean Zone, or NWPZ, one of the five seismotectonic regions considered by Lacan and Ortuño 2012) stands out particularly well on both types of representation, and ends abruptly to the east at the level of the Adour valley. Further east, the seismicity is sparser and more spread out. The most intense seismicity thus does not occur under the high peaks (except close to the Maladeta, and a cluster towards the Balaitous), but rather along the transition between the axial zone and the North-Pyrenean Zone (the North-Pyrenean Fault). The induced seismicity patch of the Lacq gas field stands out, north to the Pyrenean domain.
As this is the first time we have had the opportunity to extend the study area this far north, we are fortunate to be able to comment on the seismicity of the northern and eastern edges of the Aquitaine basin. To the northwest, the influence of the South Armorican Shear Zone, still significant in the La Rochelle–Rochefort–Oléron area (outside of Figures 4 and 5, to the NW), seems to be highly attenuated. The activity appears to be very low, with a mere 60 events since 1980. However, note the recent occurrence of a stronger than usual earthquake (20/03/2019, ML = 4.9, Duverger et al. 2021), with almost a purely strike-slip faulting, and WNW–ESE and NNE–WSW nodal planes. Except for this event and one aftershock, the magnitudes did not reach 3.0 in this area since 1960. Figure 1b nevertheless shows that the long term needs to be considered: an event of macroseismic intensity between VII and VIII was widely felt and seemingly quite destructive in the region of Bordeaux in 1759.
To the east, though not reaching the level of the activity in the Pyrenees, the seismicity of the Massif Central is more intense than that of the northern Aquitaine basin [Mazabraud et al. 2005]. The activity is generally described as non uniform, with several regions standing out [Battaglia and Douchain 2016]. The focal depths do not exceed 11 km, and the magnitudes are moderate, seldom reaching 4.0 (ML). In our study area, the most active zone is that of the Saint-Flour graben, east of the Plomb du Cantal major stratovolcano. One main cluster can be identified just east of Saint-Flour, and a second one further west (Figure 5). The eastern cluster was principally active between 1991 and 1993, whereas the western one burst essentially in september 1986. Battaglia and Douchain [2016] attribute these earthquakes to the reactivation of the boundary fault system of the Saint-Flour graben. They would thus be the result of the extension, still active, of the graben. The macroseismic epicenter of the 1833 Cézallier earthquake (intensity VII) is just 30 km away from the main local seismicity cluster. Further south, a very diffuse seismicity spreads down to the Montagne Noire (the southern termination of the Massif Central), and the Languedoc Mediterranean coast.
The overall spatial clustering of events leads us to question the temporal aspects, and more precisely to wonder about the regularity in time of the seismicity. To keep the benefit of the general view, and before going into more details in the study of the clusters, we try to evaluate at this same scale the regularity of the local temporal distribution of seismicity. At each point on our 1 km × 1 km spatial grid, instead of considering the total number of earthquakes within a radius of 5 km, we look at the numbers in 6-month time windows. We calculate then the percentage of events in the highest bin of this distribution, i.e. the 6-month window during which the seismic activity was the most intense, with respect to the total number over 40 years. We limit this calculation to a duration of 40 years (1980–2019), since we estimate that the looseness of the coverage before 1980 yields almost empty bins, which deprives the analysis of its meaning. This percentage gives a very good idea of the regularity of the seismic activity, as illustrated by Figure 6.
Illustration of the regularity parameter at two locations of the spatial grid (see Figures 7 or 8). The seismic activity around one grid point is divided in time windows (bins) of equal duration (6 months). If the seismic activity is regular (region A), the value of the regularity parameter will be low. If most events are concentrated in few bins (region B), it will be high. Note that for these two regions, the coverage of the monitoring stations has been homogeneous since the early 1980s (A) and late 1980s (B)—see Supplementary Information S3 for details.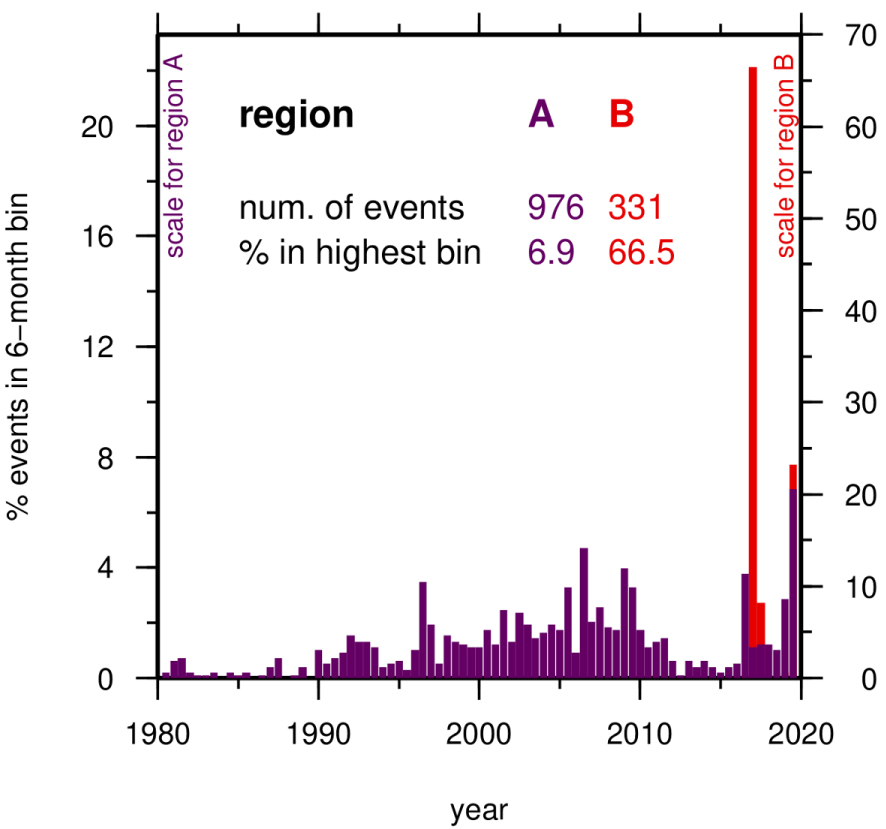
The map resulting from this processing (Figure 7), allows to classify clusters at first sight, according to their type of activity. Of course, no credit should be given where the activity is too low for the regularity parameter to be representative. Generally speaking, we recommend that it only be exploited for the analysis of proven clusters, such as revealed by the density map (Figure 5). The same analysis was conducted with various durations of the time windows (3 months, 6 months, 1 year), giving almost the same results. The 6-month case is the one for which the map is the most contrasted.
Regularity over time of the seismicity in southwestern France, expressed as the percentage of events in the most populated 6-months time-window. Same database as Figure 4. Same grid and search radius as Figure 5. Areas with marked episodic activity appear in red. A and B denote the two regions highlighted in Figure 6.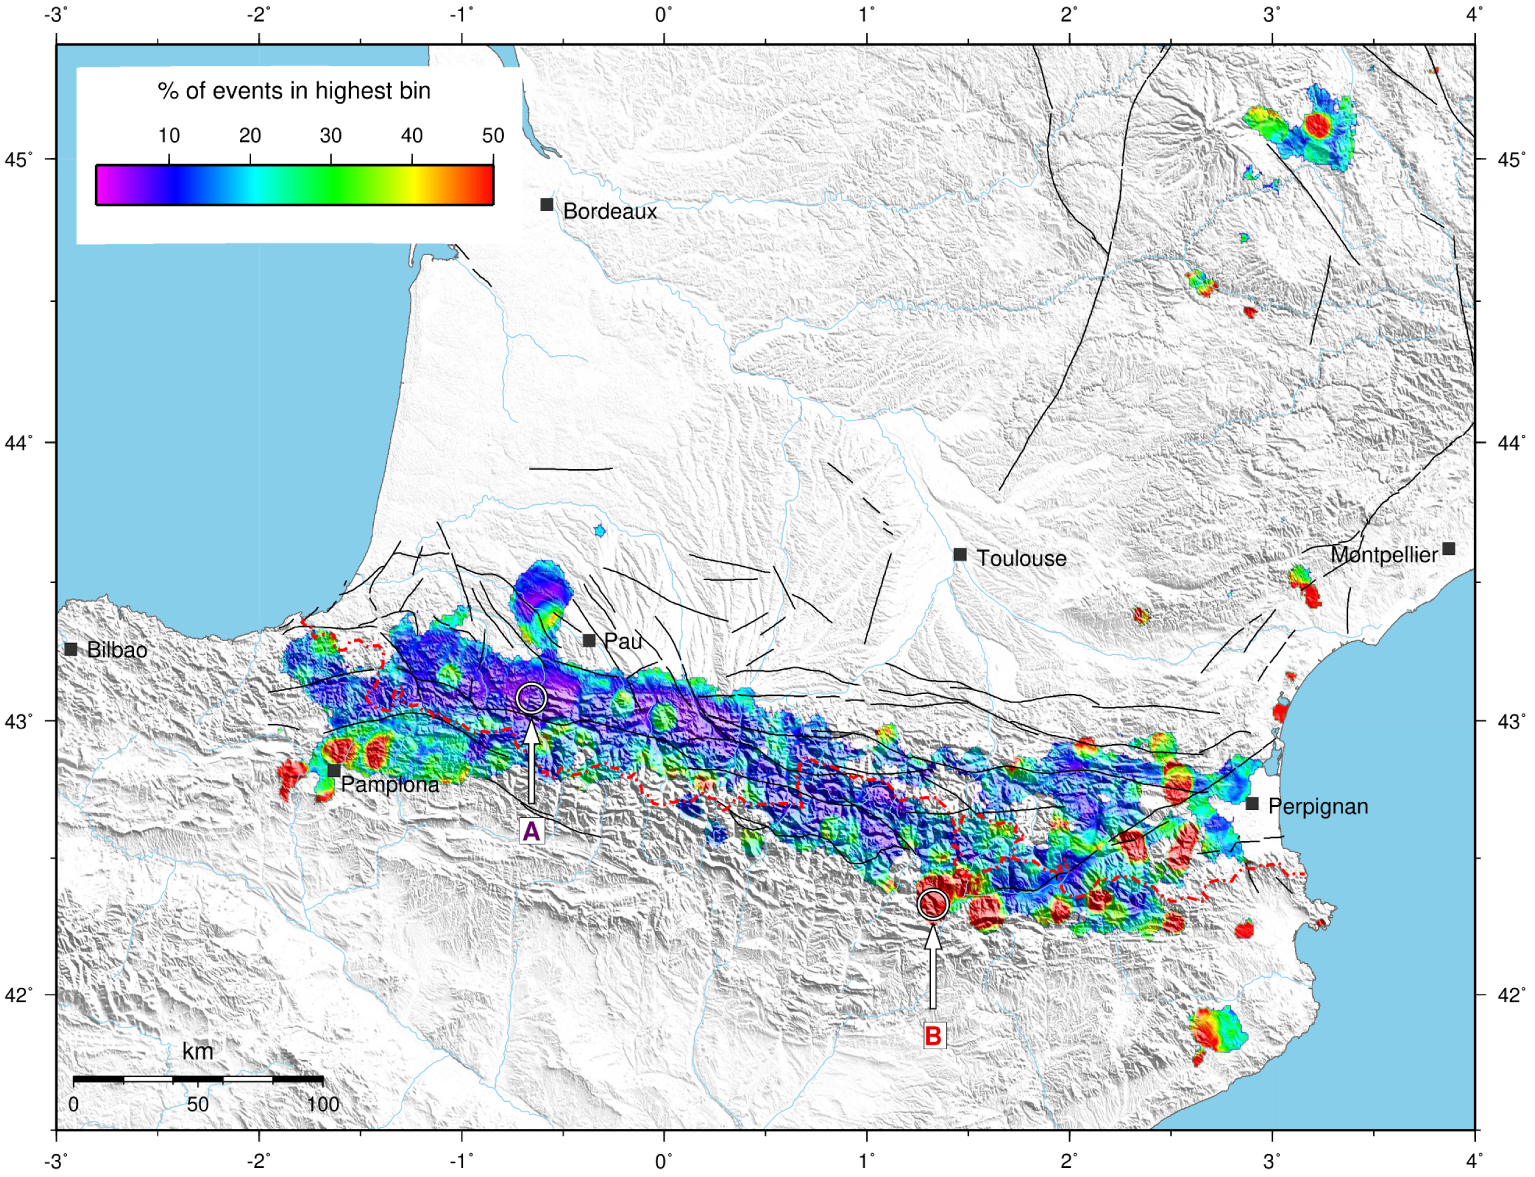
Figure 7 shows that this regularity parameter is an interesting tool, that can help identify peaks of activity such as short-duration swarms or mainshock/ aftershock sequences. In the Pyrenees, for example, the regularity map allows to identify immediately the episodic nature of seismicity in the region of Pamplona, in Alt Urgell (southwest of Andorra), and at the level of several clusters to the east of the range. The seismicity stripe of the NWPZ, with very regular seismicity in general, also seems to present areas of less regularity, towards the east (Aucun, Argelès-Gazost). Several small clusters are also pointed by this analysis between the Massif Central (the two swarms close to Saint-Flour) and Languedoc. Even in the Lacq gas field region, the southeast area clearly shows a patch of irregularity, that corresponds to a single activity peak in 2005, probably related to injection experiments.
However, these large-scale maps, based on a spatially and temporally heterogeneous catalog, do not allow us to go very deep into interpretation and discussion. This refining will be performed at smaller scale, relying on local catalogs.
6.2. Focus on the Pyrenees
As mentioned previously, the seismicity catalogs gathered by Observatoire Midi-Pyrénées (OMP) are more reliable and accurate than the SIHEX-BCSF catalog, for spatio-temporal homogeneity reasons. However, the quality of the OMP hypocentral solutions decreases with increasing distance from the OMP stations. Since the OMP network was historically deployed along the Pyrenean range, with no stations in the forelands before 2012, the off-axis events are poorly localized. Therefore, the following section will focus on the Pyrenees. Even the seismicity of the Lacq gas field taken from the OMP catalog is not sufficiently reliable, as shown by Theunissen et al. [2018].
Figure 8 shows seismicity and density maps centered on the Pyrenees, as extracted from the OMP catalog for the periods 1997–2019 (seismicity) and 1989–2019 (density). The density map of Figure 8b is similar to the one obtained from the SIHEX-BCSF catalog (Figure 5) but for the period (31 years) and the search radius. Knowing the uncertainties of localization, we chose to privilege the resolution of the map, by representing the number of earthquakes within a radius of 1 km (instead of 5 km) at any point of the grid. The contours of the clusters in Figure 8b (and subsequently Figures 10, 11 and 12) are thus greatly refined, and some are even subdivided into several smaller clusters. On the contrary, some clusters disappear, due to the time limitation of the second processing. This underlines the episodic nature of the activity in these regions—and thus the need for long-term seismic monitoring.
(a) Instrumental seismicity in the Pyrenees between 1997 and 2019 (OMP best catalog). (b) Seismicity density in the Pyrenees (see Figure 5). OMP catalog for the period 1989–2019. Same grid as Figures 4 to 6, search radius 1 km. The boxes correspond to the two areas mapped in Figures 10 and 11. Active faults are from Lacan and Ortuño [2012].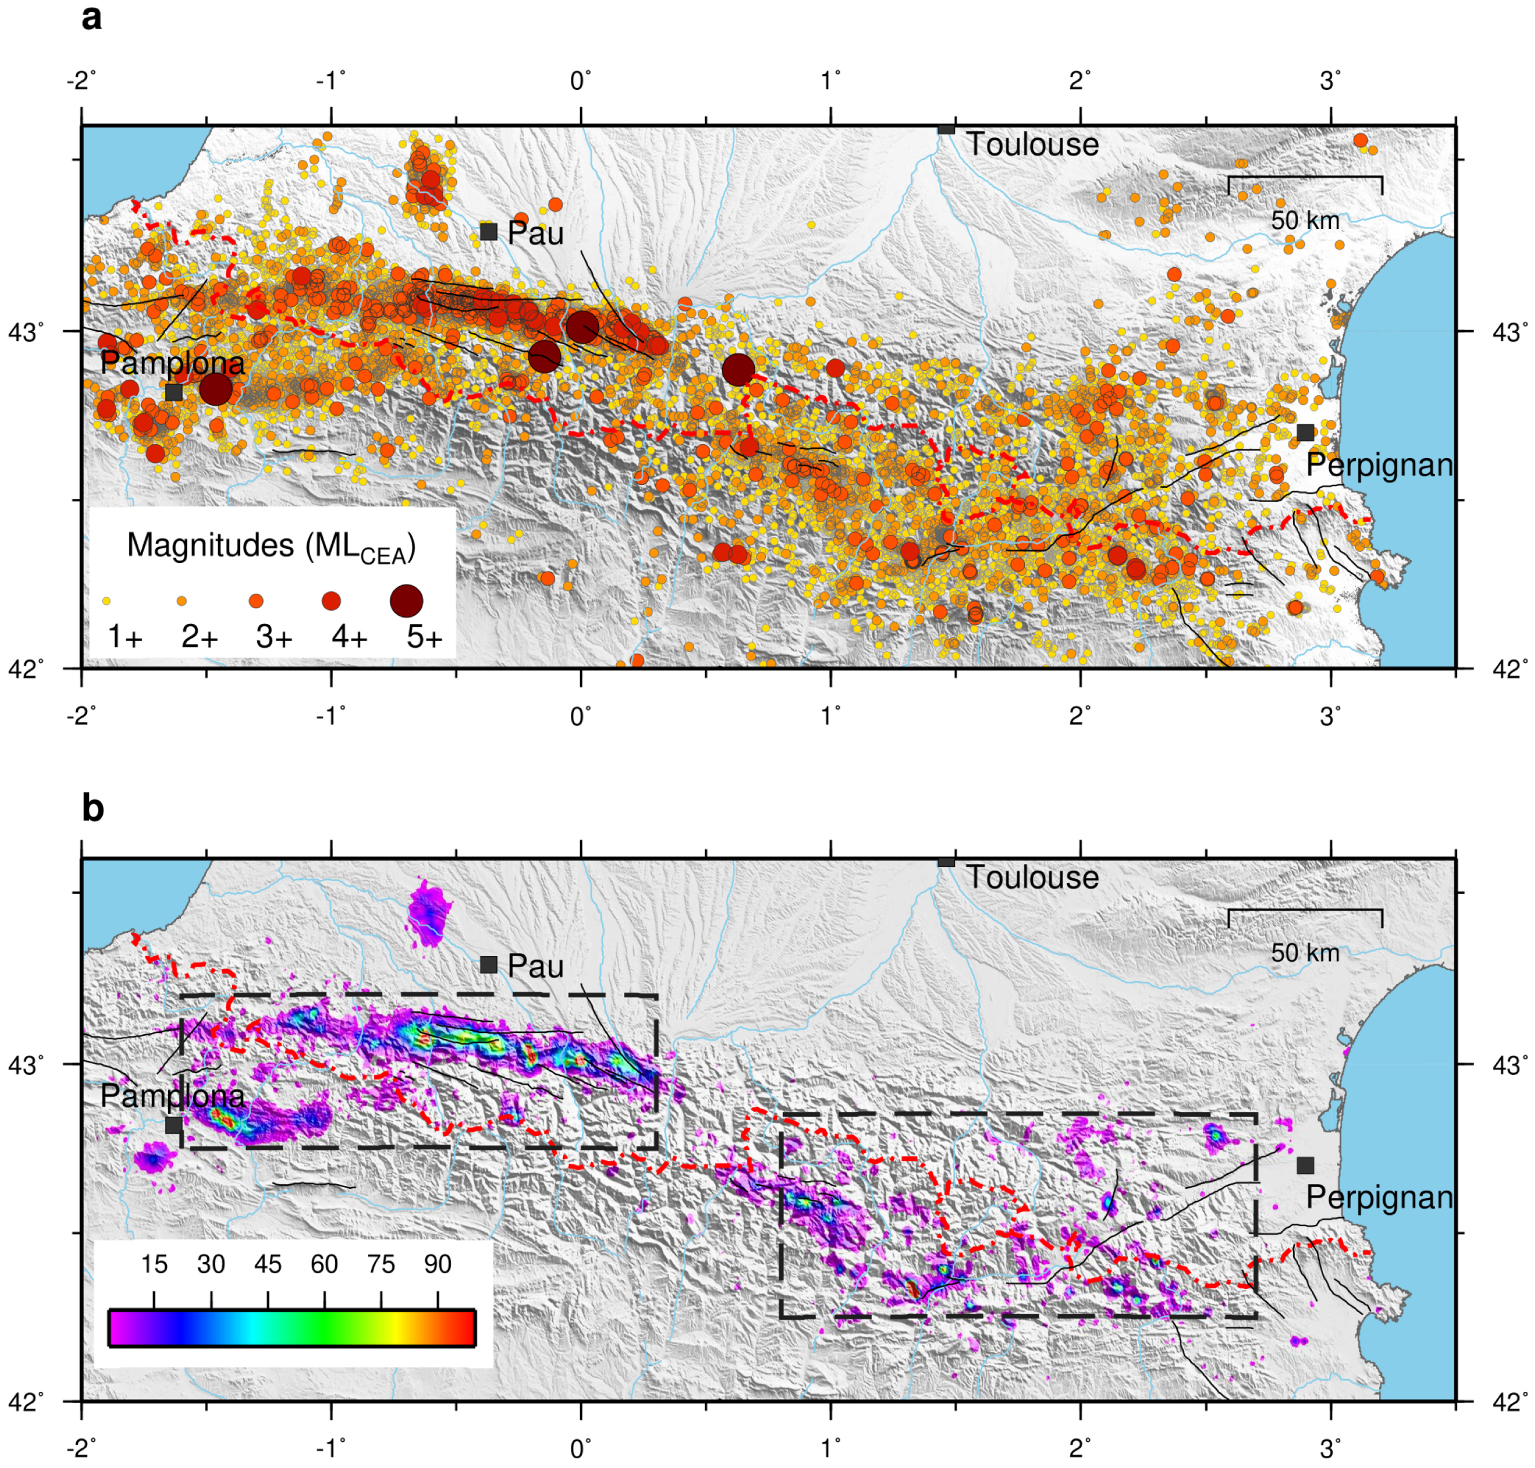
We did not build a regularity map at this scale, and chose instead to perform a systematic analysis of the clusters, highlighting their main characteristics (see next section).
Before going into more details at the cluster scale, as the average uncertainty on the depths in this catalog allows, we looked at the mean depth of the events, following the same grid approach as for the density and regularity. Figure 9a represents the mean depth of the earthquakes within a radius of 2 km around the mesh points. The fact that this radius is larger than for the fine density map illustrates the generally greater uncertainty on the hypocentral depths than on the horizontal position during a localization process. The catalog used here is the concatenation of the Arette 1978–1988, Souriau et Pauchet 1989–1996, and OMP 1997–2019 catalogs. As we are only interested in spatial aspects, we can afford to take into account catalogs with somewhat heterogeneous temporal coverage.
(a) Average depth of events, smoothed over a 2 × 2 km grid in the western Pyrenees. Only the events with the best depth determination are kept. Catalog: OMP, 1978–2019. (b) Density of events plotted along AA′, BB and CC′ cross-sections (see text). (c) Isostatic anomaly of the gravity field in the western Pyrenees [Chevrot et al. 2018]; Lb: Labourd anomaly; Ld: Lourdes anomaly; SG: Saint-Gaudens anomaly. Active faults are from Lacan and Ortuño [2012].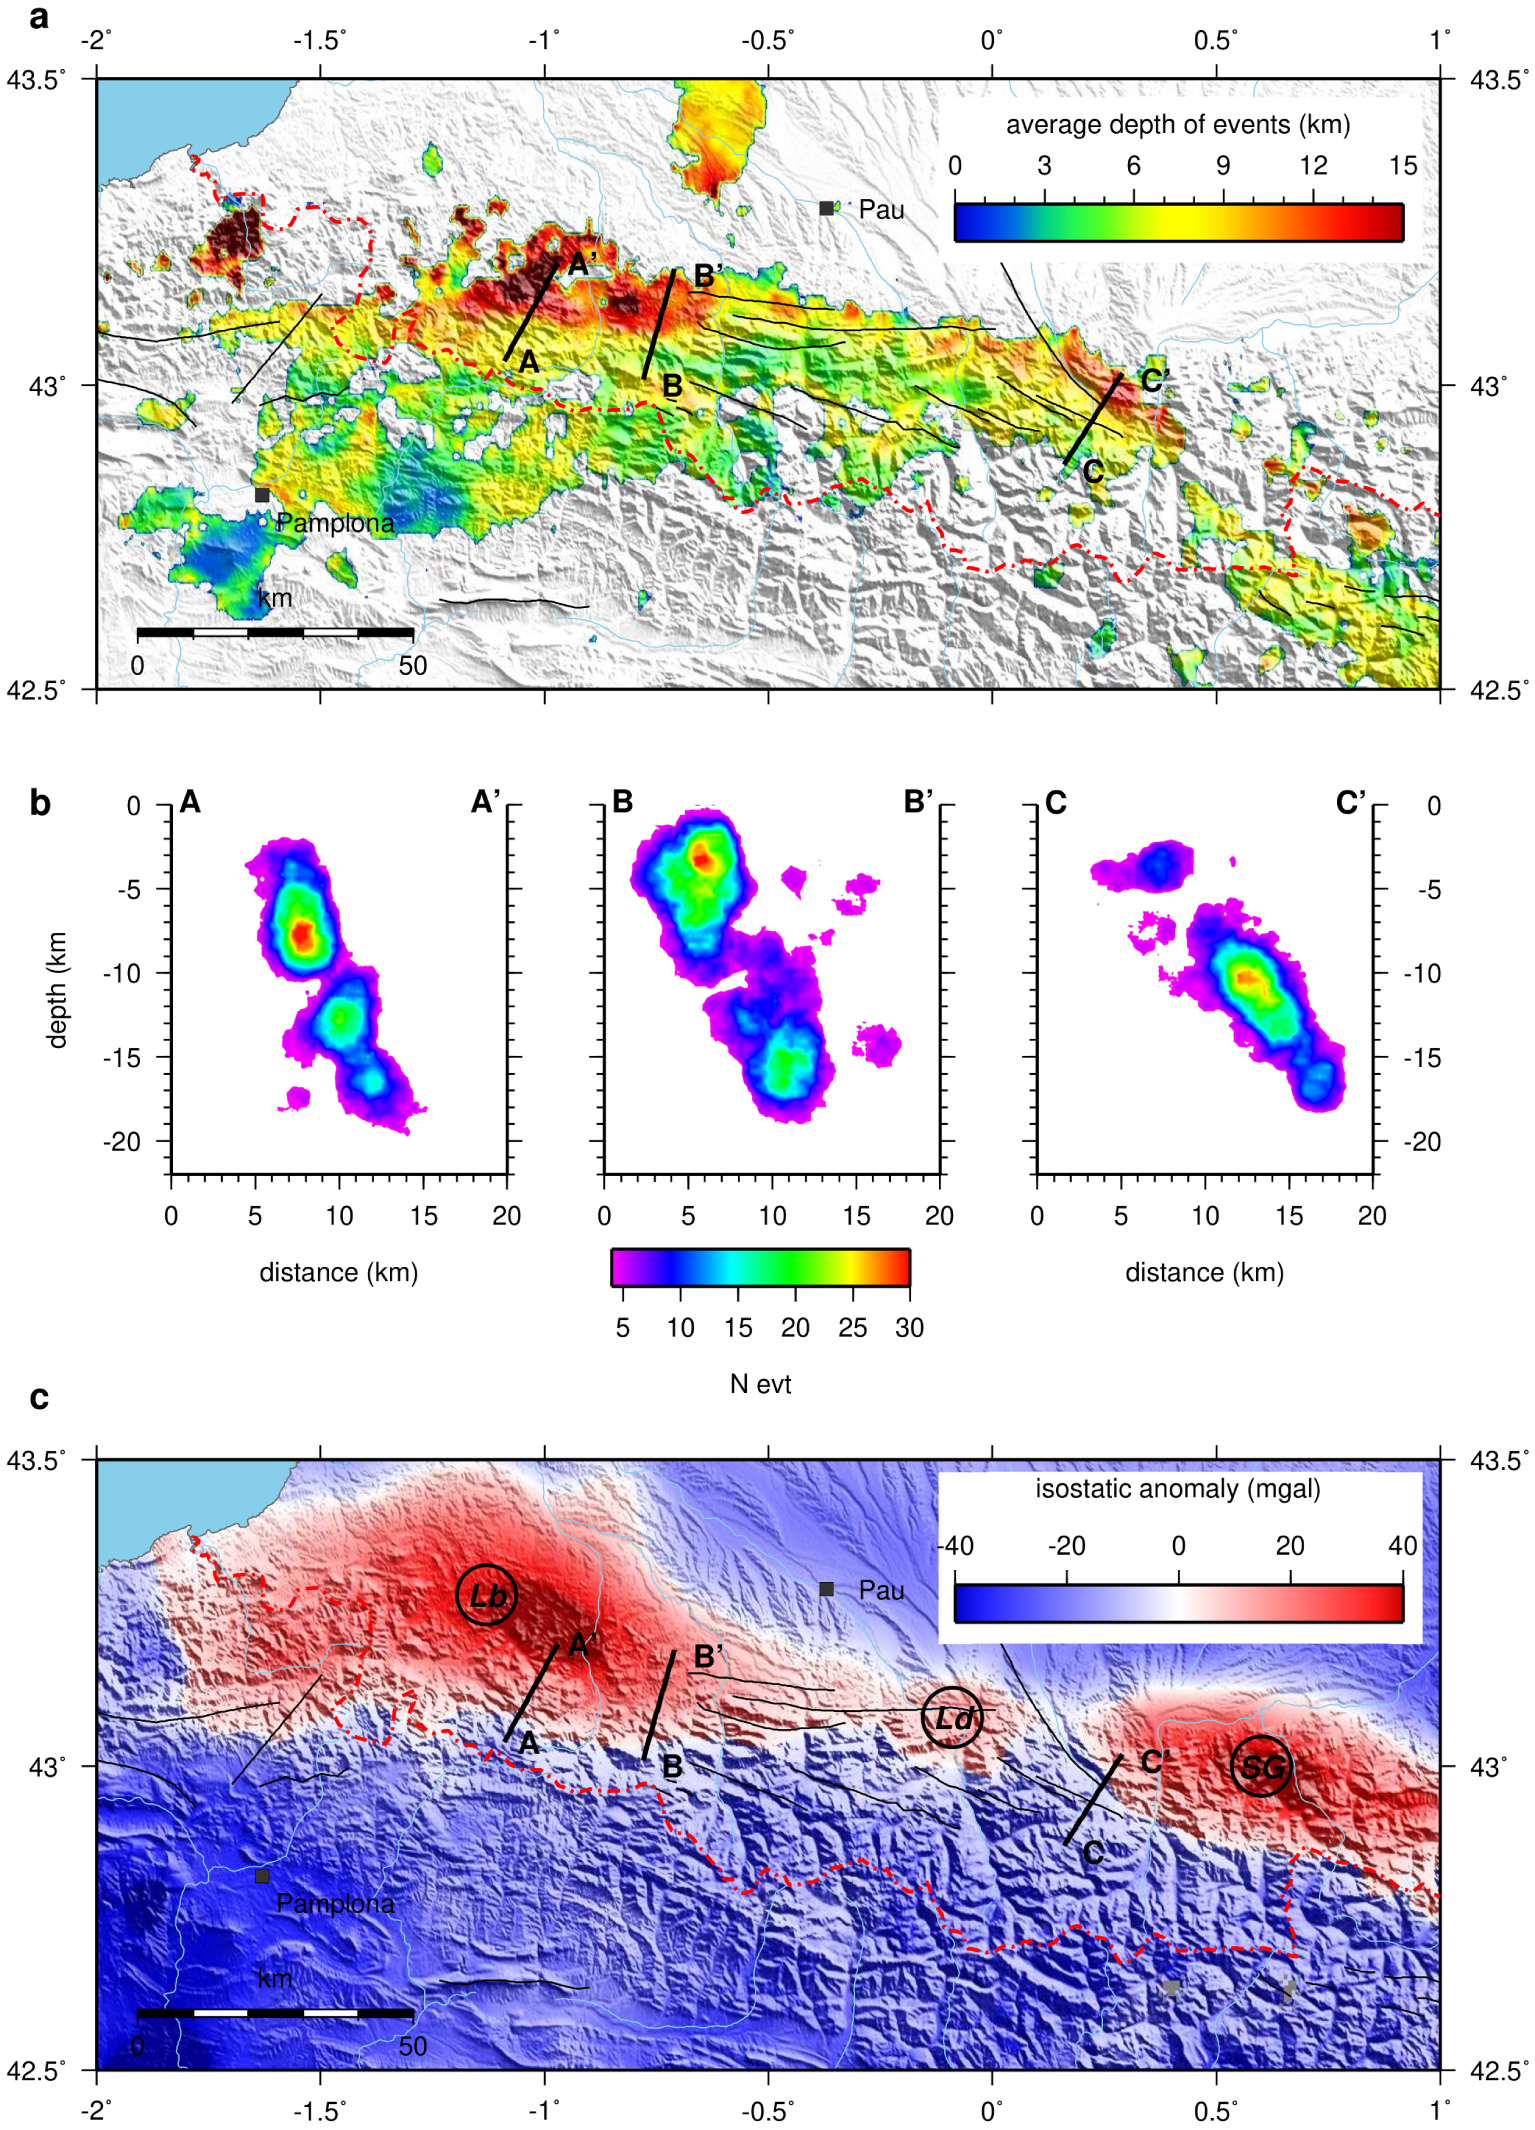
Figure 9a shows the already well-known observation [e.g. Souriau et al. 2001; Rigo et al. 2005; Souriau et al. 2014; Theunissen et al. 2018] of the deepening to the north of the hypocentres along the NWPZ seismicity stripe. This deepening is also clearly seen in the 3 density cross-sections of Figure 9b, drawn parallel to this depth gradient. The width of these cross-sections is 2 km on either side of the surface trace. The search radius for the event count is 1.5 km; this value is a little larger than the 1 km radius of Figure 8b, to account for the somewhat lower accuracy on the depths. Finally, Figure 9c shows the gravity field isostatic anomaly [Martin et al. 2017; Chevrot et al. 2018]. It is generally considered that the positive anomalies of very high amplitude revealed by the gravity field are the mark of mantle bodies that were exhumed during the Cretaceous episode of rifting [e.g. Chevrot et al. 2018; Fillon et al. 2021]. As already noted by Souriau et al. [2014], the seismogenic zone seems to come up against this mantle body and bend at its contact. Figure 9 reveals that what had been observed by Souriau et al. [2014] to the west of this zone (Labourd anomaly) also exists in the east, where a very clear deepening corresponds to the other anomaly, that of Saint-Gaudens. Finally, the same behavior can be guessed towards longitude 0°, where a smaller, more restricted gravity anomaly has also been measured (Lourdes anomaly). A very clear relationship thus definitely exists between the main seismogenic zone of the Pyrenees and these hyper-extended crustal domains.
6.3. Focus on the Pyrenean clusters
More than 25 seismicity clusters of various dimensions can be spotted on Figure 8b. They are reported in Table 1, with their dimensions, number of events, maximum magnitude, statistics on focal depths (mean and standard deviation) and on their temporal behavior. Figures 10 and 11 are close-ups on the two boxes of Figure 8b, namely the northwestern and southeastern clusters.
Detailed statistics for the seismicity clusters (see text)
| Cl | Area (km2) | lat | lon | Nt | 〈Z〉 | stdZ | Mmax | 〈N〉 | stdN | %bin1 |
|---|---|---|---|---|---|---|---|---|---|---|
| 01 | 10.69 | 43.129 | −1.133 | 137 | 12.6 | 21.3 | 3.0 | 0.34 | 0.95 | 8.0 |
| 02 | 6.72 | 43.145 | −1.072 | 121 | 15.2 | 13.1 | 3.1 | 0.30 | 1.99 | 28.1 |
| 03 | 4.15 | 43.058 | −0.826 | 61 | 6.3 | 6.7 | 3.4 | 0.15 | 0.90 | 19.7 |
| 04 | 76.86 | 43.083 | −0.655 | 1432 | 8.5 | 17.5 | 4.1 | 3.58 | 2.94 | 1.4 |
| 05 | 128.28 | 43.065 | −0.424 | 2149 | 6.2 | 11.0 | 4.5 | 5.37 | 5.79 | 2.4 |
| 05a | 21.20 | 43.076 | −0.454 | 484 | 6.6 | 14.9 | 3.7 | 1.21 | 1.85 | 3.5 |
| 05b | 23.79 | 43.059 | −0.352 | 549 | 6.0 | 6.2 | 4.0 | 1.37 | 2.73 | 6.7 |
| 06 | 34.02 | 43.027 | −0.207 | 926 | 5.3 | 7.7 | 4.9 | 2.32 | 10.24 | 18.8 |
| 07 | 57.15 | 43.015 | −0.043 | 1192 | 6.4 | 7.1 | 5.5 | 2.98 | 11.30 | 16.4 |
| 07a | 17.89 | 43.010 | −0.004 | 682 | 6.3 | 5.4 | 5.5 | 1.71 | 10.28 | 27.3 |
| 07b | 5.74 | 43.005 | −0.055 | 127 | 4.7 | 5.4 | 3.8 | 0.32 | 2.25 | 32.3 |
| 08 | 45.14 | 42.999 | 0.173 | 686 | 9.1 | 10.0 | 4.0 | 1.72 | 2.03 | 3.2 |
| 09 | 67.73 | 42.829 | −1.399 | 1396 | 5.2 | 12.7 | 5.4 | 3.49 | 14.82 | 16.6 |
| 09a | 8.01 | 42.853 | −1.462 | 343 | 6.6 | 7.4 | 3.5 | 0.86 | 9.48 | 53.6 |
| 09b | 11.57 | 42.829 | −1.416 | 404 | 4.9 | 12.2 | 4.1 | 1.01 | 3.44 | 9.4 |
| 10 | 5.88 | 42.846 | −0.267 | 88 | 4.6 | 0.7 | 3.3 | 0.22 | 1.16 | 20.5 |
| 11 | 5.12 | 42.609 | 0.834 | 84 | 7.5 | 5.6 | 3.9 | 0.21 | 1.50 | 27.4 |
| 12 | 16.58 | 42.592 | 0.890 | 280 | 6.3 | 9.2 | 3.2 | 0.70 | 2.20 | 13.2 |
| 13 | 6.14 | 42.591 | 1.027 | 103 | 5.8 | 9.2 | 2.7 | 0.26 | 1.01 | 14.6 |
| 14 | 5.01 | 42.545 | 0.983 | 73 | 7.5 | 6.1 | 3.0 | 0.18 | 0.53 | 5.5 |
| 15 | 24.34 | 42.333 | 1.327 | 1176 | 1.9 | 5.5 | 4.4 | 2.94 | 38.84 | 58.5 |
| 16 | 8.74 | 42.392 | 1.452 | 174 | 4.2 | 6.8 | 2.7 | 0.44 | 8.40 | 96.6 |
| 17 | 2.71 | 42.362 | 1.527 | 55 | 5.1 | 2.7 | 3.2 | 0.14 | 2.21 | 80.0 |
| 18 | 3.45 | 42.286 | 1.558 | 75 | 2.6 | 4.9 | 3.3 | 0.19 | 2.17 | 49.3 |
| 19 | 7.02 | 42.340 | 2.148 | 129 | 2.7 | 2.3 | 4.9 | 0.32 | 1.95 | 19.4 |
| 20 | 4.03 | 42.301 | 2.223 | 83 | 7.0 | 1.6 | 4.5 | 0.21 | 1.38 | 19.3 |
| 21 | 6.66 | 42.419 | 2.300 | 145 | 5.8 | 8.0 | 3.0 | 0.36 | 1.60 | 13.8 |
| 22 | 4.28 | 42.590 | 2.110 | 77 | 7.5 | 5.6 | 3.5 | 0.19 | 0.76 | 10.4 |
| 23 | 8.14 | 42.794 | 2.536 | 136 | 5.4 | 7.5 | 5.2 | 0.34 | 1.98 | 22.8 |
Cl = cluster identity; area = surface area of cluster (km2); lat, lon = position of the cluster barycenter; Nt = total number of events in the cluster; Nt/area = number of events per unit area (km−2); 〈Z〉 = average (mean) depth of the events in the cluster; 〈stdZ〉 = standard deviation of depth; 〈Mmax〉 = maximum magnitude (of MLCEA kind) in the cluster (1989–2019); 〈N〉 = average number of events per 28-day time window; stdN = standard deviation of this distribution; %bin1 = proportion of events in the most populated bin. In grey the indicators relative to the time distribution.
Northwest close-up on the map of seismicity density (see boxes on Figure 8b). Labels on clusters correspond to their identities (Table 1). For subclusters, labels a or b (Table 1) are given from west to east. Orange and red hexagons correspond to historical events of epicentral intensities VIII and IX (the epicentral intensity of the 1980 Arudy event was estimated between VII and VIII). Active faults are from Lacan and Ortuño [2012]; they are individually identified on Figure S1 (Supplementary material).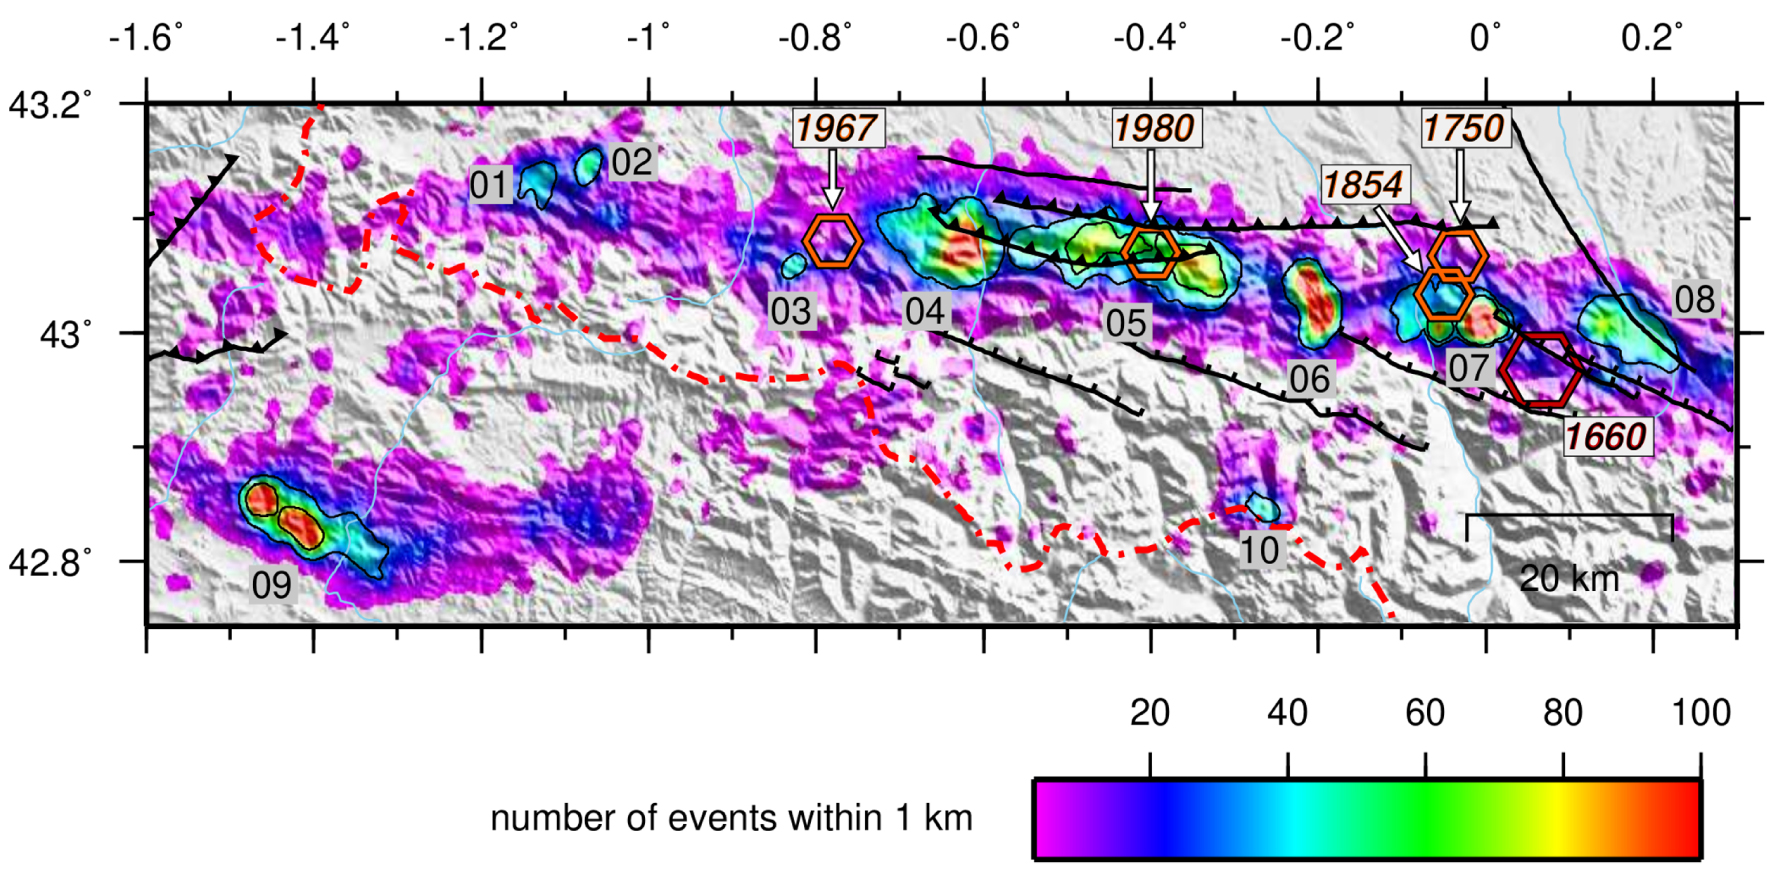
The contouring of these clusters was performed automatically, following an arbitrarily chosen isovalue of 30 events. Some of them (clusters 05, 07, and 09) displayed multiple local maxima, and were therefore subdivided, following higher order contours (resp. 55, 42 and 74 events). The dimension reported for each cluster is the inside surface of the contour. The number is the total tally of events that occurred within this contour.
For the temporal behaviour, we rely again on the proportion of events in the highest bins of the distribution in time of the events (first bin, and sometimes second bin). Here, the distribution includes all the events of the cluster, and we use 400 time windows, for a total duration of 31 years. Time bins are thus 28.3 days wide. We also show, as Supplementary material S4, an extended table with other indicators, such as the number of bins above the mean plus 1, 2 or 3 standard deviations, or the number of bins necessary to reach at least 75% of the events. The conjugation of all the indicators allows to precisely depict the time behaviour of the clusters.
Figures 10, 11 and Table 1 can now be discussed into more details, and put into perspective with past works and notably the current tectonic knowledge of the Pyrenees [Lacan and Ortuño 2012]). In what follows, magnitudes will be of MLCEA kind.
6.3.1. Northwestern clusters
The clusters located in the northwestern part of the Pyrenees are mapped on Figure 10a, together with epicenters of the strongest historical earthquakes as picked from the SiSFrance database (https://sisfrance.irsn.fr).
Clusters 01 and 02 are small structures located below the Arbailles Massif, a region where earthquake depths can exceed 20 km. Their activity is moderate. Cluster 02 is the deeper (15 km average depth), and the more irregular one (28% of events in 1st bin). It coincides quite well, in map and at depth, with the location of the so-called Arbailles earthquake of 06/01/1982 (ML = 4.8, depth = 16 km) and its very short aftershock sequence, described by Gallart et al. [1985]. However, the activity of cluster 02 during our observation period was dominated by a swarm-like sequence of about 50 events over a 1 month period at the end of 2007, with a maximum magnitude of 3.1. Therefore, this cluster is characterized by a clear episodic activity, possibly of both kinds (swarm and aftershock sequence). Note that the number of aftershocks of the deep 1982 Arbailles earthquake was surprisingly low for an earthquake of this size, which was attributed to the position at depth, within the lower, ductile crust. Note also that the neighboring cluster 01, although less than 5 km away, has a very different temporal behaviour, with a regularity parameter of only 8%.
Cluster 03 is a very small (4.15 km2) structure, with a very moderate activity, quite regular except 2 surges of about 10 events in one month. The mean depth is close to the average Pyrenean value (6.5 km). Interestingly, this cluster borders on the west the epicenter of the 1967, ML = 5.5 Arette earthquake, the French most destructive event in the second half of the 20th century. With all the caveats on its position, this major event seems to be located between two of our seismicity clusters (03 to the west, and 04 to the east). One interpretation could be that the 1967 event was strong enough to release the local stress for several decades.
The larger (77 km2) cluster 04, east to the Arette village, is characterized by its extreme regularity. The proportion of events in the first time bin is only 1.4%, and 1.3% in the second one. During the 31 years of our catalog, no magnitude greater than 4.1 was experienced, and no episodic activity more intense than 20 events in one month, which is very small in this context.
To the east, cluster 05 is quite similar to 04, with the same regularity (2%). It is the largest one of our list (128 km2), and it can be subdivided into two smaller substructures, 05a and 05b, which also experience similarly regular activities. Interestingly, these two subclusters are located on either side of the epicenter of the 1980, ML = 5.1 Arudy earthquake [Gagnepain et al. 1982; Sylvander 1997; Dubos et al. 2007; Lacan et al. 2012]. Their separation could be therefore related to the influence of this earthquake and its isotropic stress release along the Herrère fault [Dubos et al. 2007; Lacan and Ortuño 2012]. To the east, there is a 5 km gap with very low activity, before the next cluster.
Cluster 06, north to the village of Aucun, appears in our catalog as a very isolated (to the west and to the east), quite large (34 km2) and intensely active structure, with a north–south orientation and two lobes. During our observation period, it is clearly dominated by a few sequences of different kinds: two swarm-like bursts over a few days in November 2010 and March 2014, and a mainshock/aftershock sequence in 2012 (30/12/2012, ML = 4.9, 145 aftershocks in 1 month). A fine study by Prosdocimi [2015] suggests that the two lobes of the cluster correspond to two fault planes at depth, the southern one being activated during the swarms, and the northern one during the aftershock sequence (although the mainshock occurred at the base of the southern plane). Note that one of the tectonically active structures listed by Lacan and Ortuño [2012], the Pierrefitte fault, has its NW termination touching the contour of the cluster, and might therefore be related to the southern fault plane mentioned above, possibly indicating that this fault extends further to the NW.
After another 5 km gap to the east, cluster 07 covers 57 km2, across the Argelès-Gazost valley, and displays two substructures. The eastern subcluster is dominated by the 2006 Hautacam crisis (17/11/2006, ML = 5.5, 240 aftershocks in 1.5 month). This crisis has been studied in detail by Sylvander et al. [2008]. It was characterized by very homogeneous extensive focal mechanisms, and a temporary campaign allowed to clearly map the aftershocks. Lacan and Ortuño [2012] attribute this earthquake (and thus this cluster) to the Pierrefitte fault. However, the proximity of the Pic du Midi fault makes this other tectonic structure an alternative candidate for this event, all the more so as it penetrates inside cluster 07b. Note that the same structure has been reactivated in a very similar way during the 2014 sequence (29/04.2014, ML = 4.6, 160 aftershocks in one month). Prosdocimi [2015] showed that the 2014 sequence acted in the continuation of the 2006 one, therefore revealing a structure probably capable of hosting large events, such as that of 1660 (intensity IX). Two other, smaller (intensities VIII) historical events can be related to this cluster, the 1750 and 1854 ones (see Figure 10). Note that the second, western subcluster of cluster 07, although touching its bigger neighbour, displays a very different seismic activity. It is a little shallower (4.7 instead of 6.3 km), with a very marked peak in may 2013. Therefore, if there is a link between the two, it might require a more complex mechanism than a simple stress transfer.
Another ∼5–10 km gap separates cluster 07 from cluster 08, the easternmost one in this NW box. Although of comparable dimensions (45 km2), this cluster stretching along the Adour valley is as different as possible from the previous one. The events are deeper on average (9.1 km), which can also be seen on Figure 9. The activity is extremely regular (first bin at 3%), and deprived of strong events during our 31 years period. However, a few significant, deep earthquakes took place just outside the cluster in the southeast direction (01/04/2010, ML = 4.6, 13 km depth). The so-called Pic du Midi event of 01/01/1989 (ML = 4.6), 5 km to the south, could also be connected to this cluster. It took place in a region with very light activity. At autumn 2020, a swarm of small events began to manifest itself at the foot of the Pic du Midi de Bigorre mountain, which will probably lead to a new sub-cluster in a next release of the OMP catalog.
Longitudinally crossed by the Adour (sometimes called Bigorre) fault, cluster 08 marks the termination to the east of the well-known NWPZ seismicity stripe. Although the reasons for this interruption are not entirely clear, it seems reasonable to consider a correlation with the presence of the Saint-Gaudens gravimetric anomaly (Figure 9) and the mantle body that causes it. The ML = 4.6 2010 event seems to be located precisely at the contact of this body.
Note that the location of the 1660 macroseismic epicenter fits with clusters 07b and 08 as well. However, the regular activity of cluster 08 is an argument in favor of cluster 07b as source of the 1660 major event.
Jumping to the southwest of this first box (Figure 10a), we find close to Pamplona the large (68 km2) cluster 09, itself subdivided in 09a and 09b. Their activity started very abruptly with the 18/09/2004 (ML = 5.4) event, which was located exactly between the two subclusters. Ruiz et al. [2006a] studied in detail the aftershock sequence (more than 300 aftershocks could be located with a very good accuracy), and argued in favour of a rapid response case of reservoir-triggered seismicity, triggered by the first impoundment of a new reservoir, to the east of the cluster [see also e.g. Dura-Gomez and Talwani 2010]. Note that the two subclusters have been active quite simultaneously ever since, although cluster 09b proved much more regular (first bin at 9%) than cluster 09a (54%). At least from 2004 to 2008, the seismic activity migrated and deepened from west (cluster 09) to east at longitude − 1° [Dura-Gomez and Talwani 2010].
Interestingly, the activity of cluster 09 faded away in the last few years (since 2014), before a new surge in 2020, starting with a Mw = 4.1 earthquake located within epicentral uncertainty from the 2004 event. It will be very important to investigate the aftershock sequence and mechanisms, and to put them in perspective with those of 2004.
The last cluster of this first, northwestern box, is cluster 10. This small size cluster (5.9 km2) occupies a quite unusual position, far away from the other active zones, under the axis of the chain and the high peaks of the Balaitous massif. Its activity is quite regular over the 1997–2018 period, with a small peak in October 2004. What is also very singular about this cluster is its concentration at depth: the standard deviation on the hypocentral depths is only 0.7 km (for a mean value of 4.6 km), by far smaller than in any other cluster, for instance the other “chain axis” ones under the Spanish massifs south of Val d’Aran. The mechanism driving such a cluster is thus quite puzzling, since there is no known structural connection of the faulting volume with the surface or at depth. Unfortunately, the earthquakes involved were too small to compute focal solutions.
6.3.2. Southeastern clusters
We now switch to the southeastern box (Figure 10b), starting with a first group of 4 small clusters (11, 12, 13 and 14), located under the high-summits Encantats massif. They share common characteristics: same activity (related to surface area), classical depths and depth dispersions, a high regularity for three of them (below 7%), small maximum magnitudes. We can notice that the en-échelon faults known as the Riu-Cabanes system cut through three of these clusters. Ortuño et al. [2008] argued that they could be the cause of the larger-scale cluster, encompassing structures 11 to 14, described by Olivera et al. [1994]. Note that the whole region is a real water tower, with hundreds of lakes perched above a crystalline massif, probably highly fractured. Deep percolating water could possibly play a role in triggering the activity. The 1923 Vielha historical earthquake took place some 10 km north to cluster 11, within the uncertainties of the macroseismic location. We computed the focal mechanism (with polarities) of the overall strongest event of this group (26/02/2005, ML = 3.9), and found normal faulting in the SW–NE direction.
Same as Figure 10, but for the southeastern clusters. The three arrows point to small clusters, related to the Cerdanya/Conflent/Têt fault system, that did not pass the contouring threshold (see text).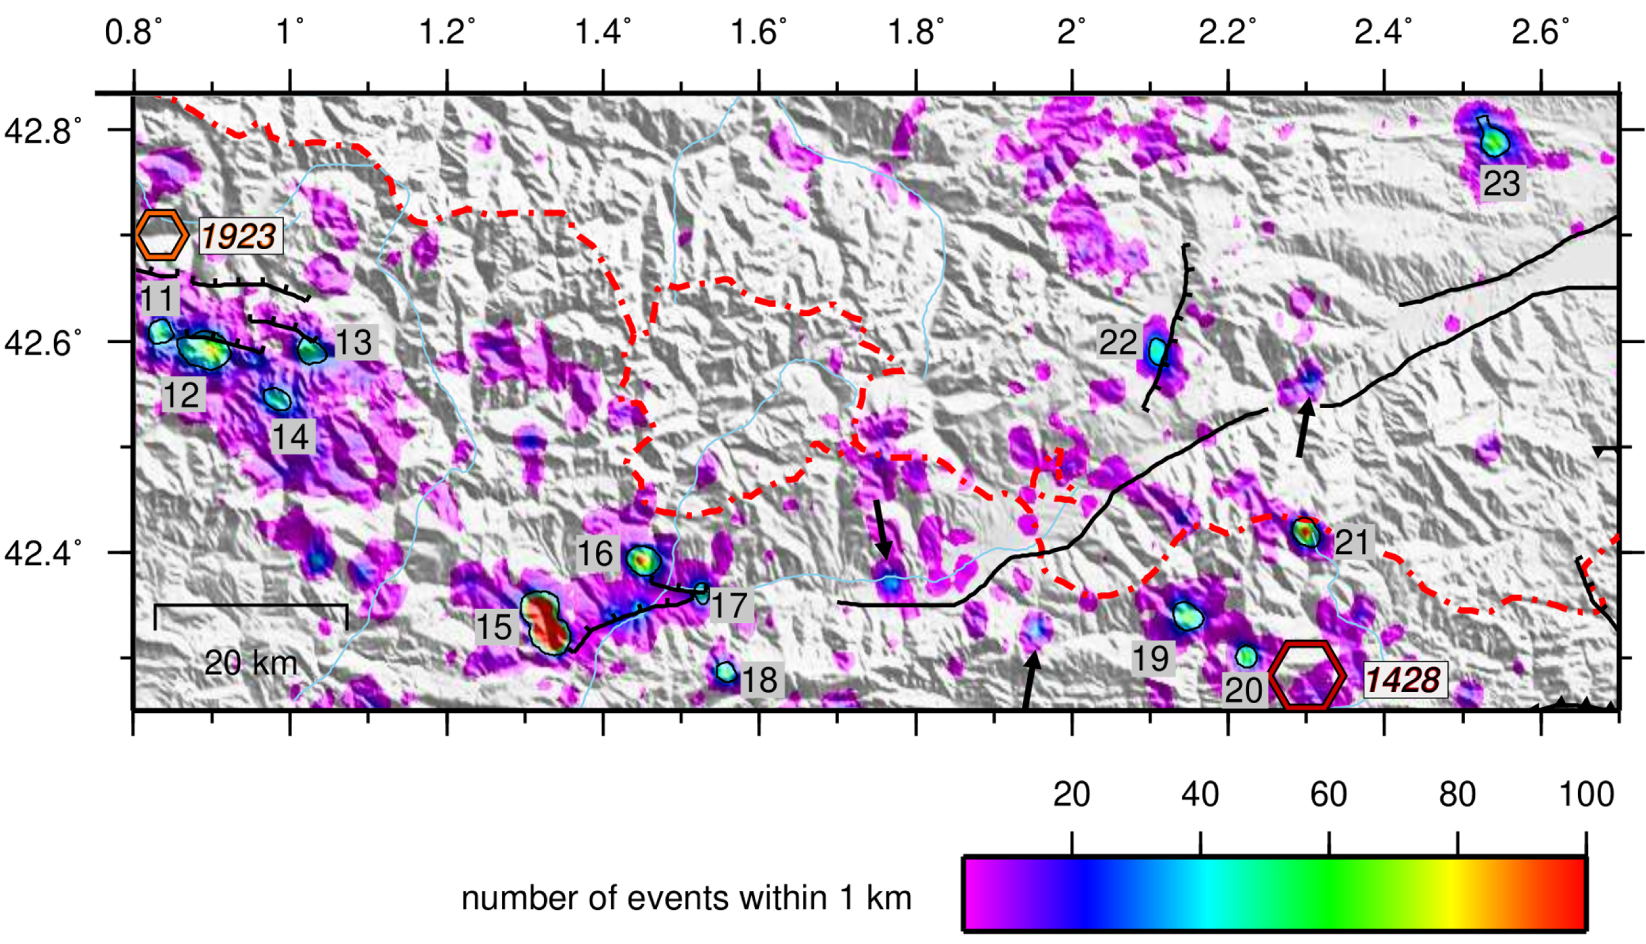
To the south and southwest of Andorra, in the region known as Alt Urgell, we find a group of 4 more clusters (15, 16, 17, 18). All of them behaved very clearly as swarm-like sequences, with very high concentration of the events in the first bins (58/31, 97/2, 80/7 and 49/29% for the first two bins of the four clusters, respectively). Most astonishing: whereas the activity of cluster 17 took place in July 2007, all three others were active nearly coincidentally in April 2019. Cluster 18 showed two peaks very close in time (starting 15/04 and 09/06/2019). Cluster 16 experienced 168 of its 174 events over 26 hours between 13/04 and 15/04/2019. Cluster 15, the largest one, with two lobes, was active mainly in February 2017 (700 events in one month, south lobe, mean depth 1.1 km) and then started again on the north lobe on 03/04/2019 (360 events in one month, mean depth 2.8 km). This second sequence of cluster 15 is the only one, in this group, that started with a “strong” event (ML = 4.4). The focal solutions of the two strongest events of cluster 15 are both dominated by dextral strike-slip (Figure 12). The coincidence between the April 2019 activity of these three clusters (15, 16, 18) is of course striking, and deserves thorough attention. A stress transfer mechanism after the ML 4.4 cluster 15 event should be considered to trigger the activity of clusters 16 and 18, 15 to 20 km away. All of these clusters could be related to the Urgellet graben, which runs between the 4 clusters [see Figure 10, and Lacan and Ortuño 2012]. Two secondary, smaller size clusters appear on the map between clusters 15 and 17, along the trace of the Urgellet graben. They don’t show any sign of activity during the April 2019 burst.
Focal solutions for significant earthquakes in the Pyrenees. The events whose mechanisms are plotted here are discussed in Section 6.3, and are all related to clusters, except the 1923 Berdún event, the 1999 Saint-Béat event (SB99), the 2002 Cauterets event (Ca02), and possibly the 2017 Navarra event (Na17). The quality of the solutions for the ancient Berdún (1923), Arette (1967) and Arudy (1980) events is highly questionable, and these mechanisms should be considered with the utmost circumspection. Active faults are from Lacan and Ortuño [2012]; they are individually identified on Figure S1 (Supplementary material).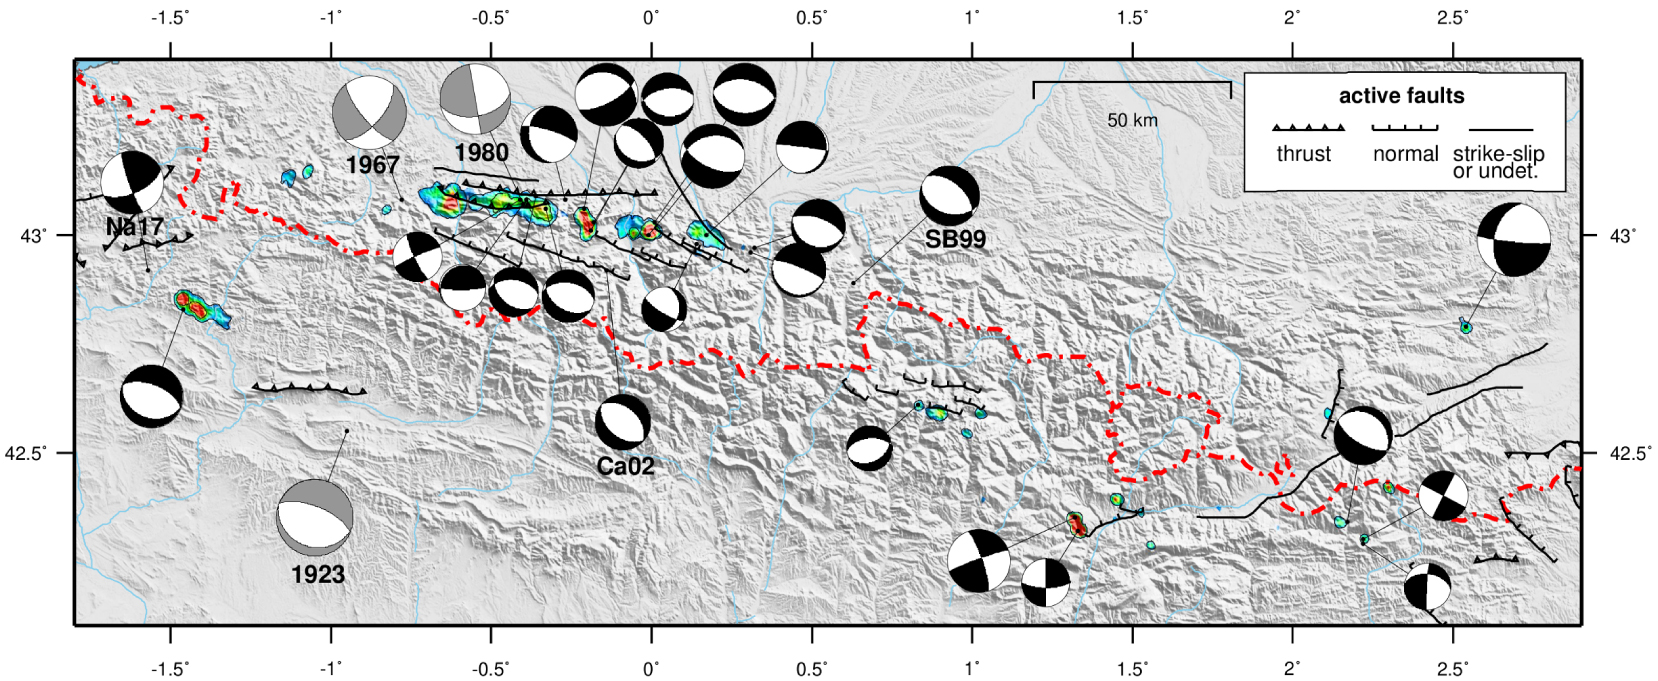
Further east, two clusters (19 and 20) are quite similar: they are small (4 and 7 km2), of irregular activity (19/19 and 19/18% for the first two bins), and both are dominated by relatively large events (21/09/2004, ML = 4.9 for cluster 19, 26/02/2003, ML = 4.5 and 01/06/2004, ML = 4.3 for cluster 20). They seem thus capable of hosting strong earthquakes, especially should the rupture link them. This hypothesis is highly speculative, but driven by the observation that the macroseismic epicenter of the most important Pyrenean earthquake, the 02/02/1428 Camprodon event (intensity IX), lies just a few kilometers away from cluster 20 [Olivera et al. 2006]. Quite surprisingly, the faulting styles of the three significant events for these two clusters are very different (Figure 12), raising more questions on their interpretation.
Going to the north, we find cluster 21, a small (7 km2) structure, that recently appeared in our catalog, in 2014. It displays henceforth a quite regular activity, with no large event. Its overall characteristics are similar to those of cluster 22, further north, except for the fact that cluster 22 is active earlier in our catalog (1999), but still not from the start. These two clusters are therefore of the kind that require long-term monitoring to ensure their detection. Cluster 22 could be related to the activity of the Capcir graben, in the middle of which it is located.
Finally, the last cluster (23) detected by our analysis is that of the Agly Massif. Its activity started with the Saint-Paul de Fenouillet earthquake (18/02/1996, ML = 5.2), one of the most important events of the last decades in the Pyrenees [Rigo et al. 1997; Pauchet 1998; Pauchet et al. 1999; Rigo 2010]. The aftershock sequence lasted for almost one year, and then faded away. There was a small secondary surge in may 2004 [Sylvander et al. 2007] which helped reinterpreting this earthquake. Since 2004, the activity of this cluster has been very sparse.
6.3.3. Lacq
The seismological history of the Lacq area began on 24th November 1969 with a first earthquake felt by the local population. This event occurred 18 years after Lacq gas field discovery and 12 years after its industrial exploitation. For 20 years (1974–1997), the studies based on the fisrt networks clearly revealed the link between the observed seismicity and the gas field exploitation but were only focused on problematics related to seismic hazard [Grasso and Wittlinger 1990; Grasso and Feignier 1990]. Thanks to an improved 3-D local velocity model [Guyoton et al. 1992] and a new approach in the waveform analysis [Bardainne et al. 2006], an overall reanalysis of the 1721 events of the 1974–1997 database has been performed in the early 2000s [Bardainne et al. 2008]. Such a detailed analysis resulted in an homogeneous database in terms of localization and magnitude. The integration of a 3D velocity model strongly modified the hypocenter spatial distribution and allowed to identify several clusters of events. Some of them have been clearly identified as short term response of borehole collapse or injection activity [Bardainne et al. 2006]. These clusters are localized in the near vicinity of the concerned boreholes. Except these clusters, the overall seismic activity has been interpreted as a long term response of the gas field deformation [Bardainne et al. 2008]. Mainly organized as a swarm located on the central area of the gas field during the first years of observation, the seismicity progressively migrated over time to form a ring around the disappeared central swarm.
Between 2013 and 2015, the exploitation of the Lacq gas field has been progressively stopped. Unfortunately, the dismantling of the local network some years before the end of the field exploitation prevented any possible detailed observation of the local seismic activity. Nevertheless, even if there is no more local network implemented on the gas field, widespread seismic activity is still observed by the OMP network. Moreover, one can observe a very local seismic activity (Figure 7) located on the southeast part of the gas field, where some injection experiments are still conducted.
6.3.4. Exceptions
Although the seismicity of the Pyrenees seems clearly dominated by the activity of a number of clusters, we should not forget to mention the exceptions, which are numerous.
Several “strong” earthquakes present in the catalogs behaved as lone events. The most noticeable one is probably the Saint-Béat earthquake (04/10/1999, ML = 4.8). Despite its relatively high magnitude, it was followed by a single aftershock, probably because of its very deep focus (17 km) and its proximity to the Saint-Gaudens mantle body.
In 2002, another isolated sequence comprising a dozen earthquakes occurred close to Cauterets, in the central Pyrenees, 10 km south of the NWPZ seismicity stripe [Dubos et al. 2004]. The two main events of this short series occurred within 30 min, and reached ML 4.8 and 4.4. These earthquakes possibly triggered a third one, close to the Pic du Midi, 3 days later (ML = 3.8). The inverse mechanisms found by Dubos et al. were subsequently corrected by Chevrot et al. [2011] after the discovery of an error in the wiring of the sensors deployed in a temporary experiment (Figure 12).
On 10/03/2017, a ML = 4.6 event took place in Navarra, some 10 km to the northwest of cluster 09. Its transpressive focal solution contrasts with the mostly extensive mechanisms of the 2004 sequence. On the contrary, it can be noted that the mechanism of the Mw = 5.6, 1923 Berdún earthquake is quite similar to those of the 2004 sequence.
What must also be noticed is that some parts of the Eastern Pyrenees generally considered as active on the basis of geomorphologic or neotectonic evidence, have failed to pass the arbitrary threshold we have set for cluster detection. In particular, the Cerdanya and Conflent fault systems, widely discussed in the literature, are curiously absent from our analysis. Of course, this does not call into question their activity: Goula et al. [1999] and Baize et al. [2002] locate two significant earthquakes in the Cerdanya basin in 1970, and in fact, 3 small clusters with lower activity than our threshold are located along the Cerdanya fault (arrows in Figure 11). All of them ruptured only once, i.e. with more than 90% of their events in two bins. Interestingly, one of these clusters is located exactly at the junction between the SW (Cerdanya) and central (Conflent) segments of the Têt fault. The episodic activity of the Cerdanya fault is therefore not questioned, but this structure proved mostly silent during the 31 years of our catalog. We cannot be as categorical about the northeastern termination of this fault system, namely the northern Têt fault, for which there is a real doubt on the current seismicity. It is highly possible that the events located near Tautavel all be of anthropic origin, as several active, regularly shooting quarries are precisely aligned along the fault. Likewise, the Tech Fault does not show any conclusive sign of current seismic activity.
7. Discussion
Any synthesis work such as that undertaken in this study is intrinsically limited by the characteristics of the available catalogs. The homogeneity of the monitoring networks is one aspect, the other being the duration of observation (50 years in the case of the whole of southwestern France, 25 years for the Pyrenees). This is all the more true as the seismicity of the study region is moderate. All conclusions drawn should be read in this context, and must imperatively be put in perspective with what is known about the “long time” of historical seismicity. One must therefore always keep in mind this gap between the time scales of seismotectonics and observation, and beware of going too far in the interpretation. In this respect, the comparison between the return periods of strong events and the teachings of the Gutenberg–Richter law in the Pyrenees is interesting, as is the geographical relationship between strong historical earthquakes and seismicity clusters.
As with all of the above, the discussion that we are addressing here will essentially concern the Pyrenean domain. Indeed, the hindsight to the north and east of the Aquitaine basin is insufficient, due to the inhomogeneity of the SIHEX-BCSF catalog. As far as the Pyrenees are concerned, we invite the reader to consult the paper by Lacan and Ortuño [2012], which carries out an excellent review of the active tectonics of the chain, and of the different structures involved.
Our study focused on the concentration of events in clusters, and considered their temporal behavior. This assumed choice should not make us forget the seismicity too sparse or too diffuse to be grouped in clusters. Indeed, the examination of Figures 4 and 8a shows that many regions of southwestern France experience diffuse seismic activity, without being negligible, and the comparison between representations of seismicity (Figures 4 and 8a) and its density (Figures 5 and 8b) is rich in lessons. In particular, the Basque Country, to the west of longitude − 1°, the south of Foix, and the vicinity of Quillan, experience regular but less concentrated activity than elsewhere, and have therefore been ignored so far in this study. However, no less than 500 earthquakes, including about 15 of magnitude ML greater than 3, have occurred within a radius of 20 km around Quillan between 1989 and 2019, near the North Pyrenean Frontal Thrust.
We must therefore ask ourselves the following question: should this diffuse seismicity not be considered as the “normal” activity of a region such as the one we are studying, outside the context of active plate boundaries? It should not be forgotten that the current horizontal deformations across the Pyrenean chain are almost zero [e.g. Rigo et al. 2015; Mazzotti et al. 2020]. Are not clusters in this case rather exceptional manifestations, linked to local mechanisms allowing a concentration of earthquakes?
One of these concentrating mechanisms could be the presence in the NWPZ crust of the mantle blocks that were uplifted during the Cretaceous rifting episode and then blocked during Meso/Cenozoic compression. On the one hand, they could have played a role as a wall that opposes the northward advance of the Iberian upper crust, causing a local concentration of stresses and deformations. On the other hand, as evoked by Chevrot et al. [2018], the circulation of water in the crustal fractures at the surface of these blocks could induce serpentinization of the mafic rocks that constitute them, causing local weakening, and thus favoring the triggering of earthquakes. The very sudden disappearance of the NWPZ seismicity stripe to the east of the Adour fault (western boundary of the Saint-Gaudens block) could then simply be linked to the termination of the mantle material, combined with the presence of this fault. We would then witness a form of control of the current seismicity by the structural heritage of the regional evolution in the Cretaceous, as this evolution also controls the deep architecture of the Pyrenees [Chevrot et al. 2018] and the post-orogenic exhumation in the western part of the range [Fillon et al. 2021].
Another concentrating mechanism is probably the existence of fluid circulation on a very local scale, a hypothesis often invoked to explain numerous seismicity swarms in any context [e.g. Hainzl 2004; Bourouis and Cornet 2009; de Barros et al. 2019]. The Pyrenees are well_known for their numerous thermal and mineral water springs (Eaux Chaudes, Ax-les-Thermes, Ogeu, Bagnères-de-Bigorre, etc. …), many of which being along the NPF suture zone. Episodic clusters of the “swarm” kind, almost without major earthquake, that are mainly observed in the eastern part of the Pyrenees (Section 6.3.2, especially the clusters of Alt Urgell and Cerdanya) could be favoured, or even draw their origin from these fluid circulations.
The question of the differences between swarms and aftershocks sequences can then be raised. Are they any similar in their causes and behaviours? Now that the main Pyrenean clusters are defined on a solid basis, these questions pave the way for specific studies. It will probably be necessary to examine more closely the temporal distribution of events at the cluster scale, which could help to disentangle the different kinds of seismic sequences that they host.
Whatever the mechanism that favors the concentration of events in a cluster, there is still a need for a physical source that triggers the earthquakes. While for some areas (Lacq, east of Pamplona), the driving mechanism is probably known as being of human origin, it remains to be found for the majority of events, since it seems to be widely accepted that horizontal deformations are negligible today. The study of the mechanisms of recent major earthquakes, especially in the central Pyrenees [Figure 12, and e.g. Chevrot et al. 2011; Stich et al. 2018], seems to indicate a dominance of extensive faulting. It may be noted in passing that the azimuths of the nodal planes are in good agreement with those of the structures identified by Lacan and Ortuño [2012], in particular the group of Bedous, Laruns, Pierrefitte, Pic du Midi en-échelon faults. This prevalence of extensive mechanisms in the foothills of a collision zone leads to the hypotheses and models, developed in recent years, of a control of seismicity, in the Alps but also in the Pyrenees, by isostatic rebound phenomena, whether related to strong crustal density contrasts [Souriau et al. 2014], erosion, gravitational collapse, or deglaciation—even if this last mechanism seems difficult to invoke for the Pyrenees, where the glacial cover has never reached a great extent [e.g. Vernant et al. 2013; Genti et al. 2016; Mazzotti et al. 2021]. In a secondary way, it would be interesting to introduce into these models the boundary condition imposed in the case of the Western Pyrenees by the “wall” of dense intracrustal blocks.
Finally, a question raised by the segmentation of seismicity is that of the implications in terms of seismic hazard. Indeed, the seismotectonic input in hazard assessment procedures (PSHA) often follows the “fault” model, even though more diffuse seismicity distribution can also be considered. Should we also be interested in clusters as source objects, at least when they are known to host stronger-than-average earthquakes (for instance ML > 4)? Are we entitled to consider as impassable barriers the intervals between clusters, particularly when they are sharp (on either side of cluster 06, for example), or as strong stress concentrating points? Is it necessary or reasonable to consider the possibility of a rupture breaking everything on its way, from cluster 03 to cluster 08 (about 100 km)? These questions go beyond the scope of our study, but it seems important to ask (and answer) them. The knowledge of the seismic hazard of southwestern France, which is now developed rather on the side of attenuation models than that of sources [Calvet et al. 2013; Mayor et al. 2018] is at stake. One of the perspectives of the present work could be again to look more closely at the scale of the clusters, and in particular to conduct PSHA analyses starting from specific Gutenberg–Richter derivations.
With the generalization in recent years of continuous recording capabilities by French stations, and with the densification of the monitoring network within the framework of the Résif-Epos project, it will now be possible to apply modern methods of massive data processing (automatic picking, template matching, deep learning), based of course on the knowledge accumulated over the last decades. This will allow both a refinement of the active structures (contours, temporal behavior), but also most certainly the discovery of many new seismic foci, too tenuous to be detected by stations operating in triggered mode.
8. Conclusions
Thanks to several decades of observation, the seismicity of southwestern France is beginning to be well known, both in terms of its spatial distribution and its behavior over time. Both in the most active part of our study area, namely the Pyrenees mountain range, and in its calmer margins, in particular the south of the Massif Central, it appears to be dominated by a high concentration of earthquakes in very active clusters, in a general seismotectonic context of a stable continental zone. For the Pyrenees, we were able to identify about 25 clusters, of very diverse sizes and behavior, whose main characteristics are detailed in this paper. Several of them are grouped in a segmented seismicity band, to the northwest of the chain, which deepens towards the north while coinciding with an alignment of mantle bodies trapped in the Eurasian crust. The cause-and-effect relationship between the two alignments seems increasingly likely, and mechanisms are being suggested to account for this kinship. The dynamism of these clusters, which comprise the majority of major events, both historical and recent, should not however make us forget the existence of a background seismicity, diffusely distributed throughout the Pyrenees and the southern Massif Central. In view of the temporal evolution of our catalogs, we expect to see the emergence of new clusters in this background seismicity, with episodic, possibly catastrophic functioning. No doubt that the seismicity maps will continue to evolve in the future year, decades, and centuries.
Acknowledgments
We thank the editors for the opportunity to contribute to this special issue, and for careful handling of the manuscript. We are grateful to all those who, whatever the monitoring operator, whatever the era, have contributed, through their field, observatory or administrative work, to gathering the raw material for this work, the data. This work has been funded over time by too many organisms at the local, regional, national and European levels to thank them all. The most recent flag that can be planted on this data collection and the subsequent work is that of the Résif-Epos consortium (https://www.resif.fr/en/, http://dx.doi.org/10.15778/RESIF.FR). Résif-Epos is a Research Infrastructure (RI) managed by CNRS-Insu. Inscribed on the roadmap of the Ministry of Higher Education, Research and Innovation, the Résif-Epos IR is a consortium of eighteen French research organizations and institutions. Résif-Epos benefits from the support of the Ministry of Ecological Transition. All the figures were made using the GMT software [Wessel and Smith 1991]. We thank an anonymous reviewer for a constructive review.