


 CC-BY 4.0
1. Introduction
On November 12, 2019, at 2.38 p.m. (local time), an earthquake of magnitude 3.0 MLv was largely felt by the population of Strasbourg, France. The location of the epicenter produced by BCSF-Rénass (the French service for the observation of national seismic activity hosted by EOST) was in the Robertsau area, in the North-eastern suburb area of the city, but less than 5 km from the major historical building of the city, its famous cathedral. Very quickly, the question of a link between this earthquake and the Geoven deep geothermal site (www.geoven.fr) that is located 5 km to the North of the epicenter arose. The Geoven site is operated by the Fonroche Géothermie company. Wellheads and surface infrastructures are in the commune of Vendenheim at the location of the former Reichtett oil refinery. Two deep wells have been drilled; the first one has been launched in late 2017, and the second one during mid-2019. Both wells reach a depth of about 5 km and significantly deviate to the East, with a well termination below the town of the La Wantzenau.
More recently, since the end of September 2020, a test phase has been launched on the deep geothermal site Geoven to better understand the geological structure of the targeted reservoir and the nature of fluid circulations at depth. This test phase followed the recommendations made in February 2020, by experts from the BRGM (www.brgm.fr) and INERIS (www.ineris.fr) in the context of a third-party assessment launched after the seismic sequence of November 2019. Indeed, the third-party expert opinion highlighted the fact that the geological and hydrogeological model proposed by Fonroche Géothermie was too uncertain.
Since the beginning of the tests in autumn 2020, at least ten earthquakes have been felt, based on testimonies gathered by the BCSF-RéNaSS and local newspaper articles. In particular, on December 4, the Strasbourg city woke up suddenly, following the largest earthquake of the sequence, reaching a magnitude of MLv 3.6, and located in the very close vicinity of one of the Geoven wells. This event with a magnitude much larger than the red-light level of operation stop as defined by the Bas-Rhin prefecture (a magnitude of 2.0) can be seen as the direct translation of a loss of control of the seismicity induced during the well testing operations. On December 8, 2020, the local authorities (i.e., Bas-Rhin Préfecture) ordered a definitive closure of the Geoven site. They also ordered an administrative investigation whose conclusions stated on December 30, 2020, that unauthorized practices had been done, namely an exceeding of the regulatory injection overpressure of 10 MPa, as well as a lengthening of the northern well beyond the depth defined by the initial agreement. Fonroche Géothermie company has contested these conclusions.
The seismic sequence of Strasbourg–Vendenheim is a particularly important case study for induced seismicity related to deep geothermal energy projects. Deep geothermal energy (i.e., requiring a minimum depth of typically 500 m) is successfully exploited in numerous areas worldwide. For high temperature geothermal energy (T > 150 °C) that can produce electricity, the numerous successful projects include: Geysers in USA, Cerro Prieto in Mexico, Salak in Indonesia, Taupo in New Zealand, Krafla in Iceland, Larderello in Italy, Olkaria in Kenya [Bertani 2016]. The technology to produce electricity is efficient and stable, allowing for a significant production worldwide [Zarrouk and Moon 2014, Bertani 2016, Augustine et al. 2019]. Deep geothermal energy in sedimentary basins (e.g., Paris basin, Bavarian Molasses Basin) is also very efficient at lower temperature (80–120 °C) for direct heat use [Bertani 2018]. The concept of the exploitation in these contexts is robust as the resource is plentiful and at moderate depth (1–2 km): (i) the capture of a hot natural fluid (liquid or vapor heated by a magmatic intrusion) using deep wells, (ii) the extraction of the heat using heat exchangers with possibly advanced thermodynamic systems and large turbines for electricity production, and (iii) the reinjection of some of the fluids to maintain volume and pressure in the reservoir. In most cases, exploitation is passive in the sense that there is no need to modify the host rock using stimulation procedures aimed at changing the permeability of the reservoir. The fundamental limitation of deep geothermal exploitation is, however, the geographic distribution of favorable sites (high temperatures and presence of mobile fluids) with respect to population distribution, in particular in continental Europe. Subsequently, the main issue is how to extend the technology to more common sites where the resource is weaker and/or deeper. This is the purpose of enhanced geothermal system (EGS) where in hot rocks saturated with natural fluids, existing natural faults are used as fluid conduits since they are both more efficient and cost-effective than deep wells and/or artificial fractures produced by hydraulic fracking [Bresee 1992, Dezayes et al. 2005, Gérard et al. 2006, Genter et al. 2010, Huenges and Ledru 2011, Breede et al. 2013, Olasolo et al. 2016]. The recent evolution of the EGS concept has been to switch from the massive hydraulic injections in order to generate new fractures (HDR concept) like in Soultz-sous-Forêts [Bresee 1992, Gérard et al. 2006, Genter et al. 2010, Huenges and Ledru 2011, Olasolo et al. 2016, Lu 2018] to limited stimulation (hydraulic, chemical and/or thermal) of pre-existing fractures to increase their permeability by shearing or descaling them. More recently, an evolution of the EGS concept has emerged targeting large regional faults (instead of limited fractures networks) where the permeability and the area of heat exchange are expected to be at a maximum. The Rittershoffen project (France), 6 km south-east of Soultz, is one of the most successful recent EGS projects to target a large fault [Baujard et al. 2017]. The reservoir for the project is at the intersection between a major regional fault having a natural high permeability and a specific geological domain, that is, the transition between the sediment cover and the granitic basement expected to be the most permeable zone. The Geoven project is based on this concept. However, several limitations exist. First, the assumption that the highest permeability occurs on large faults is challenged by numerous observations [Caine et al. 1996, Dorbath et al. 2009]. Moreover, while fault permeability may significantly increase just after earthquakes, high permeability is not expected to be maintained throughout the rest of the seismic cycle [Sleep 1995, Segall and Rice 1995]. For the Rittershoffen site, it would be of interest to better quantify the impact of the 1952 Seltz seismic crisis on the permeability of the exploited faults [Helm 1996]. Large nearby regional faults are also at the origin of most failures of EGS projects in producing triggered seismicity on structures much larger than the stimulated volume of the reservoir. The recent dramatic M5.4 earthquake in Pohang in 2017 is an illustrative example of this [Grigoli et al. 2018, Kim et al. 2018].
In order to shed light on the history of the Geoven project, we report here on an overview of the seismicity monitoring during the development of the project in 2018 up to its definitive shut-in in January, 2021. This case study also addresses the specific class of seismicity at the transition between human-induced and natural seismicity: triggered seismicity [Dahm et al. 2013, Ellsworth 2013, Cornet 2016, Grigoli et al. 2017]. Stricto sensu, induced seismicity is entirely controlled by stress changes caused by human operations and would have not occurred without them. On the contrary, natural seismicity is independent of any human activity. In between, triggered seismicity might have anthropogenic causes but primarily releases natural tectonic stresses. Subsequently, it can lead to ruptures much larger than the domain, where pore pressure has been affected by fluid injection and can be of particular importance in regions, where the tectonic loading could be responsible for moderate to large earthquakes [Giardini 2009, Zang et al. 2014, Foulger et al. 2018, Candela et al. 2018].
The manuscript is organized as follows. In Section 2 of the manuscript, we describe the regional and local seismic networks that were used for the seismic monitoring of the Geoven project. Section 3 presents the two seismic clusters that were observed using the absolute locations of the BCSF-Rénass catalog (https://renass.unistra.fr/fr/zones/france/): the northern cluster in the La Wantzenau area centered on the deep well termination (<1 km), and the southern cluster in La Robertsau area that developed remotely (4–5 km) from the wells. In Section 4, we expand the catalog using a template matching approach and apply a double-difference relocation to enhance the fault structures in both clusters. Section 5 addresses the main arguments for supporting the induced or triggered character of the two clusters. In Section 6, we discuss the results with respect to other cases in the Rhine Graben.
2. Seismic networks around the Geoven deep geothermal project
Figure 1 shows the seismological networks used to locate events from 2018 to 2021 in the area around the Geoven project located in Vendenheim (10 km to the North of Strasbourg). The main stations used are located within a radius of 80 km from the site which includes up to 76 stations in the Rhine Graben, both on the French and German sides of the Rhine (the number of stations has evolved over time—see supplementary material). In terms of geological units, they are located in three major domains: the Hercynian Vosges massif for the western part of the network, the Cenozoic Rhine basin at the center and the Black Forest massif to the East. Most of the seismological stations are providing data in real time and are integrated into the BCSF-Rénass automatic detection and location procedures using Seiscomp3 [Hanka et al. 2000].
(left) Location of the subset of the closest 76 seismological stations (122 stations were used in total in this study at the scale of the Rhine graben). Color code of the stations (triangle): red: permanent RESIF/RAP/RLBP stations and public stations of Fonroche Géothermie company; yellow: private permanent stations of the Fonroche Géothermie company; green: temporary EOST Raspberry Shake stations; purple: temporary EOST stations; blue: temporary German LGRB stations (L1 network), permanent LGRB stations (LE network) and permanent GRSN stations. (right) Zoom of the station distribution in the close vicinity of the Geoven site (Fonroche Géothermie company) (green pin). The background gray scale corresponds to the regional topography.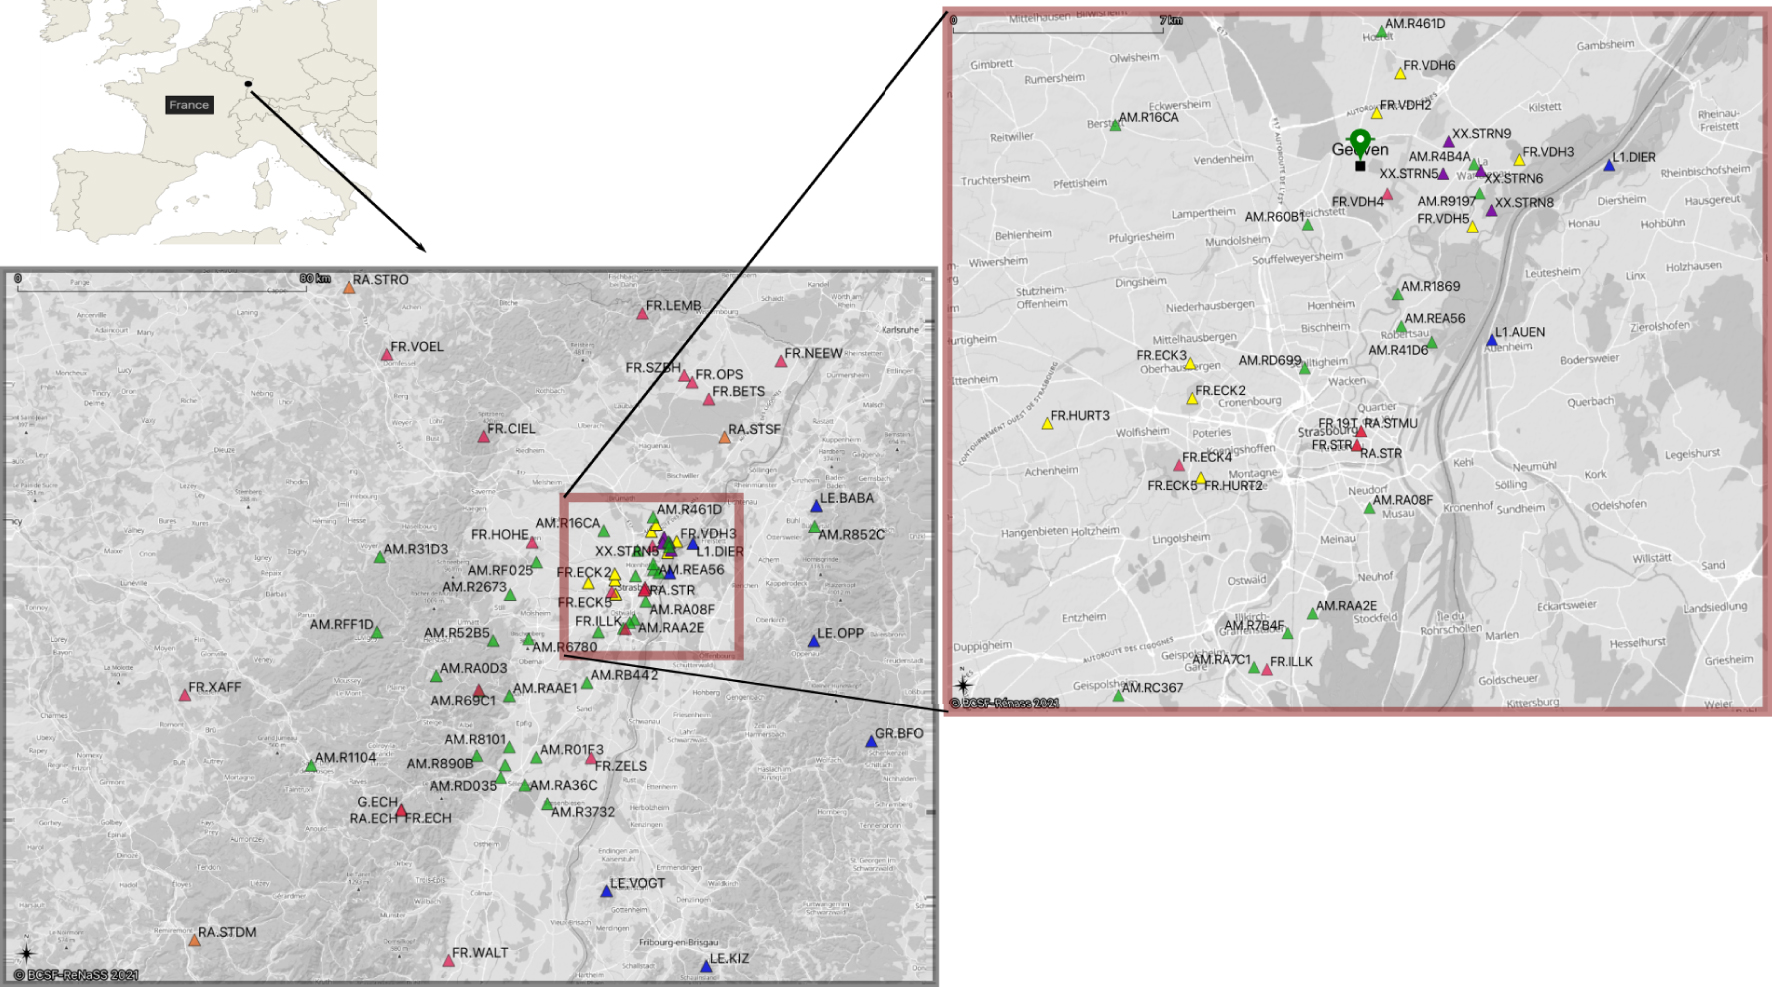
2.1. Local networks
2.1.1. Operator networks
To follow the local regulations, at least six months before the start of drilling, an operational network of at least four short period velocimetric stations has to be set up for each site by operators of deep geothermal projects. It also has to be complemented by a multi-sensor station that includes a broadband velocimetry, an accelerometer, a GPS receiver, and corner cube for InSAR monitoring. The data from this multi-sensor station has to be transferred to Ecole et Observatoire des Sciences de la Terre (EOST) in its ObsNEF service, an EOST facility in charge of the regional seismic monitoring. These data are publicly distributed in real time via the Résif-Epos information system (http://seismology.resif.fr). Two public stations are operated by Fonroche Géothermie: FR.VDH4 and FR.ECK4 and one by Electricité de Strasbourg: FR.ILLK (see Table S5). Moreover, in case of an event of magnitude greater than 2, the operator has also to transfer to EOST, all the data from the four short period stations following the event and covering the 7 days preceding the event.
2.1.2. EOST networks
The temporary EOST network (AM network code—see Table S3) consists first of ten Raspberry Shake stations (raspberryshake.org, DOI:10.7914/SN/AM). Its deployment began in July 2017 and continued until the end of February 2018 in the northern part of the Strasbourg Eurometropole. These are low-cost stations, hosted by citizens (see Table S3). Following the events of November 12 and November 13, 2019, two sites (AM.R45CC and AM.R41D6) equipped with a single-component sensor were upgraded to 3-component sensors (AM.RD699, AM.RC515). The AM.RC515 station could not be maintained in operational condition after December 15, 2019. An additional station (AM.REA56) was also installed close to the southern swarm. These stations are still in operation but are not intended to become permanent. Four additional Raspberry Shake stations (AM.RA08F, AM.R16CA, AM.RC367, AM.RAA2E) were also installed in the Strasbourg Eurometropole in the last half of 2020. Figure 2 shows an illustrative example of recorded waveforms of two of the Raspberry Shake stations during the November 12, 2019 event. In addition, since mid-November 2020, four temporary autonomous stations (XX.STRN stations—see Table S6), consisting of a Taurus digitizer and a Trilium compact sensor, have been deployed in the community of La Wantzenau. Moreover, the Raspberry Shake stations from the citizen seismology projects in the south (Mulhouse area) and west (Molsheim area) of the upper Rhine graben were also used (see Table S7).
Waveforms of vertical components at four stations for the November 12, 2019, MLv 3.0 earthquake. The two top waveforms are obtained from Raspberry Shake stations (AM.R461D in Hoerdt town to the north of the Geoven site and AM.RA7C1 in Illkirch to the south of the city of Strasbourg, close to the permanent station FR.ILLK).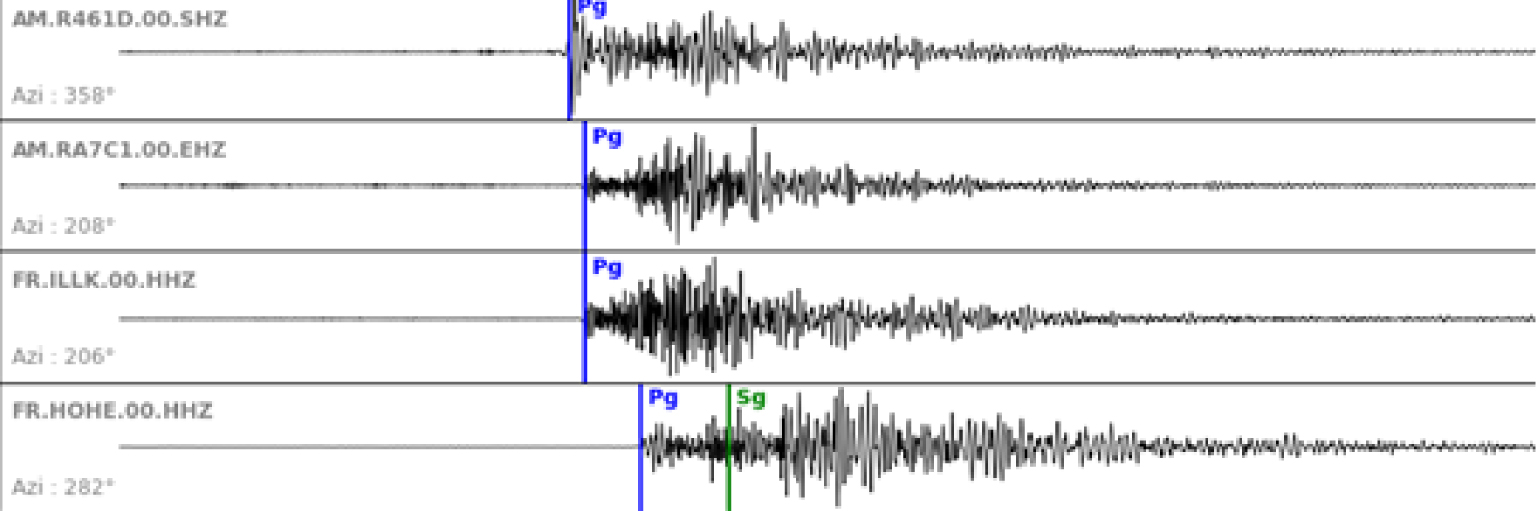
2.2. Regional and national networks
The Rhine Graben stations used are composed of velocimetric stations of the permanent broadband network (RLBP), accelerometric stations of the permanent accelerometric network (RAP) and one station from Geoscope (G.ECH). These stations are part of the French seismological and geodetic network infrastructure (Résif-Epos) and their data are available at http://seismology.resif.fr (see Table S1). Note that the RLBP network has been densified by eight stations in the Rhine graben within the framework of the EGS Alsace project (ADEME grant). Three of these stations became operational from mid-2018 (HOHE, ZELS, VOEL). The RAP accelerometer stations are shown in Table S2.
2.3. International networks
Two temporary stations L1.AUEN and L1.DIER located, respectively, 7 and 8 km from the Geoven site were installed by LGRB in Freiburg, Germany, from mid-November 2019 to mid-January 2020. An archive of these data (MSEED format) was made available to us in mid-January, and integrated to refine the BCSF-Rénass locations. Some more distant stations in Germany, Switzerland, and Luxembourg (see Table S4) were used in particular to locate the largest events.
Location of the seismicity since March 2018 and up to January 31, 2021, in the vicinity of the Geoven deep geothermal site (Fonroche Géothermie company) (green pin) to the north of Strasbourg city. The area of analysis extends over a latitude range of [48.57:48.68] and a longitude range of [7.72:7.87]. The northern seismicity cluster plotted with blue circles (circle size and intensity of the color is a function of the event magnitude) spans in the close vicinity of the termination of the two deep wells GT1 (red line) and GT2 (cyan line) in the La Wantzenau area. It includes the largest event of December 4, 2020, of magnitude MLv 3.6. In red is shown the seismicity cluster of La Robertsau (southern cluster), which includes the November 12, 2019 event of magnitude MLv 3.0 (large dark red circle in the south).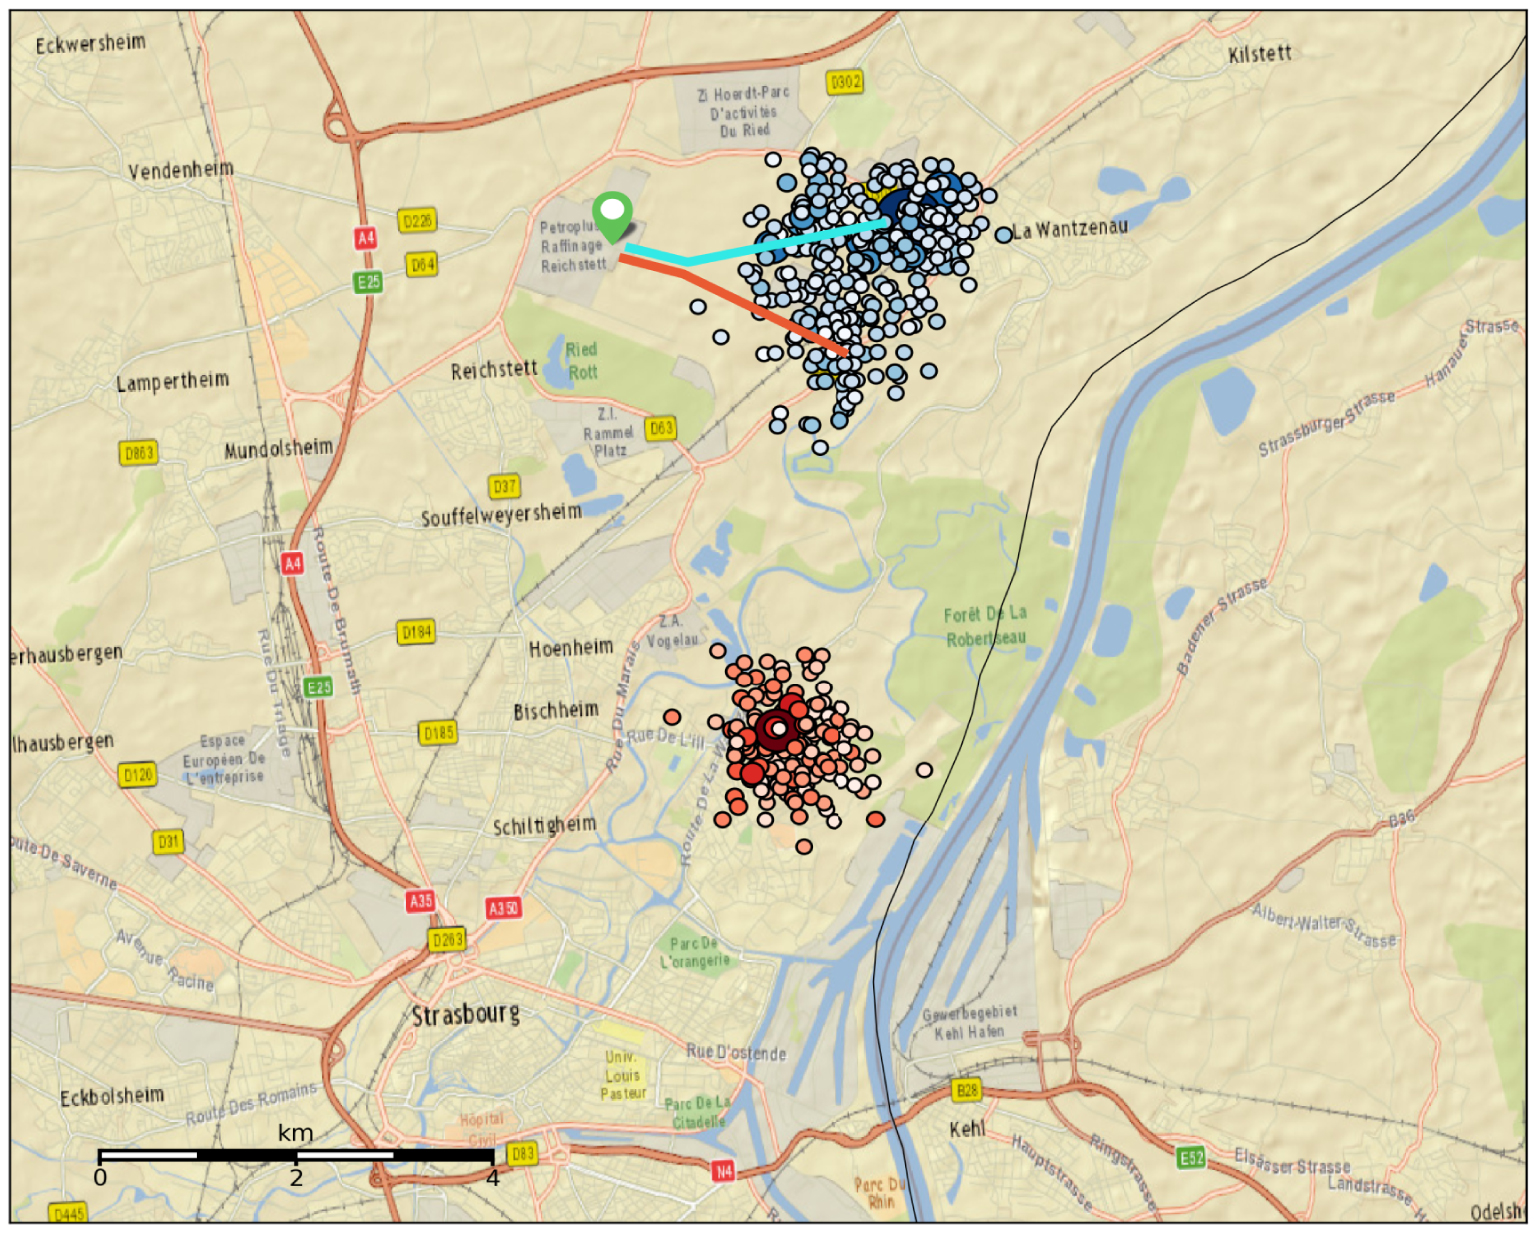
3. Two seismic clusters along a regional fault
3.1. Absolute location from BCSF-Rénass catalog
Seismic activity has been recorded since March 2018 in the northern sector of Strasbourg in real time using SeisComP3 software [Hanka et al. 2000, Helmholtz-Centre Potsdam–GFZ German Research Centre for Geosciences and gempa GmbH 2008]. Real-time automatic events localizations by BCSF-Rénass were obtained using a Seiscomp pipeline consisting first of automatic picking using the scautopick module (with the STA/LTA method, and a detection threshold lowered to four stations) and an automatic localization module scautoloc (grid search) using the 1D Haslach velocity model described in Table 1. All automatic events were manually relocated, still using Haslach velocity model, by refining the automatic picks, adding additional manual picks on available stations and adding polarity when possible. This simple velocity model has been shown to be valid for the regional seismic events. The automatic and manual location algorithm is LocSAT written by W. Nagy [Helmholtz-Centre Potsdam–GFZ German Research Centre for Geosciences and gempa GmbH 2008]. Errors on locations are of the order of 1 km in geographical coordinates and depth or set to a 5 km fixed depth when the localization is poorly constrained (about 15% of events). Magnitudes are local magnitudes calculated on the vertical component of each seismometer (MLv).
1D-Seismic velocity model adapted from the Haslach model [Rothe and Peterschmitt 1950]
| Depth (km) | P wave (km/s) | S wave (km/s) |
|---|---|---|
| 0–2.4 | 5.63 | 3.41 |
| 2.4–20.1 | 5.97 | 3.45 |
| 20.1–30.2 | 6.54 | 3.65 |
| 30.2– | 8.15 | 4.4 |
The part of the BCSF-Rénass catalog used for our study extends from March 14, 2018 to January 31, 2021. No event in the analyzed region (Lat: [48.57–48.68]; Long: [7.72–7.87]) has been recorded before the starting date of this catalog. The catalog includes 511 events with a local magnitude (MLv) in the range [0.1–3.6] (see Figure 3). Two seismic clusters have been identified: the northern cluster in the vicinity of the Geoven wells and the southern cluster where the seismic sequence of November 2019 took place. The main earthquake of November 12, 2019, MLv 3.0, is part of the southern seismicity cluster that includes 166 earthquakes, located 4.6 km south of the Geoven wells (see Figure 3, in red). The northern cluster consists of 345 events. All felt earthquakes between October 2020 and January 2021 belong to this northern cluster in the close vicinity of the Geoven wells (see Figure 3, in blue).
Time evolution of the seismic activity in the vicinity of the Geoven site (Lat: [48.57–48.68]; Long: [7.72–7.87]). Scale is: 0.01° in latitude corresponds to 1111 m; 0.01° in longitude corresponds to 734 m. Seismic events are represented with a circle with a size and color that are a function of its magnitude. Thick red lines show periods of operational activities in the geothermal wells (drilling or hydraulic tests) (Fonroche Géothermie communication).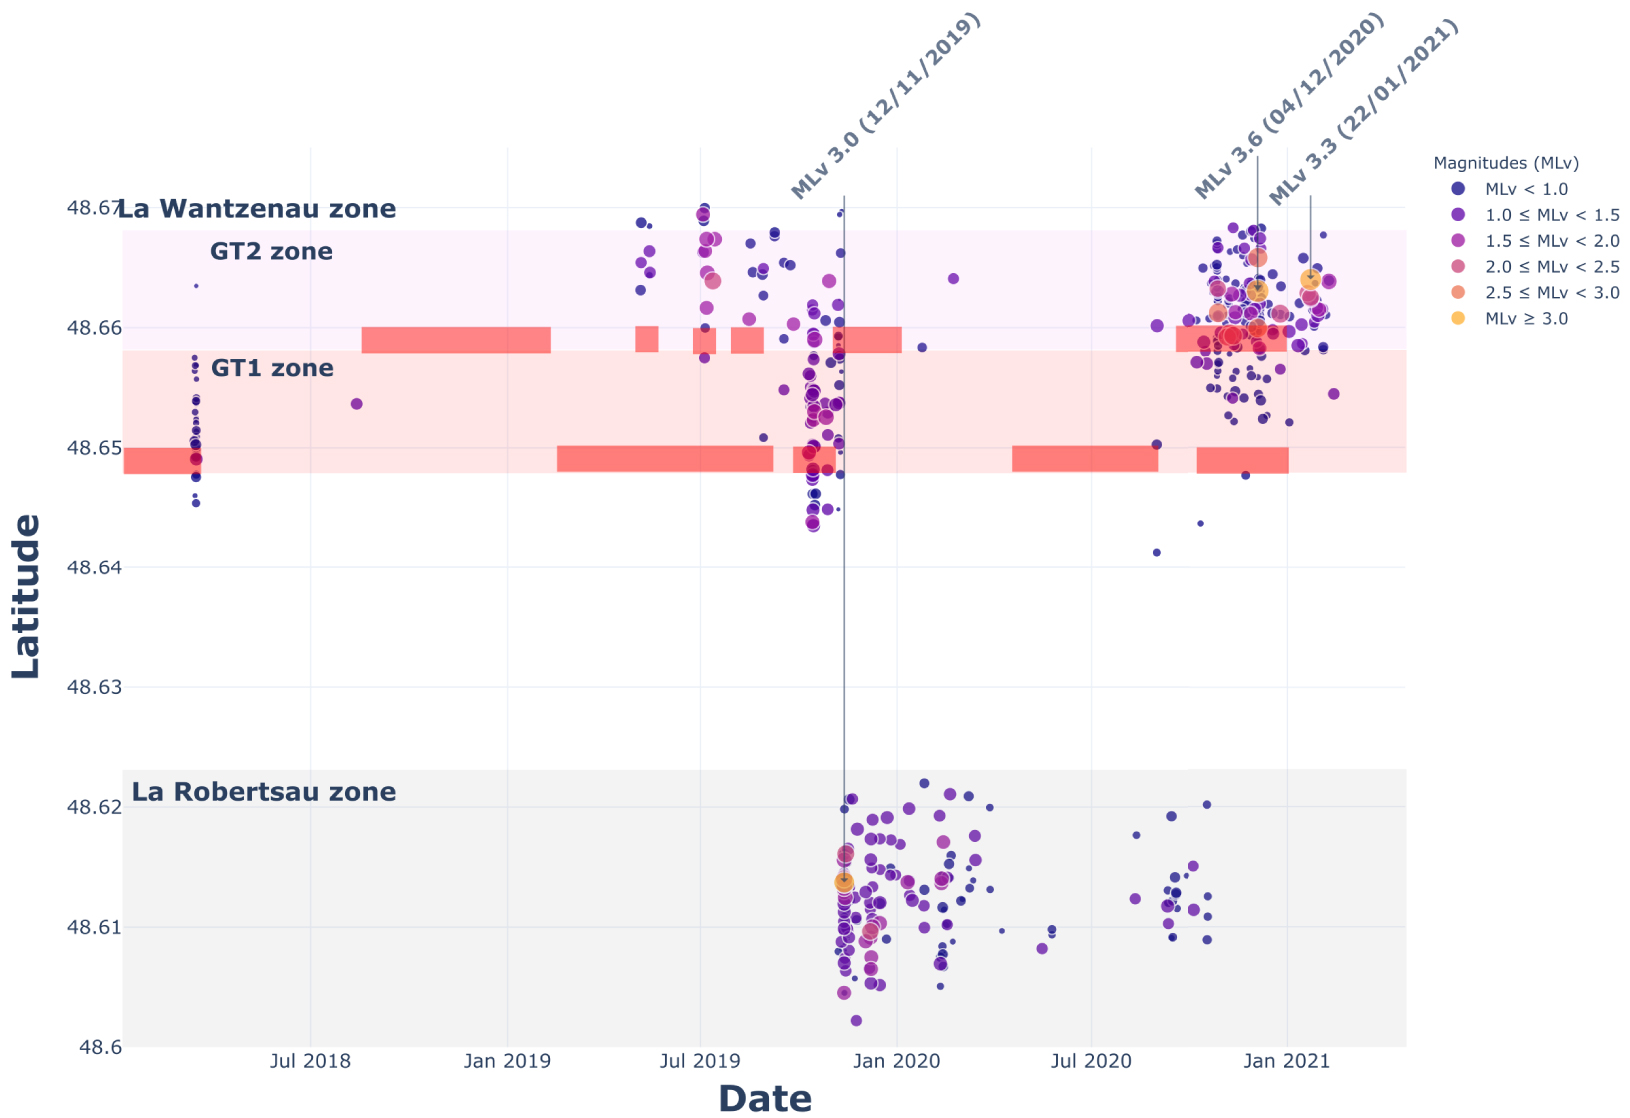
3.2. Time history of the clusters
In Figure 4, each recorded earthquake of the catalog is represented by its time of occurrence along the abscissa, and its latitude on the ordinate and with a circle whose size and color are a function of its magnitude. The figure shows the emergence of the seismic activity in the area in March 2018. It corresponds to the end of the drilling phase of the GT1 well when the first test has been performed. Activity restarted in May 2019 in the GT2 well area also after the end of the drilling phase of GT2 and the beginning of hydraulic tests in the well. After several months of activity in the GT2 zone, the activity extends to the GT1 zone from October 10, 2019, until November 9, 2019. Then, a long series of earthquakes in the Robertsau area occurred remotely at about 4 km to the South, including the most important event of November 12, 2019 (M3.0). The activity in this southern zone was intense until April 2020. In the northern area (La Wantzenau), activity restarted in the GT2 zone on August 30, 2020. A few days after (September 10, 2020), activity was occurring in the southern cluster. The earthquake activity resumed significantly in October 2020 in the GT2 well zone and then accelerated to become intense until December 4, 2020 with the MLv 3.6 event. Activity then reduced until late January 2021, where the second largest event occurred (January 22, 2021). It is in this zone that most of the felt events took place. During the strong activity of the fall 2020, no activity was recorded in the southern cluster.
3.3. Depth distribution
The depth distribution of events of the BCSF-Rénass catalog is plotted in Figure 5. It evidences that both clusters of seismicity (northern and southern clusters in La Wantzenau and La Robertsau areas, respectively) share the same depth distribution with a maximum around 5 km depth. The width of the distribution corresponds to the depth resolution of ∼1 km. This depth range corresponds to the open hole domain of both deep geothermal wells of Geoven site.
Depth distribution of northern (blue) and southern (red) clusters.
3.4. Magnitude distribution
The Gutenberg–Richter (GR) distribution of magnitudes for each cluster is shown in Figure 6. The southern cluster is considered as a whole in terms of seismicity history. It developed in November 2019 and ended in the mid-2020. We computed the b-value and the magnitude of completeness (Mc) using the Ogata and Katsura [1993] method and Daniel’s algorithm [Daniel 2007]. For the northern cluster, we distinguished two periods (Figure 4): the first period that ends with the first part of the Geoven project, that is to say, the drilling of the wells and their first hydraulic tests in 2018 and 2019, and a second period that includes also the second phases of the tests during late 2020.
From the evolution of the northern distribution in time, we see that the magnitude of completeness is evolving with the network development between the first and the second phase: it reduces from Mc = 1.1 to Mc = 0.6. Interestingly, the b-value is changing from one period to the other: it starts from a rather high effective value of b = 1.54, which typical of induced seismicity related to fluid injection and reduces to a more classical value for active fault regions: b = 0.86 at the end of the second period when computing over both periods [Zang et al. 2014]. This difference has to be related to different mechanisms of seismicity generation in each of the clusters, with the value of b being sensitive to the stress regime, the presence of large faults, the mode of rupture, the presence of fluid etc. An alternative interpretation would be that the b-value is similar for both periods but with a significant cut-off for the largest seismicity during the first period of the project. In this case, the seismicity with mostly large events during the fall was a catching-up to reach a tectonically driven GR distribution as observed at Rittershoffen site during the 2014 hydraulic stimulation [Lengliné et al. 2017].
The GR distribution of the southern cluster is best fitted by a b-value: b = 0.97, which is not significantly different from that of the whole northern cluster and characteristic of a classical tectonic context. It, however, shows a lack of seismicity between 2 and 3 on the basis of the limited statistics of this cluster. The magnitude of completeness: Mc = 0.8 is intermediate between the first period of the northern cluster and its last period that can be related to an intermediate status of the network during its development and a rather remote location compared to the closest stations.
Gutenberg–Richter distribution of (left) southern cluster using the whole catalog, (right) northern cluster at two different stages in blue before August 1, 2020, and in yellow using the whole catalog of the cluster over both periods (b-value and completeness magnitude (Mc) are estimated using the Ogata and Katsura [1993] method).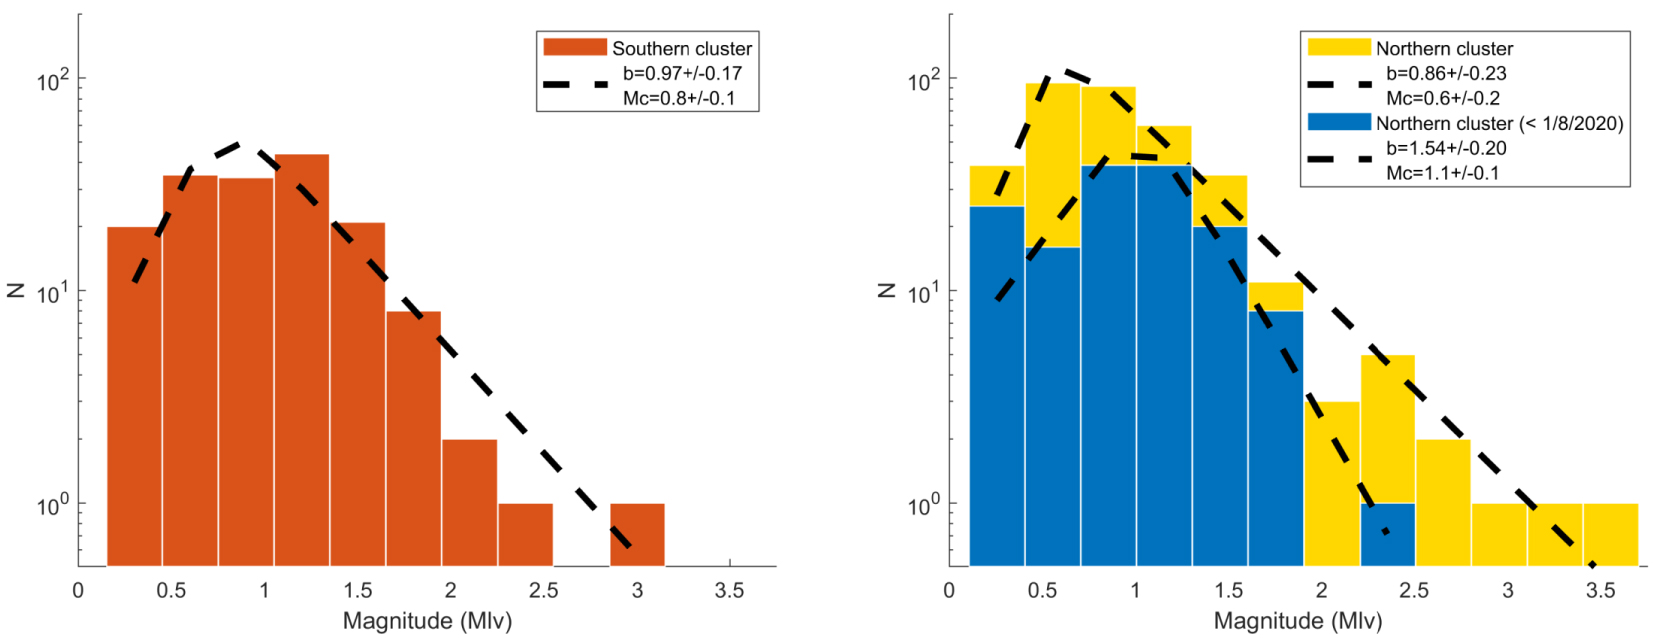
3.5. GEORG geological model and the Robertsau fault
The public database GEORG (http://www.geopotenziale.org) provides a regional geological model for extracting geological sections such as those shown in Figures 7b and c. Figure 7c shows a section extending over a little more than 12 km from Souffelweyersheim to Auenheim crossing the area of the southern seismicity cluster of November 12, 2019. This figure also shows the surface location of the main regional faults, which are oriented generally N10 and dip westwards by around 70°. Figure 7b shows a section oriented parallelly but further north intercepting the northern swarm near the Geoven wells.
A spatial geological link between the two clusters over the significant distance (4.6 km) exists owing to the presence and the orientation of the Robertsau fault that connects the two swarms. This fault is a large-scale structure (from Plobsheim, 22 km to the South of the Geoven project to Weyersheim, 7 km to the North, with a geographical extension of about 30 km). The deep geothermal project in Illkirch (ES company) is targeting the same fault zone at a distance of 16 km to the South.
(a) (left) Location of the northern and southern seismicity clusters from the BCSF-Rénass catalog in relation to the local structural geology. In blue, the earthquakes of the northern cluster before August 1, 2020. In Yellow, the seismicity of the northern cluster after August 1, 2020. In red, the southern cluster. The position of the Geoven wells is represented by the green lines. The colored background represents the geology at a depth of 4 km (extracted from the GEORG database: http://maps.geopotenziale.eu). In white are shown the position of the main faults at 4000 m depth. The earthquakes are globally at a depth of about 5 km. The two northern and southern clusters are located on the same fault (Robertsau fault) with an orientation of about N010° E to the North of the southern cluster and N025° E to the South of it. (b) (right top) Cross-section along the profile A–B. The blue ellipse shows the location of the northern cluster at the root of the Robertsau fault. Red arrows provide a sketch of the Geoven wells. (c) (right bottom) Cross-section along the profile A′–B′. The red ellipse corresponds to the location of the southern cluster also at the root of the Robertsau fault.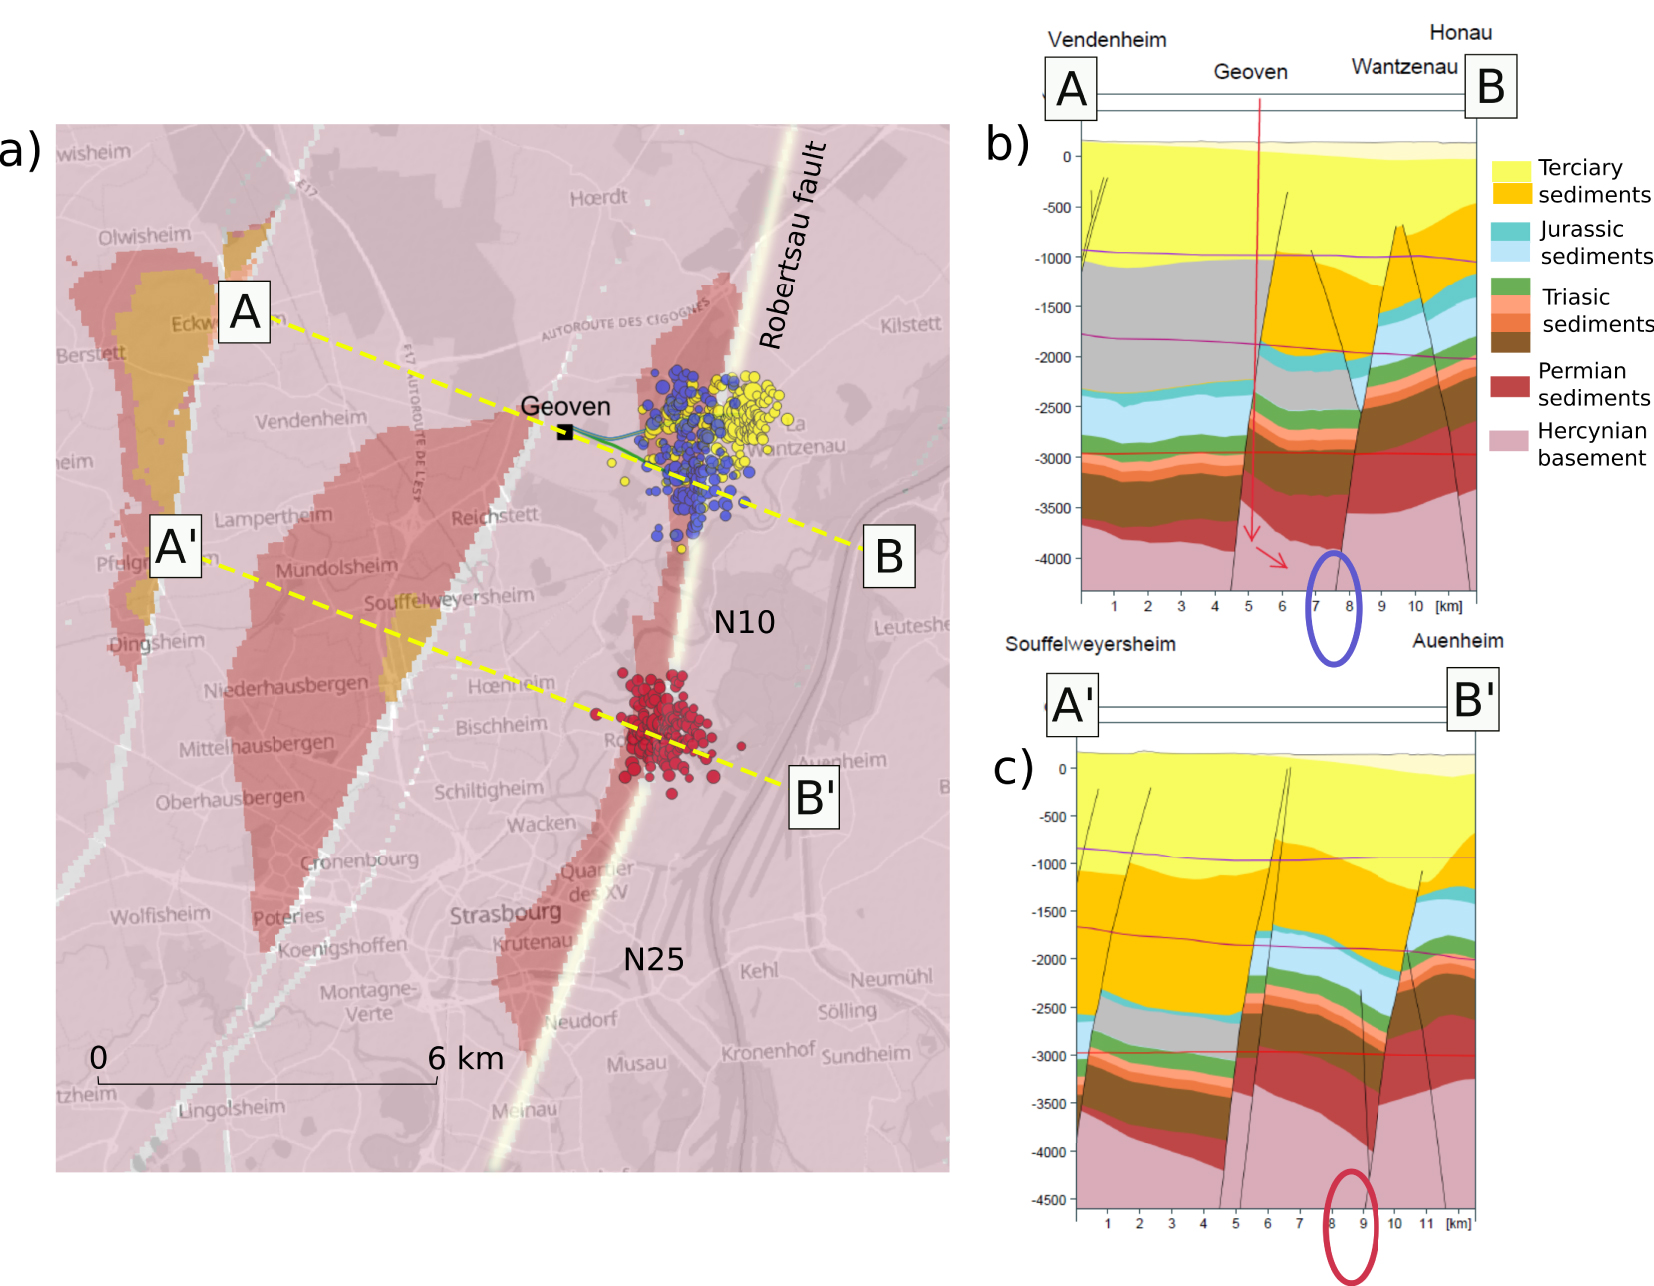
4. Template matching and relative relocation
4.1. Search for supplementary detections by template matching
The template matching technique aims at looking for small events that are not detected by classical detection algorithms because they are too small (or overlapping other events) but which would have produced a signal similar to the larger signals detected [Peng and Zhao 2009, Lambotte et al. 2014, Lengliné et al. 2017]. We thus used the earthquakes from the BCSF-Rénass catalog that are manually checked as reference signals (“templates”) and thus searched by correlation if there were other occurrences of these same but smaller signals in the continuous signal. It is then a matter of recognizing a temporal pattern in the continuous signal instead of pointing to an emerging peak, which has a much higher resolving potential and therefore a capacity to detect more events hidden in the seismic noise and consequently enrich the catalog. When the correlation between the signal of a well-recorded event and the continuous signal, averaged over four different recordings (four channels at four distinct stations), is above a threshold (typically 0.3), a new detection is declared. The value of the threshold is obtained by running the correlation for each day-long signal with a time-reversed and polarity-reversed version of the template signal and extracting the statistics of false detection from the returned correlation coefficients. However, this enrichment of the catalog is not exhaustive for several reasons. On the one hand, we can only add events that have a waveform identical to that of events already identified. This will therefore not allow the enrichment with events different from those already found. On the other hand, this technique is very sensitive to multiple artefacts in the data. This latter limitation is important in 2018 when a very limited number of stations were operational in the study area.
Several frequency ranges have been explored and lead to variability in the final number of newly detected earthquakes. We have chosen here the 5–24 Hz frequency range which gives the most robust results. The search for events similar to those in the catalog by template matching was carried out over the entire period from March 14, 2018, to January 31, 2020. It can be seen from Figure 8, that significantly more earthquakes are identified than in the initial catalog (approximately two times more, that is, more than 1,115 events in the final catalog). However, the final number of events may vary: depending on the initial database, the choice of stations or the frequency range used for detection. The number of earthquakes identified is therefore significantly higher than the number of earthquakes in the BCSF-Rénass catalog, but remains not exhaustive.
Detail of the evolution in 2019 of the number of earthquakes in the BCSF-Rénass seismicity catalog (in blue), as well as those detected by template matching (in orange). Stars correspond to felt earthquakes: yellow for 2 < M < 3 and orange for M > 3.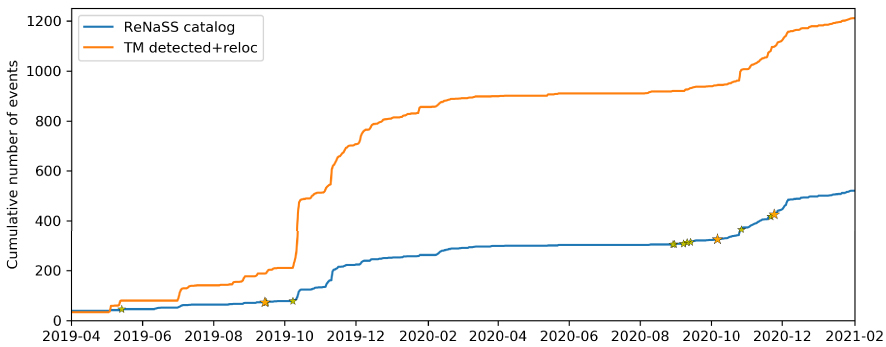
4.2. HypoDD relocations
In a second step, events of the catalog completed with template matching detection are located using a relative location approach. By analyzing the time differences between the paths of nearby events using cross-correlations of waveforms, it is possible to obtain an accurate estimate of the difference in hypocentral position of the events with a lower dependence on the velocity model of the formations above the reservoir. To do so, we calculate travel time delays of P and S phases for all identified pairs of earthquakes. The initial location of each new template matching detection is fixed to the location of the best template (e.g., the one corresponding to the maximum correlation), these locations are those from the BCSF-Rénass catalog. Only the time delays associated with cross-correlation coefficients higher than 0.6 are kept, and to take into account only well resolved pairs of events, a minimum of seven delays per pair is considered. A double-difference algorithm [HypoDD, Waldhauser and Ellsworth 2000] is then used. Tests were carried out to determine the sensitivity of the relocation result to several factors: initial depth of events, velocity model, inversion parameters, and initial location. Only part of the events detected can be relocated. A large number of events have a signal that is too weak at a few stations. In particular, events from 2018 are difficult to relocate (only 2% of the events from 2018 could be relocated). The contribution of template matching detection and the associated relocation is therefore only relevant for the analysis of the seismicity recorded from 2019 (1086 earthquakes) and to deduce characteristics of the seismogenic geological structures.
Figure 9 illustrates the contribution of relative locations obtained by double differences. This figure compares the absolute locations of earthquakes in the BCSF-Rénass catalog for the whole period (from March 2018 to January 2021) and those obtained from relative locations using HypoDD after enrichment by template matching. The location error is reduced to a few tens of meters with the relative location approach instead of 1 km for the absolute locations of the BCSF-Rénass catalog. Accordingly, events are located with a resolution higher than the size of the geological objects involved. The spatial distribution of the relocated seismicity then helps to identify the activated fault segments during the sequence. The two seismic clusters identified with the BCSF-Rénass catalog (the northern and the southern clusters) are better characterized. The main fault zone (i.e., the Robertsau fault) is added to illustrate the link between the seismicity distribution and this main structure. Two periods are identified by specific colors: the first one that starts in 2018 with the beginning of the project and ends by mid-2020 after the quiescence of the southern cluster that follows the seismic crisis of November 2019; the second one that corresponds to the phase of hydraulic tests during the fall of 2020 until the shut-in of the well in January 2021. We see that most of the southern cluster develops during the first period (red) as the seismicity around the southern well (GT1) (blue). The seismicity around the second well (GT2) is largely related to the second period (yellow) but there is some activity in the southern cluster in the second period (green).
Location of the northern and southern cluster of seismicity: (left) map of the absolute locations from the BCSF-Rénass catalog; (right) map of the relative locations using HypoDD. In gray, the trace of the fault zone (Robertsau fault) between 4 and 6 km in depth, described in the GEORG geological model (http://maps.geopotenziale.eu). Colors correspond to the two different periods in both clusters: before and after July 31, 2020.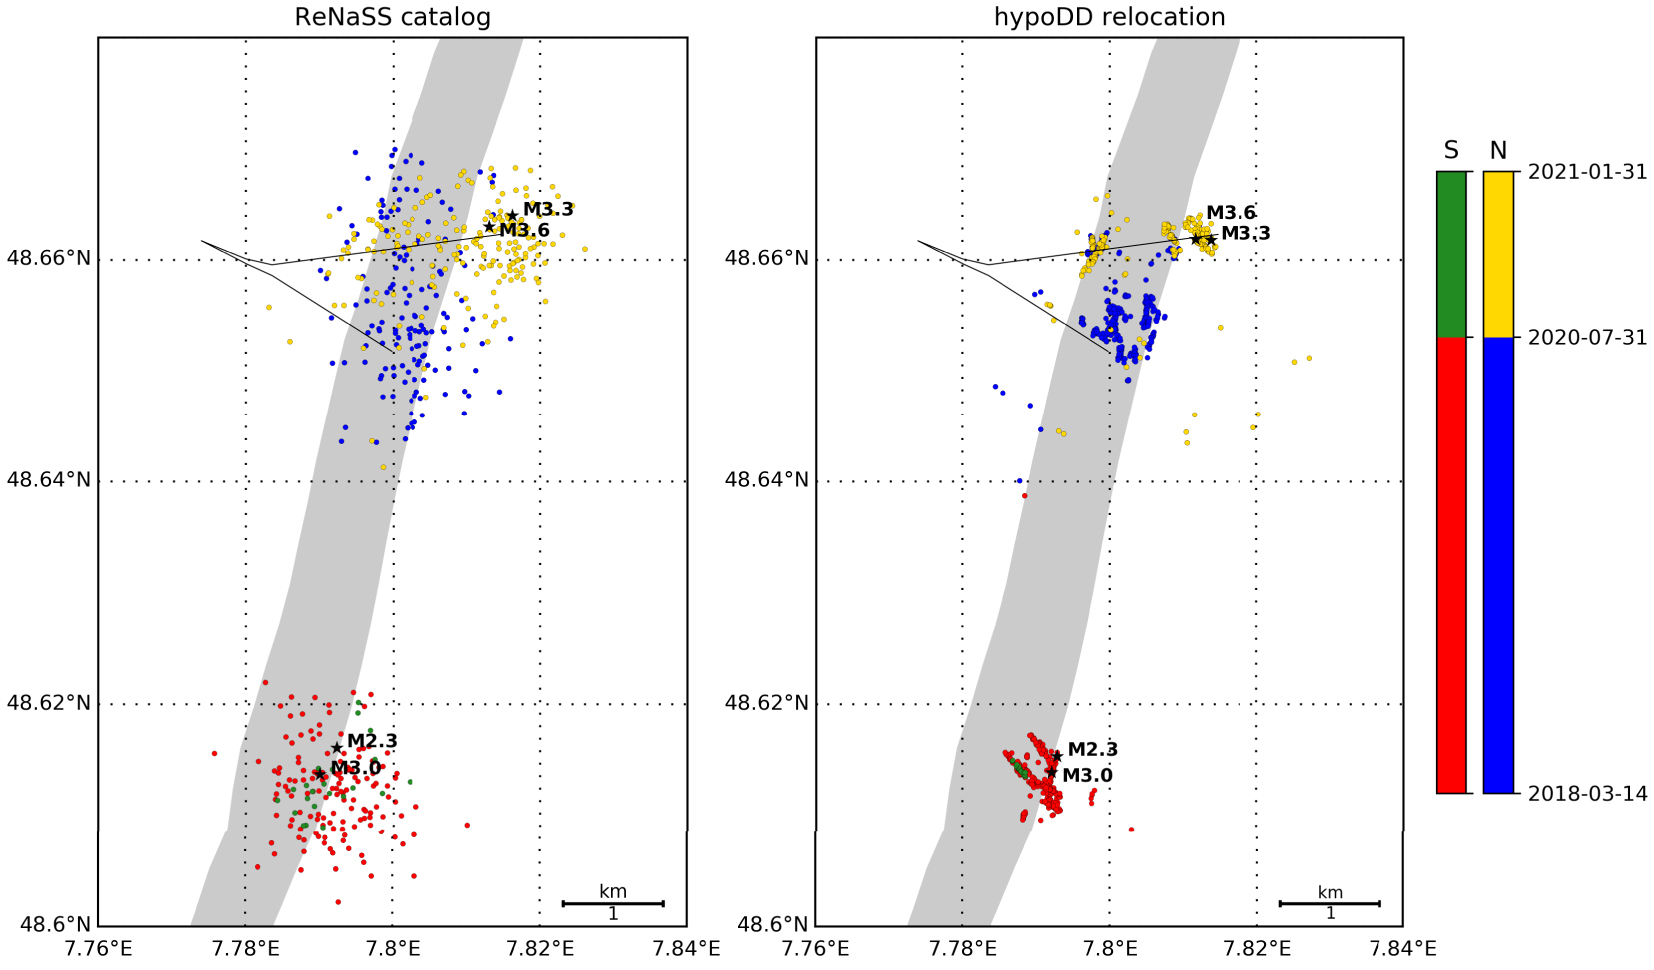
4.3. Local fault structures
One outcome of the precise location of the earthquakes, is the accurate mapping of the fault structure from the spatial distribution of seismic activity. In Figure 10, we detail the case of the northern cluster by zooming on the domain around the termination of both wells (long: [7.78–7.82]; lat: [48.65–48.67]), which covers a zone of 2.9 × 2.2 km2 around the terminations of the GT1 and GT2 wells at a depth of about 5 km. It can then be seen that the seismicity of the first period (before August 1, 2020) in blue (zone 1 in Figure 10), is rather diffusively distributed between the wells in the vicinity of GT1 both in latitude and depth. This zone belongs to the Robertsau fault domain (gray zone in Figure 10). Alignments of seismicity emerge in the direction N015° E, parallel to the main fault structure (i.e., the Robertsau fault) but mostly outside this fault zone (gray domain in Figure 10). Along the GT2 well, a clear fault structure emerges close to the center of the image in the upper part of the well (at ∼4 km depth) which is oriented N030° E (zone 2 in Figure 10). This structure has been reactivated during the second period (autumn 2020) when two felt earthquakes: the M2.1 and M2.7 events, respectively, on October 27 and 28, 2020, have been recorded (black stars). It appears to be above the main fault zone. The second structure along GT2 well that has been reactivated during the second period is further down along the well (800 m to the East) (zone 3 in Figure 10). It corresponds to a structure oriented N325° E where no felt earthquake has been identified. The last zone (zone 4 in Figure 10) located at the end of the GT2 well, below the main fault zone, has to be emphasized since it hosts most of the recent felt events including the two largest earthquakes: M3.6 on December 4, 2020 and M3.3 on January 22, 2021. This zone has a general orientation toward the north-west (N320° E) but also shows a complex internal structure with possible conjugated sub-directions (N015° E). In general, very little recent seismicity occurs in the vicinity of the GT1 well during the second period.
Zoom of the seismicity map after relative location using HypoDD around the northern cluster in the close vicinity of the Geoven wells. (main panel) geographical map (0.01° in latitude corresponds to 1111 m; 0.01° in longitude corresponds to 734 m). The production well (red arrow) to the south is GT1. The injection well (blue arrow) to the north is GT2. The gray zone corresponds to the trace of the main fault zone (i.e., the Robertsau fault) between 4 and 6 km in depth, from the GEORG geological model. (right) latitude-depth section where all the seismicity is projected along the longitude direction. Numbers refer to zones described in the text. (bottom) longitude-depth section where all the seismicity is projected along the latitude direction. The dark gray zone corresponds to the zone between 4 and 6 km also shown in the map view. The light gray zones are extensions of the fault zone shallower and deeper. Stars correspond to the felt earthquakes: in black, magnitude between 2 and 3; in red, magnitude larger than 3.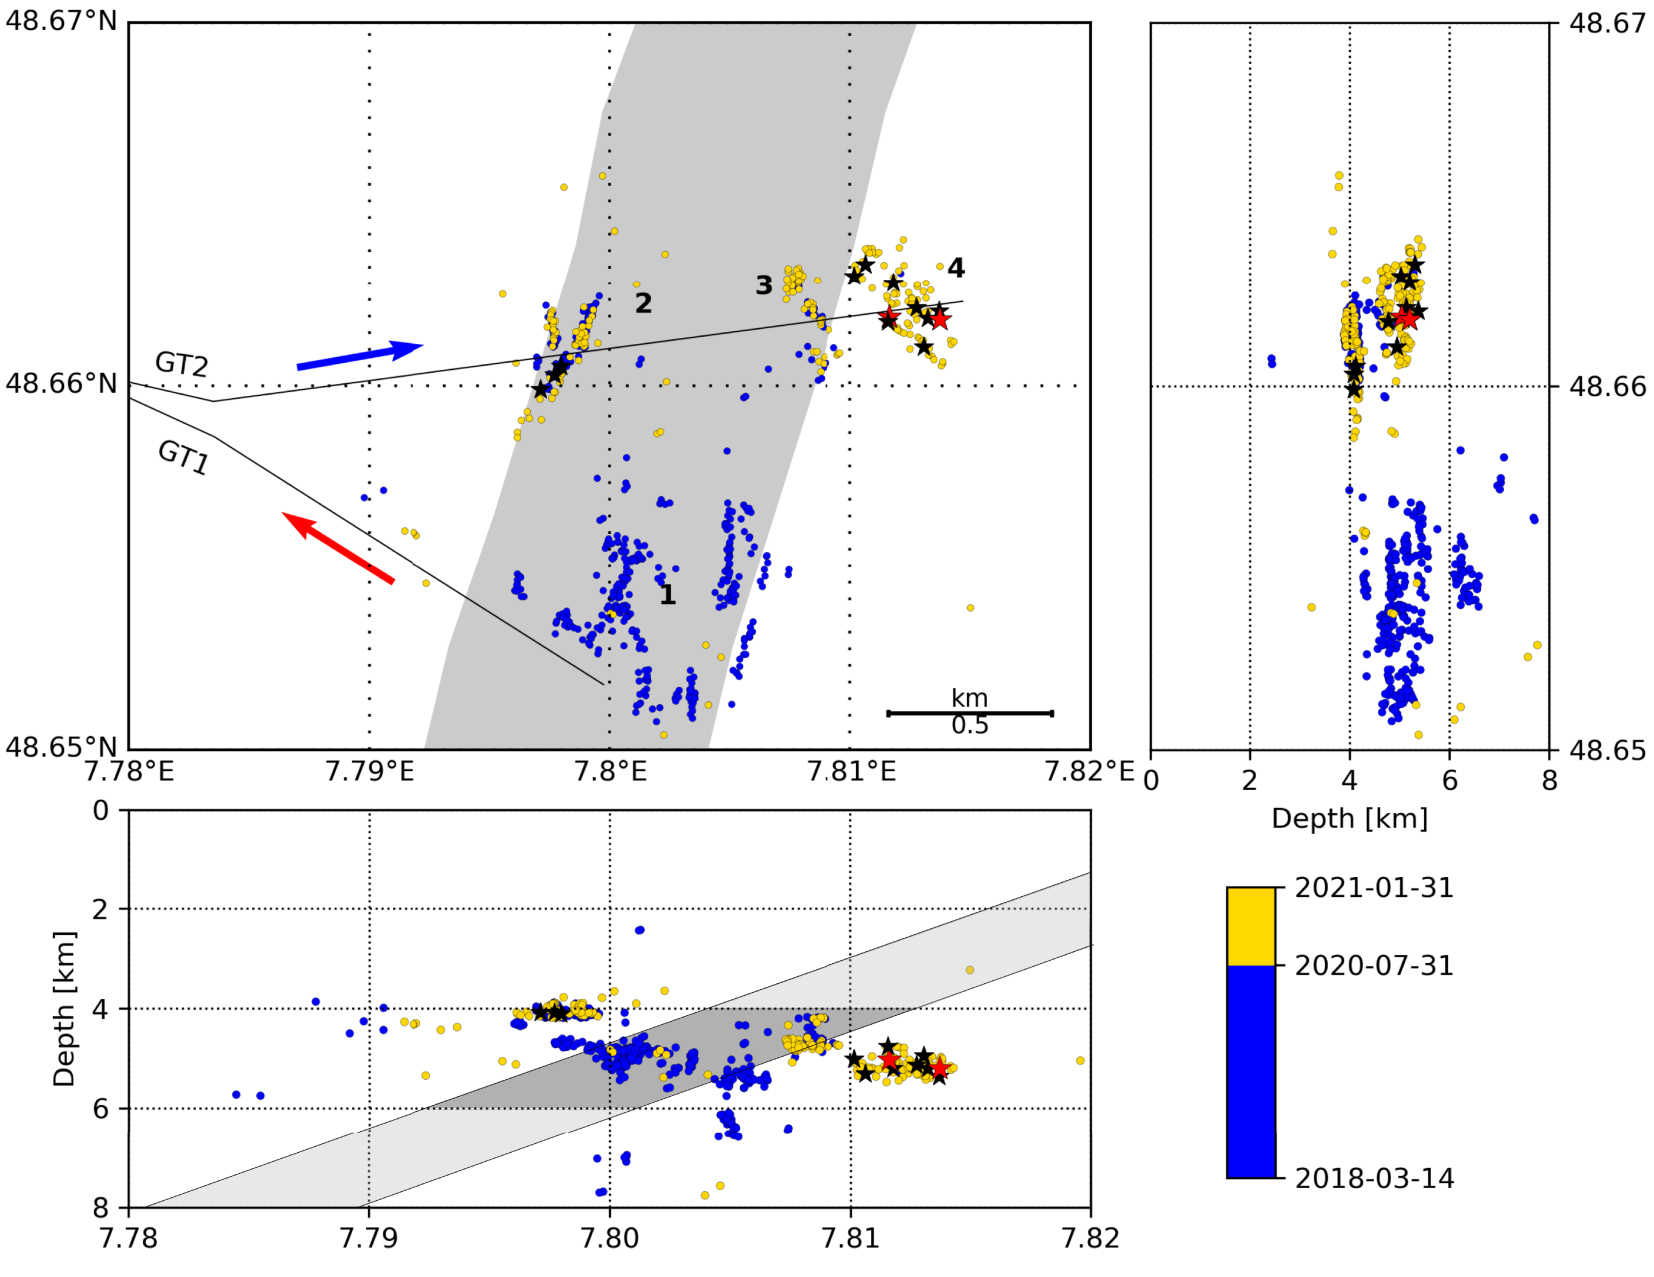
Figure 11 shows a zoom of Figure 9 on the southern cluster using the same color coding. It covers a zone of 1.7 × 2.2 km2. The cluster exhibits possibly existing conjugate fault structures along the directions N015° E and N040–050° W (i.e., N310–320E). The four main events of magnitude larger than two, are located along the same N015° E-trending structure that is perfectly compatible with the direction of the regional fault in this zone (gray zone in Figure 11), identified in GEORG (http://www.geopotenziale.org). The general trend of the seismic cloud is also consistent with the dipping of the Robertsau fault of 76° W despite being shifted from the fault zone to the East (this questions the location accuracy of the Robertsau fault in the GEORG model). The recent activity in the cluster (in green in Figure 11) is along a structure trending N040° W.
Zoom of the relocated seismicity of the southern cluster. (main panel) geographical map (0.01° in latitude corresponds to 1111 m; 0.01° in longitude corresponds to 734 m). The gray zone corresponds to the trace of the main fault zone (i.e., the Robertsau fault) between 4 and 6 km in depth from the GEORG geological model. (right) latitude-depth section where all the seismicity is projected along the longitude direction. (bottom) longitude-depth section where all the seismicity is projected along the latitude direction. The main fault zone is shown in dark gray between 4 and 6 km and light gray for its extension below and above. The black stars represent the two events with a magnitude between 2 and 3: M2.1 on November 12, 2020, M2.3 on November 13, 2020, and M2.1 on December 6, 2019. The yellow star corresponds to the M3.0 event of November 12–13, 2019. Bottom figure, the gray zone has a 76° W-dipping consistent with the dip of the GEORG model (see Figure 6c).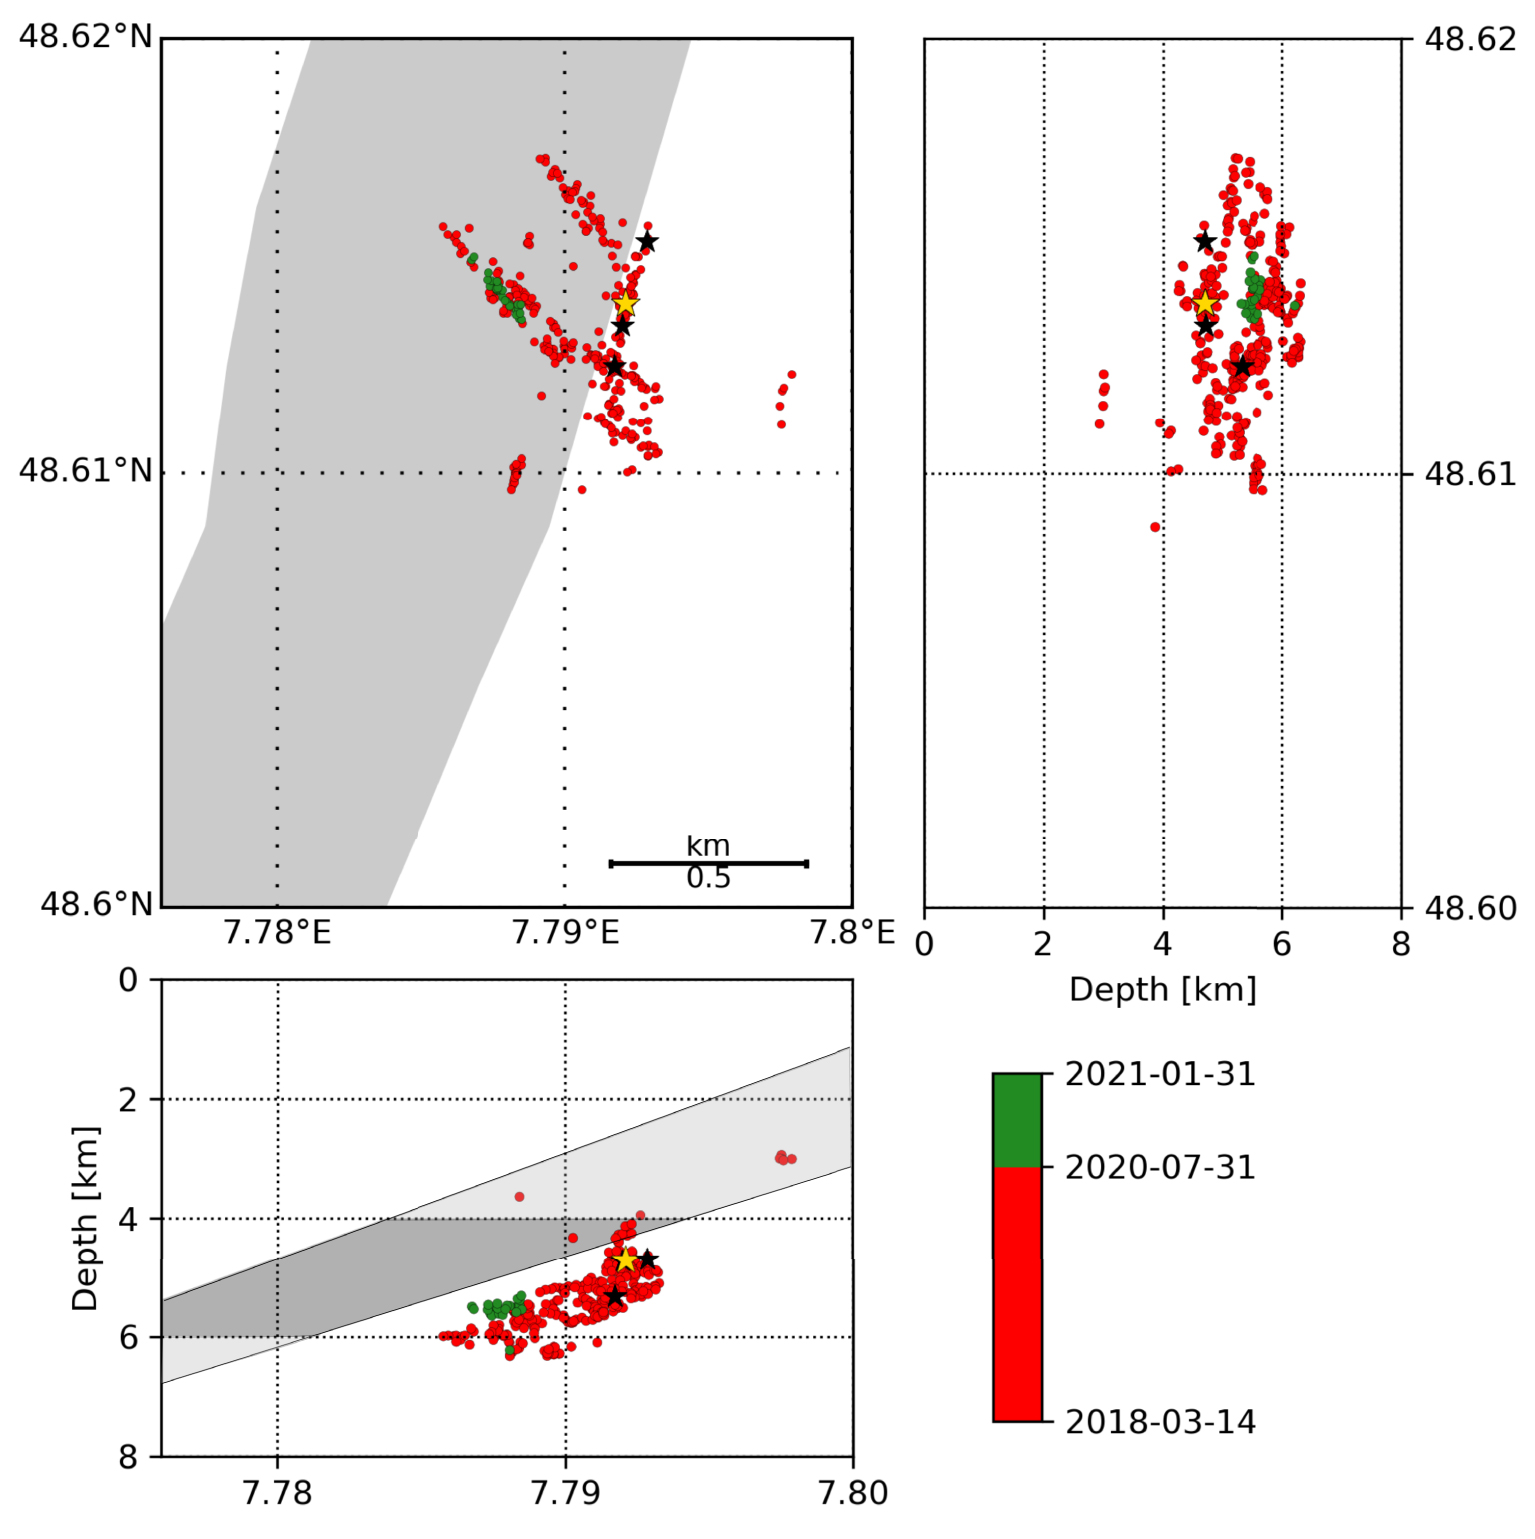
5. Natural, triggered, or induced seismicity
5.1. Local seismicity history
An important information is the pre-existing seismicity to the Geoven project in the area. To characterize this point, Figure 12 shows the history of the monthly seismic rate since 1980 for different concentric zones all centered on the Geoven wellhead position (lat: N48.661686; long: 7.773534E) using the BCSF-Rénass catalog. Quarry blasts have been removed. The smallest one has a radius of 5 km. With the limit of the evolution of the completeness magnitude over the years owing to the development of the regional network, it shows that the seismicity started in the 5 km region around the wells with the Geoven project in 2018. It is only when the radius reaches 20 km that one starts to record the natural background seismicity. At 30 km, the increase of the rate during the 2000 s is related to the hydraulic stimulations at Soultz-sous-Forêts. Even at a 50 km scale which is of the order of the Rhine Graben width, the Geoven seismic activity is still important compared to the local history of the natural seismicity.
Time evolution of the monthly seismicity rate since 01∕01∕1980 for different regions centered on the Geoven wellhead position but using various radii for the zone of interest: (from top to bottom) R = 5, 10, 20, 30 and 50 km.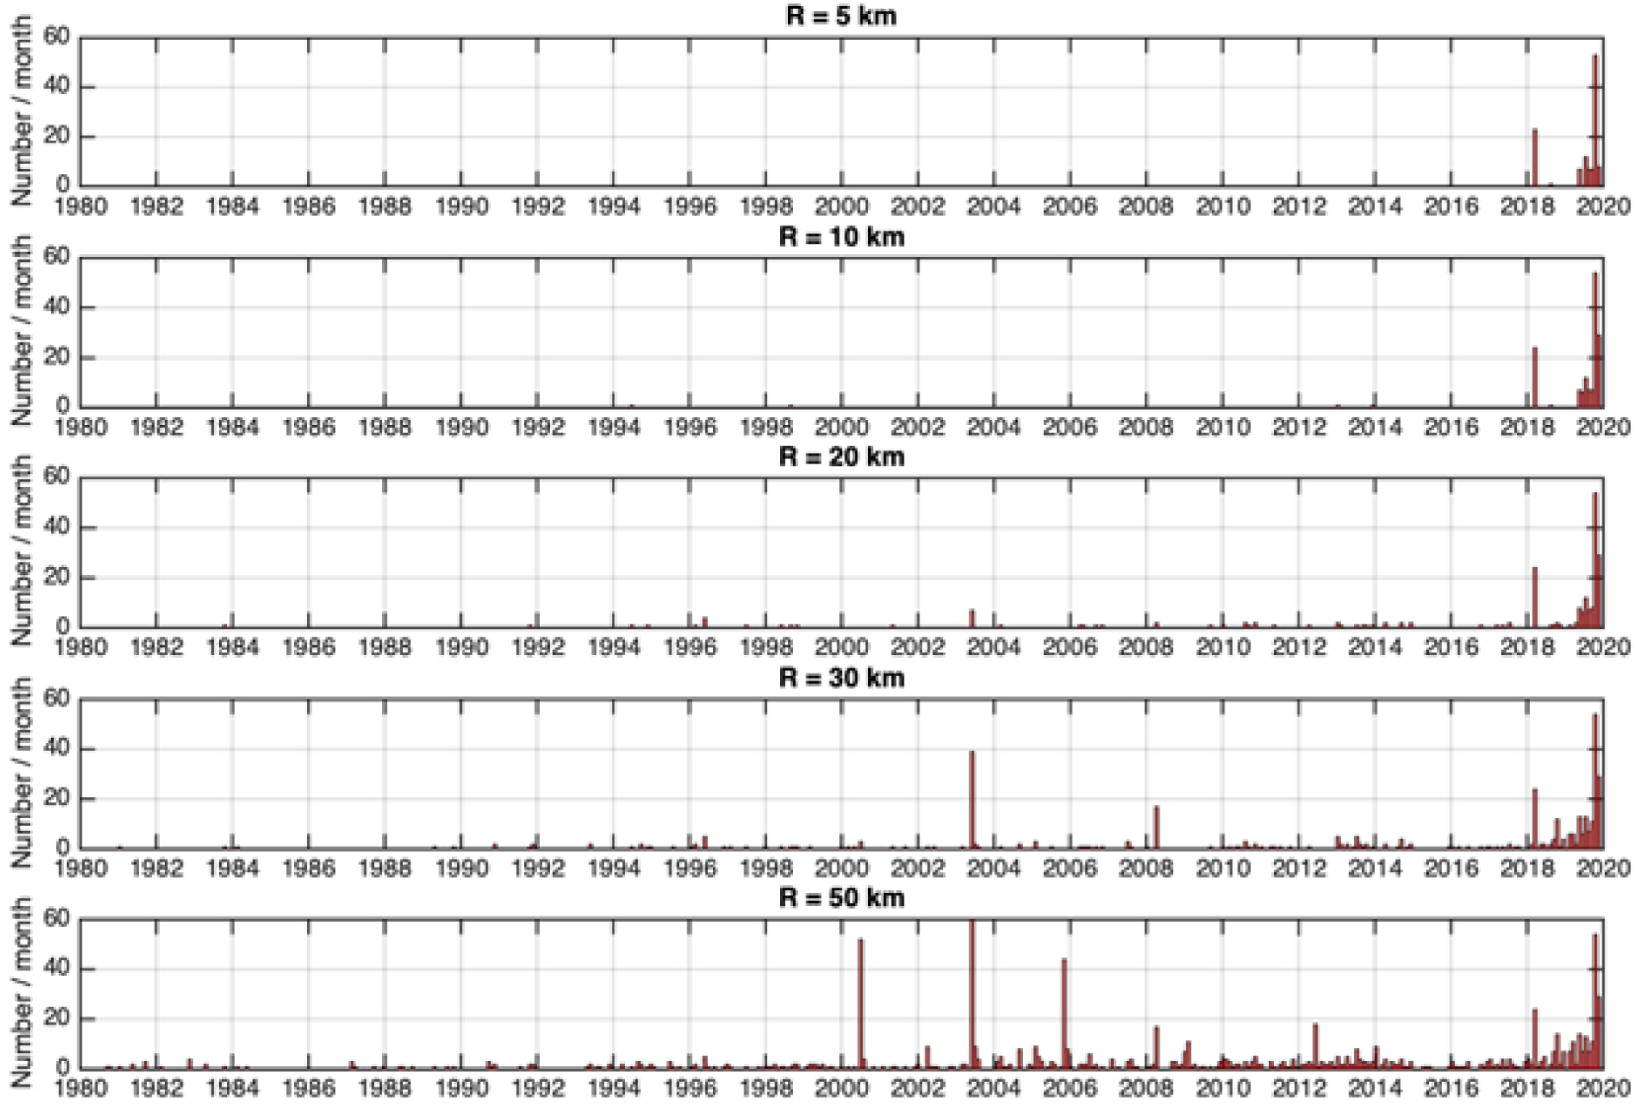
5.2. Time correlation between northern and southern clusters
Figure 13 details the space–time evolution of the seismicity in the days before November 12, 2019, from the BCSF-Rénass catalog. From the night of November 6 to November 7, 2019, the southern seismic swarm developed 4 km south of the Geoven site, five days before the main event of Mlv 3.0. Actually, this period was corresponding to the end of the first phase of hydraulic tests on the both wells. It confirms that the phases of activity of the two seismic clusters have been overlapping at the beginning of November 2019, showing the temporal correlation between the activity on the Geoven site, the occurrence of activity in the northern cluster, and the onset of activity within the southern swarm.
Detail of the seismicity evolution shown in Figure 4 around November 7, 2019, at the end of the first series of hydraulic tests in the Geoven wells and 5 days before the M3.0 earthquake (dark red) in the southern cluster. Thick red lines show periods of operational activities in the geothermal wells.
Interestingly, the space–time evolution during the restart of the hydraulic tests in late August 2020 reproduces a similar configuration and confirms the link between the seismic activity of both clusters (see Figure 14). Indeed, we see, after a long period of quiescence in both clusters, that when seismic activity restarts in the GT1 zone (southern Geoven well), seismic activity emerges again in the southern cluster with a delay of about 10 days. Actually, this 10-day delay appears to be also coherent with activity history in November 2019. Moreover, the observation in Figure 4 that during the numerous injections in GT2 during the fall 2020, no seismicity was observed in the southern cluster, suggests that the link between the seismic activity of the northern cluster and the southern cluster is related to the injections in GT1 and not to those in GT2.
Detail of the seismicity evolution shown in Figure 4 around September 10, 2020 during the restart of the hydraulic test in the Geoven wells. Background colors correspond to the same zonation as in Figure 4. Thick red lines show periods of operational activities in the geothermal wells.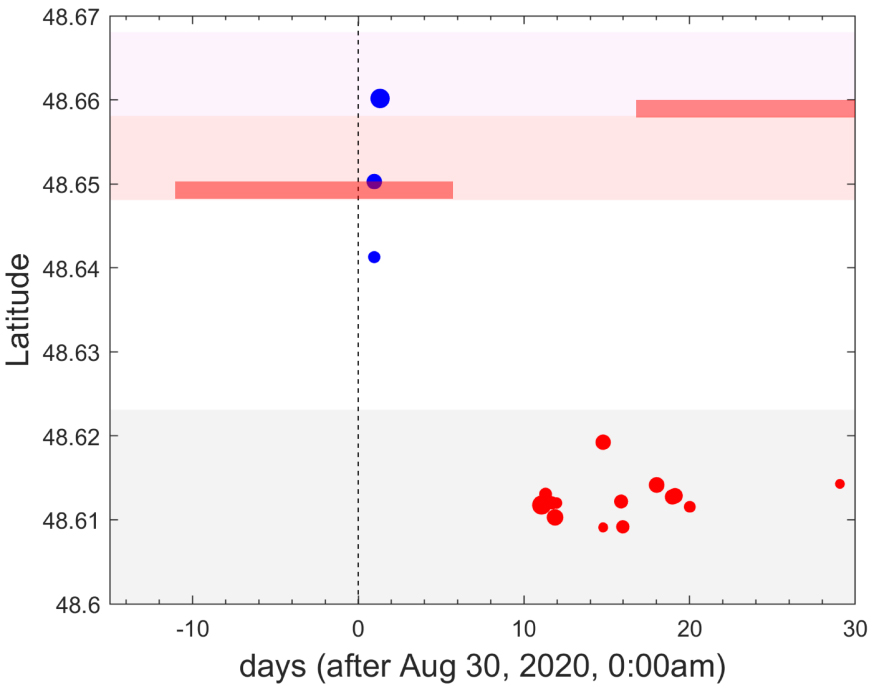
5.3. Focal mechanisms
The focal mechanisms of the main events were estimated from the polarities of the first P-wave arrivals with “fpfit” software [Reasenberg and Oppenheimer 1985]. The two main events of the southern cluster on November 12 and 13, 2019, present very similar mechanisms: left-lateral shear along a N015 ± 3° E-trending nodal plane (Figure 15). The orientation of one of the nodal planes is very consistent with the event alignments deduced from the refined catalog using template matching and HypoDD (Figure 11) and the N010° E-trending fault proposed in the GEORG geological model (Figure 7). The dip from this preferred nodal plane (85 ± 8° NW) is close to vertical and within the error bars of the dip of the hypocenter alignment (∼76° W) and the fault structure in the GEORG geological model (also ∼76° W).
Focal mechanisms of the two main events in both clusters obtained from P-polarities.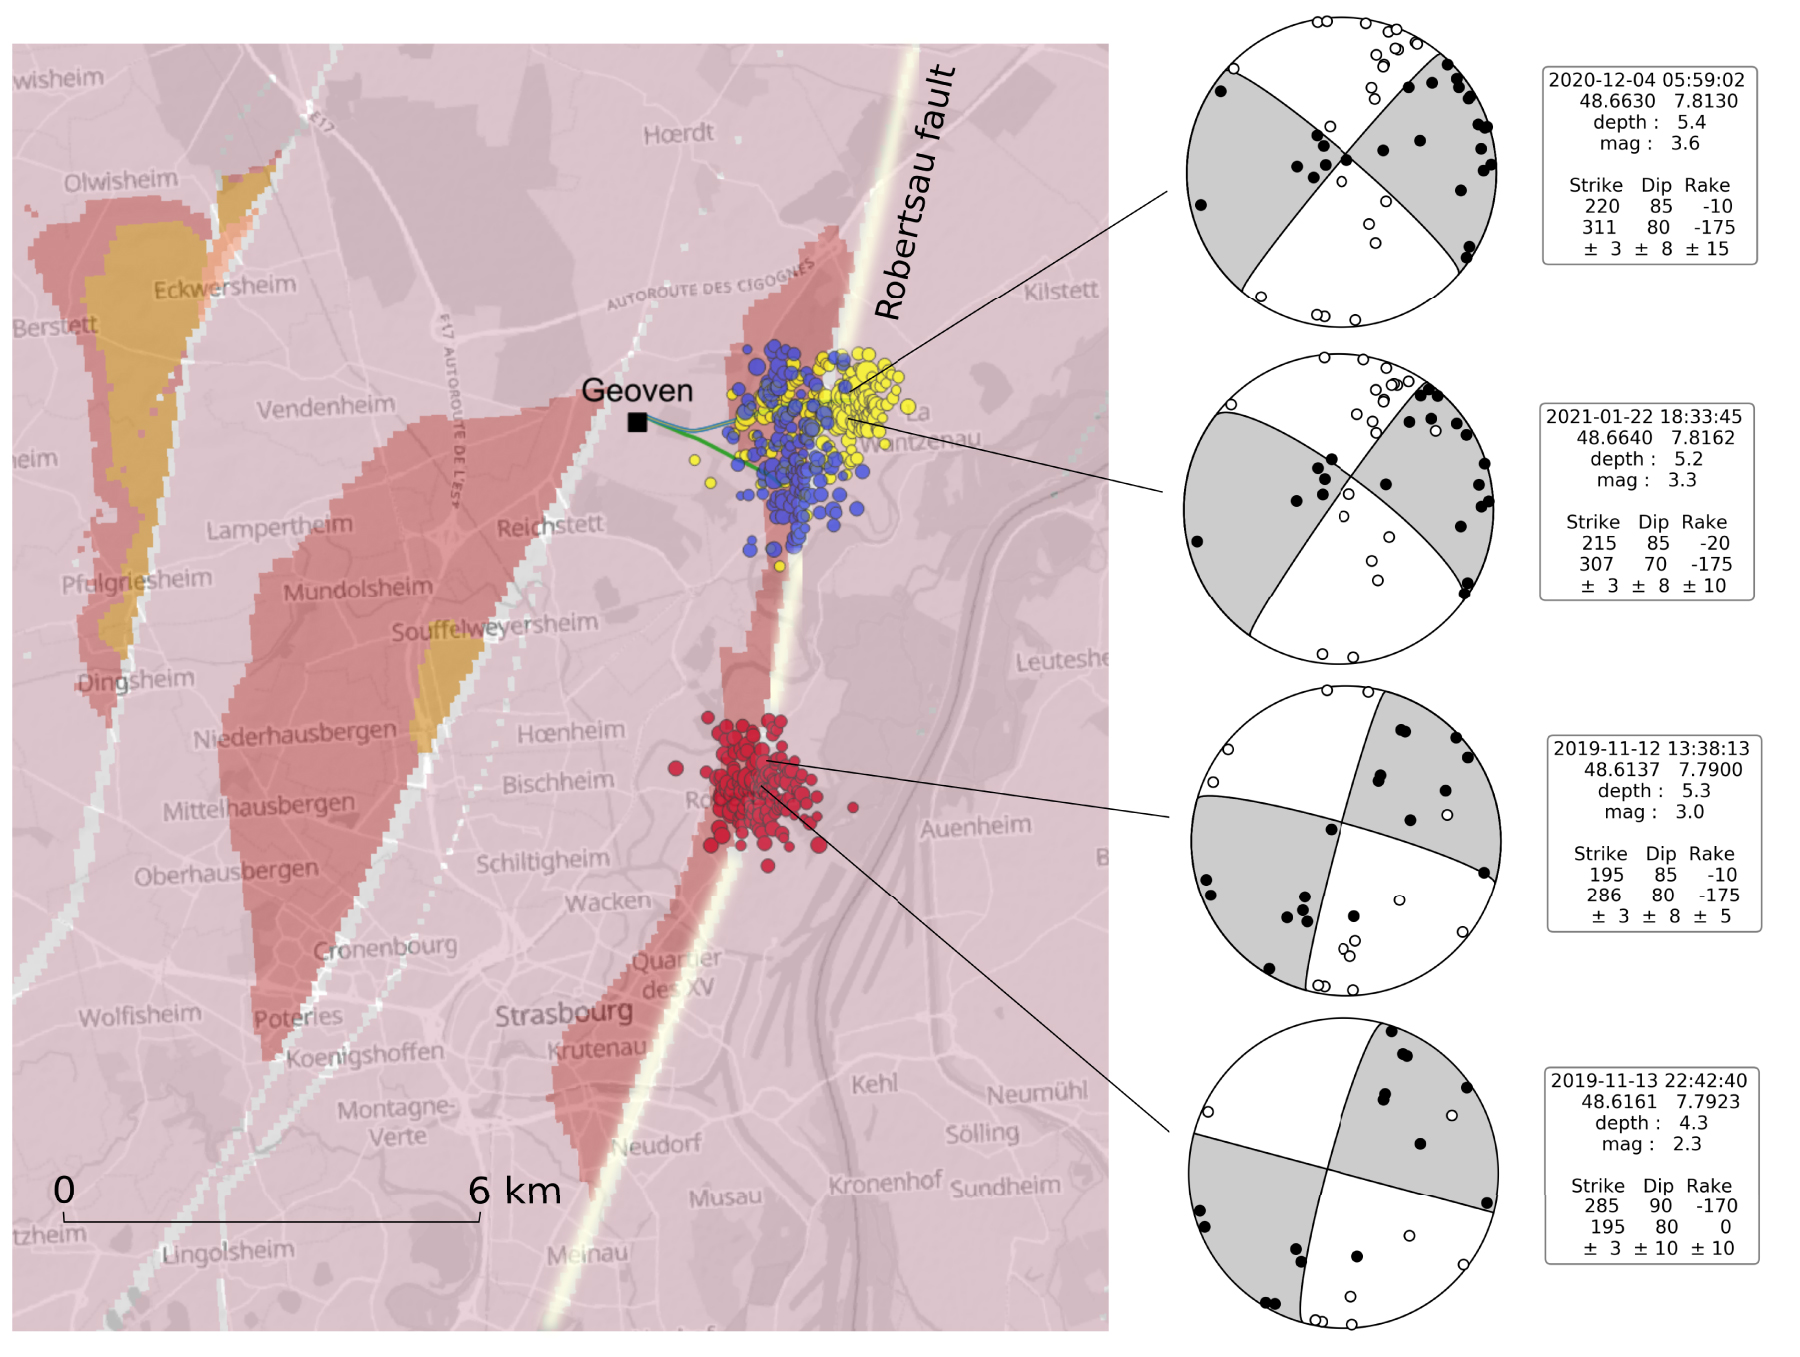
The focal mechanisms of the two main events of the northern cluster shown in Figure 15 are representative of all the felt earthquakes at the termination of the GT2 well. They are also mostly left-lateral but with a slightly different strike of the nodal planes, respectively, N040° E and N310° E. The latter appears to be consistent with the general trend of the seismic cloud in the zone 4 of Figure 10 in which they occurred.
5.4. Regional stress field and fault mechanics
Knowing the geometry of the fault zone and the direction of sliding, it becomes possible to study the coherence between the regional stress field and the stability of the fault in order to understand the origin of the earthquakes (Figure 16). As a first attempt, we consider that an estimate of the stress field in the vicinity of the fault can be deduced from knowledge of the stress field measured at the Soultz-sous-forêts site [Cornet et al. 2007]. This site is located about 40 km north of the Geoven site, but there is, in fact, no available measurement in a closer vicinity, where the stress field has been accurately measured. If we assumed that this measurement does not vary spatially to the first order, it is then possible to characterize the stress field at the Geoven site by the following relationships, assuming that the entire stratigraphic column has a constant density close to 𝜌 = 2550 kg∕m3 [Cornet et al. 2007]:
| (1a) |
| (1b) |
| (1c) |
3D structural representation of the Robertsau fault and the regional stress field. Both background images are extracted from GEORG database (http://maps.geopotenziale.eu); at the back is the geological cross-section at the Geoven wells, at the bottom is the geological map at 4000 m depth.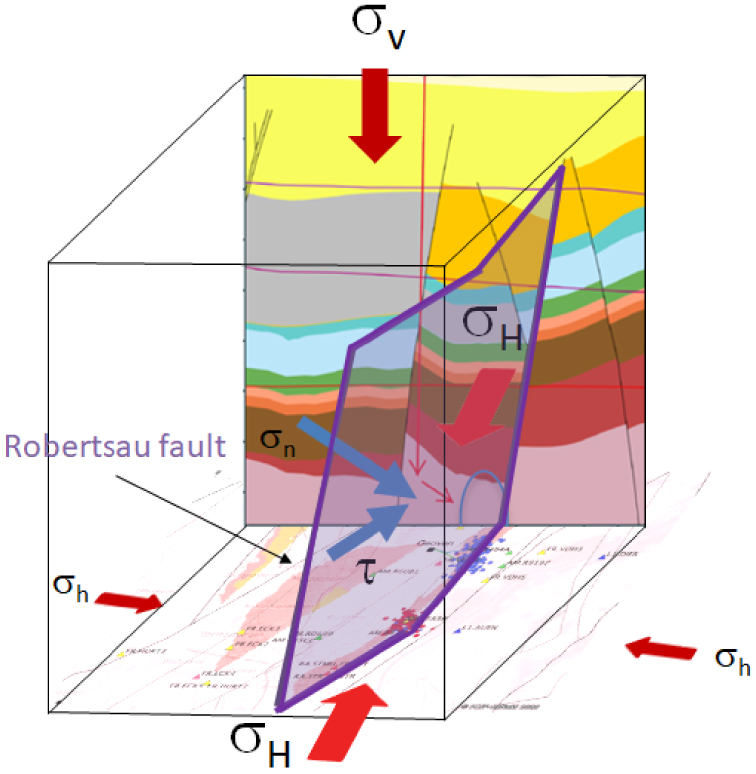
Assuming such a regional stress field and the orientation of the Robertsau fault, we can estimate the normal (𝜎n) and shear (𝜏) stresses applied to the fault in the nucleation zone of the main earthquakes. In the case of the southern cluster, the normal to the sliding plane is oriented N105° E with an inclination of 85° W. Assuming that the depth of the fault plane is the depth of the hypocenter of the M3.0 earthquake of November 12, 2019, that is, 5620 m, we estimate the normal and tangential stress components at the hypocenter to be: 𝜎n = 91 MPa and |𝜏| = 29 MPa (Figure 17).
Depth profile of the stresses exerted on the N195°-trending fault plane assuming that the regional stress field is consistent with the measurements made at Soultz-sous-Forêts where the maximum horizontal stress is oriented N170 [Cornet et al. 2007]. The normal stress and the shear stress along the sliding direction are represented in blue and red, respectively. The Coulomb stress is represented in magenta, assuming an hydrostatic pressure, with no cohesion and a coefficient of friction 𝜇 = 0.8. The circles indicate the value of the stresses at the depth of the Ml3.0 earthquake of November 12, 2019.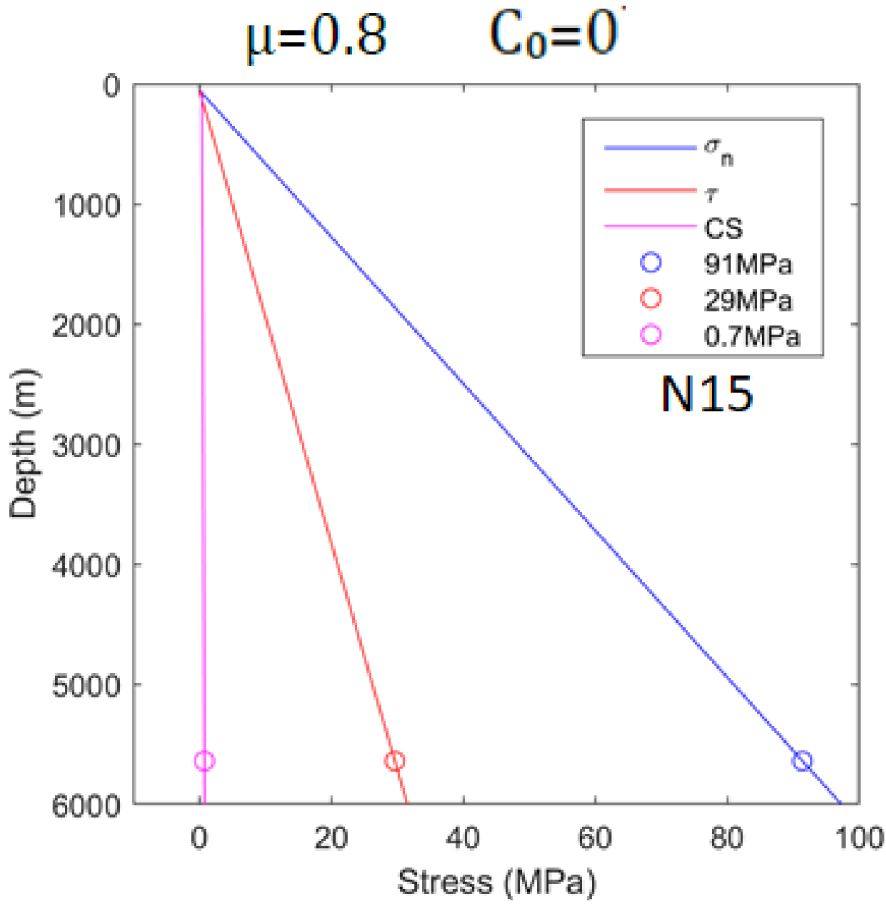
If we now assume that the stability of the fault is described by a Coulomb criterion with a cohesion C0 : |𝜏|⩽𝜇(𝜎n − P0) + C0 with P0, the pore pressure, and 𝜇, the friction coefficient, we can see whether the fault is in stable condition [Shapiro 2015, Cornet 2016] by calculating the sign of the Coulomb stress: CS = |𝜏|−𝜇 (𝜎n − P0) − C0. When CS is negative, the fault is stable. On the contrary if CS is positive, the fault is unstable. Assuming that the pore pressure P0 at this depth is equal to the weight of a column of water (55 MPa), also assuming that the friction coefficient is 𝜇 = 0.8 (Byerlee criterion for a normal stress lower than 200 MPa), and that the cohesion is null (C0 = 0), we obtain that the equilibrium conditions resulting from the Coulomb criterion are CS = +0.7 MPa, that is, CS > 0, that is, an unstable fault (Figure 17). The value of the Coulomb stress (CS) is actually weakly positive showing that the fault is marginally unstable. However, if we assume a cohesion of C0 = 1 MPa as estimated at Soultz under comparable conditions, we obtain CS = −0.3 MPa at 5620 m, that is, a marginally stable fault. This estimate also shows that the fault is very sensitive to fluid overpressure. Indeed, in these conditions, an overpressure of a few bars (0.3 MPa = 3 bars) can be enough to destabilize the fault.
It can be noted that if the coefficient decreases from 0.8 to 0.6, the Coulomb stress becomes more positive and higher than the cohesion value, so the fault is more destabilized (CS > 0). It is interesting to see that a decrease of the friction coefficient of this order of magnitude has been shown experimentally during slow sliding with healing processes and fluid injection [Marone 1998, Scholz 2019]. Thus, if an aseismic slow slip is initiated on the fault, it will be more and more unstable. It can also be observed that the Coulomb stress increases with depth regardless of the friction coefficient. This tends to show that the deeper the wells are, the more unstable the fault is. It is also interesting to see that the observed N195° E azimuth of the fault corresponds to the most unstable situation (for 𝜇 = 0.8) since the Coulomb stress is maximum and positive for that specific direction and zero cohesion.
This simple calculation clearly shows that the Robertsau fault system is very close to instability. Thus, it is likely that a very slight disturbance, either of the interstitial pressure or of the regional stress field can destabilize the existing fault system, particularly in areas with very weak cohesion. A possible scenario for the remote triggering of the southern cluster could be due to hydrogeological reasons, the cohesion in that area is very weak, which makes this zone particularly sensitive to any disturbance of even very low pressure resulting from remote hydraulic tests (a few bars). It also seems that the intermediate regions between the southern and northern clusters are either more cohesive or less favorably oriented, which stabilizes them and therefore explains the lack of earthquakes between the two clusters. According to the proposed mechanism, hydraulic or chemical stimulations of these quasi-unstable domains, due to the regional tectonic loading, are and will be likely to generate seismicity.
The events in the southern cluster in September 2020, occurring after some activity in the region of the well GT1 (Figure 4), could be a second episode of remote triggering following the same scenario.
5.5. Event classification
In order to classify the seismicity in the neighborhood of the Geoven site during 2018 and 2021 as induced or not, we checked the arguments proposed by Davis and Frohlich [1993] (see Figure 18). From the observations detailed previously, we see that all the criteria for “clearly induced earthquakes” are fulfilled both for the northern and southern clusters. For the southern cluster, five criteria were available in the minutes after the main MLv 3.0 event, and a more detailed analysis has been needed in the weeks after to get an accurate knowledge of the “geological structures that may channel flow to sites of earthquakes” (see Figure 7) or for the geomechanical modeling of the effect of “changes in fluid pressure at hypocentral locations” (see Figure 17).
The seven operational criteria for classifying induced or not induced earthquakes [after Davis and Frohlich, 1993]. Criteria 1–4 and 6 were fulfilled rapidly after the occurrences of the main earthquakes. Criteria 5 and 7 were answered after extended investigations following the November 12, 2019 earthquake.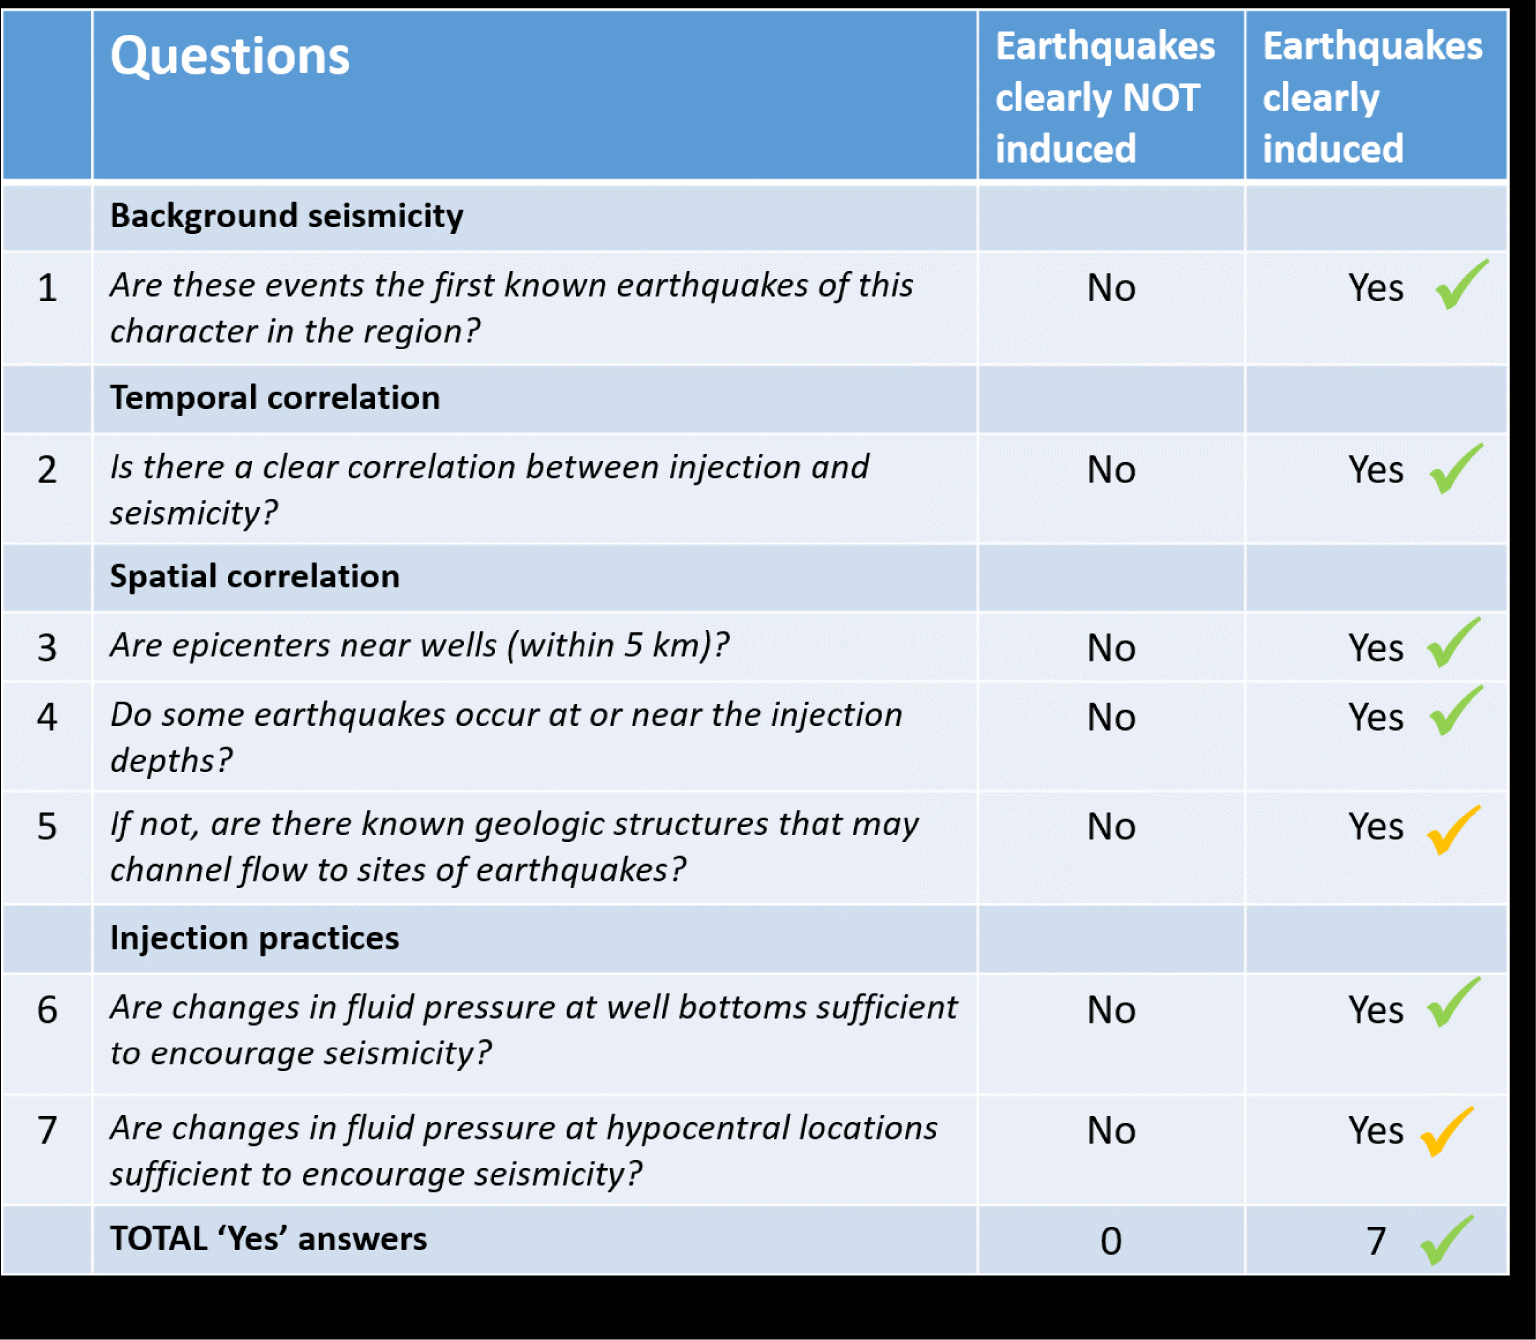
6. Discussion
A permanent GNSS station has been installed at the Geoven site since July 2016. The time series is shown in Figure S1. The motion is very linear, consistent with the motion of the Eurasian plate, until the end of 2019. From this date onwards, very slight changes in velocity are observed on the NS component. Initially, the station’s displacement velocity increases, then becomes almost zero, before increasing again to be greater than the Eurasian velocity. These abnormal displacements do not correspond to coseismic movements, linked to the largest events (M > 3.0), which would remain of very low amplitude (less than 1 mm). These displacements spread over several weeks, probably correspond to slow slip along faults at depth. In March 2021, it has not yet recovered its original velocity, that of the Eurasian plate. Note that the two acceleration phases correspond to the seismic periods of late 2019 and late 2020. Further investigations are necessary for establishing a causal link between both observations.
A natural earthquake is a seismic event that is independent of any human activity. An induced earthquake is linked to an anthropogenic disturbance: strictly speaking, induced seismicity stops when the disturbance stops, whereas triggered seismicity continues after this stop [Dahm et al. 2013, Grünthal 2014].
The process of interaction between the northern and southern clusters favor the interpretation of induced seismicity. Indeed, industrial activity in the Geoven wells has generated seismicity induced by fluid injection, that is, the northern seismic cluster. This phenomenon has been well identified since the 1960’s [Healy et al. 1968] and widely discussed in the literature [Ellsworth 2013, Zang et al. 2014, Cornet 2016, Foulger et al. 2018]. The question that this study aims to address is whether the southern cluster, 4.6 km distant on the same fault zone, at the same depth, without prior seismicity, and initiated during hydraulic tests at the Geoven site, can be a triggered seismicity or not.
Seismicity induced by fluid injection can occur at a great distance (>10 km) from the injection wells, under favorable conditions of injection in sedimentary cover, or injection in a highly permeable basement fault system [Goebel and Brodsky 2018]. In their survey, Goebel and Brodsky [2018] presented two families of behaviors. The first one is the classical view. The seismicity is confined within a limited area around the injection well (a few hundred meters), that is, the “short range” behavior. This is the case of the northern cluster and has already been observed in the Rhine Graben, in the geothermal Soultz site (September 1993 and October 1993). However, a second family exists, where induced earthquakes can be triggered at a very large distance from the injection well, that is, more than 10 km from the injection point. This has been also observed at several other geothermal sites in the Rhine Graben: the Landau or Basel site. The triggering of seismicity in the southern cluster at a distance of 4.6 km by the injection of fluid on the Geoven site is therefore fully compatible with this “long range” behavior.
To explain the time delay of 10 days for the triggering of the southern cluster after fluid injection in the GT1 well, several models could be proposed. One of them is the propagation of a fluid overpressure from the wells to the south along the Robertsau fault. In the case of a simple model of fluid diffusion along a quasi-1D channel at constant depth, the distance l ≈ 4600 m and the time delay 𝜏 ≈ 8.6 × 10⁵ s, allow to assess the fluid diffusivity of the fault [Carlsaw and Jaeger 1959, Turcotte and Schubert 2002]: Df ≈ l2∕𝜏 ≈ 25 m∕s2. Such a value of the hydraulic diffusivity is larger than that deduced from seismicity migration at Soultz-sous-Forêts: Df in the range [0.05–0.5] m2∕s [Shapiro et al. 1999] but is consistent with assessments of hydraulic diffusivity along faults [102–104] m2∕s [Noir et al. 1997, Antonioli et al. 2005, Malagnini et al. 2012, Dempsey and Riffault 2019] or in situ experiments of fluid induced reactivation: [10−9–103] m2∕s [Guglielmi et al. 2015]. A time delay of a few days between the end of the injection and a major induced earthquake was observed on several occasions. The regional case of Rittershoffen where seismicity was observed four days after the shut-in operations [Lengliné et al. 2017] and that of Pohang in South Korea (M5.5 triggered two months after the cessation of stimulation) [Ellsworth et al. 2019], are particularly illustrative. But many other cases are documented [Cuenot et al. 2008, Deichmann and Giardini 2009, Diehl et al. 2017].
7. Conclusion
During the lifetime of the Geoven project (Fonroche Géothermie company) at Vendenheim in the northern suburb of Strasbourg, two clusters of seismicity have been evidenced in the vicinity of the deep geothermal wells since 2018. No seismic activity in the close area (<5 km) has been recorded for the past 40 years before. The southern seismic cluster started in November 2019. The Mlv 3.0 event on November 12, 2019, was part of this four-month-long seismic swarm (southern cluster) that includes more than 115 events in the BCSF-Rénass catalog and more than 600 events from the template matching catalog. This cluster is located 4.6 km south of the geothermal wells and was initiated five days before the end of the first series of hydraulic tests at the geothermal site (Geoven). The southern cluster happened along the Robertsau fault (N015° E) which is a major structural link to the exploited geothermal reservoir at the bottom of the geothermal wells. The time delay in triggering the southern cluster after fluid injection in the GT1 well is estimated to be about 10 days. Such a delay would correspond to an effective hydraulic diffusivity of about 20 m2∕s, if the triggering mechanism is a hydraulic pressure diffusion along the fault. The northern seismic cluster is located in the close vicinity of the geothermal wells, where induced seismicity has been recorded from March 13, 2018. It includes a series of 10 felt earthquakes of magnitude (MLv) larger than 2.0 that happened on the fault zone intersected by the injection well. Two of them were of magnitude larger than 3.0. The first one of magnitude 3.6, on December 4, 2020, during the hydraulic test operation, led to the decision of definite closure of the site by the authorities. The second one of magnitude 3.3 on January 21, 2021, occurred three weeks after shut-in emphasizing delayed effects of pore pressure relaxation.
HypoDD relocations show that the fault zone includes a set of conjugated faults. In the southern cluster, the two main shocks are on the same fault segment oriented N015° E. Based on a Coulomb failure criterion, this fault is mechanically unstable in the regional field if no cohesion exists on the fault. The remote location of the swarm is explained by its location at the kink of the fault, where a more unstable situation (N25) exists. All evidences are consistent with a triggering of the swarm by geothermal activities. In the northern cluster, most of the felt earthquakes (including the two largest events) are located on the same structure oriented along the N320° E direction, which is a conjugated direction of the fault zone (N015° E), and similarly unstable with respect to the regional stress field.
Acknowledgments
The authors are grateful to Christophe Sira, Antoine Schlupp, Marc Schaming, Jérôme Van der Woerd, Pascal Bernard, Jean-Robert Grasso, Bertrand Delouis, Florent Brenguier, Philippe Gueguen, Stéphane Guillot, Nicolas Arnaud, Christophe Maisons, Thomas Kohl and Beata Orlecka-Sikora for their fruitful discussions. This manuscript is dedicated to the memory of François Cornet who suddenly passed away on May 23, 2020. This work has been performed under the framework of the Laboratory of Excellence LABEX ANR-11-LABX-0050-G-EAU-THERMIE-PROFONDE and the Interdisciplinary Thematic Institute GeoT, as part of the ITI 2021–2028 program of the University of Strasbourg, CNRS, and Inserm, supported by IdEx Unistra (ANR-10-IDEX-0002), and by SFRI-STRAT’US project (ANR ANR-20-SFRI-001) under the framework of the French Investments for the Future Program.