


 CC-BY 4.0
1. Introduction
Southeastern France is a region of moderate but shallow seismic activity, sometimes affected by locally devastating earthquakes. This shallow seismic activity, associated with local destructions, was recently attested by the realisation of the Le Teil earthquake, a shallow—1–2 km depth—Mw 4.9 event, which was largely felt within a 200 km radius. This earthquake ruptured the ground surface and damaged 800 buildings at close vicinity from the rupture [Ritz et al. 2020; Cornou et al. 2021; Causse et al. 2021; Vallage et al. 2021].
The realisation of such shallow earthquakes promote the acquisition of rich historical macroseismic catalogues, when occurring in regions with meaningful population densities, which is the case in most of Southeastern France. Among the many events described in the macroseismic catalogue are several earthquake swarms, lasting days or months, suspected to develop at depths significantly shallower than the average focal depth in France [e.g. Rothé 1936; Rigo et al. 2008; Bollinger et al. 2010; Larroque et al. 2021]. In 2002–2003, one of these local swarms developed in the Tricastin, a region with industrial complexes and nuclear installations [e.g. Clément et al. 2004], about 20 km to the southeast of the 2019 Le Teil rupture (Figures 1 and 2). This swarm was monitored by a dedicated local network that recorded 130 events of magnitude ranging from ML −1.3 to 1.7 [Thouvenot et al. 2009] and provided good constraints on the local events depths. These depths appeared to be restricted within the first kilometre, half of the events being even located in the first 300 m. Since the 16th century, several other seismic swarms developed in the close vicinity of this recent episode of seismicity, damaging local villages and resulting in temporary migrations of the local population. Hundreds of seismic events are thus mentioned in local chronicles, many documented by the Bureau Central Seismologique [e.g. Rothé 1936, 1939a], which instrumented also two Mainka seismological stations in Les Granges-Gontardes at short distance from the 1934–1936 swarm. About 150 events are documented and appraised in the French macroseismic database [SisFrance 2021]. The most important crises in number of events occurred in 1772–1773, 1873, and 1933–1936. Many of these events have been described as accompanied by noise of cannonade, explosion, or collapse with a strong attenuation of the shaking at short distance, also suggesting shallow depths as well as other similarities with the recent crisis.
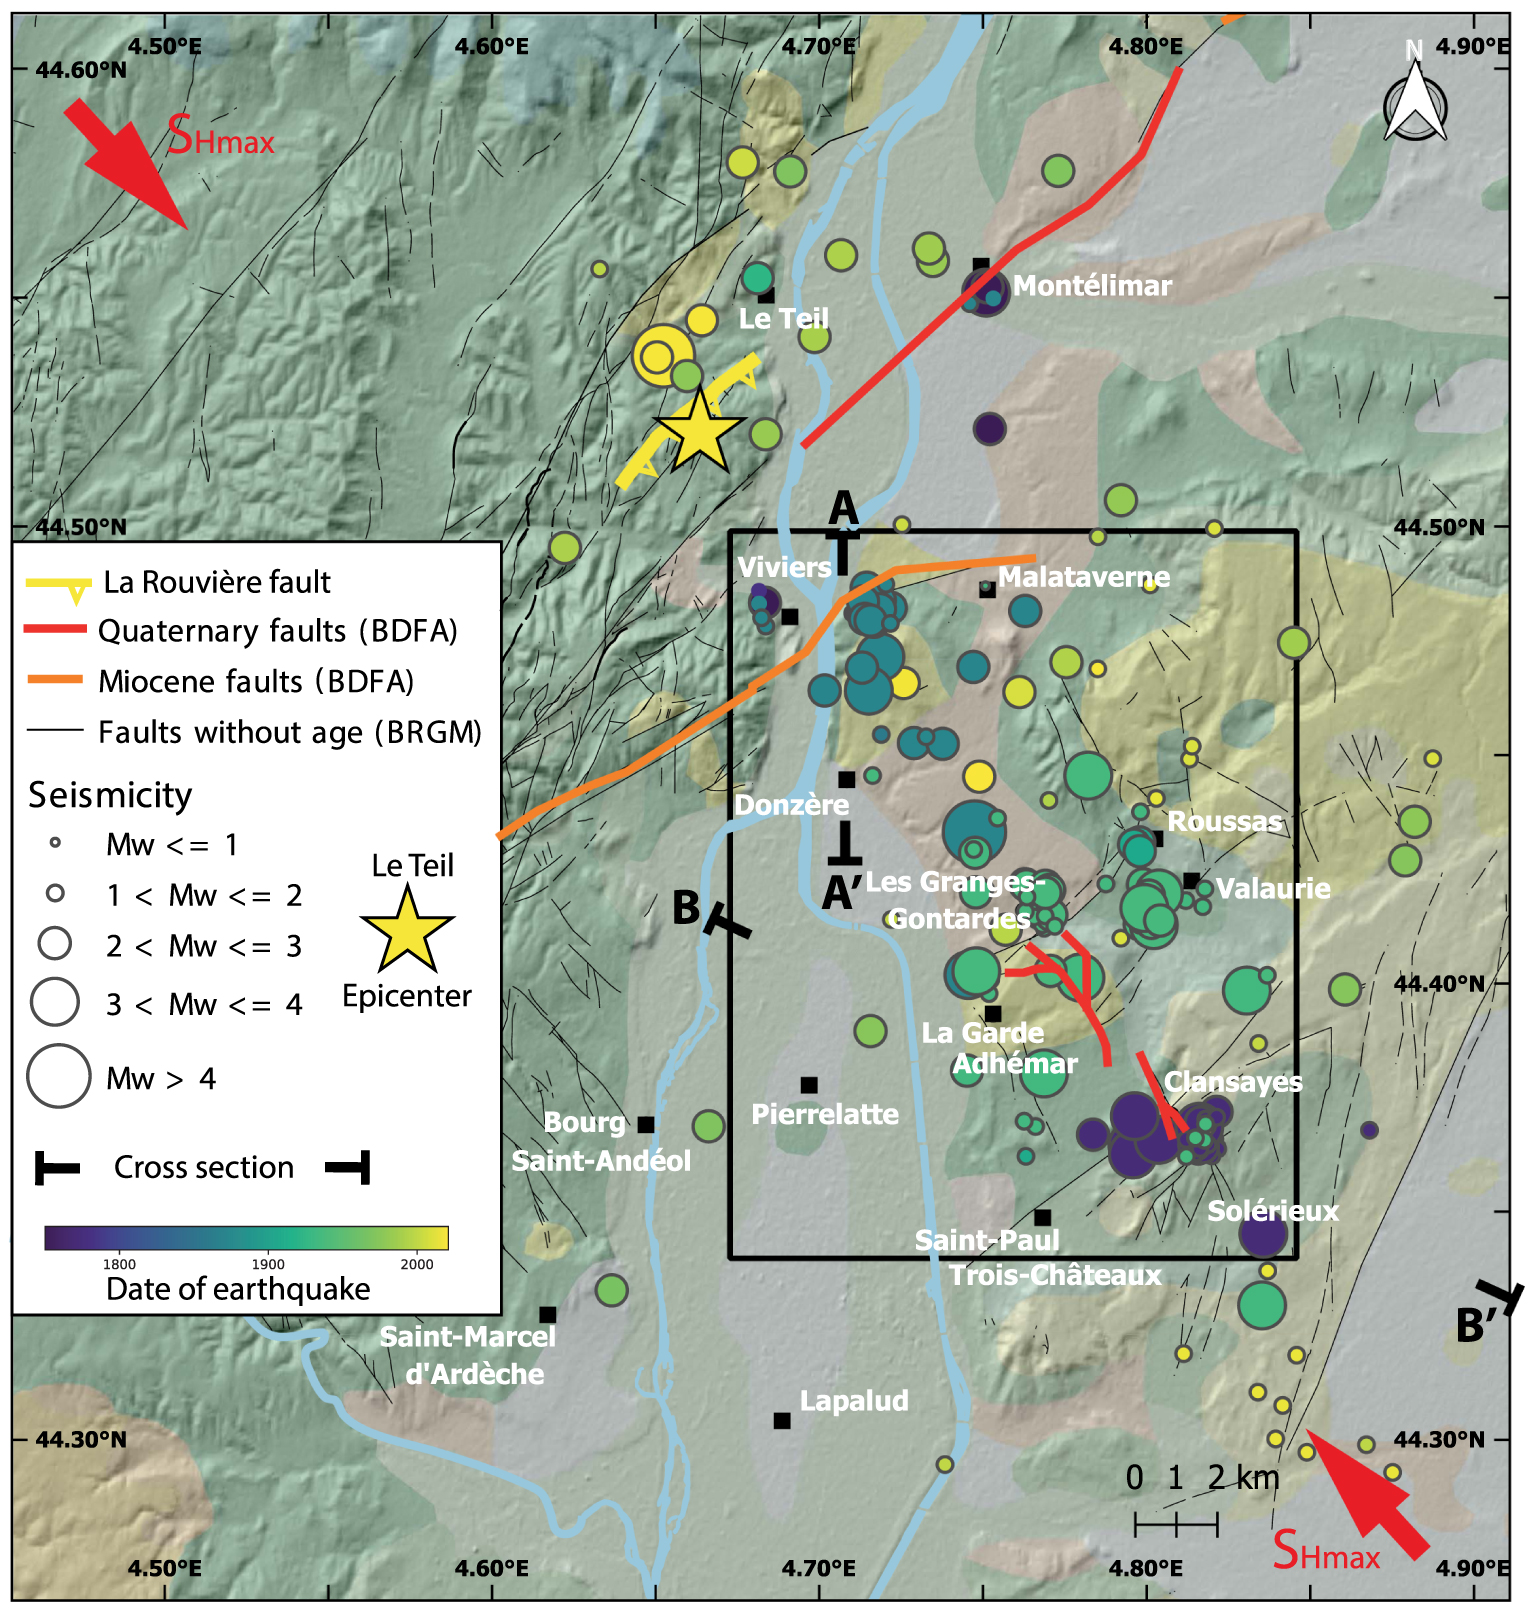
Simplified geological and seismicity map of the Tricastin region. Historical and instrumental seismicity (circles, coloured according to their date of occurrence) from FCAT17 catalogue [Manchuel et al. 2018] complemented with the LDG catalogue [Duverger et al. 2021]. Many other historical events were felt by the population but they are not recorded in the database because no epicentre were determined. See Figure 2 for further information about the location of every swarm compared to the geological structures, as well as the palaeocourse of the Rhône River and tributaries. Geology and faults in black are from the BRGM 1:1000,000 geological map and field observations. Faults in red and orange are from the Base de Données de Failles potentiellement Actives (BDFA), the Database of Potentially Active Faults [Jomard et al. 2017]. Cross-sections AA′ and BB′ are reported on Figure 6. Yellow star and thick line respectively for Le Teil earthquake epicentre (from seismological records and InSAR) and fault surface rupture. Red arrows represent the orientation of the Maximum horizontal stress (SHMax) from Heidbach et al. [2018]. Masquer
Simplified geological and seismicity map of the Tricastin region. Historical and instrumental seismicity (circles, coloured according to their date of occurrence) from FCAT17 catalogue [Manchuel et al. 2018] complemented with the LDG catalogue [Duverger et al. 2021]. Many other historical ... Lire la suite

Close-up view on the geology of the northeastern part of the Tricastin region showing up: two major anticlinal structures in red arrows (the Donzère fold to the North, and the Echavarelles fold to the South); the position of the Messinian palaeocanyons in thick blue dashed lines; the depth of the roof of the Urgonian in drill hole in red hexagons. Thick red dashed ellipses represent the approximate location of the seismic swarms derived from the macroseismic documentations. The black stars correspond to the locations where the local inhabitants thought the noises were coming from. Masquer
Close-up view on the geology of the northeastern part of the Tricastin region showing up: two major anticlinal structures in red arrows (the Donzère fold to the North, and the Echavarelles fold to the South); the position of the Messinian ... Lire la suite
In order to test these similarities, we first compile the historical and instrumental seismic catalogue of events. We then discuss the spatial and time structure of the main crisis. We test whether the locations and depths of the largest historical events could be similar to the one determined for the 2002–2003 instrumental events. We finally discuss a large number of local swarm generation models, involving and testing their consistence with the observations available.
2. Seismic catalogue
2.1. Seismic data origin
Several primary sources mention the seismic activity of the Tricastin region, including books [e.g. Faujas De Saint-Fond 1781], correspondences [e.g. M. de Genton, 1773 in Faujas De Saint-Fond 1781 Mlle Josephine James, 1873 in Boisse 1936], and local newspapers (e.g. La Gazette de France, Journal de Montélimar), as well as the Bureau Central Sismologique Français (BCSF) publications [e.g. Rothé 1939a,b]. Most of these observations are compiled in SisFrance, the most exhaustive macroseismic database of historical earthquakes felt in France [Lambert et al. 1997; Scotti et al. 2004; SisFrance 2021]. Within this catalogue, the macroseismic interpretations of the effects of about 150 local Tricastin seismic events felt at 153 places are reported. Among the 799 observations listed, 58% are translated into MSK64 intensities (1964 intensity scale of Medvedev–Sponheuer and Karnik, in [Medvedev et al. 1965]). However, macroseismic epicentres are associated within the database to only 20% of these events (Figure 1) given the paucity of the observations available for most events. The hypocentral location and moment magnitude (Mw) of the best documented historical events have been studied in Traversa et al. [2018], Baumont et al. [2018], and concatenated in Manchuel et al. [2018], a catalogue we complemented by more recent instrumental observations [Duverger et al. 2021].
In addition, another interesting source of information comes from 15 stations local seismic network that was temporarily deployed in 2002–2003 during a seismic crisis felt by the local inhabitants in the region between Valaurie and Saint-Paul-Trois-Châteaux (Figure 1). The density of the network allowed recording events with magnitudes as low as −1.3, while benefiting from good constraints on the location and depth of the seismic events [Thouvenot et al. 2009]. The capacities of this local network cannot be challenged by the national network. Indeed, the completeness magnitude of the national catalogue of seismicity fall between ML = 3.5 in the 1960–1970s and around ML = 2.0 at present day [Duverger et al. 2021]. Hypocentral locations of the earthquakes remain associated with uncertainties typically reaching a few kilometres.
Overall, about 860 events have been listed in all the different catalogues and available sources.
2.2. Chronological description of the seismic events
The first events reported in the Tricastin region occurred in 1549 and were felt in the area of Montélimar and Châteauneuf-du-Rhône. Some isolated events were also mentioned in December 1604 in Viviers and January 1610 in Montélimar [Boisse 1936]. However, the first well-documented period of seismic activity developed from June 1772 to December 1773, near Clansayes [Revol 1773; Faujas De Saint-Fond 1781; Perrey 1845; Boisse 1936; Rothé 1936]. Among more than 150 events mentioned in the primary sources, only 27 strongest events are reported in SisFrance for this period, among them six have been assigned an intensity and three a macroseismic epicentre. The most important shocks (07/02/1772, 18/01/1773, and 23/01/1773) caused fractures in the walls and falls of stones from the oldest buildings. On 23 January 1773, the strongest event, with an epicentral intensity of VII, [SisFrance 2021], destroyed a part of the church tower of Clansayes [Faujas De Saint-Fond 1781]. Moreover, during the 19 months of seismic activity, several underground noises were reported, described as canon explosions and slight shaking were felt almost every day, especially in June and November 1772 and January and February 1773. From February to December 1773, the early testimonies seem consistent with event epicentres migrating towards Saint-Raphaël (chapel)—now in the commune of Solérieux—southeast of Clansayes [Revol 1773 in Boisse 1936; Faujas De Saint-Fond 1781] (Figures 1 and 2). In December 1773, shaking stopped in Clansayes but remained important in Saint-Raphaël and Montségur-sur-Luzon until it totally stopped at the end of December [M. de Genton, 1773 in Faujas De Saint-Fond 1781].
Some isolated events were then reported in Viviers in 1782, and in Tulette in 1790 [Boisse 1936], in Donzère on 6/12/1859 [Perrey 1862] and in La Garde-Adhémar on 20/06/1872 [Rothé 1936]. Other shakings were felt during summer 1872, forcing the inhabitants from La Garde-Adhémar to spend the nights outside their houses [Abbé Heurteloup, in Rothé 1936].
Another period of dense seismic activity developed from 14/07/1873 to 04/09/1873 with about 40 events among which 24 are reported in SisFrance database, in the area of Châteauneuf-du-Rhône. During this period, most of the houses in Châteauneuf-du-Rhône were affected by fractures in their walls, and several damages were reported in the villages of Donzère, Valaurie, La Garde-Adhémar. The strongest events reported occurred on 19 July and 8 August, with epicentral intensities of VII [SisFrance 2021; associated respectively to an Mw of 3.8 ± 0.4 and 4.1 ± 0.4 in Manchuel et al. 2018] and were largely felt in the surrounding localities (Figure 3). The 08/08/1873 was even felt in Clermont-Ferrand, more than 200 km to the northwest, asserting its significant magnitude. Some people also testified that the “Montagne du Navon”, south of Châteauneuf-du-Rhône, cracked and that the spring disappeared to come out again far away from their original outlet [Riondel 1873]. Occasional underground noises were heard in the vicinity of Rac and Châteauneuf-du-Rhône [Riondel 1873].

Maximum intensities observed in the Tricastin villages for (a) 1772–1773; (b) 1873–1875 or 1876; (c) 1907–1910 and (d) 1934–1936 crises. Intensities are from the SisFrance database and interpreted in MSK64 scale. Yellow circles for intensity I correspond to events that were felt but for which no intensities were assessed. White circles for intensities 0 correspond to non-felt events and are only available for the 1933–1936 crises for which macroseismic forms were sent to the local administrations by the Bureau Central Sismologique Francais (BCSF).
Some events were then reported in Châteauneuf-du-Rhône in 1874, on 25 February [Le Gaulois 1874], 22 March, 2 October, and 28 January 1875 [J. James in Boisse 1936]. Another event is reported in the same area in 1876 [Boisse 1936]. Isolated events occurred on 27 January 1897 in La Garde-Adhémar and Les Granges-Gontardes. On 26 December 1907, 7 and 10 January 1908, several events occurred in Roussas, associated with canon-shot-like noises [Reboul 1909]. In October 1910, shakings were felt in Saint-Paul-Trois-Châteaux and underground explosions heard in Les Granges-Gontardes [Boisse 1936].
From October 1933 to December 1934, the local inhabitants noticed the generation of another seismic swarm. The seismicity reached a peak of activity in May 1934. From 10 to 16 May, between 100 and 200 seismic events were felt in Valaurie and Clansayes, respectively, [Rothé 1936] and during the night of 11–12 May, shocks were reported to be felt every 10 min in La Garde-Adhémar. As the shakings were disturbing, causing some damages, people had to leave their houses and live under tents for a few weeks. Altogether, 39 seismic events of this swarm were sufficiently documented to be reported in SisFrance database. The most important events of this period reached epicentral intensities of VII and VI on 12 and 16 May 1934, respectively. These events are now respectively associated with magnitudes Mw of 3.3 ± 0.5 and 3.5 ± 0.4 in Manchuel et al. [2018].
After 10 months of quiescence from December 1934, the seismic activity started again on 6 October 1935 till 2 August 1936. 32 events are listed in SisFrance database for this period. The event of 13 February 1936 reached an epicentral intensity of VI [SisFrance 2021, an event now associated with a magnitude Mw of 3.5 ± 0.4 Manchuel et al. 2018]. During this period, similarly to 1933–1934, underground noises of explosion, cannonades or blast were reported in the villages of Les Granges-Gontardes, La Garde-Adhémar, and Valaurie [Boisse 1934; Rothé 1936, 1939a]. In total, more than 400 shocks were reported during the period 1933–1936, a fraction of which contributed to the macroseismic database given their poor documentation.
A few of the most important events of the 1933–1936 period were recorded in several seismological observatories (Clermont-Ferrand and Strasbourg in France, Neuchatel and Zurich in Switzerland). Moreover, two horizontal Mainka-SOM seismographs were installed in Les Granges-Gontardes by the BCSF in July 1934 (Figure 4). 15 events recorded on the Mainka seismographs are listed by Rothé [1939a,b]. The most important instrumental event reported occurred on 4 May 1936 at 22h32, and generated a ground acceleration of 0.1–0.2 m⋅s−2 measured at the station (for period 0.7–0.5 s) for an assessed intensity of VI–VII and a magnitude Mw of 3.3 ± 0.8 [Manchuel et al. 2018].
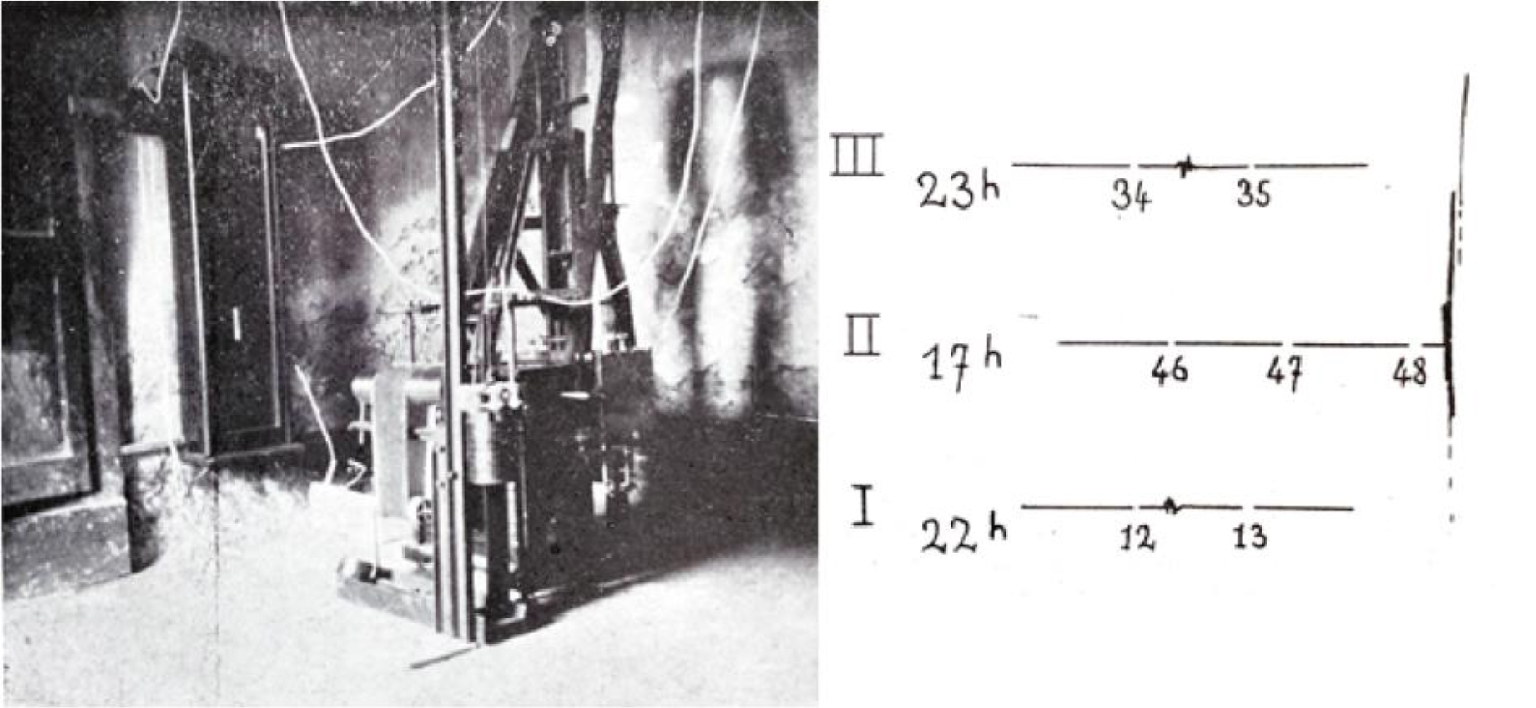
Left: Mainka-SOM seismograph at Les Granges-Gontardes. Right: example of seismic signals recorded at the station in 1934.
On 29 April 1938, an event was felt in the area of La Garde-Adhémar and Les Granges-Gontardes [Rothé 1941] with an epicentral intensity of IV–V [SisFrance 2021].
Since 1962, 25 epicentres in the Tricastin area have been recorded in the national instrumental catalogue (Figure 1). Only three of the instrumental events are listed in the SisFrance database: two events on 10/05/1974 and one event on 19/02/1975. The two events on 10/05/1974 are listed as one event located in Pierrelatte in SisFrance while there are two well-differentiated events, with an interval of 37 s, in the catalogue of Rothé. The event on 19/02/1975 is one of the biggest events recorded in the Tricastin region with a magnitude ML 3.2.
At the beginning of December 2002, a local seismic activity developed in the vicinity of Clansayes. The crisis started with noises described as explosions that revived memories of noises heard in the previous crisis, particularly the 1933–1936 swarm that some inhabitants lived through. A first temporary velocimetric station installed at Clansayes confirmed the seismic origin of the noise. A complementary 15 stations temporary local seismic network was then deployed, from 10 January to 3 April 2003 and recorded 130 events of magnitude ranging from ML = −1.3 to 1.7 [Thouvenot et al. 2009]. The strongest shock was recorded on the night of 31 December 2002 (ML = 1.7) and was felt in Clansayes and Saint-Paul-Trois-Châteaux. Unfortunately, no macroseismic questionnaires were filled and sent back to BCSF for most of these events of the 2002–2003 crisis: only one event on 27 March 2003 is reported. It was felt and preceded by a strong detonation in the vicinity of Rochegude and Suze-la-Rousse, 9–14 km South of Clansayes (BCSF, C. Sira pers. comm. 2012).
3. Spatio-temporal structure of the seismicity
3.1. Time structure of the seismic swarms
Altogether, more than 880 seismic events, most of them clustered in time and space, have been reported in the area since 1549. The longest periods of seismic activity lasted several months or even years, as illustrated in Figure 5. However, the rate of events is not constant during the crisis. For instance, the 1772–1773 swarm developed from 8 to 30 June 1772 and was followed by a period of about 120 days (end of June to November 1772) without any seismic activity. Then, during the whole month of November and until mid-January, only noises were heard, with occasional light shakings. The seismic activity was then more important from 16 January till end of February 1773. It was followed by another period of less seismicity, which extended until June 1773, this period corresponding to about 100 days. From this time until the end of the crisis in December 1773, the events became scarcer (Figure 5). The second important seismic swarm developed from 14/07/1873 to 04/09/1873 [Boisse 1936]. One may wonder if the events of 20 June and summer 1872 may be related to the 1873 crisis. The 1872 events were only felt in La Garde-Adhémar while 1873 events were felt further north in Châteauneuf-du-Rhône, Donzère, Viviers, and Montélimar. However, the 1874 and 1875 events could be very likely related to the 1873 crisis as they were only felt in Châteauneuf-du-Rhône. In that case, a period of quiescence would have occurred from September 1873 until February 1874, period corresponding to 174 days and only four events were then reported during about 340 days, if we consider that the 28 January 1875 event would correspond to the last event of the crisis.

(a) Cumulated number of seismic events for the 1772–1773 (red curve) and 1934–1936 (blue curve) crises, starting from the first event of each crisis [sources: [SisFrance 2021]; Faujas de St Fond, 1783, and Rothé 1936, 1939a]. The double arrows correspond to the period of operation of the temporary Mainka-SOM seismographs installed by the BCSF in Les Granges-Gontardes (Figure 4). The thin lines represent the most important events for which an epicentral intensity has been determined or interpreted from archives. (b) Cumulated number of seismic events (black curve) in FCAT17 catalogue [Manchuel et al. 2018] complemented by the LDG catalogue from 2010 [Duverger et al. 2021]. The plot starts in 1750 for a better visual appreciation of recent years, but six events are reported before, starting in 1173. The right axis presents the moment magnitude (Mw) of events (orange circles) and the number of events per decade in the catalogues (grey bars). The inset is the depth histogram of events. Masquer
(a) Cumulated number of seismic events for the 1772–1773 (red curve) and 1934–1936 (blue curve) crises, starting from the first event of each crisis [sources: [SisFrance 2021]; Faujas de St Fond, 1783, and Rothé 1936, 1939a]. The ... Lire la suite
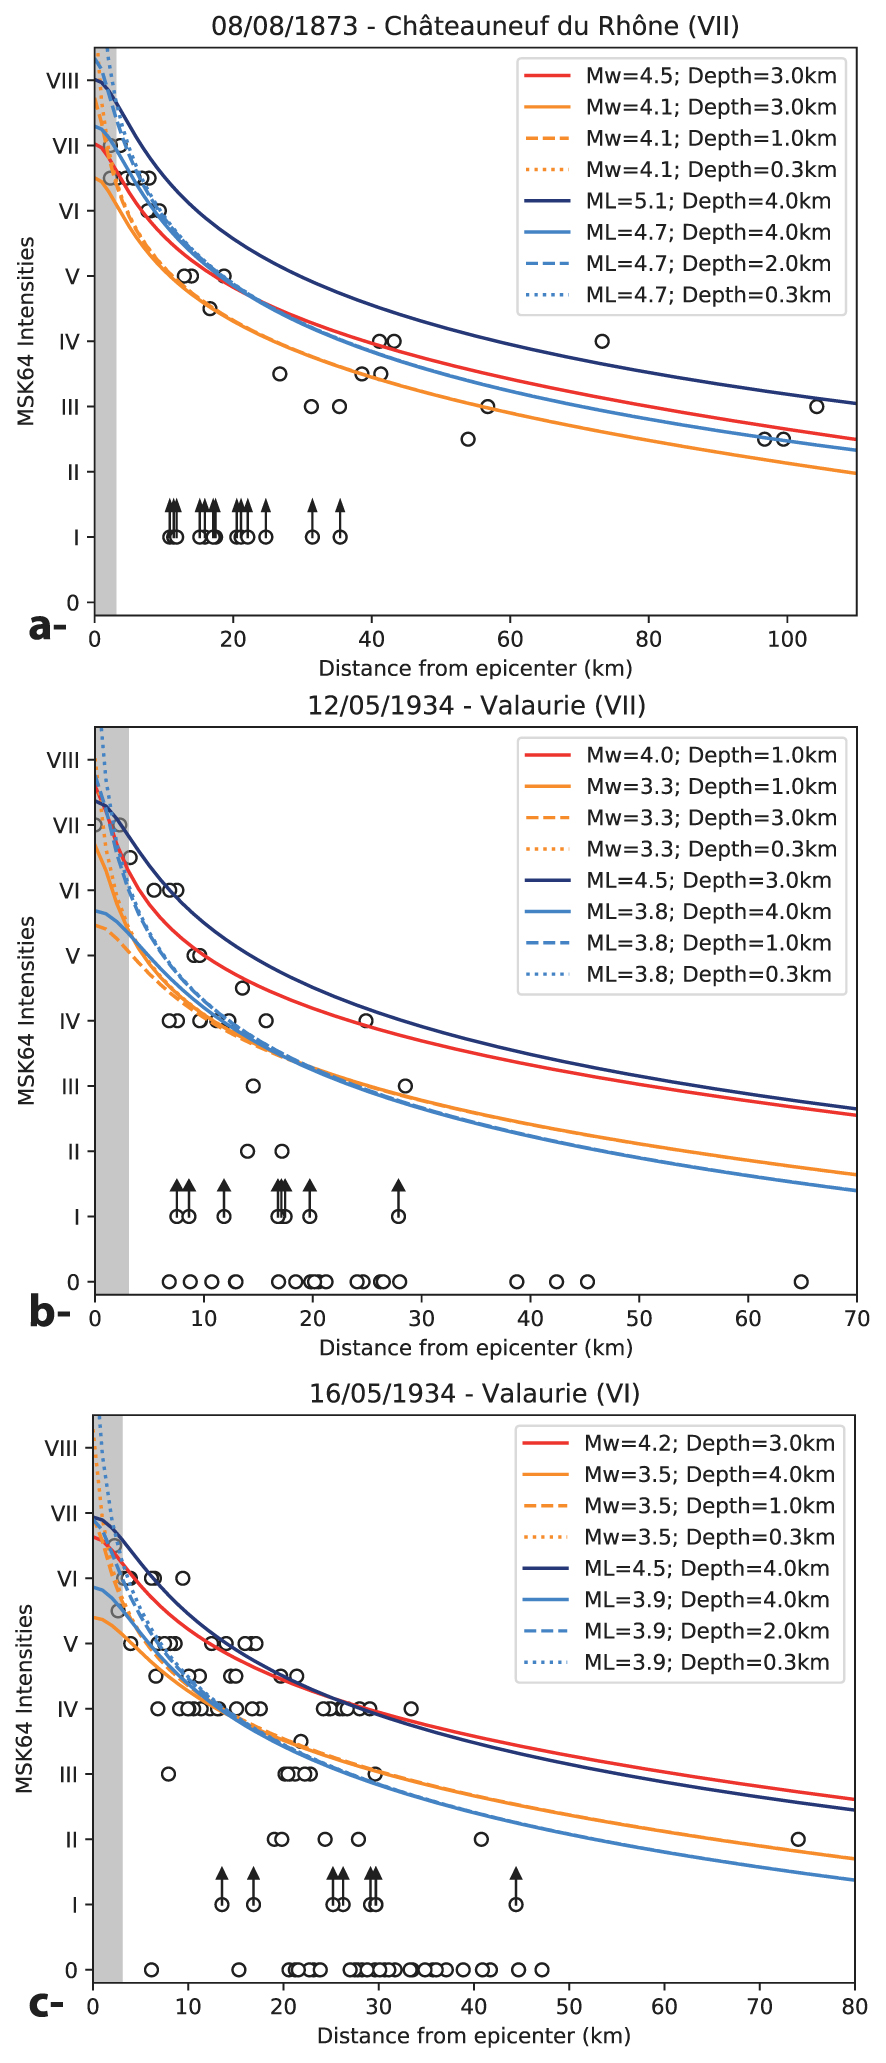
Comparison of observed and predicted intensities for the 08/08/1873 Châteauneuf-du-Rhône, 12/05/1934 and 16/05/1934 Valaurie earthquakes. Observed MSK1964 intensities are from SisFrance [2021] and predicted MSK1964 intensities for different magnitudes (coloured curves) are obtained using Marin et al. [2004] and Baumont et al. [2018] IPEs, respectively, in ML and in Mw. A circle with arrow means that the event was felt but no intensity determined. The observed intensity I might thus be equal to II or greater. The intensity distribution is consistent with shallow hypocentral depths, according to the predicted intensity attenuation deduced from the attenuation law. The grey band corresponds to a range of distances outside the domain of validity of Marin et al. [2004]. Masquer
Comparison of observed and predicted intensities for the 08/08/1873 Châteauneuf-du-Rhône, 12/05/1934 and 16/05/1934 Valaurie earthquakes. Observed MSK1964 intensities are from SisFrance [2021] and predicted MSK1964 intensities for different magnitudes (coloured curves) are obtained using Marin et al. [2004] and ... Lire la suite
With recurrent seismic activity four years in a row, the longer seismic swarm reported in the region occurred in 1933–1936. This swarm was first active from October 1933 to December 1934 and then from 6 October 1935 till 2 August 1936. A first period of low seismic activity and quiescence is observed during about 180 days before the peak of activity in May 1934 (Figure 5). Between December 1934 and October 1935, a period of 10 months (about 300 days) of inactivity and silence was observed [Rothé 1939a,b]. This long time of quiescence could also be interpreted as a period between two crises.
Few seismic events were recorded by the national seismic network since 1962 (49 events in the LDG catalogue), and no seismic swarm. Only, the local temporary network installed in Clansayes allowed recording the local crisis from December 2002 to April 2003 [Thouvenot et al. 2009].
3.2. Spatial structure
During the 2002–2003 crisis, 51 events were located using a dense local temporary seismic network, among them 38 events were relocated using double difference techniques. These events describe a 5 km-long N–S trending shallow cluster [Thouvenot et al. 2009]. The cluster developed on the eastern limb of the Echavarelles fold between Clansayes to the South and the Berre River to the North (Figure 2).
Unfortunately, because of the sparse density of the national network covering the last 50 years of seismicity, none of the remaining 25 instrumental epicentres can benefit from the same location resolution. Indeed, the location uncertainties can reach up to 10 km and may explain partially the scattering of the instrumental seismicity visible on Figure 1, precluding any use of the national instrumental database for precise location purposes.
Nevertheless, the high density of the macroseismic observations helps delineate the spatial characteristic of the seismicity. The largest intensities have been observed in the area between the localities of Châteauneuf-du-Rhône and Clansayes were they reach Intensity MSK64 VII (Figure 3). Similarly, the macroseismic epicentres are located on the east bank of the Rhône between Châteauneuf-du-Rhône and Solérieux (Figures 1 and 2).
However, the spatial extent of each crisis, its barycentre as well as the area of the maximum intensity seems to differ from one crisis to another (Figure 3a–d). As a matter of example, although 1772–1773 seismicity near Clansayes could correspond to the trace of the 2002–2003 swarm, the 1873–1875 seismicity seems more developed in the northwest, in Donzère–Châteauneuf–Viviers–Malataverne area.
Although subtle, the local seismic activity seems distributed in two sub-regions (Figures 1 and 2), the northern one located in the area of Viviers, Châteauneuf-du-Rhône, Malataverne, and Donzère; and the southern one around the localities of Les Granges-Gontardes, La Garde-Adhémar, and Clansayes. These two domains correspond to two tectonic and hydrological domains separated by the Berre river. Both domains incorporate a large anticlinal structure, respectively the Donzère and the Echavarelles folds to the North and South.
We therefore tested the hypothesis of a spatial correlation between these two domains and the regional historical and instrumental seismicity. In order to base the test on the whole set of 156 historical events, even if all the epicentres cannot be determined, we decided to characterise the information on their geographical origin by their epicentral area (See repository data material for full details definition/observations selection, Figures S1, S2, and S3, Tables S1 and S2). In order to test if the set of maximum intensities representing an earthquake can be jointly associated to one of the two folds, we define a correlation index as the number of nearest observations from one fold normalised by the total number of maximum observations for the event. The earthquake origin is then supposed associated to the fold with maximum correlation and remains undetermined when the two indexes are equal. Because every event is always associated with one fold whatever the distance, it is necessary to combine it with a distance criterion. In a crisis, the correlation rate between the seismicity and a fold is assessed by the number of earthquakes for which the individual index suggests an association. Table S1 details the time repartition of the correlation for the distance of 10 km accounting for the geometry of the folds and for the uncertainty on the location of the observations due to the fact that they represent intensities at the scale of the French smallest administrative unit, that is, about 5 km. Except for the earthquakes that are not associated to the folds because they are far from them, almost all events of a same crisis have a consistent correlation with a single fold: the Echavarelles fold for the 1772–1773 and 1933–1936 crises and the Donzère fold for the 1873–1876 crisis. Despite the poor number of events in the more isolated clusters, they also seem associated with a single fold: the Donzère fold for the 1549 and 1610 earthquakes and the Echavarelles fold for the 1897, 1907 to 1910, and 1974 earthquakes.
These results suggest that each crisis could be spatially and temporally associated with a seismic activity in the vicinity of either one fold or the other. In order to test if this spatial and time correlation rate is particular, we test the hypothesis that it would be in agreement with a spatial repartition of events due to chance (See repository data material for full testing). For the three main crises, 1772–1773, 1873–1876, and 1933–1936, their spatial and time correlation rates are not due to chance (Table S1). The poor number of events in the isolated clusters does not allow rejecting the hypothesis of a correlation due to chance.
The historical earthquakes could therefore be spatially associated with the Donzère and/or the Echavarelles folds. This result is consistent with a similar conclusion that can be drawn after visually confronting the FCAT17 “macroseismic” epicentres, their densities (Figure S1), and the trace of the folds. However, note that the swarms are spatially clustered and represent almost 90% of the seismicity. The statistical test performed here, which does not take into account the elusive pattern of the historical clusters of seismicity, is therefore limited.
No major crisis occurred in the region since 1936, so we cannot test the instrumental epicentres of the CEA/LDG catalogue for the time period 1962–2020. Instead, we just make a similar test on the spatial repartition of the instrumental epicentres around the two folds. The correlation rate is not due to chance between 8 and 24 km. But the occurrence of the 6 nearest earthquakes might be due to chance. The small number of events near the folds on this short time period (compared to the 23 earthquakes that occurred in the same distance during the last two centuries) and the strong scattering of the instrumental epicentres (due to the localisation uncertainty, about 10 km) compared to the historical ones explain that the correlation is rejected at short distances.
3.3. Depths
During the 2002–2003 crisis, the 38 events relocated using double difference techniques describe a shallow cluster [Thouvenot et al. 2009]. Indeed, the seismicity located was very shallow with half of the events relocated in the 100–300 m and half in the 500–700 m depth range under the mean 100 m high local topography. These depths appear almost consistent with depths deduced from S–P interval for events located under the seismic stations, tending to prove that they are most probably overestimated only by at most 200 m [Thouvenot et al. 2009]. No similar local instrumental data are available prior to this crisis in Clansayes and further north in the Donzère area to ascertain that those shallow depths always characterise the local seismicity.
However, the strong attenuation of the shacking at short distances, in addition to the many local noises, have often suggested a shallow seismicity in the area. After the 1934–1936 seismic crisis, Rothé [1939b] already tried to compare instrumental and macroseismic data acquired. However, results were not conclusive as he calculated an instrumental depth of 3 ± 1 km, considering the tS − tP time interval and obtained a macroseismic depth ranging from 4.2 to 18 km for the 13 February 1936 event, depending on the empirical formulation used. He concluded that the depth determinations were discordant but that the seismicity seems very shallow considering the underground noises heard on a small area. Note that the time delays between S and P arrivals estimated on the signal were certainly not as accurate as today, probably greater than 1 s, leading to uncertainties on hypocentral depths of several kilometres.
Hereafter, we try to re-evaluate both depth and magnitude of the historical events comparing their macroseismic intensities to attenuation relationships, and testing whether the depths of the largest historical events can be as shallow as the 2002–2003 instrumental events. For that purpose, we selected the events with the largest peak intensities (Intensity MSK64 ⩾ VI) and among them, the best described by their number of observations. For each of them, assuming that the hypocentre is shallower than 1 km, we estimate a magnitude using a least square procedure between the attenuation law and the observations. Figure 4 presents observed and predicted intensities for the 08/08/1873 (39 observations) as well as the 12/05/1934 and 16/05/1934 events (50 and 101 observations, respectively). These results are compared to curves calculated with the same magnitudes for a 4 km depth (corresponding to the mean depth of southeastern France seismicity), as well as for a 0.3 km depth (corresponding to the mean depth of the 2002–2003 seismic events). The quality of the epicentral localisation strongly depends on the density of observations at a short distance. Distances as short as a few hundreds of metres should be represented in the database to properly tie depths as shallow as 300 m, unfortunately the macroseismic epicentre locations are not known with that precision. It is therefore difficult to test depths less than 1 km given the uncertainty on the macroseismic epicentre position, which may be higher than 1 km. Although satisfactory for the whole data set, the results overestimate the observations in the epicentral area for very shallow depth (0.3 and 1 km). This can be also accounted by the fact that the relationship used to estimate the magnitude is not specific for very shallow depths: Marin et al. [2004] relationship being calibrated using the French national database, with an average depth of 10 km. Nevertheless, a depth as shallow as 0.3 or 1 km may be considered for these macroseismic events. One should note that, without this prior knowledge characterising the shallow depths of the local seismicity, the magnitude derived from the epicentral intensity taken alone, using Marin et al. [2004], would have been significantly higher (Figure 6).
4. Discussion
Over the last centuries, several models emerged trying to explain the occurrence of the atypical seismicity in Tricastin. Several are outdated, being inconsistent with the present knowledge in earth sciences. As a matter of example, on account of the explosion noises and that the seismic events seem very shallow, some authors suggested that the Tricastin seismicity might be of volcanic origin [e.g., J. B. Dalmas in Boisse 1936]. This first hypothesis was quickly abandoned as soon as the geologists documented the volcanic edifices nearby and their relationship with the tectonic structures. In this section, we review different models including mechanisms able to modulate the local seismicity, either from tectonics origin, or induced or triggered seismicity due to fluid circulation or karst collapse.
4.1. Tectonics
Since the early 20th century, several tectonic models have been considered as candidates for the generation of the local seismicity, most authors attributing it to local active faults. Mengel [1937, 1938a,b] suggested that the seismicity originated along N–S parallel fractures (from East to West, the “Faille de l’Argelas” (Figure 2), “Fracture du col des Mattes”, and “Faille de Viviers-Donzère”), and proposed that their reactivation is induced by a tilt towards the East of the Ardèche Massif. The Quaternary reactivation of these structures was then refuted by George [1938], on the basis of field observations and the reassessment of the age of the structures. We were unable to ascertain the precise location of the “Fracture du col des Mattes” and “Faille de Viviers-Donzère” to check the arguments of both authors. However, the Faille de Viviers-Donzère could correspond to the NE–SW Saint-Montant fault which affects the right bank of the Rhône River and strikes through its course, exposed in a quarry in the vicinity of Viviers. This fault was assigned a Miocene age in the potential active fault database [BDFA for “Base de Données de Failles potentiellement Actives”, Jomard et al. 2017] and is represented in yellow in Figure 1. We found no clear evidence on maps and in the field of the quaternary activity along the fractures and faults (including “Faille de l’Argelas”) affecting the Urgonian limestones of the Moulon hills. Some authors related the Tricastin seismicity to the activity of the Pierrelatte and Saint Pierre du Lauzon faults supposed to be the border faults of a N–S graben affecting the area further South [e.g. Debelmas 2004]. However, the Pierrelatte fault is not directly associated with the seismicity described here, which falls mainly on the eastern bank of the Rhône River, and its existence is even debated. Indeed, mapped as a suspected blind fault trace from Pierrelatte to Chartroussas castle [Geological map Valréas 1964], the Pierrelatte fault trace has been suggested on the basis of the interpretation of the seismic refraction cross-sections of Société Nationale des Pétroles d’Aquitaine (SNPA). These cross-sections revealed a steep variation of 400 m of a seismic horizon, interpreted as the top of the Urgonian, suggesting an “apparent” offset on a fault. Since then, the topography of the Urgonian seismic horizon has been reinterpreted following the reinterpretation of a borehole log [Demarcq 1960] and is now attributed to the presence of the Messinian palaeocanyon of the Rhône [Clauzon 1982] (see also Figure 2). In addition, the indices of Quaternary activity of the Saint Pierre du Lauzon Fault, located on the left bank of the Rhône, south of Saint-Paul-Trois-Châteaux, were also rejected [Neopal 2009]. The activity of other faults in the vicinity, including the faults affecting the Oligocene limestones of the La Garde-Adhémar Plateau (Figure 2) are still debated, several being labelled as potentially active in the French database [Jomard et al. 2017].
The absence of clear quaternary activity criteria is not necessarily the synonym of fault inactivity in this area. Indeed, the fractures and offsets exposed to the surface after the 11/11/2019 Le Teil surface rupture were eroded a few weeks only after the mainshock [Ritz et al. 2020], and no quaternary cumulative scarp is either visible in the field along the fault trace. Furthermore, the realisation of Le Teil earthquake demonstrated that the steep normal faults activated during the Oligocene might be reactivated as reverse faults, at the toe of the Oligocene normal fault cumulative scarp [e.g. Ritz et al. 2020, Vallage et al. 2021]. Note that the thrust faulting expressed in Le Teil earthquake is compatible with the present state of stress and kinematics in the area [Gratier et al. 2013; Heidbach et al. 2018; Masson et al. 2019; Mazzotti et al. 2021]. These studies suggest a maximum horizontal stress locally NW–SE to E–W. The strain rates associated with the horizontal shortening on spatial scales of 100–200 km is ca 1 × 10⁻⁹ yr−1, which corresponds to a shortening around 0.1–0.2 mm⋅yr−1 [Masson et al. 2019].
The deformation related to the historical seismic swarms aforementioned could be more distributed than the deformation accommodated by a significant mainshock similar to the Mw 4.9 Le Teil earthquake. Indeed, to the exception of the 1873 swarm that produced the ML 4.9–5.1 earthquake on 8 August 1873 [Mw 4.1 in FCAT17, Manchuel et al. 2018], the seismic swarms produced smaller earthquakes, which most probably contributed individually to less slip accommodation.
However, the seismic swarms activity might be driven by aseismic creep [Gratier et al. 2013], a behaviour documented elsewhere [e.g. Kyriakopoulos et al. 2013; Cheloni et al. 2017]. Such aseismic creep might be located on the Triassic decollement or accommodated through a thicker sedimentary part. It could also be associated by folding and fracturing of the thick limestone slabs.
Two significant folds are described near the seismic clusters. The largest fold is the E–W Donzère anticline (Figure 2), located between Châteauneuf-du-Rhône and Donzère, which may accommodate a north-verging thrust related to the Cevennes fault system [Lacassin et al. 2001].
As previously mentioned, a second fold, the Echaravelles anticline [George 1930], is located about 10 km south of the Donzère anticline, between La Garde-Adhémar and Saint-Paul-Trois-Châteaux (Figure 2). Both anticlinal structures were already developed before the Oligocene [Masseport 1957], as the cretaceous formations have a steeper dip than the Oligocene one. Note that there is no formation younger than the Oligocene affected by these anticlines. However, so far, no geological arguments preclude their recent activity. Mandier [1988] even suggests that the slope of 2–5% of the quaternary terraces along the southern limb of the Donzère anticline could be associated with the activity of the fold.
According to the localisation of macroseismic and instrumental epicentres, it appears that the seismicity could be located at the hinges of the folds or on the basal decollement of the Donzère and Echaravelles anticlines. To test that hypothesis, we surveyed the two folds geometries in the field. We assume these E–W striking folds are north-verging anticline developing over the Triassic decollement. The Echavarelles anticline has very gentle dip on both limbs (∼10°) (Figure 7b). The Donzère anticline is more asymmetric, dipping steeply (50–60°) towards the north on the forelimb but is gently dipping (∼10°) to the south on the backlimb (Figure 7a). We reconstructed the structures surveyed in the field by propagating at depth the surface data and interpreted the anticlines as fault-propagation folds (Figure 7a for the Donzère anticline) [e.g. Suppe and Medwedeff 1990].

(a) Schematic North–South cross-section of the Donzère anticline, interpreted as a fault-propagation fold. (b) Schematic East–West cross-section of the Tricastin, through Clansayes and the Echavarelles anticline modified from Gratier et al. [2013]. (c) Distribution of the scalar of the distance to the Coulomb criteria varying from 0 (dark blue) to 1 (dark red). The right plots show the definition of the distance to the Coulomb criterion (e) and of the scaled distance to the criterion (d). When d = 1, e is more than 1% of the cohesion, far from the failure criterion, while when d = 0, the Coulomb criterion is satisfied. Masquer
(a) Schematic North–South cross-section of the Donzère anticline, interpreted as a fault-propagation fold. (b) Schematic East–West cross-section of the Tricastin, through Clansayes and the Echavarelles anticline modified from Gratier et al. [2013]. (c) Distribution of the scalar of the distance to the Coulomb ... Lire la suite
We then determined the regions within the fold system where the seismicity is the most likely to develop. For that purpose, we applied the kinematic approach of limit analysis, classical in Mechanics [Salencon 2002], and thus assume the rock to be rigid plastic. The plastic deformation, associated with the Coulomb criterion, marks the region where frictional dissipation occurs. The numerical tool developed by Souloumiac et al. [2010] is applied to the 2D fault-propagation fold geometry surveyed on the field (Figure 7c) and in which the blind thrust, rooting on the weak Trias decollement, is introduced as a discrete surface. The state of stress, dual to the velocity is then used to estimate the regions where the Coulomb criterion is activated around the blind, active thrust. These regions include a main backthrust conjugate to the ramp and rooting also on the decollement, a minor backthrust at a shallower depth where the thrust dip changes and finally, at even shallower depths a system of conjugate reverse fault and backthrust emanating from the tip of the blind thrust (Figure 7c). Despite the quasi-static assumption of the analysis, these regions of activation of the Coulomb criterion complemented by the blind thrust and possibly the decollement are proposed as potential seismic regions.
More generally, most instrumental earthquakes recorded by the 2003–2004 dedicated local seismic network nucleate in the strong limestone units and only few of them could be observed in the weak marl units [Thouvenot et al. 2009; Gratier et al. 2013]. These swarms may be tectonically driven (a) by aseismic creep localised either on the main decollement level, supposed to develop above the rigid basement through the Triassic evaporitic pile, or (b) to shortening accommodated through the thick shales and clays series above. However, the limestone units in general, within the fold hinges in particular, might also respond to smaller transients or seasonal loading related with hydrology.
4.2. Hydrological forcing
Hydrological forces could be a good candidate for modulating in space and time the local or regional seismicity. The occurrence of several rainy episodes before or during the seismic swarm episodes, lead several previous authors to suggest a causal link between the two. For instance, according to Villard [1887], there were major floods in 1548, prior to the January and May 1549 seismic events and the author wondered if this was a coincidence or a correlation [Boisse 1936]. Based on the information collected by Abbé Heurteloup [in Rothé 1936] with older inhabitants of La Garde-Adhémar, the seismic events of the 20 June 1872 and following months occurred after a significant heavy rainfall. Note that the strong ground motion had a vertical component and that water was ejected out of 10 m deep wells [Rothé 1936]. This observation might have lead the witnesses to suggest an undemonstrated causal link between water and the seismicity. In July 1873, strong rainstorms occurred before the seismic events, as related in local newspapers (Echo de l’Ardèche, Journal de Montélimar). The 1933–1934 events followed major rains of 8–9 October 1933 [Parde 1934] and rains of spring 1934 [Rothé 1936].
4.2.1. Hydrological forcing on tectonics
Despite the absence of demonstration of any causality between seismicity and rainfall in Tricastin, the occurrence of seismic swarms after major meteorological events lead several authors to suggest a link between this seismicity and pluviometry or hydrology. Some suggested that dissolution phenomenon could affect the gypseous Triassic formation and lead to collapses at depth [Pr. Roman, cited in Boisse 1934]. A model of gypsum or salt layer subject to underground erosion was also suggested by M. Rey de Morande [Boisse 1936]. This hypothesis was refuted by J.B Dalmas in 1873, who argued that no gypsum nor evaporitic layers were suspected at shallow depths above the Oxfordian formation in the Tricastin region.
Effects from groundwater circulation were also suggested, such as an intermittent underground branch of the Rhône along a fault or dislocation line [Commandant Costa, in Boisse 1936]. George [1935, 1938] hinted to the hypothesis of karstic caves collapse to explain the 1933–1936 Tricastin swarms, as interpreted by Marcellin [1926] for similar shaking with explosion-like noises, in the Garrigues region, further south. If such karstic assumption has been ignored in the region since Marcellin [1926], it was suggested more recently in 2002–2003, in a karst region (Roquemaure, Gard), after the occurrence of a local microseismicity recorded by a temporary seismological network. Variations of Vp∕Vs ratio were measured after the occurrence of a catastrophic storm and the filling of the karstic network that followed [Rigo et al. 2008]. Similar rain-triggered seismicity has also been described in other karstic regions [e.g. Kraft et al. 2006; Miller 2008]. This hypothesis might be further tested for the Tricastin swarms, as most of the instrumental seismicity of 2002–2003 appears located at 300 m depth, within a thick Urgonian limestone karstic slab. Within this formation, a major karstic network is well developed on the right bank of the Rhône, the Ardeche endokarst, which is characterised by numerous cavities organised in networks and chimney shaft connecting the different levels [e.g. Mocochain et al. 2006]. On the left bank of the Rhône, a karstic network is also developed (Figure 8a) as attested by the presence of several caves, listed in the natural or artificial cavity database of France [BDCavités 2021].
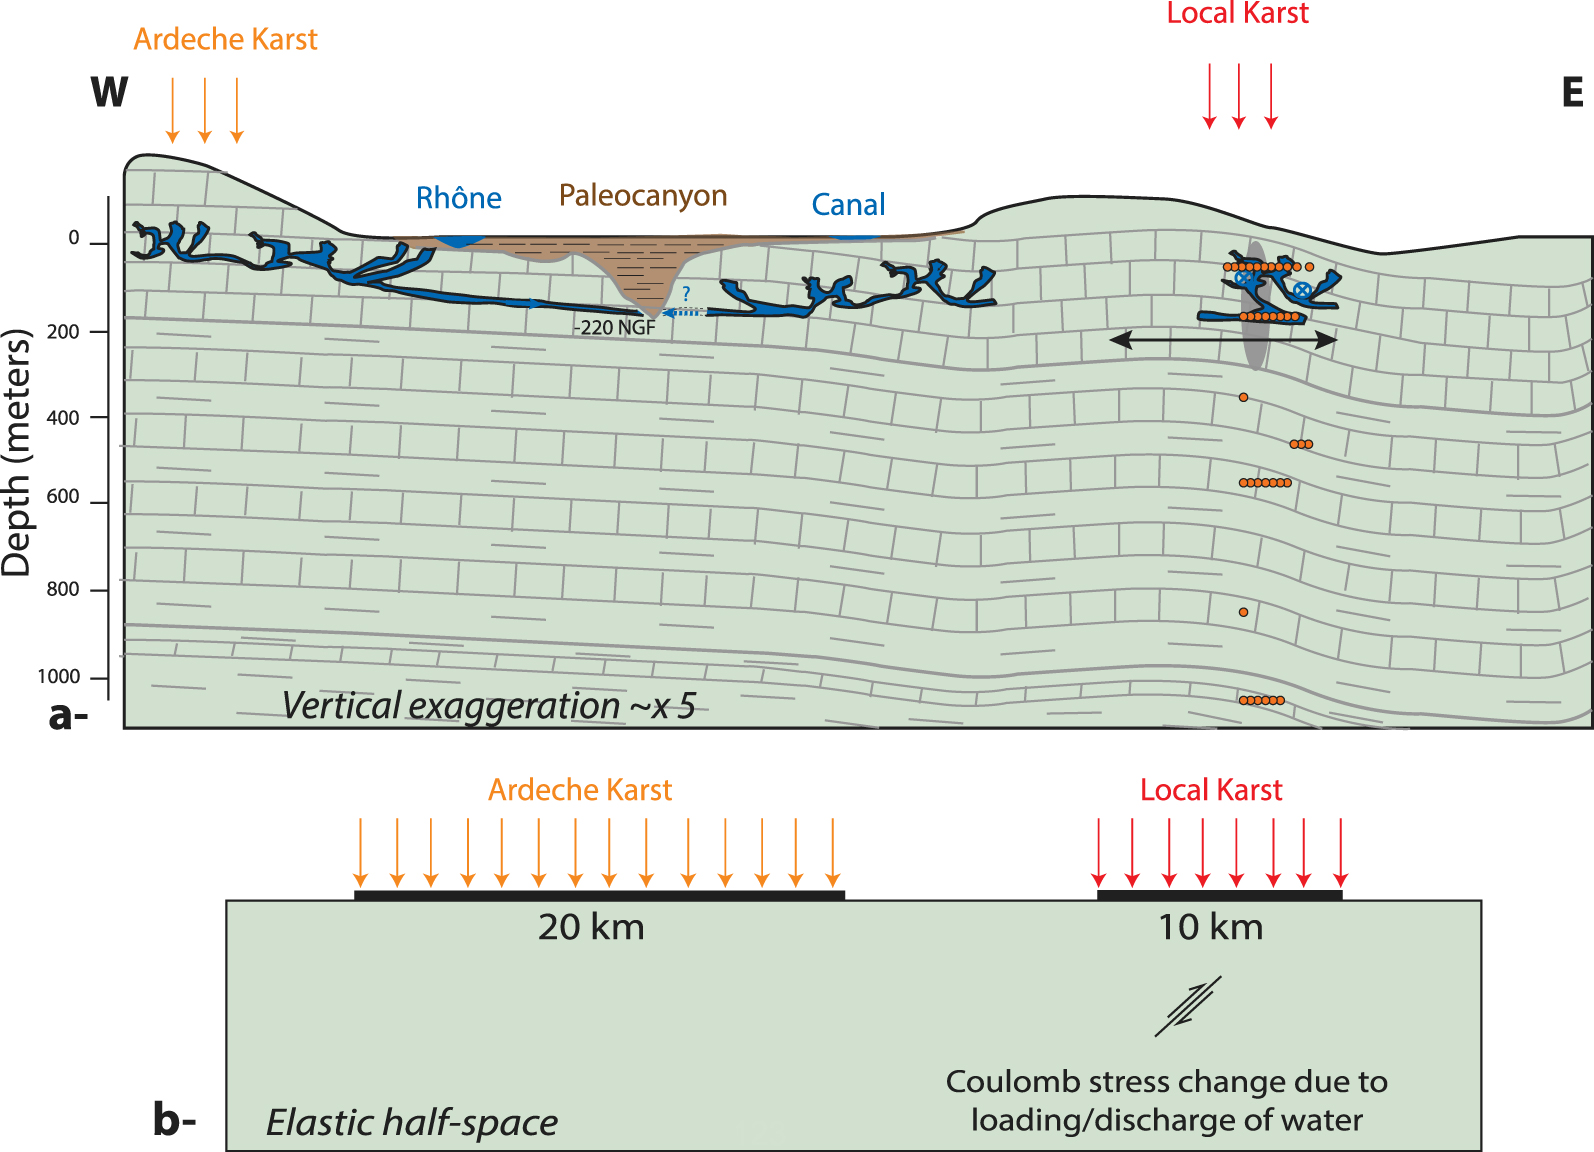
Schematic West–East cross-section of the Tricastin region (vertical exaggeration of 5). (a) A schematic karstic network is drawn in dark blue. Orange dots correspond to the depth distributions of relocated earthquakes from the 2002–2003 crisis [from Thouvenot et al. 2009]. The Rhônes palaeocanyon is represented in brown and the present Rhône River and canal in blue. (b, c) Illustrate the input parameters of the models.
We could therefore consider that filling or emptying of an aquifer may induce an elastic response modulating the normal and shear stresses variation of the local tectonic structures at shallow depth. The seismic swarms may be induced or triggered by the loading/discharge of the water table [e.g. Gupta 2002; Bettinelli et al. 2008; Bollinger et al. 2010; Craig et al. 2017; D’Agostino et al. 2018]. Therefore, we tested the influence of hydrological forces assuming a semi-infinite elastic medium with the forces applied on the top of the half-space (Figure 8b). The stress changes are determined following Flamant’s analytical solution for the loading of an elastical space [Flamant 1892]. We first considered an equivalent water thickness of 24–36 cm for the seasonal variation as determined by gravity measurements within the karstic aquifer of Larzac Plateau [Jacob et al. 2008]. We applied this water thickness loading in the Ardeche and local karst aquifer and calculated the Coulomb stress variations (𝛥S) resulting from the changes in water thickness. We measured fault planes in the field, in order to determine the stress fields on different geological period. The 𝜎1 field stresses are oriented E–W in Urgonian limestone outcropping in Pierrelatte and NW–SE for faults affecting the Oligocene. We did not find any evidence of deformation affecting the more recent formations. The stress tensor orientation deduced from fault plane inversion for the three largest instrumental earthquakes located in the north of the Tricastin region [Delacou et al. 2004] indicates a NW–SE stress field. The calculations of Coulomb stress variations have thus been done on fault planes similar to the post-Oligocene fault planes observed in the field and on the preferential rupture planes deduced from the examination of the regional stress field from focal mechanisms, taking into account a local stress field oriented NW–SE (Table S3). At depths of the order of 300 m, the hydrological forcing seem to perturb the stress by a negligible quantity, especially if applied on the Ardeche karst. If the forces are applied on the local karst system, the Coulomb stress variation reach 2 kPa, a very small value, comparable to earth tides for which no clear correlation with seismicity have been observed [Cochran et al. 2004]. This value is significantly lower that the threshold at which seismicity is triggered by static Coulomb stress variations is induced by coseismic slip.
Moreover, if we apply more realistic water thickness variation of 1 m for the region, the Coulomb stress variation is about 6 kPa at 300 m depth on an 80° E dipping plane (taking a friction coefficient at 0.6, Table S3). Therefore, we can assume that metric variation of water charge may influence in a subtle way the local stresses at shallow depths. Moreover, the in situ stress has to be close to the failure and the stress gradient k (Rankin coefficient, Andersonian stress) has to be equal to 3 to reach the Coulomb criterion, assuming that rocks at 300 m depth are near failure. In any case, it is difficult to correlate the Tricastin seismicity with catastrophic meteorological events, as we have no access to complete meteorological time series, especially for the oldest seismic swarms of 18th and 19th centuries. Moreover, Thouvenot et al. [2009] indicate that the nearest weather station in Montélimar does not reveal any exceptional variations of rainfall prior to the 2002–2003 Tricastin swarm activity.
However, the direct effect of the water surface loads on the pre-existing faults is not the sole effect involving fluids that can modulate the local seismicity. Indeed, additional processes leading to high fluid-pressure channelisation along the local fault systems could be involved to foster fault reactivation. The local active faults listed in the BDFA between Les Granges-Gontardes and Clansayes appear almost parallel to the maximum principal horizontal stress, and are therefore not optimally oriented within the present day stress field (Figure 1). However, the uncertainties associated with the local stress field orientation, the fault geometry at depth, and the presence of eventual channelised fluids at depth along the fault planes, could be consistent with fault reactivation.
4.2.2. Other hydrological forcing
As already mentioned, most of the instrumental seismicity of 2002–2003 appears located within a thick Urgonian (Cretaceous) limestone slab [Thouvenot et al. 2009]. Within this formation, a major karstic network is developed on both sides of the Rhône. On the left bank, the hills between Donzère and Malataverne are notably rich in caves. The Messinian palaeocanyon of the Rhône River, filled with Pliocene and Quaternary sediments, is located to the East of these hills (Figure 2). The talweg of the palaeocanyon was revealed in borehole at −220 NGF in the vicinity of Malataverne [Camus 2003, 2010] and −236 NGF at Pierrelatte [Demarcq 1960] (Figure 2). Unlike the Ardeche karstic network that drains towards the actual Rhône River or the Ardeche Canyon [Mocochain et al. 2006], the Tricastin karsts only drain towards the Rhône palaeocanyon (Camus, personal communication). This setting is consistent with the palaeogeography of the area during the Messinian Salinity Crisis, during which the main karstic base level was controlled by the downcutting of the Rhone river [Mocochain et al. 2006]. Likewise, karstic network located in Urgonian layer south of La Garde-Adhémar may also drain towards the Berre palaeocanyon, whose thalweg should be around −240 or −220 NGF. As half of the 2002–2003 seismic events are located between 0 and 300 m beneath the temporary seismological network, near a potential drain, half the seismicity falls at depths close with the karst conduits position (Figure 8a). Such conduits can be partly filled with sediments such as sands or silts. They can also be flooded and would buckle beneath the weight of the overlying rock. The fluid pressure prevailing in the conduit depends on the local hydrological conditions. The seismicity may result from variations of the conduits buckling with similar mechanisms to that observed for induced seismicity in mining domain. In such context, a change in volume of the gallery induces rupture by shear stresses around the mining face. The rupture may also be associated with reactivation of faults around the gallery. The sum of the seismic moments of the earthquake population (𝛴M0) can be calculated from the change in volume (𝛥V ) of the gallery [McGarr 1976], such as
Taking K = 1, a rigidity of 3 × 10¹¹ dyn⋅cm−2 and assuming a 𝛥V as large as 10 × 10 cm along a 3 km-long karstic drain, we obtain a sum of seismic moment of 1019 dyn⋅cm = 1012 N⋅m. This seismic moment—equivalent to a moment magnitude Mw = 3.95—appears within the same order of magnitude as the one dissipated by the seismic crisis along the drain.
Such model that does not involve directly a major tectonic transient might be a possible alternative to explain the seismicity that happens in the vicinity of the karst conduits, 300 m below the surface. If hydrological parameters are modulated on longer times, migration of the seismicity may be observed as well as relatively long-lasting seismic crises related to the time of pressure changes.
5. Conclusion
The Tricastin region, located on the left bank of the Rhône River is affected by a recurrent atypical seismicity. This seismicity is characterised by long-lasting earthquake swarms that are felt locally by the population. About 880 events have been described in local or regional archives and listed in the macroseismic and instrumental catalogues.
As many seismic events were felt very locally, a strong attenuation of the intensities at short distances was observed for the strongest events, plus the fact that noises of collapse and explosion were heard, many authors suggested that the seismicity developed at shallow depth. Dedicated instrumental seismic data acquisitions confirmed this scenario demonstrating that the seismicity developed in the first hundred metres during a swarm in 2002–2003 [Thouvenot et al. 2009]. The analysis of macroseismic data allows us to confirm this observation and the very shallow depths of the historical events, suggesting that the depths associated with the seismicity in recent national catalogues is still too deep (see the peak at 3 km on Figure 3b).
We demonstrated that most of the seismicity could be located within uncertainties along the hinges of two anticlines developed along the east bank of the Rhône River. We first tested a model involving the reactivation of their basal decollement. This model yields a state of stress close to failure at shallow depths further suggesting that the fold hinges appear as preferential zone for the seismicity development. This scenario requires transient slip events on the decollement to explain the long-lasting seismic swarms. More generally, the transient shallow seismicity could be related to episodes of aseismic creep occurring on the Triassic decollement and/or distributed through sediments, driving seismicity in the thick Tithonian and Urgonian limestone, a likely solution documented by Gratier et al. [2013].
The intermittent seismic behaviour of the seismic swarm, alternating weeks of intense activity followed by months of quiescence, deserves some attention since the modulation of the seismicity may reveal further the mechanisms at work. Similarly to elsewhere, seasonal or transient surface loads related to the local hydrology is likely to modulate in a subtle way the local stresses at shallow depths over the long term [e.g. Bollinger et al. 2007; Bettinelli et al. 2008; Kraft et al. 2006; Miller 2008; Bollinger et al. 2010; Craig et al. 2017; D’Agostino et al. 2018]. The amplitude of these stresses is roughly estimated to be around 2–6 kPa only, a value more than one order of magnitude smaller than expected. Finally, the depth of most of the recent instrumental seismicity coincides to the depth of major drains within the local karst. The seismicity may also partially result from the ground deformation induced by a change in volume of these cavities (or a change of the volume of circulating water, considering a direct effect of pressure in inducing seismicity). This last model predicts the order of magnitude of the seismic moment dissipated within the seismic crisis as well as their location, being an eventual alternative or additional candidate to explain some of the local seismicity in the vicinity of the karst drains.
Despite the extensive documentation of some of the seismic swarms, including the 1933–1936 episode documented by detailed BCSF macroseismic and instrumental studies [Rothé 1936, 1939a] and the instrumental catalogue of the 2002–2003 crisis [Thouvenot et al. 2009], the atypical seismicity of the area remains partly enigmatic. Most of the earthquakes are located at short distances from karst drains and fractured fold hinges, possibly affected by transient hydrological changes. Given the large number of possible driving mechanisms, the future studies in the area might compose with multidisciplinary documentation and monitoring of the area, with local seismic stations, complemented by geodetic and gravimetric measurements [see Braitenberg et al. 2019] and an improved geological background.
Conflicts of interest
Authors have no conflict of interest to declare.
Acknowledgements
We thank two anonymous reviewers for their thorough reading and detailed reviews, and Frédéric Masson, for his editorial handling of the paper.