

1 Introduction
In initial stages of exploratory investigations, stream sediment geochemical data are used to determine target areas for detailed exploration of mineral deposits (Afzal et al., 2010a; Arias et al., 2011; Carranza, 2011; Carranza and Hale, 1997, 2002; Daya, 2015; Parsa et al., 2016b, 2017b, 2017c; Sadeghi et al., 2015; Wang et al., 2014; Yilmaz, 2003, 2007; Yilmaz et al., 2015; Zuo, 2011a, 2011b; Zuo et al., 2009) and differentiation of geochemical anomalies from background concentrations plays a crucial role in regional geochemical prospecting for mineral exploration (Carranza, 2008). Identification of anomaly patterns is influenced by both the frequency and spatial variation of geochemical samples. The main disadvantage of traditional statistical methods is that they take only the frequency distribution of elemental concentrations into consideration and hence neglect the spatial variation of geochemical data and therefore, invaluable information of a geochemical data set may be missed out (Afzal et al., 2013; Parsa et al., 2016c). Common methods based on the traditional statistics include determining thresholds by means of average and standard deviation of data set (Li et al., 2003), exploratory data analysis (Reimann et al., 2005; Turkey, 1977), and probability plots (Sinclair, 1991). Cheng (2007) believes that there are complicated anomaly patterns in stream sediment geochemical data, which can be characterized by their spatial properties (Carranza, 2008; Carranza et al., 1999). This means that the determination of background and anomalous values requires consideration of frequency distributions and spatial variability of elemental concentration, simultaneously. Therefore, fractal/multifractal methods such as concentration-area (C–A: Cheng et al., 1994), perimeter-area (P–A: Cheng, 1995), concentration-distance (C–D: Li et al., 2003), concentration-volume (C–V: Afzal et al., 2011), spectrum-area (S–A: Cheng, 1999) and singularity mapping (SM) (Cheng, 2007) have been implemented to delineate complicate anomaly patterns (Parsa et al., 2016d, 2017a).
The C–A fractal technique has been successfully applied to delineate anomaly patterns due to the consideration of both frequency distributions and spatial variations. U-spatial statistics as a moving average technique (Cheng, 1999; Cheng et al., 1996) along with the fractal methods can, therefore, be effectively used to separate the anomaly populations from background based on the defining window around each station with different sizes and shapes.
In the present study, the results of the C–A fractal model are compared qualitatively and quantitatively with the results of the U-spatial statistics method in determining stream sediment Au, Bi, Cu and Mo uni-element geochemical signatures of porphyry Cu deposits in the Varzaghan district, NW Iran. Firstly, logistically transformed values of uni-elemental concentrations were interpolated using Ordinary Kriging (OK) method and afterwards, the U-spatial statistics method and the C–A fractal model were used to separate anomaly populations from background values of selected elements. Finally, success-rate curves (Agterberg and Bonham-Carter, 2005) were prepared for quantitative comparison and evaluation of discretized geochemical populations of mineralization-related elements with respect to the locations of already known mineral occurrences of the deposit-type sought.
2 Methodology
2.1 Concentration-area (C–A) fractal model
The concentration-area (C–A) fractal model was proposed by Cheng et al. (1994) for the decomposition of geochemical anomalies from background (e.g., Afzal et al., 2010b; Arias et al., 2012; Parsa et al., 2016a, 2016b). Equation (1) can summarize the C–A fractal model as follows (Cheng et al., 1994):
| (1) |
2.2 U-spatial statistics model
The U-spatial statistics model is a window-based moving average technique with variable window radius that may be used to decompose anomalies that are related to mineralization of a given type from background (Cheng et al., 1996). In this approach, the weight of each station is calculated according to the distances of the stations around the center of the appropriate window (Ghavami-Riabi et al., 2010). The variation of isotropy or anisotropy of the desired variables in diverse directions is influenced by the configuration of the window (Cheng, 1999). Distance-based weights are assigned to the center points of each window. The favorable U-value for each station (Ui(r)) with the radius of r (0 < r < rmax) can be calculated by the following equation (Cheng, 1999):
| (2) |
3 Geological setting
The study area is located within the Urumieh–Dokhtar magmatic belt (UDMB) in northwestern Iran (Fig. 1a). The UDMB, comprising NW–SE trending tectonic-volcanic segments, formed as a result of the geodynamic evolution of the Tethys belt between Arabian and Eurasia in the Late Mesozoic (Alavi, 1994). The porphyry Cu deposits show a strong tendency to form in island and continental-arc settings (e.g., UDMB) (Billa et al., 2004; Cooke et al., 2005). The previous exploration studies and known mineral occurrences in the northern parts of UDMB, especially in the Varzaghan district, indicate that this belt has great potential for prospecting porphyry Cu deposits in Iran (e.g., Ayati et al., 2013; Richards et al., 2012). The UDMB is divided into three important metallogenic sub-belts: (a) the Arasbaran porphyry copper sub-belt (APCB) in the northwest, (b) the Saveh–Yazd porphyry copper sub-belt (SYPCB) in central UDMB, and (c) the Kerman porphyry copper sub-belt (KPCB) in southeastern area, which host major Cu porphyry deposits, such as Sungun, Kahang, and Sarcheshmeh deposits, respectively. The magmatic activity in the area, initiated in the Cretaceous and continued intensively into the Quaternary, mostly consists of high-K calcalkaline to shoshonitic affinities (Jamali et al., 2010).
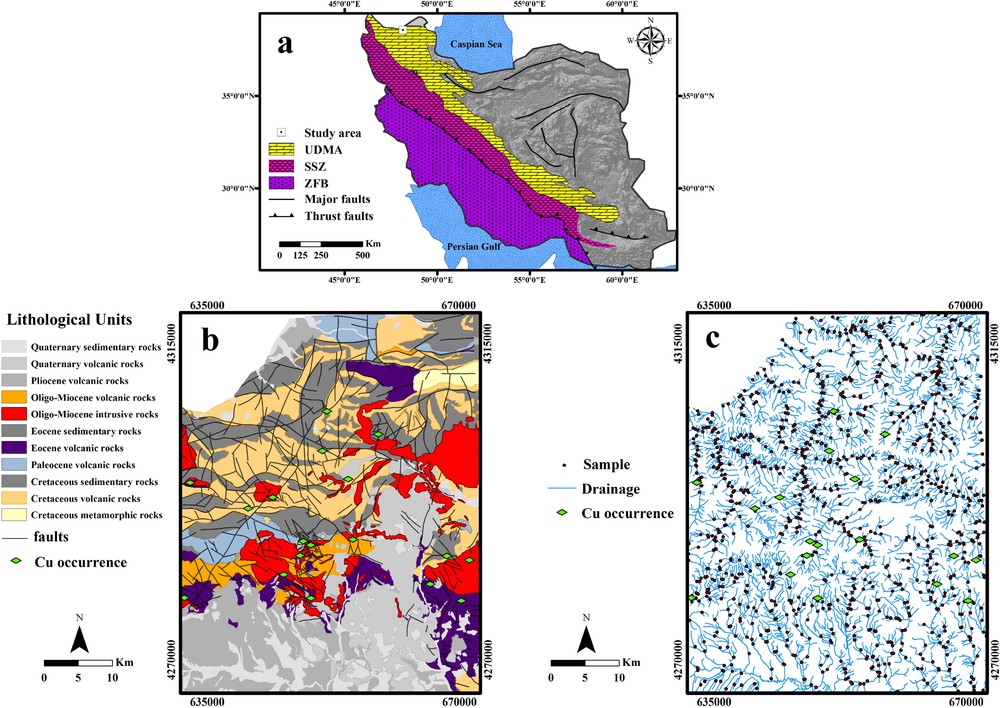
a: location of the study area in the Urumieh–Dokhtar magmatic belt; b: simplified geological map of the study area (modified after Mehrpartou, 1993); c: location of the stream sediment samples in the study area.
The Varzaghan district is located in the northern part of the APCB. The most common magmatic rocks in the APCB are type-I granitoids and monzonites that started to form as a result of intense magmatic activity in the Eocene and continued in the Oligocene–Miocene by emplacement of large intrusions causing extensive alteration and mineralization. Granodioritic, tonalitic, and quartz-monzonitic plutons played an important role in the formation of the porphyry, skarn and epithermal Cu, Mo, and Au. The distribution of precious and base-metal mineralization within the APCB can potentially provide economically significant mineralization (Maghsoudi et al., 2005).
The major lithological units outcropping in the study area include Cretaceous sedimentary and volcanic units, which appear in the northern parts of the Varzaghan district, Eocene–Oligocene volcanics, including trachyandesite, andesitic basalt, and porphyritic andesite. These rocks are cut by Oligo-Miocene intrusions of granodiorites to quartz-monzonites composition (Mehrpartou, 1993) (Fig. 1b). Plio-Quaternary andesitic and basaltic rocks overlie the older magmatic units, occurring predominantly in the southern part of the area. Quaternary alluvial deposits consisting of gravel, sand, and silty clay are widely distributed in river plains. Mineralization is believed to be related to intense hydrothermal alteration associated with Oligo-Miocene intrusive rocks with calc-alkaline to alkaline compositions (Jamali et al., 2010).
4 Geochemical data
During the regional geochemical exploration program of the Geological Survey of Iran (GSI), 1067 stream sediment samples were collected from Varzaghan 1:100,000 quadrangle map with a density of one sample per 2 km2, for regional exploration. Fig. 1c shows the location of geochemical stream sediment samples over the relevant drainages. The samples were sieved, and the < 80 μm pulps were retained for inductively coupled plasma optical emission spectrometry (ICP-OES) analysis for 44 elements, except for Au, which was analyzed by fire assay method. The detection limits of the selected elements are: 0.2 ppm for Cu, 0.1 ppm for Mo, 1 ppb for Au, and 0.1 ppm for Bi. In addition, the method of Thompson and Howarth (1976) was implemented for assessment of analytical precision using duplicate samples. The precision was mainly better than 10% for selected elements.
In the northern parts of Arasbaran, especially the Varzaghan district, porphyry deposits produced geochemical signatures (genetically, spatially, and temporally with intrusive rocks) of Cu, Au, Mo and Bi (Jamali et al., 2010; Maghsoudi et al., 2014), leading to the discovery of prospective areas of porphyry-Cu mineralization targets. From a geochemical point of view, Cu may have a close association with Au, Mo, and Bi elements in Cu–Mo and Cu–Au porphyry deposits in the study area and therefore, geochemical signatures of these four elements may be vectors towards porphyry copper deposits. Thus, in the current study, Cu, Au, Mo, and Bi elements were applied to generate the uni-element geochemical maps.
The statistical analysis was carried out by SPSS 22 software. The simple substitution method was implemented for creating an uncensored data set, e.g., replacement by 3/4 of the lower detection limits. Raw data have mean values of Cu, Mo, Bi and Au, which are 66, 2.2, 0.31 ppm and 8 ppb, respectively (Table 1). The skewness values of the raw data of Cu, Mo, Bi and Au (8.08, 6.64, 6.16 and 3.11, respectively) suggest that the original datasets of selected elements are not normally distributed and show tendencies towards lognormal distributions. Since most of the statistical methods comply with the normal distribution assumption, normalizing the original geochemical data by an appropriate method such as ln conversion function provides a suitable condition to decrease the difference between extreme high and low values of geochemical data for better comparison. Therefore, the individual raw geochemical data of Cu, Mo, Bi and Au were normalized by conversion into their logarithms (ln conversion). The Q–Q plots of the ln-transformed data were also drawn (Fig. 2) and illustrate that there are some outliers in data set, and consequently, the geochemical data are not log-normally distributed. According to Reimann et al. (2002), there are multiple populations in the data set, which can be related to the influence of diversity of geological processes (Zuo, 2011a; Zuo et al., 2009).
Summary of statistical values for the −80 mesh stream sediment geochemical data set of the Varzaghan area.
| Element | Mean | Median | Standard deviation | Maximum | Minimum | Skewness | Kurtosis |
| Au | 8 | 3.2 | 14.29 | 95 | 1 | 3.11 | 10.03 |
| Bi | 0.3 | 0.2 | 0.37 | 4.9 | 0.02 | 6.16 | 50.66 |
| Cu | 66 | 44.05 | 107.18 | 1398 | 0.2 | 8.08 | 80.43 |
| Mo | 2.2 | 1.2 | 4.53 | 56 | 0.1 | 6.64 | 53.44 |
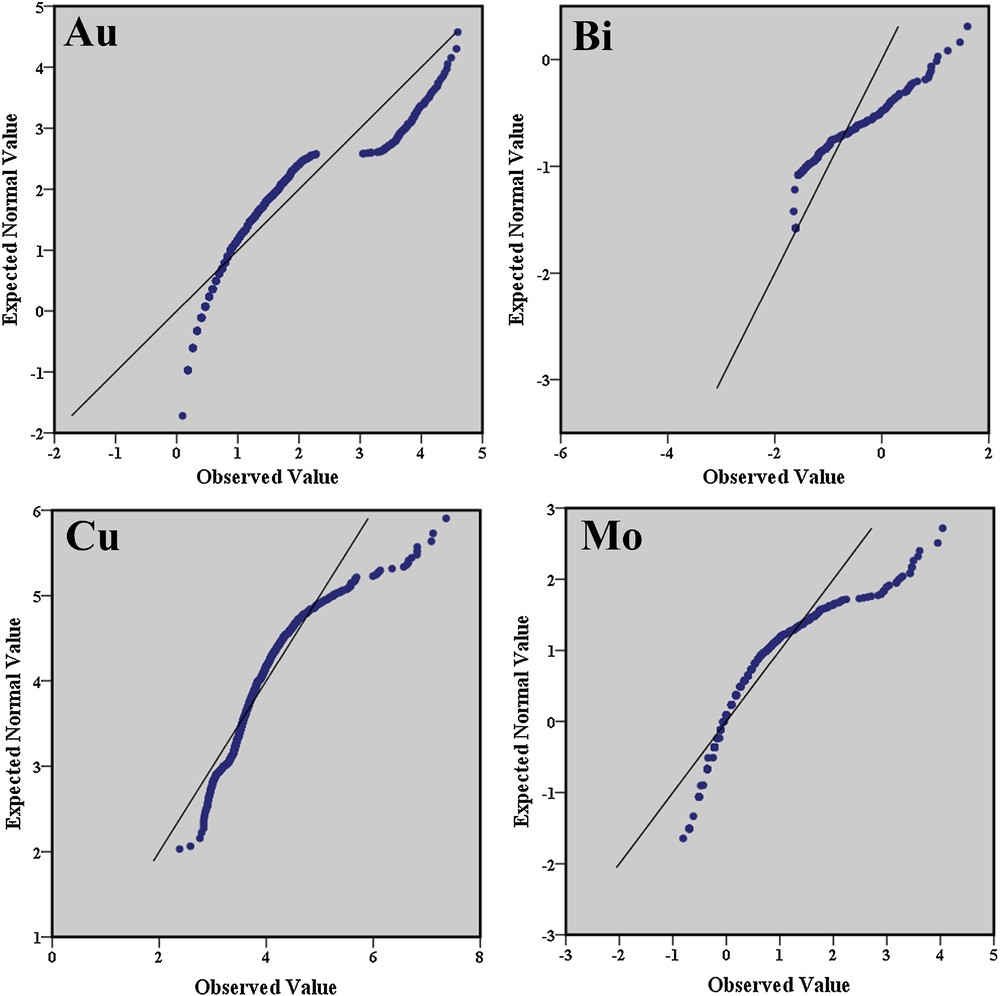
Q–Q plots of the ln-transformed values of Au, Bi, Cu, and Mo.
Besides, to specify the inter-relations between the investigated elements as uni-variate analysis, Pearson's correlation coefficients were calculated among logarithmic data (Au–Bi–Cu–Mo), and the results show a high positive correlation between logarithmically transformed element pairs. Accordingly, Cu mineralization is genetically associated with Au, Bi, and Mo within the study area (Table 2).
Pearson correlation coefficient among ln-transformed data of Au, Bi, Cu, and Mo.
| Au | Bi | Cu | Mo | |
| Au | 1 | |||
| Bi | 0.506 | 1 | ||
| Cu | 0.568 | 0.576 | 1 | |
| Mo | 0.523 | 0.606 | 0.724 | 1 |
In the current study, the central part of the Varzaghan district has been used to generate geochemical anomaly maps. The central part of Varzaghan district was gridded by 73 × 73 m2 cells, which were calculated based on the geometrical properties and number of collected samples of the study area (Hengl, 2006). IDW and different Kriging (e.g., ordinary, Gaussian, spherical and cokriging) surface interpolation techniques are the most popular methods that have their own advantages and disadvantages. Overall, kriging-based interpolation techniques can be used properly to estimate elemental concentrations in unsampled areas (Cheng, 2000). Although all mentioned interpolation methods are extensively performed in geosciences, especially in stream sediment geochemical modeling, because of the minimization of the variance of the estimation error, the OK could be considered as the best linear unbiased interpolation method (Zhong et al., 2016). Uni-elemental spatial distribution models were performed by Arc GIS 10.2 software generated by the OK interpolation method. The omni-directional variograms and their fitted spherical models for selected elements were plotted by SGeMS software based on the ln-transformed data (Fig. 3).
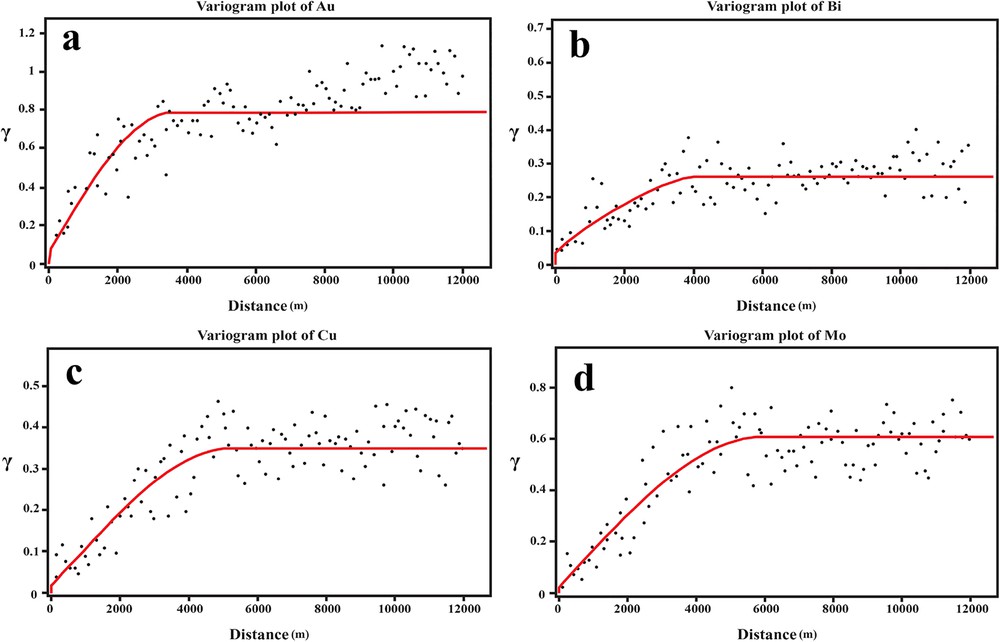
Omni-directional variograms and their corresponding fitted models for (a) Au, (b) Bi, (c) Cu, and (d) Mo.
To better distinguish and evaluate anomalous from background contribution, a logistic transformation is used for the conversion of the values of uni-elemental geochemical signatures to a positive domain ([0,1] range). For this purpose, we used a logistic function based on s and i parameters as slope and inflection point, respectively (Parsa et al., 2016c; Yousefi et al., 2014). The logistically transformed values of elements under investigation were used as inputs to Arc GIS 10.2 software and the interpolation maps of these elements, derived from the OK method, were also generated using this software (Fig. 4).
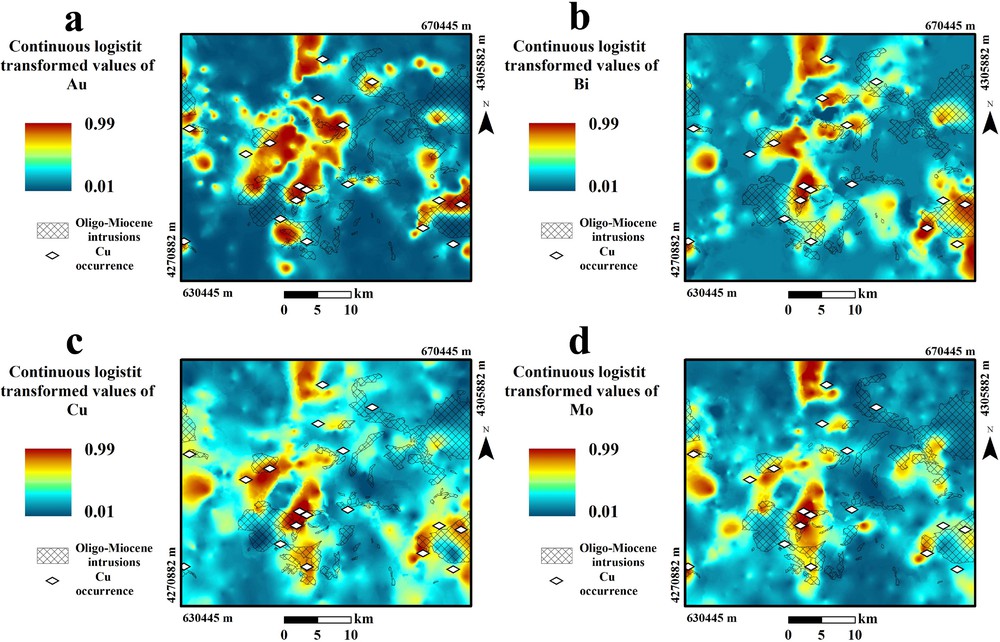
Spatial distribution maps of geochemical anomalies of the logistically transformed values of (a) Au, (b) Bi, (c) Cu, and (d) Mo.
5 Results and discussion
5.1 C–A fractal model
Based on the interpolated maps of logistically transformed values of Au, Bi, Cu, and Mo using the OK method (Fig. 4), the C–A log–log plots, consisting of the logistically transformed values of gridded uni-element geochemical maps (ρ), versus the number of grid pixels with the values of Au, Bi, Cu, and Mo greater than or equal to ρ, were generated (Fig. 5). Breaks between straight-line segments and the corresponding values of ρ were used as a cut-off to classify pixel values in the OK interpolated maps. These lines were optimally fitted based on the least-square method, as the addition or reduction of any other straight lines lowered the regression coefficient of these lines (Cheng et al., 1996). Based on the log–log plots of the selected elements, there were five different threshold values and thus six different geochemical populations for Au and Mo, four different threshold values and five different geochemical populations for Cu and three different threshold values and four different geochemical populations for Bi (Fig. 5). The different threshold values and corresponding classes of C–A fractal model are shown in Table 3.
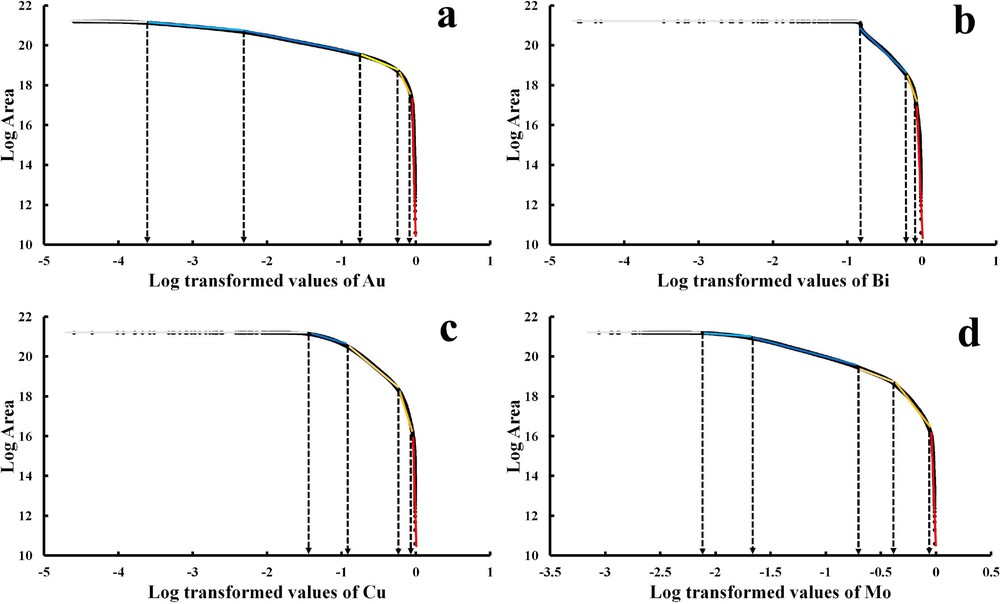
C–A log–log plots of the logistically transformed values of (a) Au, (b) Bi, (c) Cu, and (d) Mo.
Thresholds of C–A fractal and U-spatial statistics methods for different geochemical populations of Au, Bi, Cu and Mo.
| Elements | C–A fractal | U-spatial statistics | ||
| Class | Threshold values | Class | Threshold values | |
| Au | 1 | 0.01–0.04 | Umin–Ū | –0.69–0.1 |
| 2 | 0.04–0.1 | Ū–Ū + S·D | 0.1–0.84 | |
| 3 | 0.1–0.48 | Ū + S·D–Ū + 2S·D | 0.84–1.58 | |
| 4 | 0.48–0.8 | Ū + 2S·D–Ū + 3S·D | 1.58–2.32 | |
| 5 | 0.8–0.94 | Ū + 3S·D–Umax | 2.33–2.77 | |
| 6 | 0.94–0.99 | - | - | |
| Bi | 1 | 0.01–0.44 | Umin–Ū | –5.24–0.09 |
| 2 | 0.44–0.79 | Ū–Ū + S·D | 0.09–0.85 | |
| 3 | 0.79–0.92 | Ū + S·D–Ū + 2S·D | 0.85–1.61 | |
| 4 | 0.92–0.99 | Ū + 2S·D–Ū + 3S·D | 1.61–2.37 | |
| - | - | Ū + 3S·D–Umax | 2.37–3.36 | |
| Cu | 1 | 0.01–0.24 | Umin–Ū | –2.59–0.15 |
| 2 | 0.24–0.38 | Ū–Ū + S·D | 0.15–0.88 | |
| 3 | 0.38–0.74 | Ū + S·D–Ū + 2S·D | 0.88–1.61 | |
| 4 | 0.74–0.96 | Ū + 2S·D–Ū + 3S·D | 1.61–2.34 | |
| 5 | 0.96–0.99 | Ū + 3S·D–Umax | 2.34–3.21 | |
| Mo | 1 | 0.01–0.14 | Umin–Ū | -1.56–0.14 |
| 2 | 0.14–0.21 | Ū–Ū + S·D | 0.14–0.92 | |
| 3 | 0.21–0.52 | Ū + S·D–Ū + 2S·D | 0.92–1.7 | |
| 4 | 0.52–0.72 | Ū + 2S·D–Ū +3S·D | 1.7–2.48 | |
| 5 | 0.72–0.96 | Ū + 3S·D–Umax | 2.48–3.36 | |
| 6 | 0.96–0.99 | – | – |
Due to C–A log–log plots of logistically transformed values of Au and Mo (Fig. 5a, d), six different geochemical populations are considered as low background, moderate background, high background, weak anomaly, high anomaly, and extreme anomaly, respectively. The C–A log–log plot of logistically transformed values of Cu (Fig. 5c), also demonstrates five different geochemical populations including low background, high background, weak anomaly, high anomaly, and extreme anomaly. Furthermore, geochemical populations based on the C–A log–log plot of logistically transformed values of Bi (Fig. 5b), show low background, high background, weak anomaly, and extreme anomaly classes. Visually, the weak anomaly, high anomaly, and extreme anomaly classes of each uni-element geochemical signature obtained with the C–A fractal model, appear to be highly correlated to some of the outcrops of Oligocene–Miocene intrusive rocks in the study area, which are the main hosts of porphyry Cu mineralization. Moreover, the majority of the already known porphyry Cu occurrences of the Varzaghan district demonstrate positive spatial association with the low anomaly, high anomaly, and extreme anomaly populations (Fig. 6).
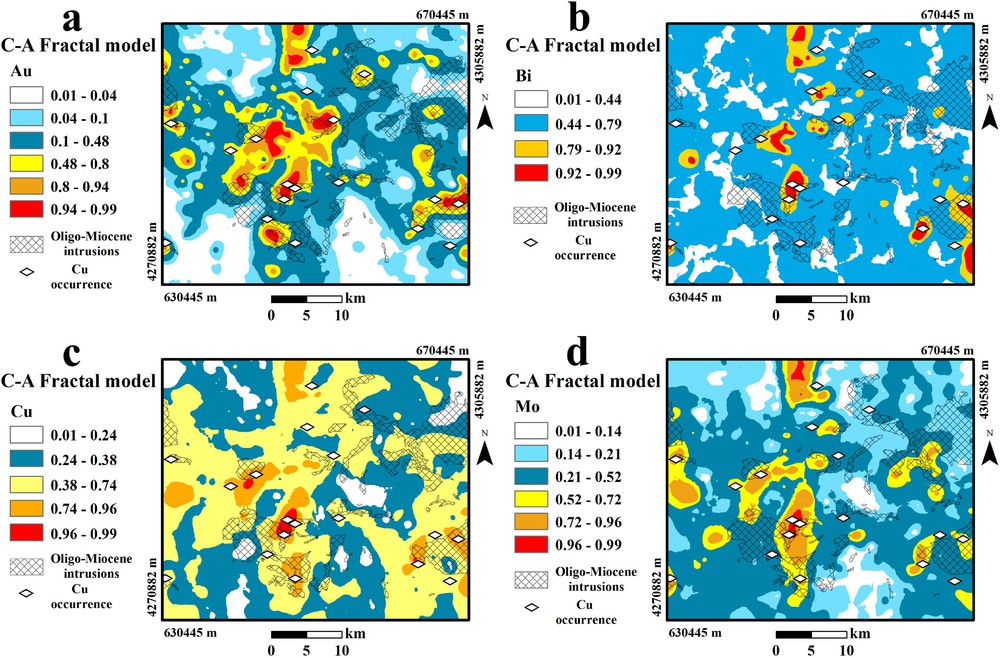
Spatial distribution maps of geochemical populations of (a) Au, (b) Bi, (c) Cu, and (d) Mo obtained by the C–A fractal model.
5.2 U-spatial statistics model
To calculate the U-values of logistically transformed values of Au, Bi, Cu, and Mo, a MATLAB-based program was implemented. For each station, the best window was selected based on the maximum absolute U-values and thus, a 200-m radius was determined for calculating the U-values (Cheng, 1999). In the next step, the histograms of the calculated U-values for selected elements were drawn (Fig. 7). For separating geochemical anomalies based on the U-spatial statistics method, the calculated U-values were interpolated using the OK method and the cut-off values of U, U + S·D, U + 2S·D and U + 3S·D were determined for separating anomalous populations from background values. Diverse enrichment steps derived by U-spatial statistics method are shown in Fig. 8. Based on the U-values histograms (Fig. 7) for Au, Bi, Cu and Mo, five different geochemical populations are delineated. The population below U and between U and U + S·D constituted low background and high background (Table 3), respectively. Whereas the populations higher than U + S·D (U + S·D < U(i) < U + 2S·D, U + 2S·D < U(i) < U+3S·D and U(i) > 3S·D) are considered as weak anomaly, high anomaly, and extreme anomaly, respectively (Table 3).
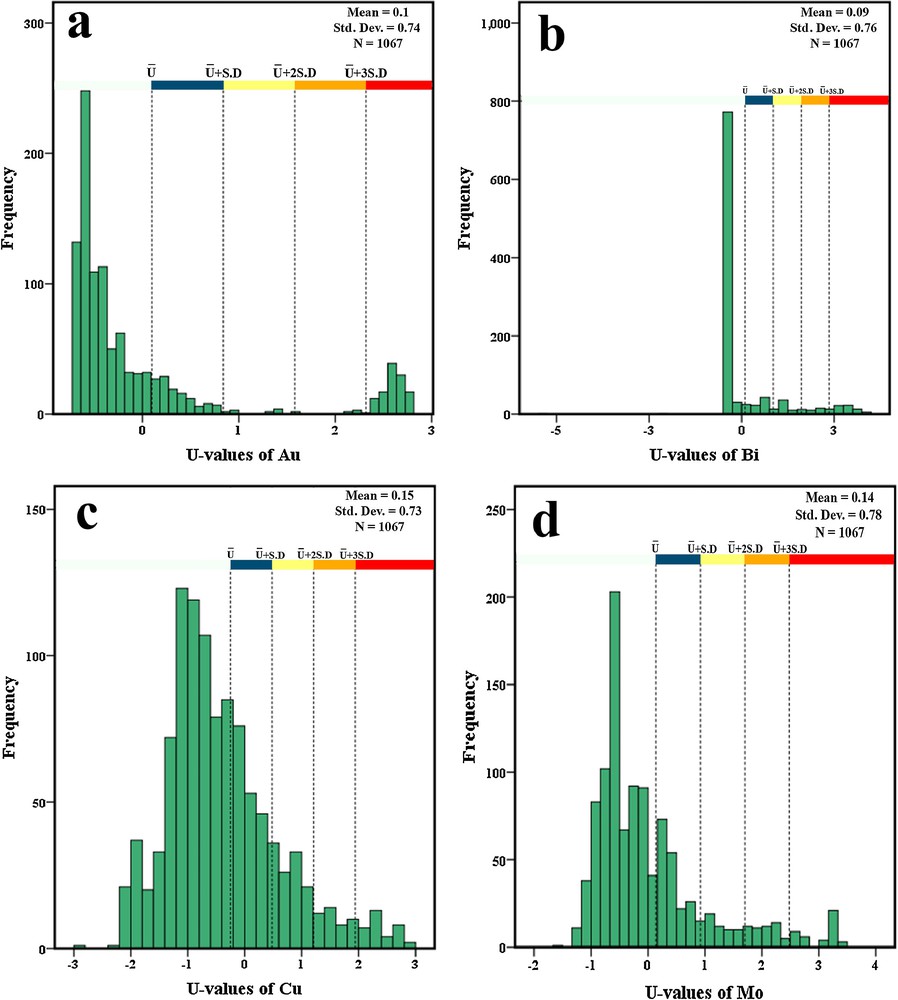
Histograms of the U-values of the logistically transformed values of (a) Au, (b) Bi, (c) Cu, and (d) Mo.
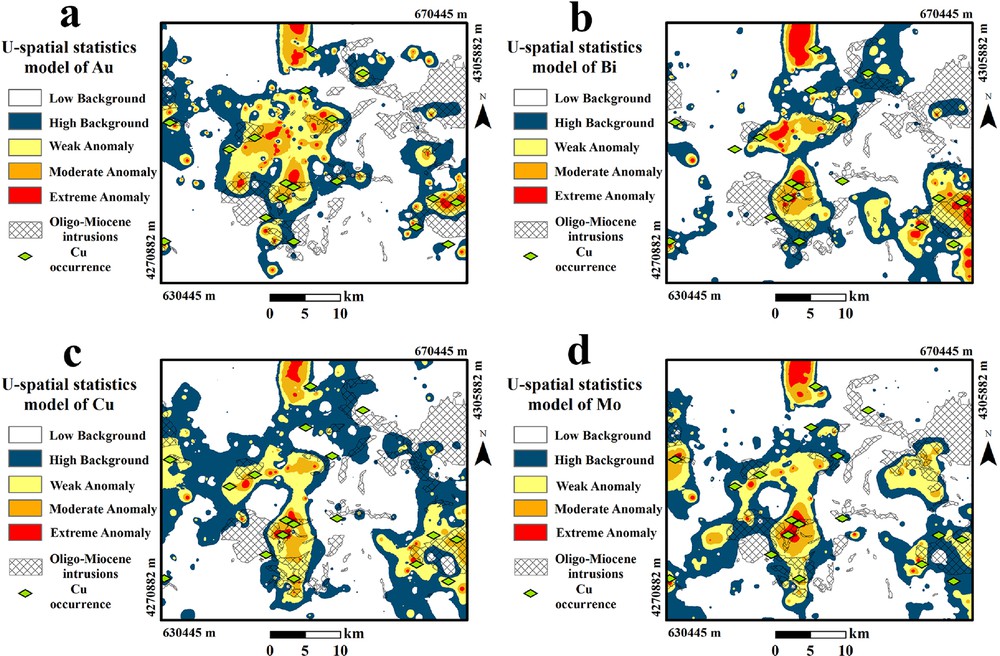
Spatial distribution maps of geochemical populations of (a) Au, (b) Bi, (c) Cu, and (d) Mo obtained by the U-spatial statistics method.
The resulting populations of weak anomaly, high anomaly, and extreme anomaly obtained by the U-spatial statistics method were correlated to the already known Cu porphyry occurrences within the study area. Besides, the most outcrops of intrusions, hosting the porphyry Cu mineralization in the study area (Hezarkhani, 2006), are closely related to anomalous populations.
5.3 Comparison of the results
For investigating the efficiency of discretized uni-elemental geochemical maps, which are resulted from C–A fractal and U-spatial statistics modeling, the locations of known mineral occurrences and occupied areas of different geochemical populations were used. For this, a credible approach, namely a success-rate curve (Agterberg and Bonham-Carter, 2005), was adopted to compare and evaluate the effectiveness of the achieved models. A success-rate curve is drawn by plotting the proportion of mineral deposits, Pr, predicted correctly in vertical axis versus the proportion of the study area classified as prospective, Oa, in horizontal axis. If the success rate of a geochemical model appears above the success-rate curve of another geochemical model, the former model has a stronger spatial association with the known mineral occurrences (Parsa et al., 2016a, 2016b). On the other hand, there are positive spatial associations between the uni-elemental geochemical layers and the related mineralization in the study area, if the success-rate curve of each evidence layer appears high above the diagonal line (the so-called gauge line), and conversely.
In this paper, the obtained threshold values based on C–A fractal and U-spatial statistics models (Table 3) have been used to draw success-rate curves of four uni-element geochemical signatures (Fig. 9). According to this figure, the success-rate curves of all geochemical layers are placed above the gauge line and it can be concluded that both methods (C–A fractal and U-spatial statistics) are successful in separating the anomaly populations from background values related to porphyry Cu mineralization. However, the success-rate curves of the U-spatial statistics models have appeared above those of the C–A fractal models (Fig. 9), which shows that the U-spatial statistics is the superior model in the visualization of the geochemical data of the Varzaghan district.
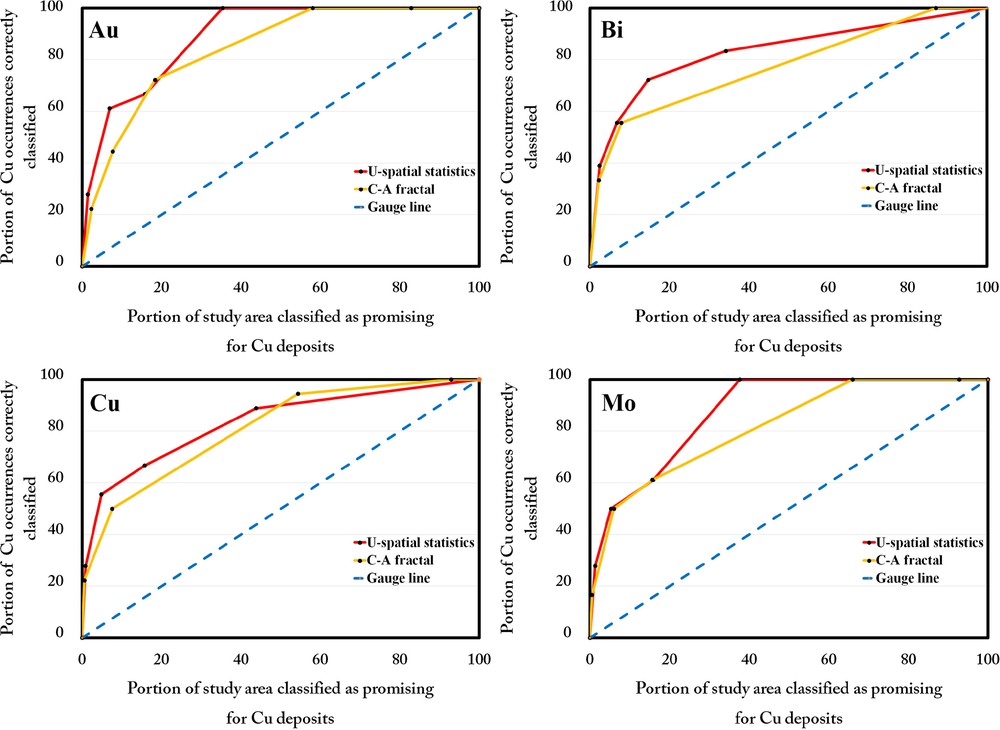
Success-rate curves for C–A fractal and U-spatial statistics models of (a) Au, (b) Bi, (c) Cu, and (d) Mo.
Visually, the resulting anomalies derived by U-spatial statistics as an example of window-based method and fractal model were also compared and correlated to tectonic and lithological settings. In most parts of the study region, tectonic setting plays an important role in controlling porphyry Cu mineralization, hydrothermal alteration, and geochemical anomalies, especially where faults and lineaments intersect the area. They act as conduits structures for mineralization and favorable place for prospecting purposes (Maghsoudi et al., 2014; Pirajno, 2010). Besides, the anomaly populations of two methods are spatially associated with most of the outcrops of calc-alkaline intrusions (monzonite/quartzmonzonite and diorite/granodiorite rocks) (Hezarkhani, 2006) within the study area. According to the anomaly maps, it can be concluded that most of the Au, Bi, Cu and Mo anomalies located in the central parts of the study area, and also in the southeastern and western parts and high-intensity anomalies coincide with the outcrops of Oligocene–Miocene intrusions. Consequently, these intrusive rocks can be considered as an effective lithological criterion in porphyry Cu mineralization. Similarly, as can be seen in Figs. 6 and 8, the existing anomaly populations (extreme anomaly, high anomaly, and low anomaly classes) of investigated elements that, derived by U-spatial statistics and the fractal method, are strongly correlated with porphyry Cu occurrences in the study area. This reveals that the employed methods can make us distinguish anomalies associated with mineralization from background values.
6 Conclusion
In this paper, a fractal-based method, namely the concentration-area (C–A) model and a window-based method, the U-spatial statistics approach, were used to characterize various geochemical populations and to detect anomalies associated with porphyry Cu mineralization in the Varzaghan district (NW Iran). Initially, the OK method was performed to interpolate logistically transformed values of the mineralization-related elements (Au, Bi, Cu, and Mo) in the study area. Subsequently, C–A fractal and the U-spatial statistics methods were applied to categorize different classes of geochemical datasets in the Varzaghan district. The obtained results were quantitatively evaluated based on the locations of known porphyry-type Cu occurrences using success-rate curves. The quantitative comparison of implemented methods demonstrates the superiority of the U-spatial statistics method over the C–A fractal model. In addition, anomalies of both methods represent a significant spatial association with the known Cu occurrences, and also with the Oligocene–Miocene intrusive bodies, as geological proxies of porphyry Cu mineralization in the study area.
Acknowledgment
The authors are appreciative of Prof. F. Chabaux, Associate Editor and two anonymous reviewers, as well as Prof. H. Yilmaz and Dr. M. Sadeghi for their constructive comments, which significantly helped improve this paper.