

 CC-BY 4.0
Cities and climate
Until the middle of the 19th century, almost the entire human population lived in rural areas. The situation changed abruptly in Europe during the industrial revolution with the appearance of rapid urban population growth, a phenomenon that gradually affected the rest of the world as the 20th century progressed. Unprecedented in history, it is estimated that there are now more people on the planet living in cities than in the countryside. This has been the case for about ten years (Figure 1). The latest figures published by the United Nations [UN 2018] estimate that in 2018, 55.3% of the world's population lived in cities, a proportion that could reach 60% in 2030.1 Four fifths of North Americans and more than 90% of Belgians, Uruguayans, Israelis, Japanese, and Gabonese live in cities. The proportion of urban dwellers is lower in developing countries, but is close to 52% and growing steadily.
Because of their demographic weight, cities are responsible for the majority of global energy consumption: between 67 and 76% [IPCC 2014d]. Some cities consume as much energy as entire countries. London, for example, with a population of around 7.8 million, consumes about as much energy as Ireland (Source: Eurostat and UK department of energy and climate change).

Evolution of global urban and rural populations. Values after 2018 are demographic projections. United Nations, World Urbanization Prospects (2018).
It can be noted that the share of the world's energy consumed by cities is greater than the share of the world's population living there (67-76% compared to 55%). This may seem counterintuitive because in developed countries, in general, energy consumption per person tends to be lower in cities than in rural areas. This is due to a higher population density which allows for efficiency gains and limits the need for long journeys. However, in developing countries, the reverse is true: per capita energy consumption is generally higher in cities than in the countryside. This is because urban residents tend to be richer and have more access to energy-consuming services than rural residents [IPCC 2014d]. This effect generally prevails against efficiency gains in both developing and developed countries. An extreme example is China in the mid-2000s, where per capita energy consumption in cities was almost 80% higher than the average consumption in the country [IEA 2008].2 As more than three quarters of the world's urban population lives in a developing country, this is the trend that is observed on average.
Cities are also important places when it comes to our vulnerability to climate change, as they are places of extreme population density. They cover only 0.4 to 0.9% of the Earth's total land surface [Esch et al. 2017; Zhou et al. 2015] in which, we recall, more than 50% of the planet's population is concentrated. This means that any extreme weather event affecting urbanised areas can have significant impacts. This is all the more true as cities are not randomly distributed on the surface of the globe. Many cities are located along waterways or sea surfaces due to the important historical role played by shipping for trade. These areas are particularly vulnerable to disasters such as floods [IPCC 2014b].
The concentration of inhabitants itself is a risk factor for certain impacts of climate change, such as the spread of diseases or the increase in heat waves. In the latter case, the explanation comes from the fact that cities generate a microclimate, the urban heat island effect, which increases temperatures (up to 7 degrees at night in Paris, see Lemonsu et al. [2013] for example) and multiplies the impact of heat waves on health. This effect is all the more important the more the city is populated and dense [Lemonsu et al. 2015].
2. The window of opportunity
These issues, both those relating to vulnerability to the impacts of climate change and those relating to greenhouse gas emissions, depend crucially on how cities are built. It is important to note that we are currently experiencing what is called a 'window of opportunity' regarding each of them.
Once a city is built, it is very difficult indeed to go back and adapt the existing one. It is first of all difficult to modify the buildings, but also the networks and even more so the layout of the city. To be convinced, it is enough to look at the French bastides for example, cities whose layout of the streets remains approximately the same as when they were founded in the Middle Ages more than 700 years ago... Things are much simpler when you are building a city and there are numerous choices of layout and organisation available to you. It is at this point that what the city will look like for decades or even centuries to come is decided. However, the world is currently urbanising at an incredible rate. It is now the moment to decide whether the cities being built are and will be adapted to climate challenges.
The numbers are unprecedented in history: not only is the share of the world's population living in cities increasing, as we have indicated above, but the world population itself is growing rapidly. The combination of the two is leading to an explosion in the number of urban inhabitants. The United Nations estimates that by 2050, compared to 2010, the urban population will have nearly doubled. In fact, the majority of the world's population growth will take place in cities, with the rural population remaining almost stable or even declining in absolute number (see, for example, Figure 1). Every day, on average, there are 220,000 more urban residents in the world. This is more each week than the equivalent of the population of Munich, or of the entire Lyon agglomeration. This is the equivalent of requiring the entire Ile-de-France (Parisian region) to be built every two months!
Moreover, this growth is not uniform between cities. While the number of megacities with more than 15 million inhabitants is projected to increase from 16 today to 24 in 2030, two thirds of them are expected to see only modest population growth (less than 2% per year). The bulk of urban growth is expected to take place in medium-sized and small cities with populations of less than 1 million, which already account for more than 60% of the world's urban population [UN 2018].
3. How can we reduce emissions from cities?
Measuring a city's emissions is a complicated exercise that faces two major obstacles [Hoornweg et al. 2011a, b]. First, there is no universally accepted definition of the boundaries of a city. This means that the values for cities in different countries may reflect differing realities.3 Second, there is also no consensus on the delimitation of the activities that should be taken into account. For example, it must be decided whether the generation of electricity and its associated emissions are the "responsibility" of those who produce it or of those who consume it. The same applies to goods and services purchased by residents: to whom should emissions associated with resource extraction, transport, and the industrial processes necessary for their production and distribution be attributed?
Standards have been proposed to harmonise responses to these questions, and several initiatives are attempting to establish comparable emissions inventories across cities [C40 2014, 2018; Hoornweg et al. 2011a, b; IPCC 2014d; Nangini et al. 2019]. Their main conclusion is that even relative to the number of inhabitants, the levels of GHG emissions vary greatly from one city to another. A second important conclusion is that even if rich cities tend to consume more energy than poor cities, and therefore emit more under similar climatic conditions, there is no inevitable relationship between economic wealth and the level of GHG emissions. This is particularly the case if emissions accounting excludes the consumption of manufactured goods by inhabitants; emissions in this case may be very low in some cities with adapted urban planning.
To understand which characteristics or policies allow cities to be on a low-carbon pathway, let's look in more detail at two particularly significant sources of urban emissions: building and transport emissions. For example, in European cities, these two items are the main sectors on which municipal emission reduction strategies are focused [Reckien et al. 2018].
4 Buildings
In 2014, energy for residential and commercial buildings accounted for 31% of the world's final energy use and 54% of electricity demand. This corresponded to 23% of energy-related GHG emissions (one third of which came from direct use of fossil fuel energy) [IEA 2017; Masson-Delmotte et al. 2018]. These emissions come from energy used for heating, air conditioning, cooking, and various household equipment. In countries with high urban growth, such as China, emissions related to the construction of new housing must also be added [Zhu et al. 2020].
All of these emissions are increasing. With the increase in the world's urban population and improved access to household appliances in developing countries, it is projected that energy use in buildings will double or triple by the middle of the 21st century [IPCC 2014c]. However, and this is the central point in this sector, there are already many well-established technological solutions that make it possible to significantly reduce the energy consumption of buildings. It is thus estimated that the widespread dissemination of current best-performing construction practices and technologies would prevent the increase in consumption we have just mentioned, and even reduce energy consumption in buildings compared to today, despite the increase in world population and the growth of cities [IPCC 2014c].
The major challenge in this sector is therefore to successfully disseminate these techniques, and to understand where the barriers to this dissemination lie. This is a complex issue because, in general, it is not cost that is the problem; in most cases, reducing the energy consumption of buildings is profitable after a few years thanks to the energy savings made. The obstacles are more related to the lack of information, the lack of incentives, the lack of funds to finance the initial installation of equipment, or policies of subsidising the price of energy, which eliminates any financial advantage to reducing energy consumption.
Let us take two examples of obstacles that can be observed in France (and in many other developed countries) [Giraudet 2011]. First example: no one has an interest in insulating a dwelling that is rented. Indeed, the cost of the work is the responsibility of the landlord, whereas the energy savings go to the tenant. One way of combating this phenomenon would be to take proper account of the level of insulation of the housing in the price of rent. The state can try to promote it notably by requiring an energy performance diagnosis with the lease, so as to inform the tenants. Second example [Giraudet and Houde 2014]: the insulation of a dwelling requires an investment (an additional cost), and, as we have said, are often profitable after some time via the savings made. However, if after a few years it becomes clear that the work has been poorly done, the equation changes completely, and the situation is no longer profitable for the person who paid for the work without obtaining the savings they hoped for. Therefore, there is a risk that can reduce the demand for insulation installation. The certification policies of businesses and craftsmen are an example of schemes put in place to try to overcome this barrier.
Another challenge in the construction sector, beyond technology, is the central role played by behaviours and lifestyles. Paying attention to your energy consumption in your daily life can reduce your consumption by almost a factor of 2 [IPCC 2014c]. The so-called "rebound effect" is a good illustration of the role played by behaviours [Sorrell et al. 2009]: it is generally observed that, when housing is insulated, residents take advantage of it to heat it up (maintain warmer temperatures) more than before. This behaviour makes sense, since heating costs less to them than before, but it cancels out some of the expected energy savings. This phenomenon, which is well-studied and well-quantified, is now taken into account statistically in national energy planning and the implementation of building insulation policies.
Another notable challenge is the difficulty posed to the construction sector by the effects of climate change itself. By changing temperatures, it will indeed change heating and air conditioning needs in the future, making the design of buildings intended to last several decades more complex [De Cian and Wing 2019; Hallegatte et al. 2007]. The main challenge is to succeed in avoiding a massive use of air conditioning in a few years, which would lead to a vicious cycle in which global warming itself would lead to more GHG emissions [Viguie et al. 2020].
5. Transport
Transport plays a particularly important role in the city for the movement of goods and people. In 2014, the transport sector accounted for around 28% of global energy consumption and 23% of energy-related emissions [IEA 2017; Masson-Delmotte et al. 2018]. It is a sector in which oil consumption is particularly intense: more than 90% of the energy used for transport comes from oil, which means that this sector alone accounts for nearly two thirds (65%) of the world's oil demand. It is estimated that nearly 40% of global energy demand is in urban transport [IEA 2013].
Transport-related emissions are highly unevenly distributed around the world: even disregarding air transport, 10% of the world's population is responsible for nearly 80% of total motorised mobility (expressed in passenger.km), while most of the population almost never travels by motorised means [IPCC 2014a]. Transport-related emissions are now dominated by developed countries, although in recent years there has been rapid growth in Asia, both in car mobility and in light two- or three-wheeled vehicles. Both of these have more than doubled (in passenger.km) between 2000 and 2010.
To date, there has been a strong link between economic growth and the development of such motorised transport: the more developed a country is, the greater the proportion of travel that is made by motor vehicles, especially cars, tends to be [IPCC 2014a]. This explains why emissions from this sector have grown sharply in recent years, by 2.5% per year on average between 2010 and 2015, more than in any other sector, in parallel with the economic growth of developing countries. This is illustrated, for example, in Figure 2, which shows the rising trend in the transport sector's share of emissions from 1970 to 2010, increasing progressively as the economy grows. Reducing emissions from transport requires, as in the building sector, the widespread implementation of reduced-emission technologies, such as electric vehicles. However, it should be noted that in this sector, this is only one aspect of the issue, the other essential aspect being the choice of transport infrastructure and layout. These choices are decisive regarding the distances travelled and the modes of transport used.
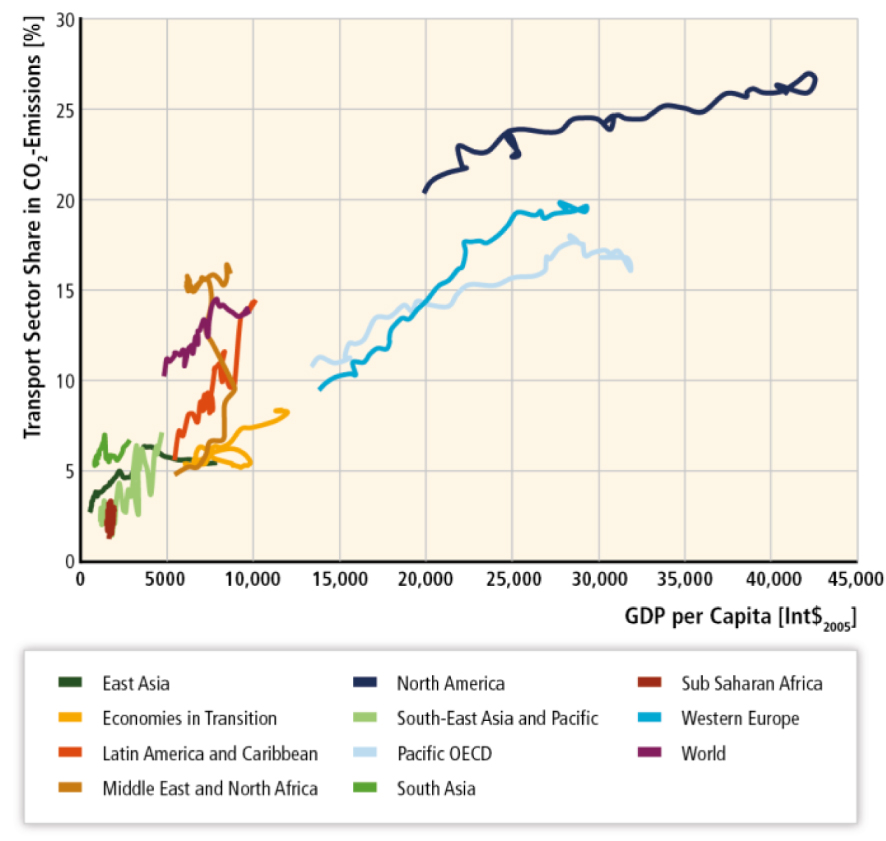
Relative share of total GHG emissions for transport relative to GDP per capita from 1970 to 2010 for each region and the world. Source: IPCC [2014a].
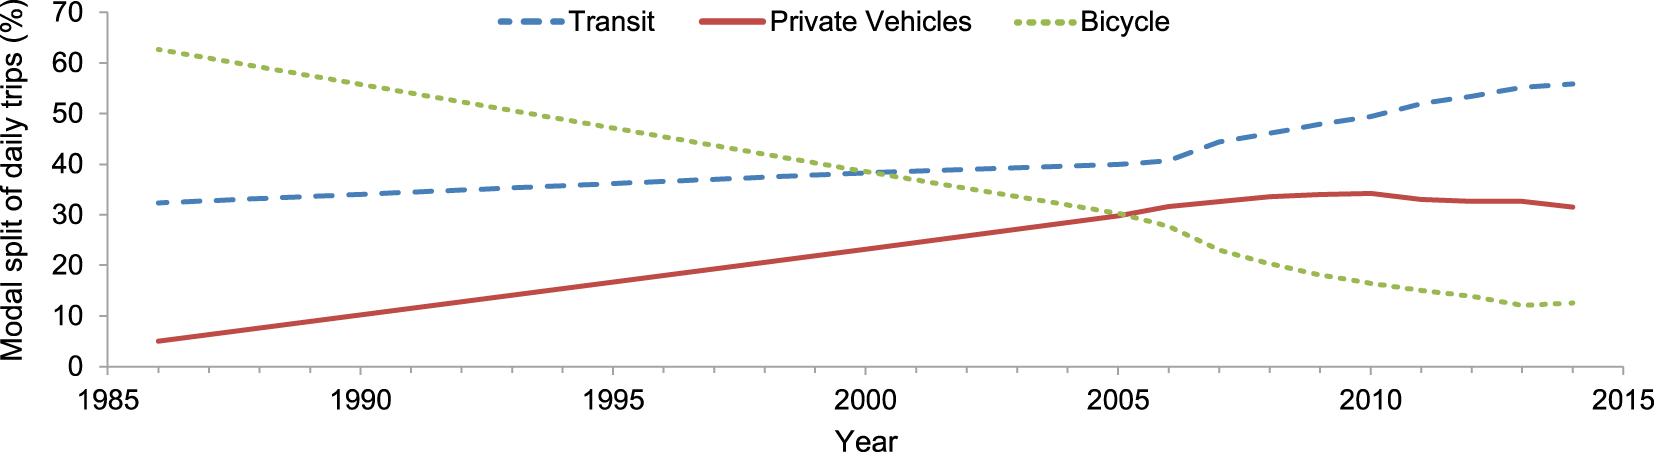
Modal split data in Beijing between 1986 and 2014. Source: IPCC (2018), from Gao and Newman (2018).
Figure 2 also illustrates these ideas. In fact, there is no single pathway that countries would follow. A comparison of the pathways of North America (dark blue) with those of Europe and the OECD countries of the Pacific zone (Japan, Korea, Australia, New Zealand) shows that, for a similar level of GDP per person, these zones have very different levels of emissions from transport. This is largely due to infrastructure policies, land use, and very different urban planning choices. Knowing what pathway developing countries will follow is a crucial issue for climate.
Although the link between GDP growth and motorised mobility growth has been valid for several decades, we are now beginning to observe the first signs of decoupling between them [Masson-Delmotte et al. 2018]. Car use is declining in several cities in developed countries, replaced by public transport which produces much less emissions, electric vehicles, or non-motorised modes. Similar developments are also occurring in cities in Latin America and China. Figure 3 shows the evolution of the modal shares of cars, bicycles, and public transport in Beijing from 1986 to 2014. Car use, which increased initially, began to decline around the 2010s, replaced by public transport. Several factors explain this decoupling in the cities where it takes place: the development of new public transport, the emergence of new modes of transport such as electric bicycles, and urban planning policies to maximise the use of public transport or soft modes (walking, cycling...).
Urban planning policies play a fundamental role in the distances travelled and the choice of transport mode [IPCC 2014d]. Promoting mixed-use zones (jobs and housing mixed in neighbourhoods) and developing streets to promote soft modes (walking, cycling) are examples of practices that have a positive impact on transport-related emissions. At the urban area level, city density also plays an important role. By reducing the distance of travel and making it easier to develop public transport networks, this density plays an essential role.
Examples of this are numerous. The case of Barcelona and Atlanta is quite illustrative [Bertraud and Richardson 2004]: the two cities have roughly the same population (5.3 million in Atlanta and 5 million in Barcelona, when considering the greater metropolitan areas) and are located in developed countries. On the other hand, as can be seen in Figure 4, they were not built in the same way at all. Barcelona is much denser than Atlanta, which is 11 times larger in area. This difference is due in part to historical reasons; Barcelona was built largely in the 19th century, at a time when the norm for getting from one place to another was walking, whereas Atlanta was developed mainly in the 20th century, at a time when the norm was driving. Per capita transport emissions are around 6.9 tCO2/year in Atlanta and 1.16 tCO2/year in Barcelona, 6 times lower (source: LSE Cities). The two main reasons are those mentioned above: on the one hand, the distances to be covered in Barcelona are generally smaller than in Atlanta, and on the other hand public transport provides a large portion of transport needs. Barcelona's metro is 99 km long, and 60% of the city's population lives within 600 m of one of the 136 metro stations. A minimum of 3400 km of metro lines and 2800 stations would be required to achieve the same level of access to public transit in Atlanta, which would be a significant investment [Bertraud and Richardson 2004].
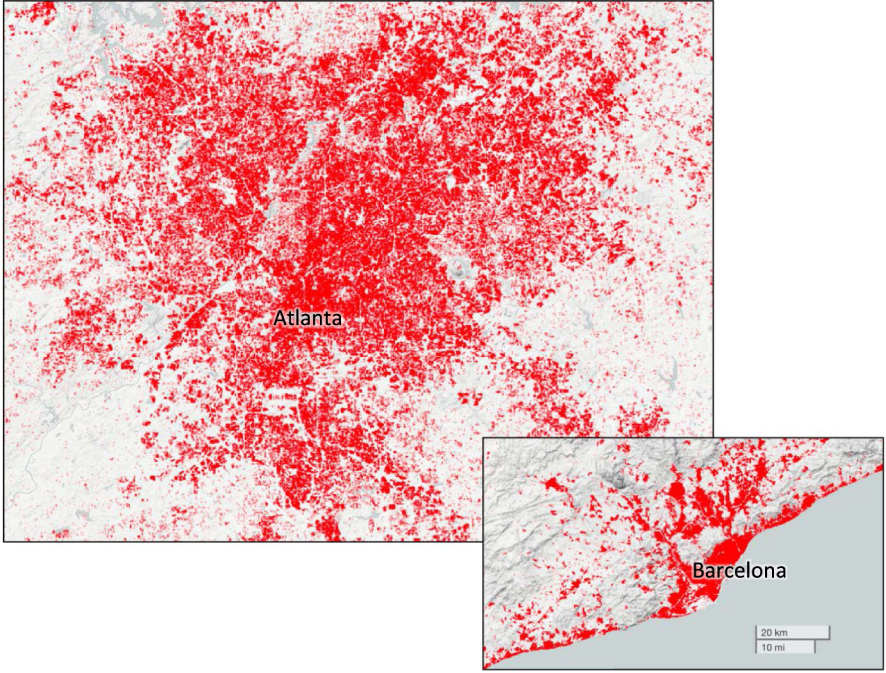
Urbanised areas of Atlanta and Barcelona represented at the same scale in 2015. Data: Copernicus Global Land Service: Land Cover 100 m © Copernicus Service Information 2020.

Area taken on the road to move the same number of people, by bus, by bicycle, and by car. Photo by Australian NGO Cycling Promotion Fund ©Cycling Promotion Fund.
However, the issue of urban density also illustrates the complexity of urban planning policies. Indeed, beyond transport issues, a dense city has many advantages (notably limiting the transformation of agricultural land), but also many defects [Lohrey and Creutzig 2015]: increased exposure to nuisances (noise, and potentially air pollution), reduced presence of green spaces within the city, increased urban heat island effect and therefore increased vulnerability to heat waves, etc. Research remains active on how to reconcile all these issues (see for example [OECD 2018]; [Pierer and Creutzig 2019]).
6. Urban climate policy issues and challenges
The question we have just discussed is in fact more broad: urban policies that concern climate issues are never decided in a vacuum. In addition to environmental issues, the managers of a city have to deal with many other very diverse issues (economic competitiveness, social issues, housing, etc.) that interact with them, and sometimes oppose them. However, one must note that in a very large number of cases, measures to reduce emissions from cities are rather measures that have positive co-benefits. The most emblematic example is the issue of air pollution. Insulating buildings and thus reducing heating with fuel oil or coal, promoting more efficient vehicles, and using soft modes and public transport are all policies that have direct impacts on outdoor air quality [Masson-Delmotte et al. 2018]. In many developing countries, indoor air quality is also a priority public health issue. Switching from wood, coal, or paraffin stoves and heaters to more modern electric or gas appliances can both reduce greenhouse gas emissions and greatly improve indoor air quality.
Another example is transport congestion. Travel by private car consumes a lot of space on the road, for both driving and parking vehicles. Figure 5 thus illustrates the space taken on the road to move the same number of people, by bus, by bicycle, and by car. Moving people by public transport or by bike means that many more people can be moved on the same stretch of road, thus reducing congestion.
These questions are important because they explain that the situation, when it comes to reducing GHG emissions, is very different at the state or city level [Ostrom 2010]. At the state level, reducing emissions is often seen as leading to loss of competitiveness, leading to reluctance to act if other states do not do so as well. On the other hand, at the city level, reducing emissions is often seen as improving the quality of life of the inhabitants and the attractiveness of the city. This means that cities and local communities are generally much more likely to take action to reduce emissions than the countries in which they are located [Rosenzweig et al. 2010].
Some projects are trying to quantify the impact of these actions. In the United States, for example, the “America's Pledge” project [Bloomberg Philanthropies 2019] estimates that despite the country's exit from the Paris Agreement, there are many local actors who have committed to emission reductions that fall within the scope of the Paris Agreement objectives. The project estimates that local actors represent at least 51% of US emissions and 65% of the population. In Europe, it was recently shown that out of a representative sample of 885 cities, more than two-thirds have put in place an emission reduction strategy [Reckien et al. 2018]. Many networks have been set up by cities, regardless of state, to enable them to pool knowledge and skills (e.g. ICLEI, C40, Covenant of Mayors, etc.). This is one of the reasons for the creation of the NAZCA (Non-State Actor Zone for Climate Action [UNFCCC 2019]) within international negotiations, which identifies actions at the local level in each country with the aim of having a more accurate vision of international efforts to reduce emissions than simple national policies.
7. Conclusion
In conclusion, because cities account for more than half of the world's population and most of its economic activity, they are major players in global environmental problems. Transport, urban planning, and housing policies are necessary and effective means of reducing global GHG emissions. This is particularly true at this time, as the world is experiencing massive urbanisation and the choices that will be made for the cities that are currently being built will commit us for decades to come. Reducing energy consumption and GHG emissions in cities is not easy, as it interacts with many other issues, not only environmental, but also economic and social. However, synergies between these issues are very often present.
1See UN figures https://population.un.org/wup/. It should be noted that the definition of "urban" and "rural" depends on the country. In France, for example, an urban resident is someone who lives in a town of more than 2,000 inhabitants and where the dwellings are separated by at most 200 meters. In the United Kingdom, urban residents are defined by living in municipalities with more than 10,000 inhabitants.
2Another example: worldwide, 32% of the rural population does not have access to electricity, compared to only 5.3% of the urban population [IPCC 2014d].
3For example, the figures for Paris generally refer to Paris in the administrative sense, that is to say to Paris within the walls, whereas in most cities, the entire agglomeration or urban area is considered. The urban agglomeration corresponding to the city of Paris corresponds roughly to the entire Île-de-France region [Hassan 2001].