

 CC-BY 4.0
1. Introduction
The scientific methods and results summarised in this brief article are the result of a large number of research and follow the progress of knowledge stemming from the formidable scientific adventure of climate science. They take up the key points of the 30-minute conference given on this subject during the French Académie des sciences symposium on January 28, 2020 (https://www.youtube.com/watch?v=tDxDOgEArmk), supported by references to the scientific sources of the elements covered:
- the climate is changing everywhere, with visible effects;
- this ongoing change is due to past and ongoing greenhouse gas emissions;
- in the short term (by 2050), our choices can reduce the risks associated with inevitable climate change;
- long-term trends (after 2050) will radically depend on future greenhouse gas emissions;
- there are many options for action, risk management, adaptation, and reducing greenhouse gas emissions while preserving biodiversity and enabling everyone to live with dignity.
This article provides a brief introduction to climate science (part 2) followed by key points from recent IPCC special reports1 from 2018 and 2019 (part 3). These reports, written by about 300 researchers from around the world, provide the best state of knowledge, based on the critical assessment of about 20,000 scientific publications. The rigour, comprehensiveness and objectivity of this assessment benefited from the critical review carried out by several thousand other researchers, who provided over 70,000 review comments on successive versions of the reports (www.ipcc.ch). Each conclusion is expressed with a level of confidence, established on the basis of the assessment of the robustness of the scientific elements of knowledge and their coherence, and is traceable to the critically reviewed scientific, technical and socio-economic publications.

This visual representation (https://showyourstripes.info) developed by British climatologist Ed Hawkins as part of an in-depth reflection on how to communicate scientific information to the general public, which intuitively allows to visualise the observed global warming between 1850 and 2019 (about 1°C more than in 1850–1900) on the surface of the ocean and the continents, from the HadCRUT4 dataset [Morice et al. 2012] (https://www.metoffice.gov.uk/hadobs/hadcrut4). This visualisation is also available for each country. Each bar corresponds to one year, and the colour code ranges from blue to red over a range of −0.7 to +0.7°C, and the average value for the years 1971–2000 is used for the blue to red transition. Masquer
This visual representation (https://showyourstripes.info) developed by British climatologist Ed Hawkins as part of an in-depth reflection on how to communicate scientific information to the general public, which intuitively allows to visualise the observed global warming between 1850 and ... Lire la suite
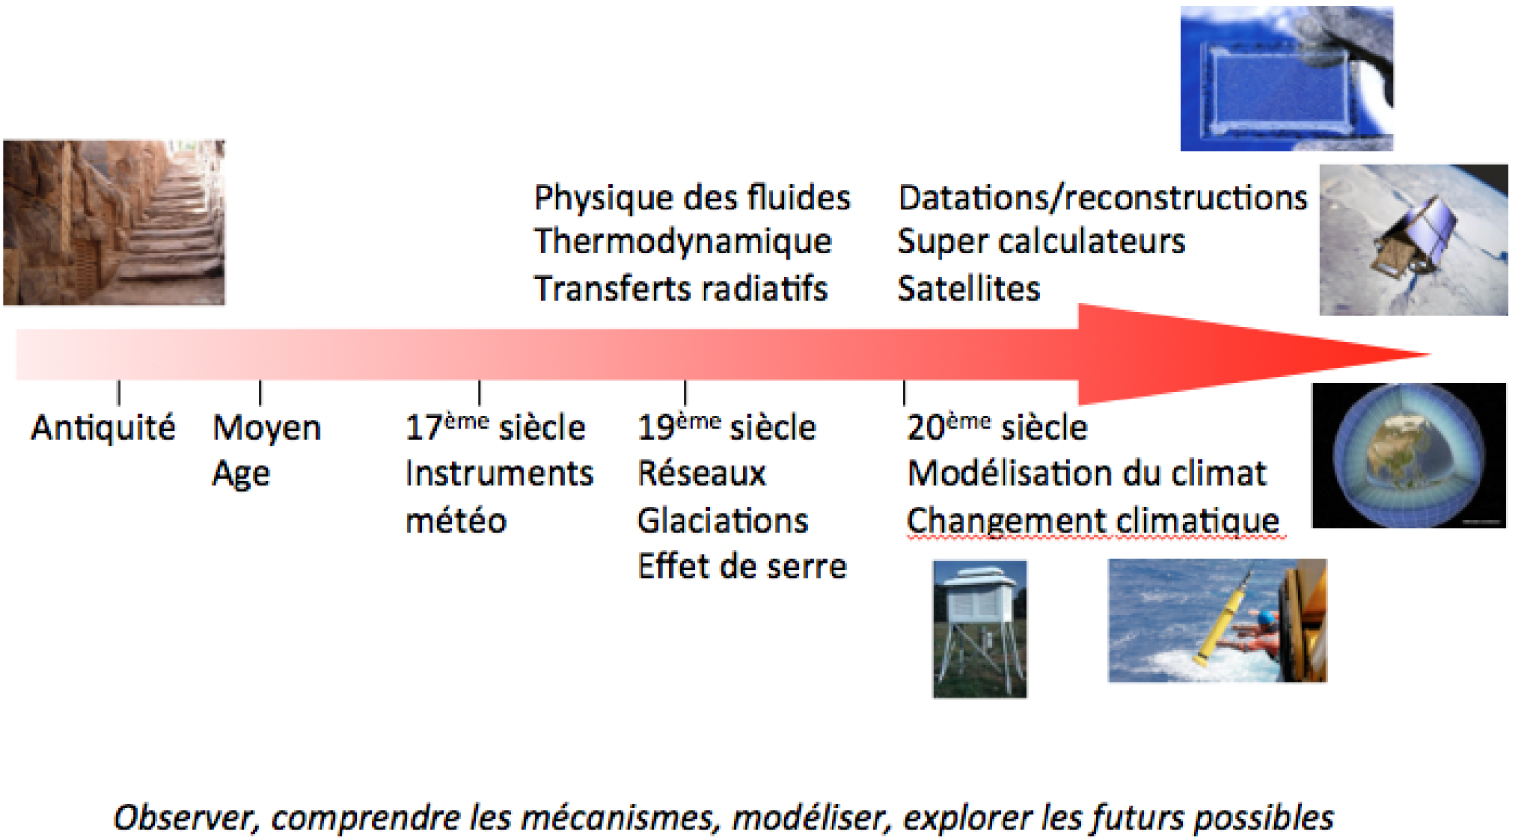
Schematic representation of key stages in the advancement of climate science knowledge. The photograph on the left depicts the graduated steps which were used to measure the height of the Nile floods and provided the first quantitative observations of climate variability. Since the 17th century, the development of measuring instruments, the structuring of observation networks (initially for weather forecasting) above the continents, on the surface of the ocean and then at depth, and finally remote sensing from space, from the 1970s onwards, have gradually contributed to the construction of an internationally coordinated system for observing the Earth's climate (https://gcos.wmo.int/). Climate science also improved through the advancement of knowledge in physics, applied to understand the functioning of the climate system formed by the atmosphere, the ocean, the surface of continents, the biosphere, the cryosphere and their interactions, its spontaneous variability and its response to disturbances in the Earth's energy budget, from a theoretical point of view and using digital modelling tools, based on physical principles. Finally, the characterisation (dating, quantification) of past climate variations, before direct observations, through the study of natural climate archives (paleoclimatology), the understanding of the mechanisms of these past variations, and their use to test climate models also contribute to the advancement of knowledge, by providing access to past "natural experiments" on the Earth's climate and by supplementing direct observations to characterise the natural variability of the climate at time scales beyond the century, and thus situating the changes observed today in the context of this natural variability. Masquer
Schematic representation of key stages in the advancement of climate science knowledge. The photograph on the left depicts the graduated steps which were used to measure the height of the Nile floods and provided the first quantitative observations of climate ... Lire la suite
2. From climate science to climate change science
We are getting better and better at observing, locally and by satellite, the characteristics of a climate that is changing, characterised by a warming of the order of 1°C observed on the surface of the ocean and the continents compared to the period 1850–1900, close to pre-industrial climatic conditions (Figure 1). The consequences of this warming are already visible, in particular through more frequent and intense extreme events, affecting both human activities and terrestrial and marine ecosystems [IPCC 2018]. We are getting better at understanding the mechanisms. This understanding is the legacy of the gradual construction of the building blocks of physics applied to this complex system, the climate system, which produces intrinsic variability, and which responds to past, present and future disturbances in the Earth's energy budget (Figure 2).

Evolution of atmospheric CO2 concentration (blue, ppm); CH4 (orange, ppb) and N2O (ppb), based on a compilation of measurements from polar ice cores and direct measurements in the atmosphere [Meinshausen et al. 2017].
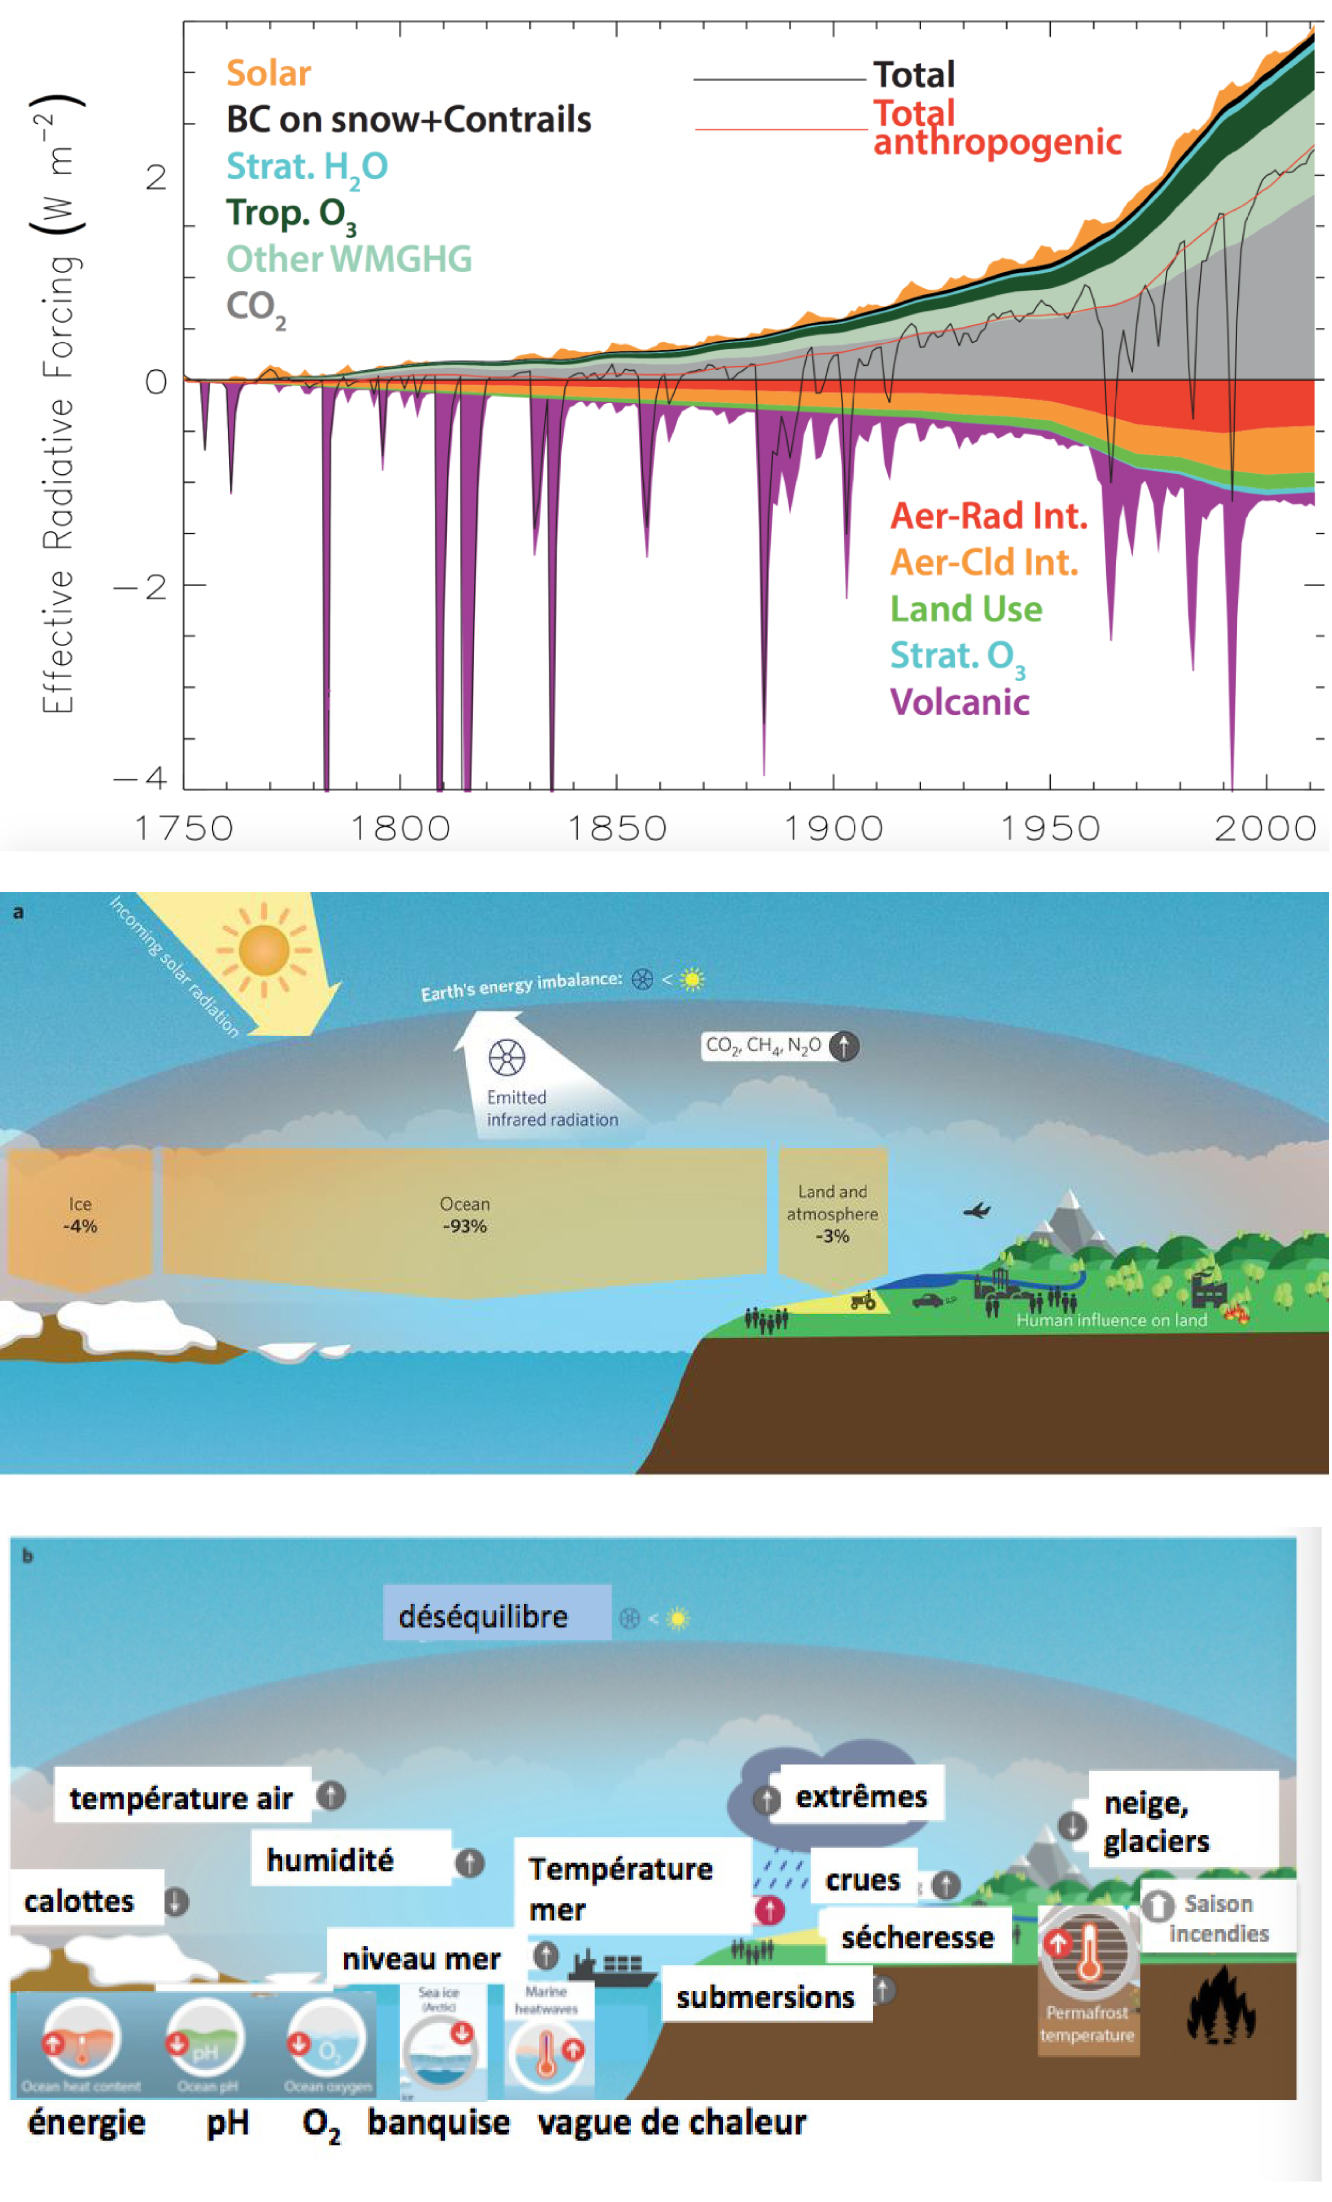
Schematic representations of energy fluxes and storages in the climate system and their consequences. At the top, radiative forcing (in W∕m2); in the middle, imbalance in the Earth's energy budget resulting from human activities; at the bottom, consequences of the latter. Adapted from [von Schuckmann et al. 2016] combined with highlights from recent IPCC Special Reports [IPCC 2019b,a].
As in all scientific fields, climate sciences are based on observation, understanding the mechanisms, and modelling to understand how this system works [Edwards 2013] (Figure 2). I would point out that the climate trends and characteristics observed over the last 30 years have been correctly anticipated by the first ocean-atmosphere coupled simulations published in the 1980s, e. g. [Stouffer and Manabe 2017]. Finally, these climate models play a key role in exploring possible futures. Climate change science mobilises multiple scientific disciplines around understanding the impacts of climate change and options for action, for risk management, adaptation, and mitigation, that is, reducing greenhouse gas emissions [Weart 2013].
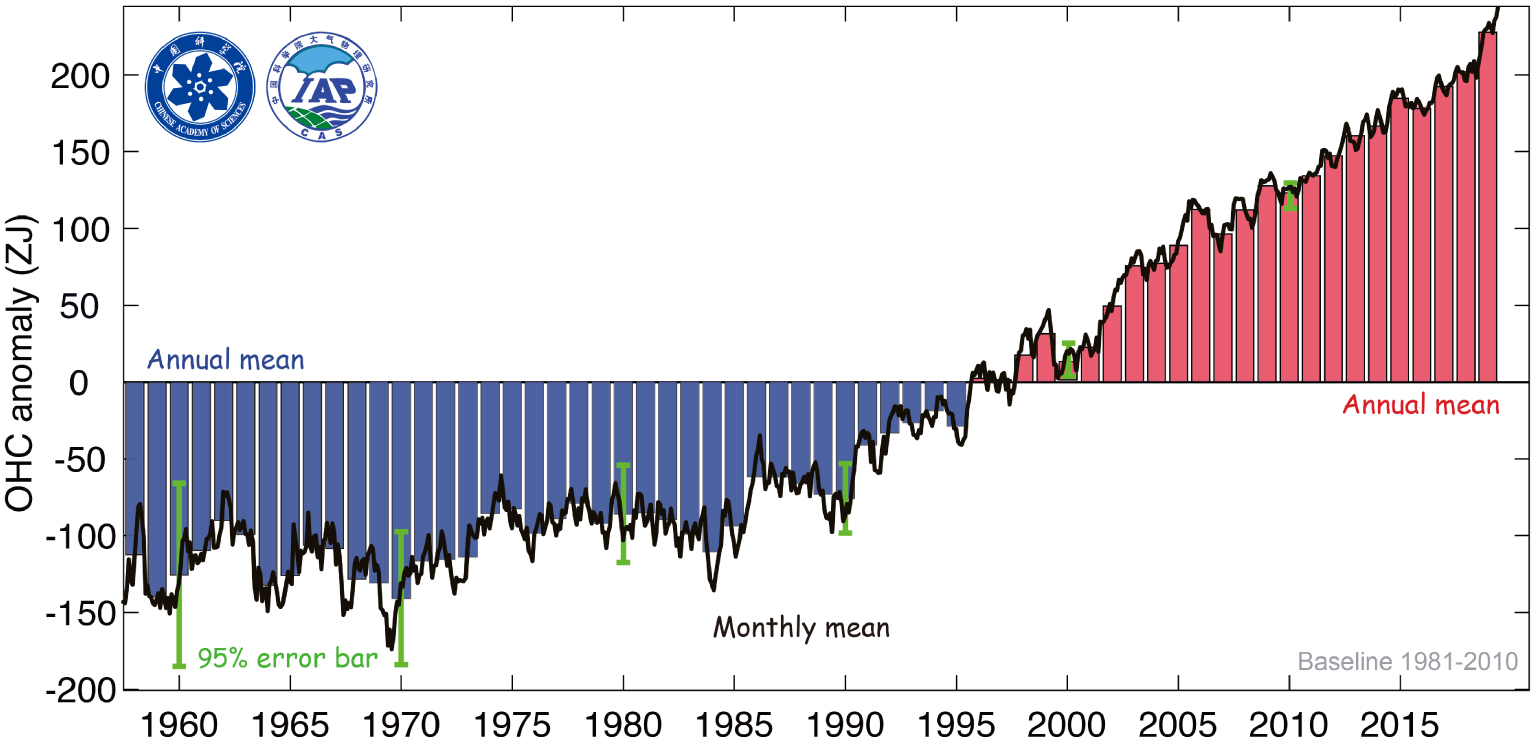
Estimation of the evolution of the ocean's heat content over its first 2000 m depth, expressed in ZJ3, and represented as a difference (anomaly) compared to the period 1981–2010, on monthly (black) and annual (vertical bars) scale; the green error bars indicate the evolution of the uncertainty (at 95%) which has been reduced over time thanks to the improvement of the oceanographic measurement network [Cheng et al. 2020].

Illustration of the analysis of global warming due to the consequences of human activities, compared to 1850–1900, using a standard detection and attribution method [Haustein et al. 2017]. This index estimates the contributions to observed warming (4 datasets, monthly anomalies), after removal of inter-annual variations by least squares adjustment, and responses to forcings from the emulator developed in chapter 8 of the IPCC WGI AR5 report. The extent of these responses is estimated by adjusting for observations (https://globalwarmingindex.org). Masquer
Illustration of the analysis of global warming due to the consequences of human activities, compared to 1850–1900, using a standard detection and attribution method [Haustein et al. 2017]. This index estimates the contributions to observed warming (4 datasets, monthly ... Lire la suite
First element for this overall picture of climate change, human activities very deeply disrupt the composition of the atmosphere, presented here for the last 2000 years [Meinshausen et al. 2017] (Figure 3). The increase in the atmospheric content of the main greenhouse gases known as "well mixed in the atmosphere" ( CO2, CH4, N2O) results from emissions related to human activities and is standing out in terms of amplitude and rate of increase compared to the glacial-interglacial variations of the last 800,000 years [Köhler et al. 2017; Masson-Delmotte et al. 2013]. The average atmospheric concentration of CO2, increased from about 280 ppmv2 during the pre-industrial level, typical of interglacial periods, to more than 415 ppmv in July 2020 (according to NOAA measurements, (https://www.esrl.noaa.gov/gmd/ccgg/trends/global.html)), even exceeding the range estimated over the last 3.3 million years, including during the warm periods of the Middle Pliocene [de la Vega et al. 2020].
By preventing part of the infrared radiation emitted by the Earth's surface and the lower layers of the atmosphere from going to space, the increase in the concentration of greenhouse gases in the atmosphere leads to an imbalance in the Earth's energy budget [Myhre et al. 2013]. The warming effect of greenhouse gases is partly masked by a net cooling effect, more limited and associated with a greater range of uncertainty, resulting from the direct and indirect effect of aerosols. The disruption of the Earth's energy budget resulting from the effect of human activities leads to an accumulation of energy in the climate system, considering climate system feedbacks [Sherwood et al. 2019]. Most of the additional energy stored in the climate system (about 93%) enters the ocean, whose water temperature increases, both at the surface and at depth. Some of this energy (about 4%) is converted to melting of the cryosphere, leading to its retreat (Arctic sea ice, snow cover, glaciers, Greenland and Antarctic ice sheet, permafrost thaw), some leads to warming of the soil and atmosphere (about 3%); warming of the low layers of the atmosphere represents only about 1% of this energy accumulation (Figure 4).
It is difficult to grasp the order of magnitude of the profound changes taking place in the climate system when they are reduced to an indicator such as the extent of warming measured at the surface of the ocean and continents. As a result of the increased greenhouse effect and the climate response, the increase in the heat content of the first 2 km of the ocean [Cheng et al. 2020] between 2018 and 2019 is of the order of 25 ZJ3 (Figure 5), which is about 40 times the annual amount of primary energy consumed by humanity [BP 2020]. The ocean plays a critical role in the functioning of the climate system [IPCC 2019b]. Because of the mixing time of the ocean water masses, of the order of a thousand years, these warmer water masses will gradually restore this excess energy to the atmosphere. This accumulation of heat in the ocean, from the surface to the depths, makes the global warming that has already taken place irreversible on the scale of several centuries: it is impossible to return to the pre-industrial climate.
The observed warming of the Earth's surface is clearly due to human influence on the climate system. The effect of external natural factors alone (activity of the Sun and volcanoes) (Figure 4a) would have led to a slight cooling in the second half of the 20th century. The only factor that explains both the extent of the observed warming on the surface but also all its characteristics is the climate's response to the increase in the greenhouse effect due to the consequences of human activities, partly masked by the net cooling effect of particles also resulting from human activities (aerosols). Figure 6 illustrates the results of attribution studies, based on the physical understanding and quantification of radiative forcing and climate system response [Haustein et al. 2017]. The best estimate of the fraction of observed warming, due to the consequences of human activities, is 100%, with an uncertainty range of 20% [IPCC 2018].
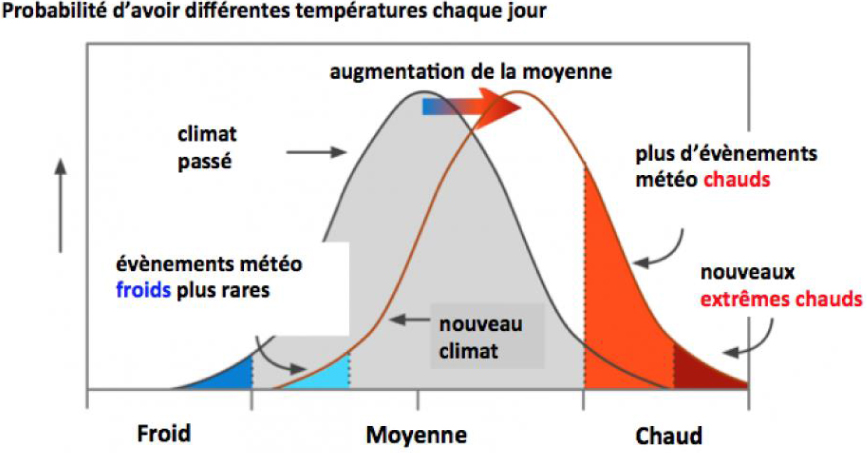
Schematic representation of the relationships between the increase in average temperature for a given location, and the change in the occurrence and intensity of cold and hot events, for an unchanged daily probability distribution function [IPCC 2013].
In a changing climate, weather conditions change. Figure 7 presents an idealised (Gaussian) representation of the probability of temperature distribution for a given season and in a given location. When the average temperature increases, this distribution shifts. There are still cold extremes, but rarer, a sharp increase in the recurrence of hot extremes (with an increase in intensity more marked than global average warming), and new heat records, for example 42°C in the Paris region and 46°C in the South of France in 2019 [Vautard et al. 2020]. The increase in hot extremes is observed on the surface of all continents [IPCC 2018] as well as in the ocean, with marine heat waves also more frequent, more intense and longer [IPCC 2019b].
Climate change therefore describes a set of manifestations that are the consequences of the imbalance of the Earth's energy budget (Figure 4b), with an intensification of extremes such as heat waves and the intensity of torrential rains, favoured in a warmer atmosphere, which may contain more water vapour, the intensification of droughts in many regions, such as the Mediterranean periphery, an increase in weather conditions conducive to forest fires, an increase in the mean sea level, due to the thermal volume expansion of the ocean which is warming at the surface and in depth and the melting of continental ice, leading to an increase in coastal submersion phenomena. It also includes a warming of frozen soils leading to surface thaw, a decline in snow cover in the spring in the northern hemisphere, and a decline in Arctic sea ice extent.
3. From knowledge production to assessment of the state of knowledge
We are in a situation where the scientific community has seized this issue of climate change, in all scientific disciplines, as well as in climate sciences, discussed above, to understand the functioning of the climate system and the physically possible future developments, but also to understand the impacts and potential risks of climate change, for ecosystems, sectors of activity, and human societies, in the different regions of the world, and finally to explore options for action, for risk management, for adaptation, and to reduce greenhouse gas emissions, while ensuring sustainable development. A search of the international databases in peer-reviewed journals publications shows more than 20,000 annual scientific publications with the keyword "climate" (Figure 8).
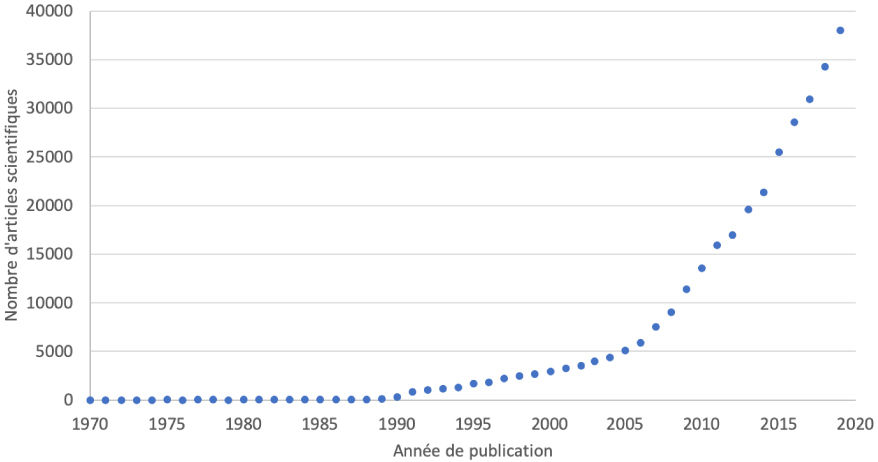
Number of scientific publications published annually in peer-reviewed journals with the keyword "climate change" (research done on Web of Science, October 2020).
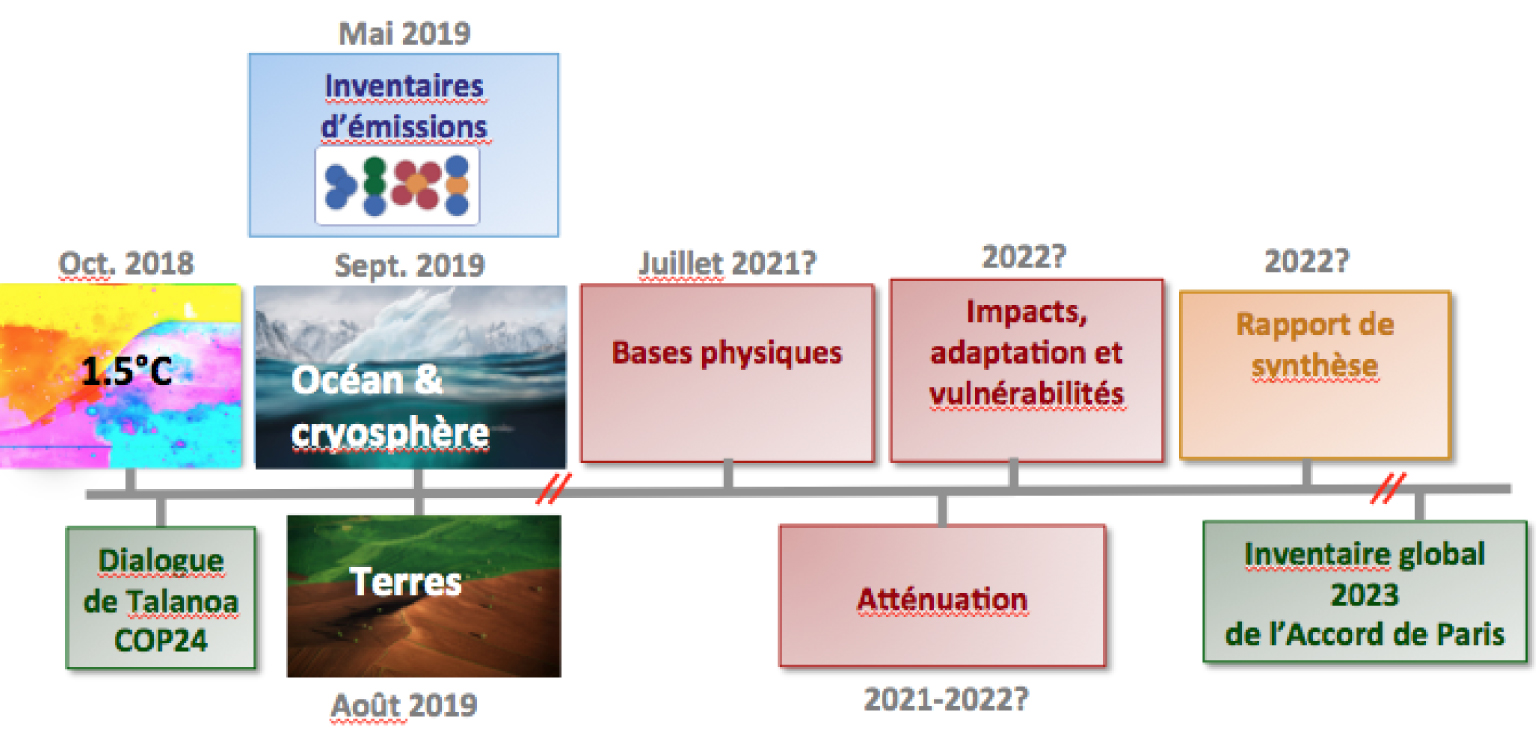
Set of reports prepared under the IPCC 6th assessment cycle (AR6). The approval dates of the main reports of each working group have been postponed due to delays related to the COVID-19 pandemic [Tollerson 2020] and may be subject to revision.
This makes it all the more important to have collegial, international effort to review this body of scientific knowledge, and to assess what is robust, well-established, and stands up to critical scrutiny; what is emerging, potentially important for informing choices; the reasons for scientific controversy, due to partial or inconsistent knowledge; and the limitations of scientific knowledge.
This is the mandate of the IPCC, the Intergovernmental Panel on Climate Change (www.ipcc.ch), established in 1988 within the framework of the United Nations Environment Programme and the World Meteorological Organization. This is the mandate of the IPCC, the Intergovernmental Panel on Climate Change (www.ipcc.ch), established in 1988 within the framework of the United Nations Environment Programme and the World Meteorological Organization [Jouzel et al. 2018]. The IPCC does not produce knowledge, but assesses the state of knowledge on the basis of the elements available in the scientific, technical and socio-economic literature. The special reports are each written by about 100 authors from different regions of the world (more than 200 authors for the complete reports of each working group), and are the subject of several stages of proofreading involving thousands of reviewers. This critical review is an essential aspect for the quality of the evaluation, its objectivity, its rigour, its robustness and its transparency. In this sense, IPCC reports also contribute to the maturation of scientific knowledge, and the IPCC has also played a role in the growing integration of knowledge from multiple scientific disciplines [Weart 2013].
For the 6th assessment cycle (AR6), which began in 2015, the IPCC considered more than 30 thematic proposals and chose to prepare three special reports across two or three of its working groups (physical basis; impacts, adaptation and vulnerability; mitigation), delivered in 2018 and 2019 (Figure 9), representing an unprecedented effort in terms of integration and in terms of specific themes addressed in a cross-functional way.
At the time of writing this article, the preparation of the main reports of the IPCC working groups is underway, mobilising the authors of the reports virtually (230 authors from 60 countries for Group 1), with anticipated delays of around 4 months for the finalisation of the reports, due to the difficulties related to the COVID-19 pandemic affecting the scientific community, as well as hundreds of authors and thousands of reviewers of the reports [Tollerson 2020].
The rest of this article summarises the key points of these three special reports of 2018 and 2019. The reader is invited, for more precision and depth, to read these reports, where each conclusion is expressed with a level of confidence, and is traceable to the analysis of the scientific elements in the publications examined, in the different sections of the chapters. Finally, each chapter contains an analysis of the scientific barriers and limitations of knowledge, which are not discussed here but constitute, in my opinion, a formidable added value which, in a way, draws essential lines of paths.
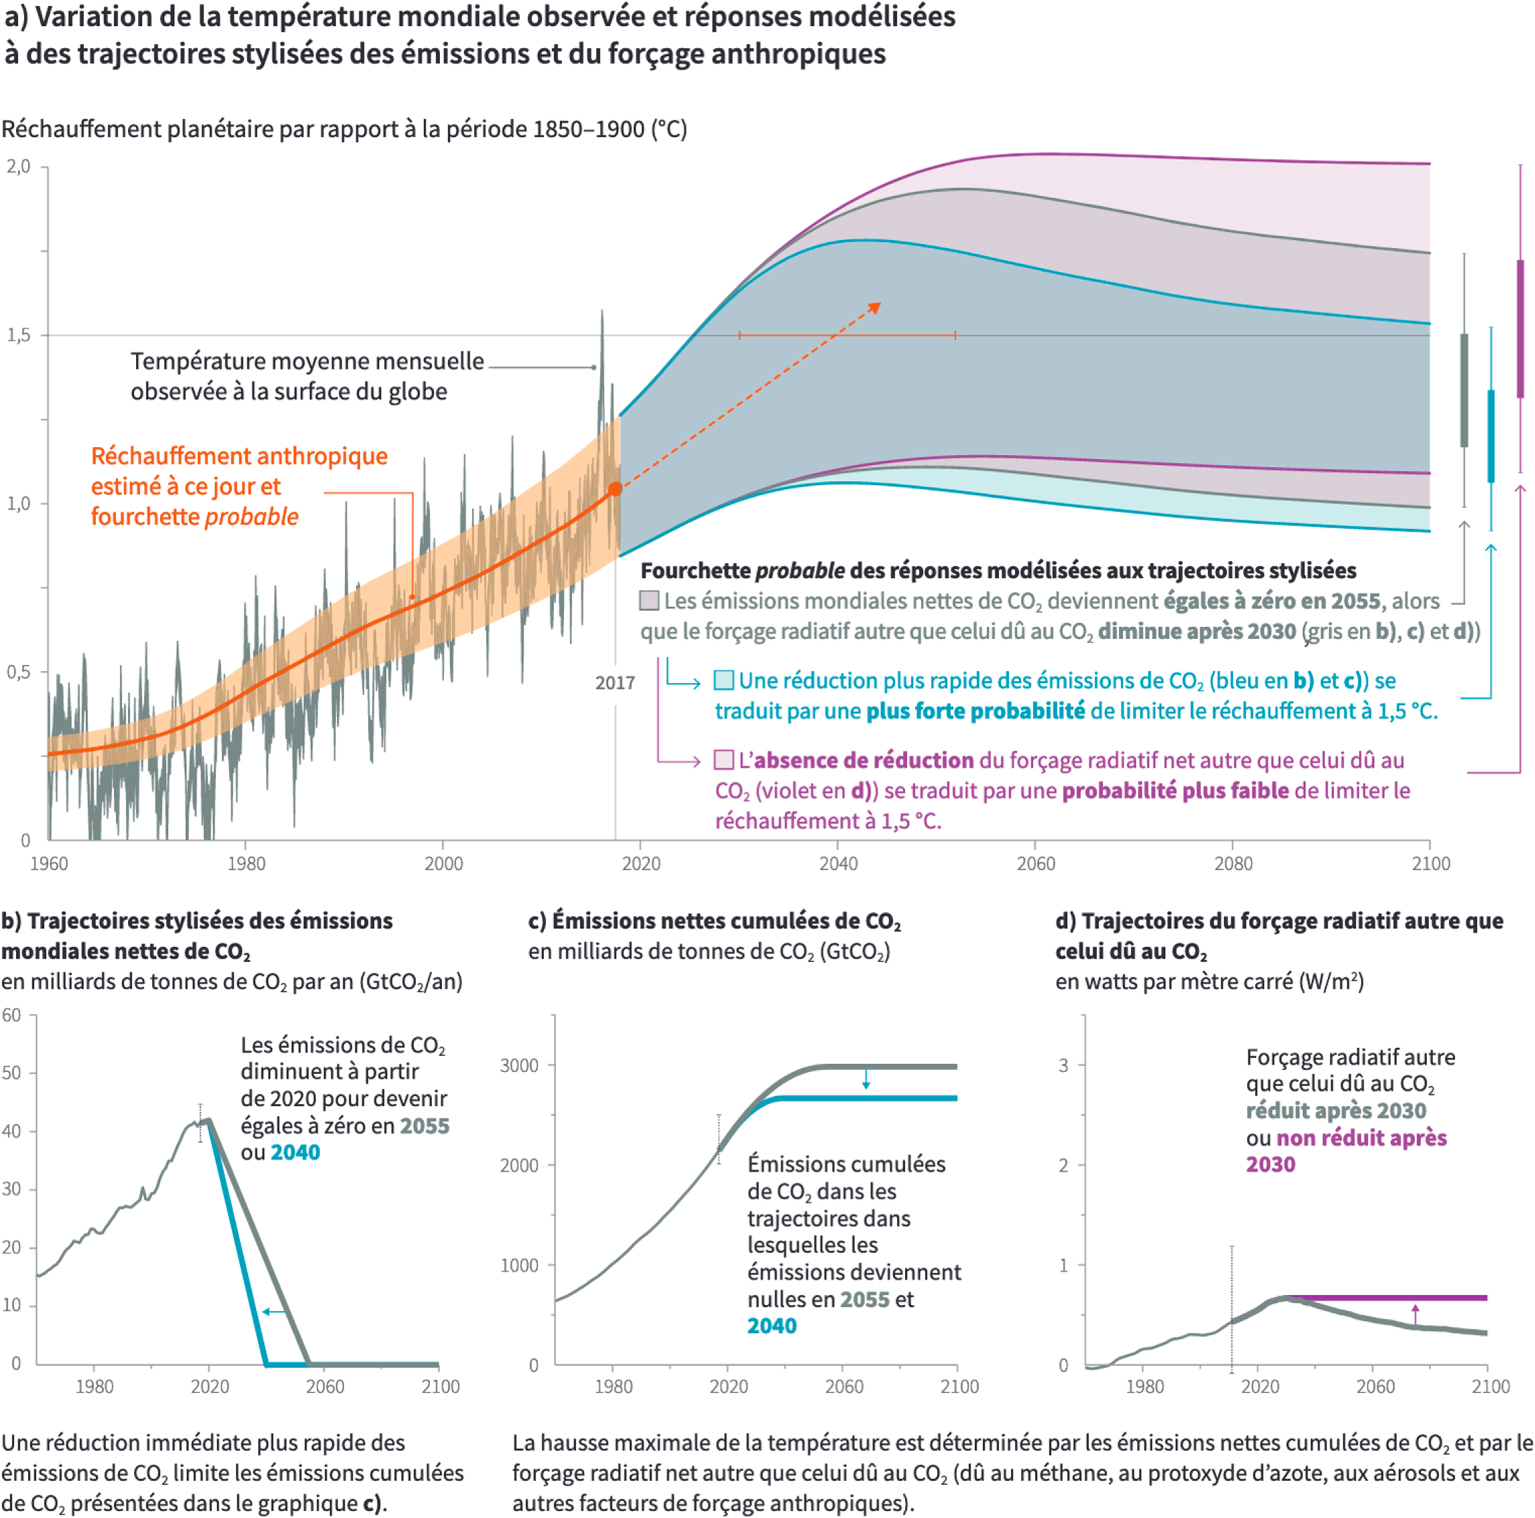
The future warming peak will depend on the cumulative CO2 emissions and non-CO2 radiative forcing. At the top, observed warming (anomalies for each month, in grey, compared to 1850–1900, average of 4 datasets) and fraction attributed to human influence (in red, best estimate, and uncertainty range of 20% in orange; note that warming due to human activities is determined over a 30-year period centred on the year concerned, and is calculated until 2017; that it will continue at the recent average rate of 0.2°C per decade. In dotted lines, an estimate of when this warming due to human activities would reach 1.5°C at the current rate of warming, i. e. between about 2030 and 2050 (horizontal bar). The coloured areas represent different theoretical pathways of warming stabilisation around 1.5°C taking into account climate variability and its response to the Earth's energy budget disturbances, for an idealised pathway (grey) of linear decrease in global CO2 emissions towards net zero (bottom, left) and a decrease in non-CO2 radiative forcing (bottom, right). The blue area represents the result of an even more drastic decrease in CO2 emissions (net zero in 2040) and illustrates the cumulative differences in CO2 emissions. The purple area represents the result of the grey pathway for CO2 and a plateau and not a decrease in non-CO2 radiative forcing [IPCC 2018]. Masquer
The future warming peak will depend on the cumulative CO2 emissions and non-CO2 radiative forcing. At the top, observed warming (anomalies for each month, in grey, compared to 1850–1900, average of 4 datasets) and fraction attributed to human influence (in ... Lire la suite
4. Key points of the IPCC Special Report of 1.5°C
This report, prepared for the first time across the three IPCC working groups, focuses on the impacts of global warming of 1.5°C above pre-industrial levels and on the corresponding greenhouse gas emission pathways, in the context of strengthening the global response to the threats of climate change, sustainable development, and efforts to eradicate poverty. The entire report is available in English (www.ipcc.ch/sr15) as well as a translation into French of certain elements (technical summary, summary for policymakers, FAQs, glossary; see under "download report", at the bottom of the page "UN and other languages").
I will summarise this report by saying that every half degree of warming is important in terms of the characteristics and impacts of climate change; every year is important in terms of greenhouse gas emissions, given the limited room for manoeuvre that remains if we want to contain global warming close to current levels; and every choice is important, because it is a report that deeply places the reflection on the options for actions regarding the climate in all aspects of a sustainable development, and in particular the elimination of extreme poverty, the first objective of sustainable development, as well as the cross-cutting perspectives between climate and biodiversity.
Prepared in response to the invitation of COP21, this special report reviews nearly 6,000 scientific publications (including many works published between 2016 and 2018), and received over 42,000 comments from 1,113 reviewers (www.ipcc.ch/report/SR15).
At the current rate of warming (+0.2°C per decade), warming will reach, in the climate sense (on average over 30 years here) a level 1.5°C higher than in 1850–1900, between about 2030 and 2050 (earlier if anthropogenic radiative forcing is greater and if the climate reacts strongly, later in opposite situations) (Figure 10). The IPCC was asked to assess the conditions for stabilising warming at 1.5°C. The first key condition is a sharp decrease in global CO2 emissions from around 15 to 40 billion tonnes per year from 1970 to today, until net zero, i. e. residual anthropogenic emissions are offset by anthropogenic removals, i. e. actions implemented to extract CO2 from the atmosphere and store it in a sustainable manner). The earlier and faster the reduction, the lower the cumulative past, present and future CO2 emissions will be, and the lower the level of warming will be at the time of stabilisation. As long as net CO2 emissions are not zero, the climate will continue to drift. The second condition is to stabilise or reduce radiative forcing due to non-CO2 factors (other greenhouse gases, aerosols, land use). The more this factor is reduced, together with the achievement of CO2 neutrality, the more the probability of containing warming to a low level increases. Many short-lived climatic factors that affect the climate also affect air quality. This is the case, for example, with methane, which is a precursor to the formation of tropospheric ozone, but also of other reactive greenhouse gases, or carbon soot. Reducing the emissions of these compounds thus brings important and rapid benefits to public health and to ecosystems through the improvement of air quality.
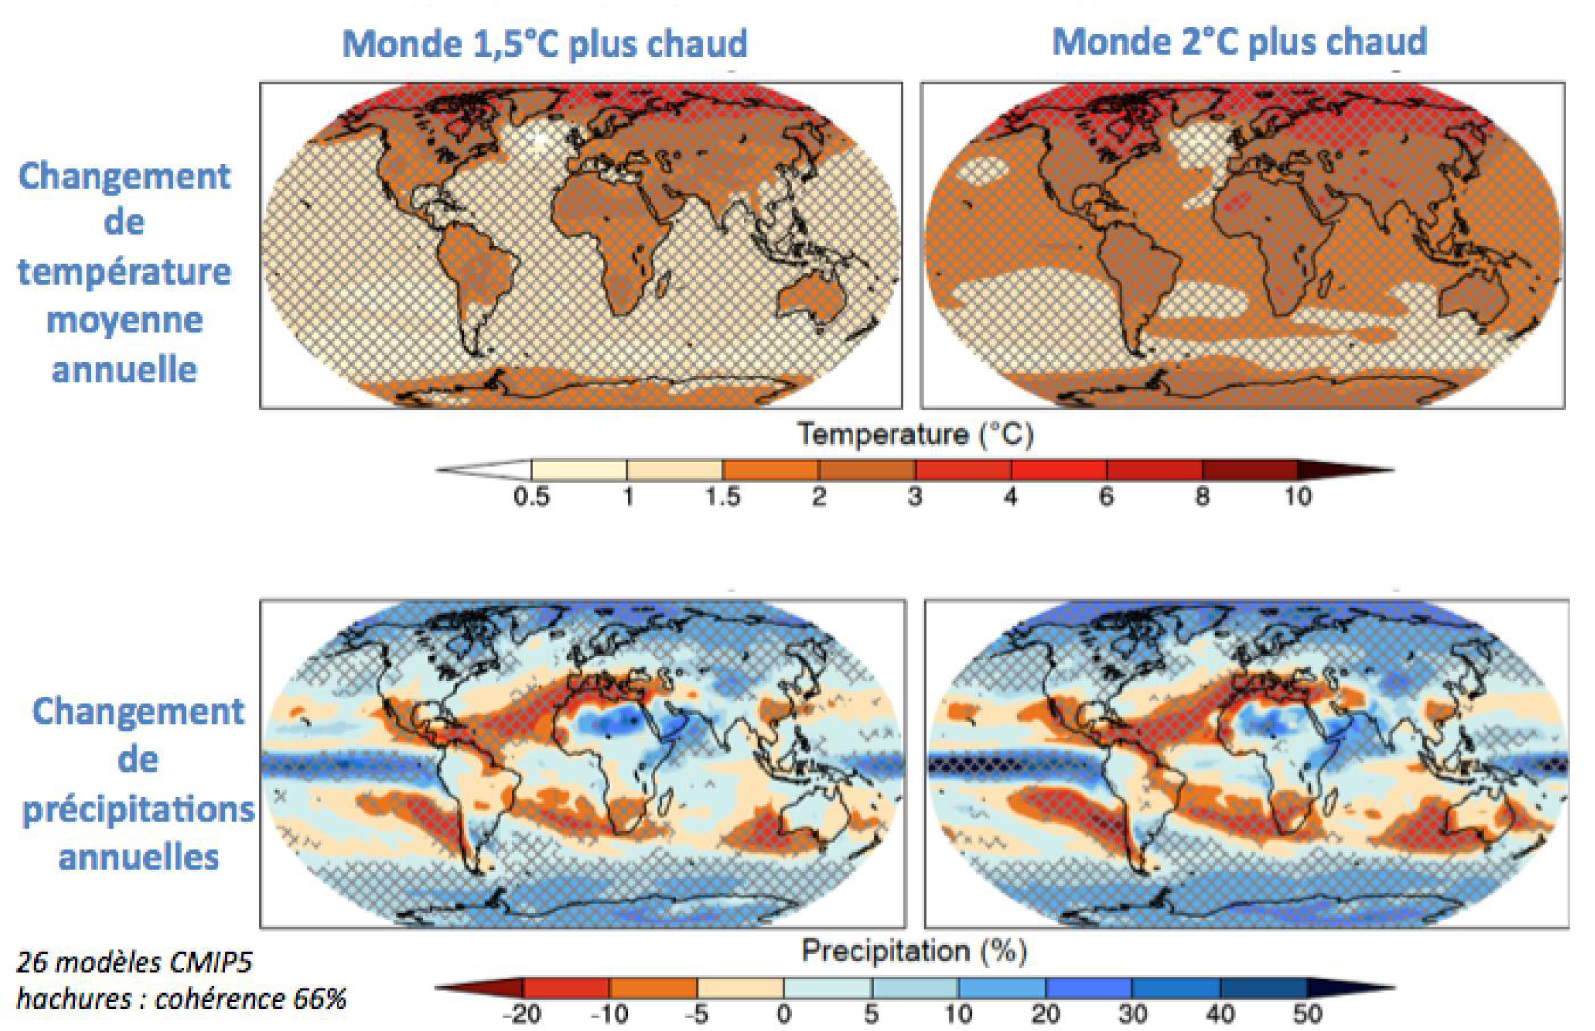
Spatial structure of annual average temperature change (°C, top) and percentage change in annual amount of precipitation (%, bottom) projected in the CMIP5 climate models for a warming level of respectively 1.5°C (left) and 2°C (right) above 1850–1900 [IPCC 2018].
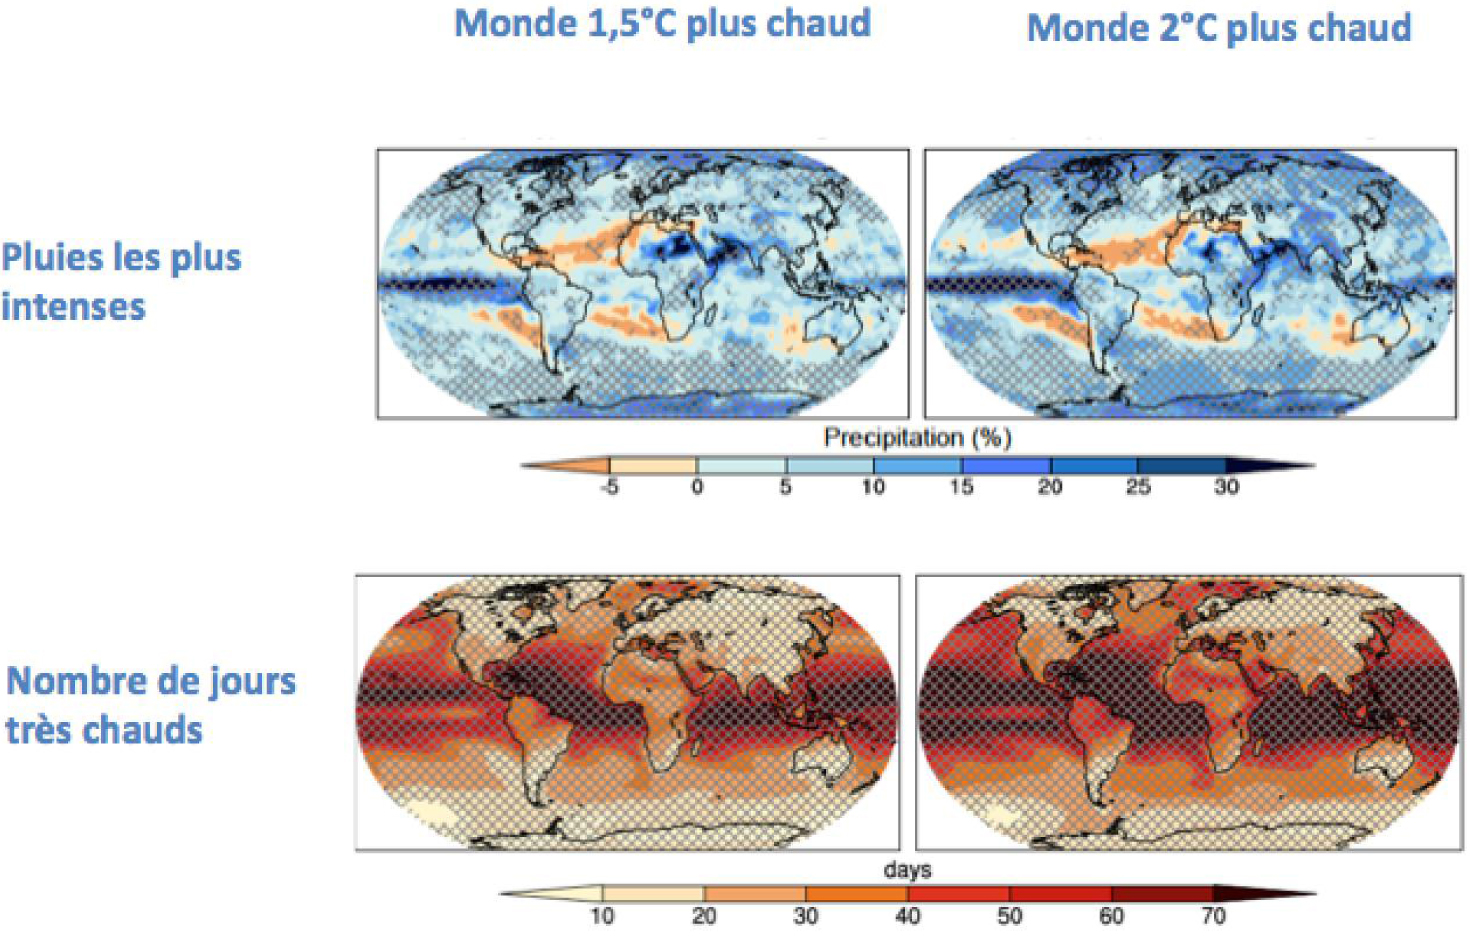
Spatial structure of the percentage change in the amount of precipitation corresponding to the most intense events on 5 consecutive days each year (%, top) and the change in the number of very hot days per year (the hottest 10% for the pre-industrial reference period, bottom) projected in the CMIP5 climate models for a warming level of respectively 1.5°C (left) and 2°C (right) above 1850–1900 [IPCC 2018].
What are the characteristics of a 1.5°C or 2°C warmer world? The more the average level of global warming increases, the more the average annual warming level increases in the different regions of the world, with greater warming on the surface of the continents than on the surface of the ocean and particularly pronounced in the Arctic region, due to amplifying processes (Figure 11). Similarly, a higher level of warming leads to higher projections of change in annual rainfall in each region, with an increase in precipitation in cold regions and a net decrease, already observed, in Mediterranean climate regions, especially around the Mediterranean Sea, where drought hazard has increased and will increase very sharply for each additional half degree of global warming (Figure 12). Finally, in a warming climate, we project an intensification of extreme events, such as the intensity of torrential rains, already observed in the South of France [Luu et al. 2018], an increase in the number of very hot days, an increase in the intensity of hot extremes (greater than that of the average level of warming), amplified in cities due to the urban heat island effect. These increases in the intensity, frequency and duration of hot events lead to the degradation of ecosystems, such as tropical coral reefs, negatively affecting cereal yields and livestock productivity, demonstrating the close links between climate and food security.
To summarise a risk analysis taking into account climate hazards, exposures, vulnerabilities and adaptation options, the IPCC reports use a synthetic representation of the evolution in the level of impact risk as a function of the level of global warming. Between a 1°C, 1.5°C and 2°C warmer world, the level of climate-related risk increases significantly for a number of natural and human systems (Figure 13). As a result, it is estimated that 70-90% of tropical coral reefs will be severely degraded due to the recurrence of bleaching phenomena related to marine heat waves for a warming of 1.5°C, and almost all of them for a warming of 2°C. The stakes are also high for the Arctic, where the decline in sea ice extent will continue as a function of the intensity of global warming, leading to an ice-free Arctic Ocean in late summer, about one year out of 100 in a 1.5°C warmer world, and one year out of 10 to one year out of 3 in a 2°C warmer world, affecting ecosystems and ways of life that depend on sea ice. Based on an analysis of approximately 100,000 species of plants, insects, and invertebrates, it is estimated that the number of species at risk of habitat loss doubles between a warming of 1.5°C and 2°C, highlighting the close links between controlling the level of warming and preserving ecosystems and biodiversity (in addition to the issues related to local pressures on them). While sea-level rise is inevitable over several centuries, due to the inertia of the response of the ocean, glaciers and ice sheets of Greenland and Antarctica, limiting warming to 1.5°C compared to 2°C would make it possible to limit its rate in the 21th century and its extent beyond, and therefore gain room for manoeuvre for adaptation on the coasts.
In addition, the risks are not evenly distributed, and are disproportionately higher for the Arctic, semi-arid zones and Mediterranean climate, Small Island Developing States and least developed countries. Taking action to contain the extent of global warming to 1.5°C rather than 2°C would avoid exposing hundreds of millions of people to increasing climate risks, which could push them into poverty. There is, of course, a wide range of adaptation options that can be used to influence the characteristics of certain hazards, exposure and vulnerability to climatic hazards. Adaptation needs increase with the extent of future warming, and there are limits to adaptive capacity for both ecosystems and human societies, even for warming of the order of 1.5°C. There is a lack of knowledge about the cost of adaptation, its potentials and limitations, in many regions, and for many sectors of activity. This report highlights the close links between the level of warming, human security, and development issues.
What are the CO2 emission pathways to keep warming as close to current levels as 1.5°C or 2°C ? To stabilise warming at 1.5°C (or 2°C), based on the knowledge assessed in this report (which dates back to 2018), global CO2 emissions would need to be reduced by 50% (25%) between 2010 and 2030, and net zero would need to be reached by 2050 (2100) (Figure 14).
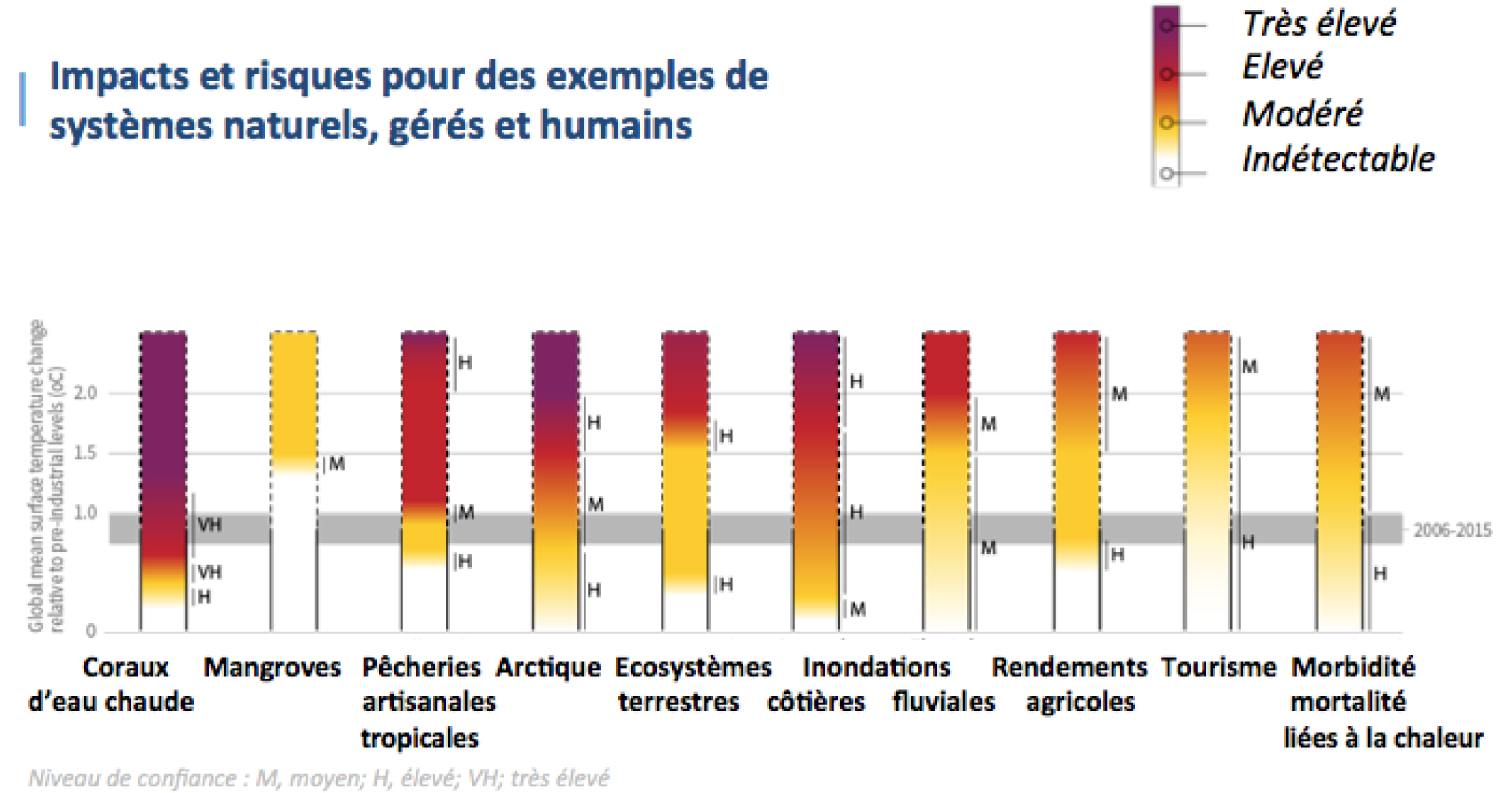
Examples of changes in level of impacts and impact risks for examples of natural, managed, and human systems for different levels of global warming; the degree of confidence is indicated by letters, and the color code changes from white to purple between an undetectable, moderate, high, or very high risk [IPCC 2018].
This would require transitions without historical precedent, in all sectors of activity, energy, in the first place, decarbonising electricity production, electrifying end uses of energy, decarbonising transport; profound changes in land use so that instead of emitting greenhouse gases, agricultural activities enhance carbon storage in the soil and preserve and strengthen natural carbon sinks; transformations in the way we think about cities to make them more resilient in a changing climate, maximising energy efficiency and all available options at the city level, such as soft mobility and public transport; strengthening energy efficiency and the circular economy in the industrial sector; and building infrastructure to support these transitions. There is a wide range of technologies available today that can be used to influence production methods. However, the reduction rate of emissions compatible with a stabilisation of warming at 1.5°C also requires controlling demand, with changes in consumption patterns and behaviours, to allow the rapid transformation of production systems. The sine qua non conditions for keeping global warming low include a very rapid decline in global coal use and a shift in investment from the fossil fuel sector towards low-carbon options and energy efficiency, multiplied by 5 to 6 by 2050 (Figure 13). Most pathways consistent with a stabilisation of warming close to 1.5°C imply negative net emissions after reaching net zero CO2. The slower emissions decline, the more likely it is that warming will exceed 1.5°C, with potential consequences in terms of irreversible loss of ecosystems, and increasingly difficult crisis management, particularly due to more intense and frequent extreme events. It would also imply that younger generations of today would be able to deploy, by the middle of this century and beyond, colossal greenhouse gas emission removal, returning by 2100, after a transient overshoot of these emissions, to the desired level of warming. Some options for removing CO2 from the atmosphere and storing it in a sustainable manner, such as the large-scale use of biomass energy with CO2 capture and storage, present important vigilance points considering the additional pressure on land use, and the cross-cutting issues related to food security and biodiversity conservation.
This special IPCC report on 1.5°C highlights the cross-cutting issues of climate action and the different dimensions of sustainable development, with an emphasis on ethical and just transitions that protect the most vulnerable. It shows that in each context there are different pathways that have different synergies or compromises with other sustainable development goals. An intelligently chosen set of measures to adapt and reduce emissions can help achieve the goals of sustainable development, with the broadest benefits identified on pathways affecting demand (energy sorbriety, sobriety on non-renewable materials footprint, healthy and low carbon diets). Finally, this report analyses the key conditions of feasibility, which include cooperation, governance at all levels, technological, social and frugal innovation, and the mobilisation of financing. I would also like to point out the importance of education and training, which are part of the necessary (but often not sufficient) conditions to allow such transformations to take place.
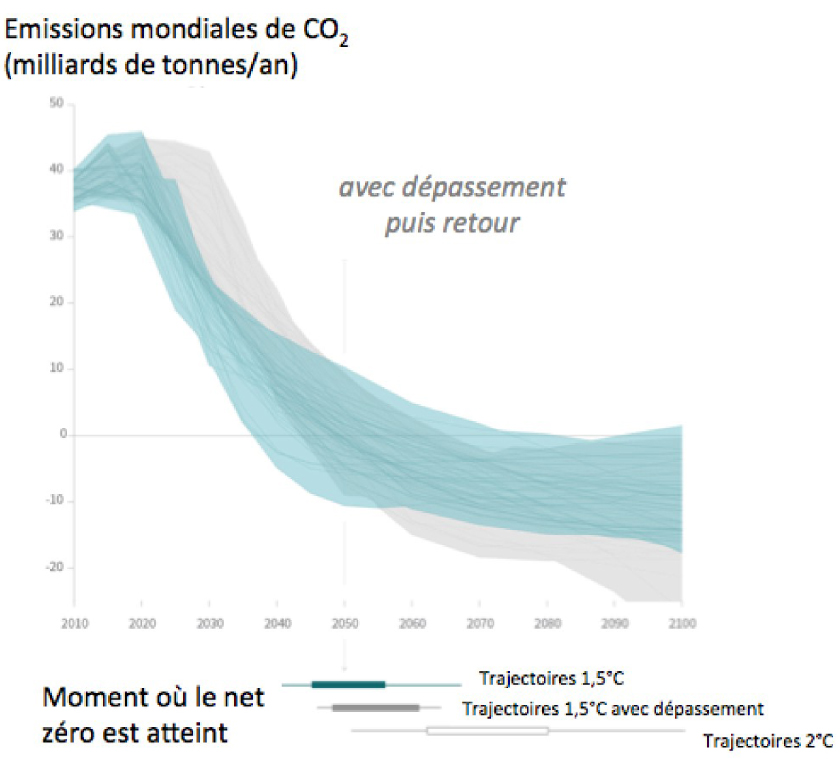
Characteristics of global CO2 emission pathways, derived from lower-cost economic assessment models and compatible with a stabilisation of warming at 1.5°C (50% probability) with limited overshoot (blue) or overshoot reaching 0.3°C and then return (grey) and analysis of the achievement of carbon neutrality in these pathways. For comparison, the same analysis for 2°C (66% probability) of warming is presented at the bottom of the graph [IPCC 2018].
5. Key points of the IPCC Special Report on land surface use
This report, prepared for the first time across the three IPCC working groups, addresses climate change, desertification, land degradation, sustainable land management, food security, and greenhouse gas fluxes in terrestrial ecosystems.
The entire report is available in English (www.ipcc.ch/srccl) as well as a translation into French of certain elements (technical summary, summary for policymakers, FAQs, glossary; see under "download report", at the bottom of the page "UN and other languages").
This report is based on the assessment of approximately 7,000 publications, and has received over 28,000 review comments.
We depend on the land surface for our food, for fibres, for energy, for our health, for our well-being, for our cultural identity. These are critical resources under increasing pressure, and climate change is adding to these pressures. Sustainable land management provides extremely important solutions, but cannot do everything, and cannot replace a reduction in greenhouse gas emissions in other sectors of activity.
Here are some key numbers. We are currently using 70% of the ice-free land. We harvest nearly a quarter to a third of the potential primary productivity on the continents. 1/4 of the land is degraded due to the consequences of human activities. Nearly 500 million people live in areas affected by desertification, and the surface area of semi-arid areas affected by drought has increased by an average of 1% per year since 1960. Our food choices weigh more and more in terms of ecosystem degradation and biodiversity loss. Per capita consumption of vegetable oils or meat has doubled since 1960, in addition to the increase in the world's population. The global food system is unsustainable. Some 820 million people still suffer from hunger, despite improvements in agricultural yields, and this number has recently increased. At the same time, about 2 billion people are overweight or obese, with increasing public health costs. The food system as a whole accounts for 1/3 of global greenhouse gas emissions, and it is vulnerable to the consequences of climate change.
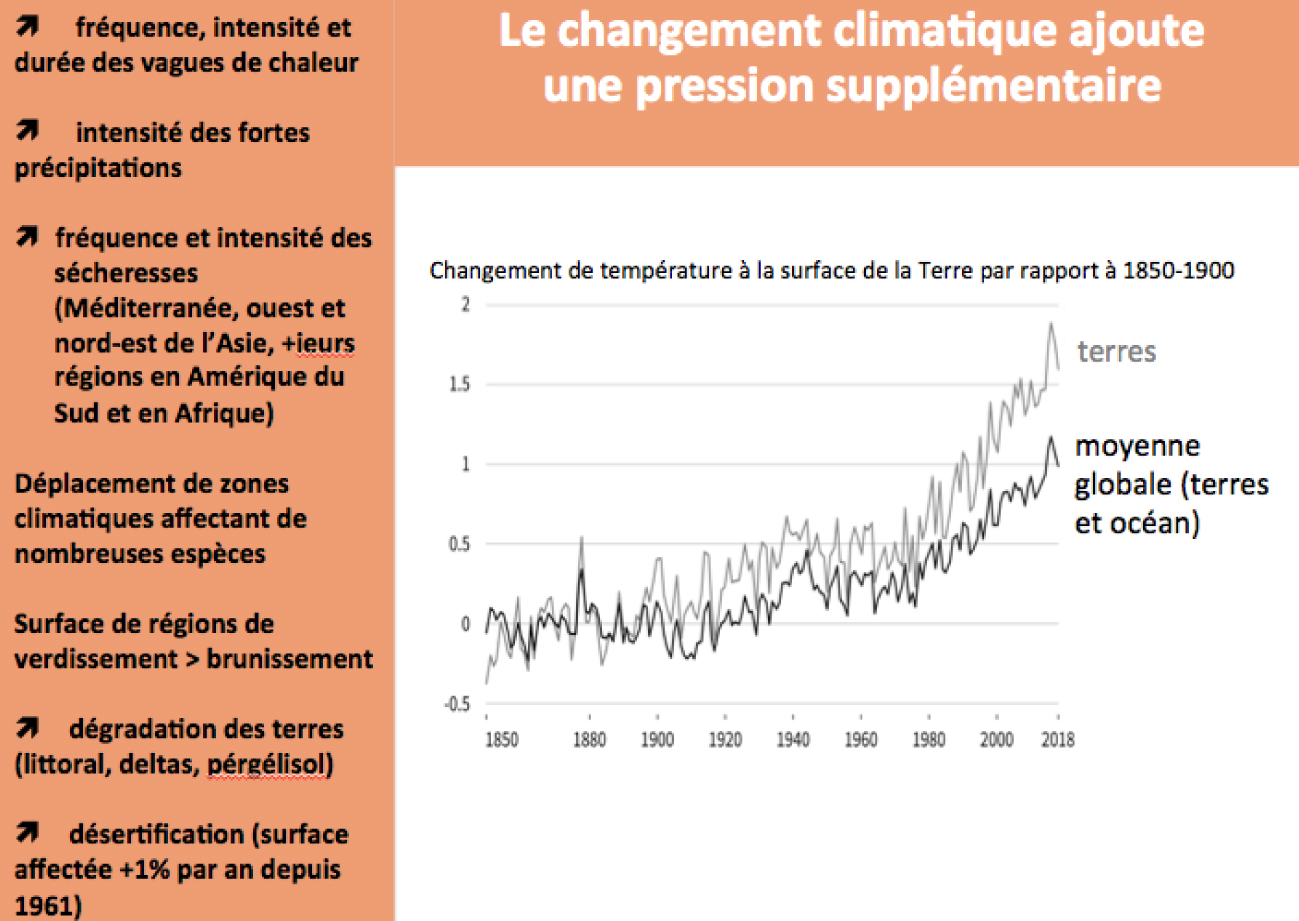
Comparison of global surface temperature change (ocean and continents) and over continents alone, based on observations, to the level of 1850–1900, and summary of aspects by which climate change adds further pressure on land [IPCC 2019a]. Note: "+ieurs" indicates "several regions".
At the top, an assessment of the risk of impact (taking into account hazards, exposure and vulnerability) for a set of processes related to the land surface, depending on the level of global warming. The colour code is the same as for Figure 13 [IPCC 2019a].
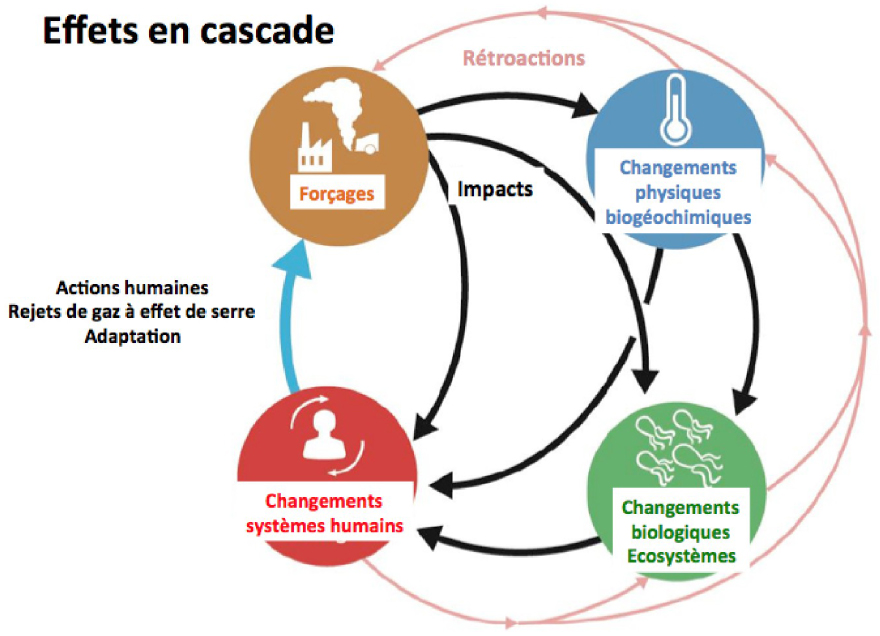
Illustration of the relationships between climate forcings, physico-chemical changes, consequences for ecosystems and human systems [IPCC 2019b].
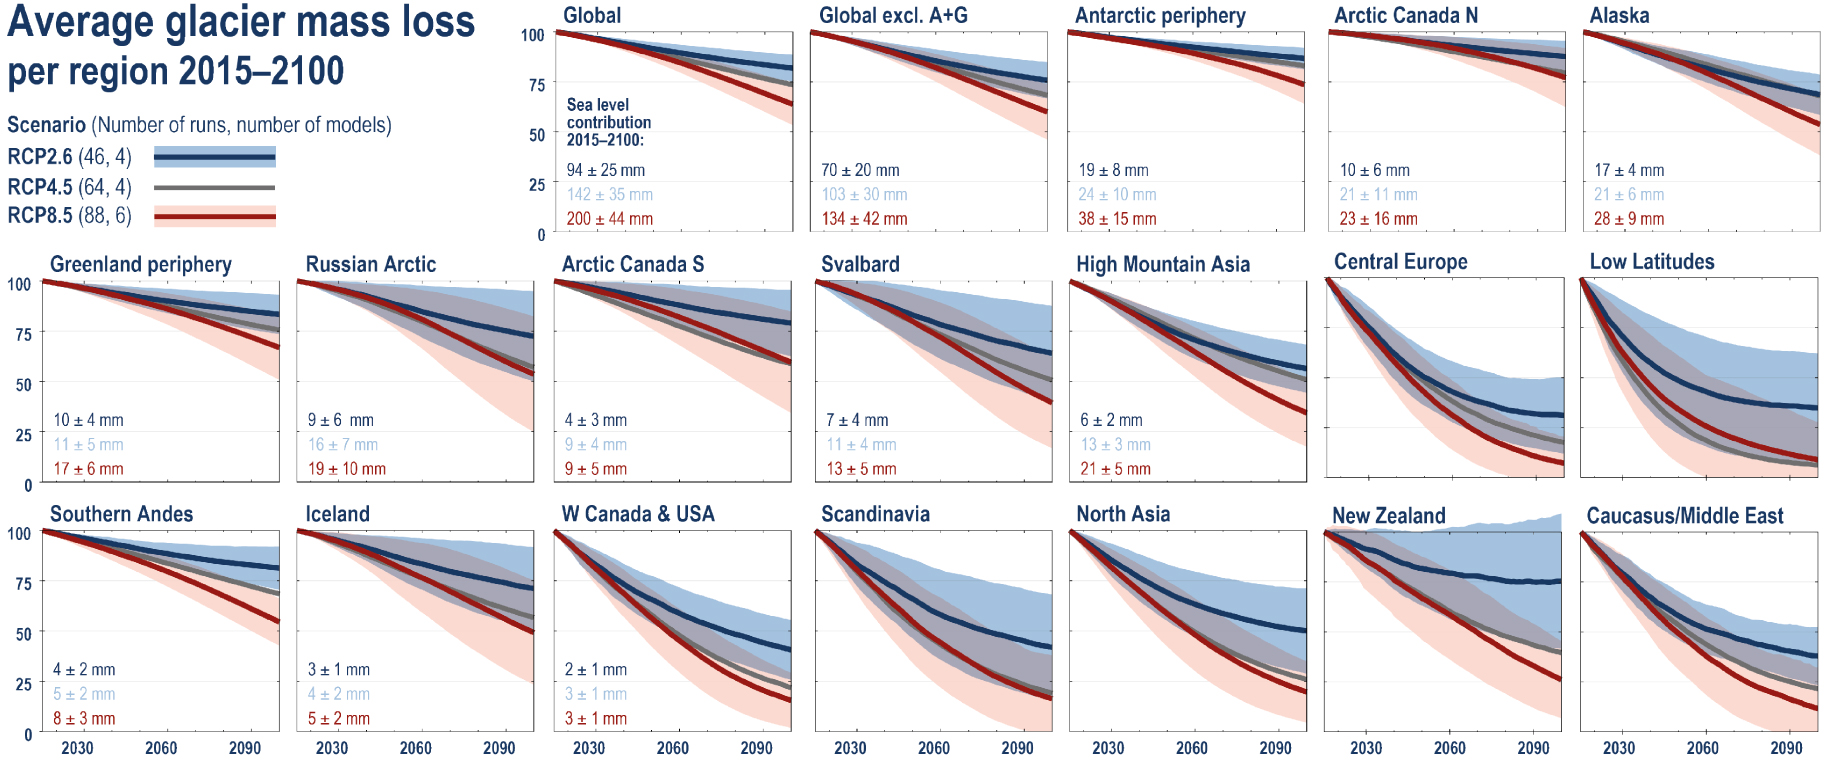
Projections of change in glacier mass balance in different regions of the world, for the RCP2.6 scenario (decrease in emissions, corresponding to a projected global warming of 1.6 ± 0.5°C by 2081–2100 compared to 1850–1900) and for the RCP8.5 scenario (very large increase in emissions, warming of the order of 4 ± 0.9°C in 2081–2100) [IPCC 2019b].
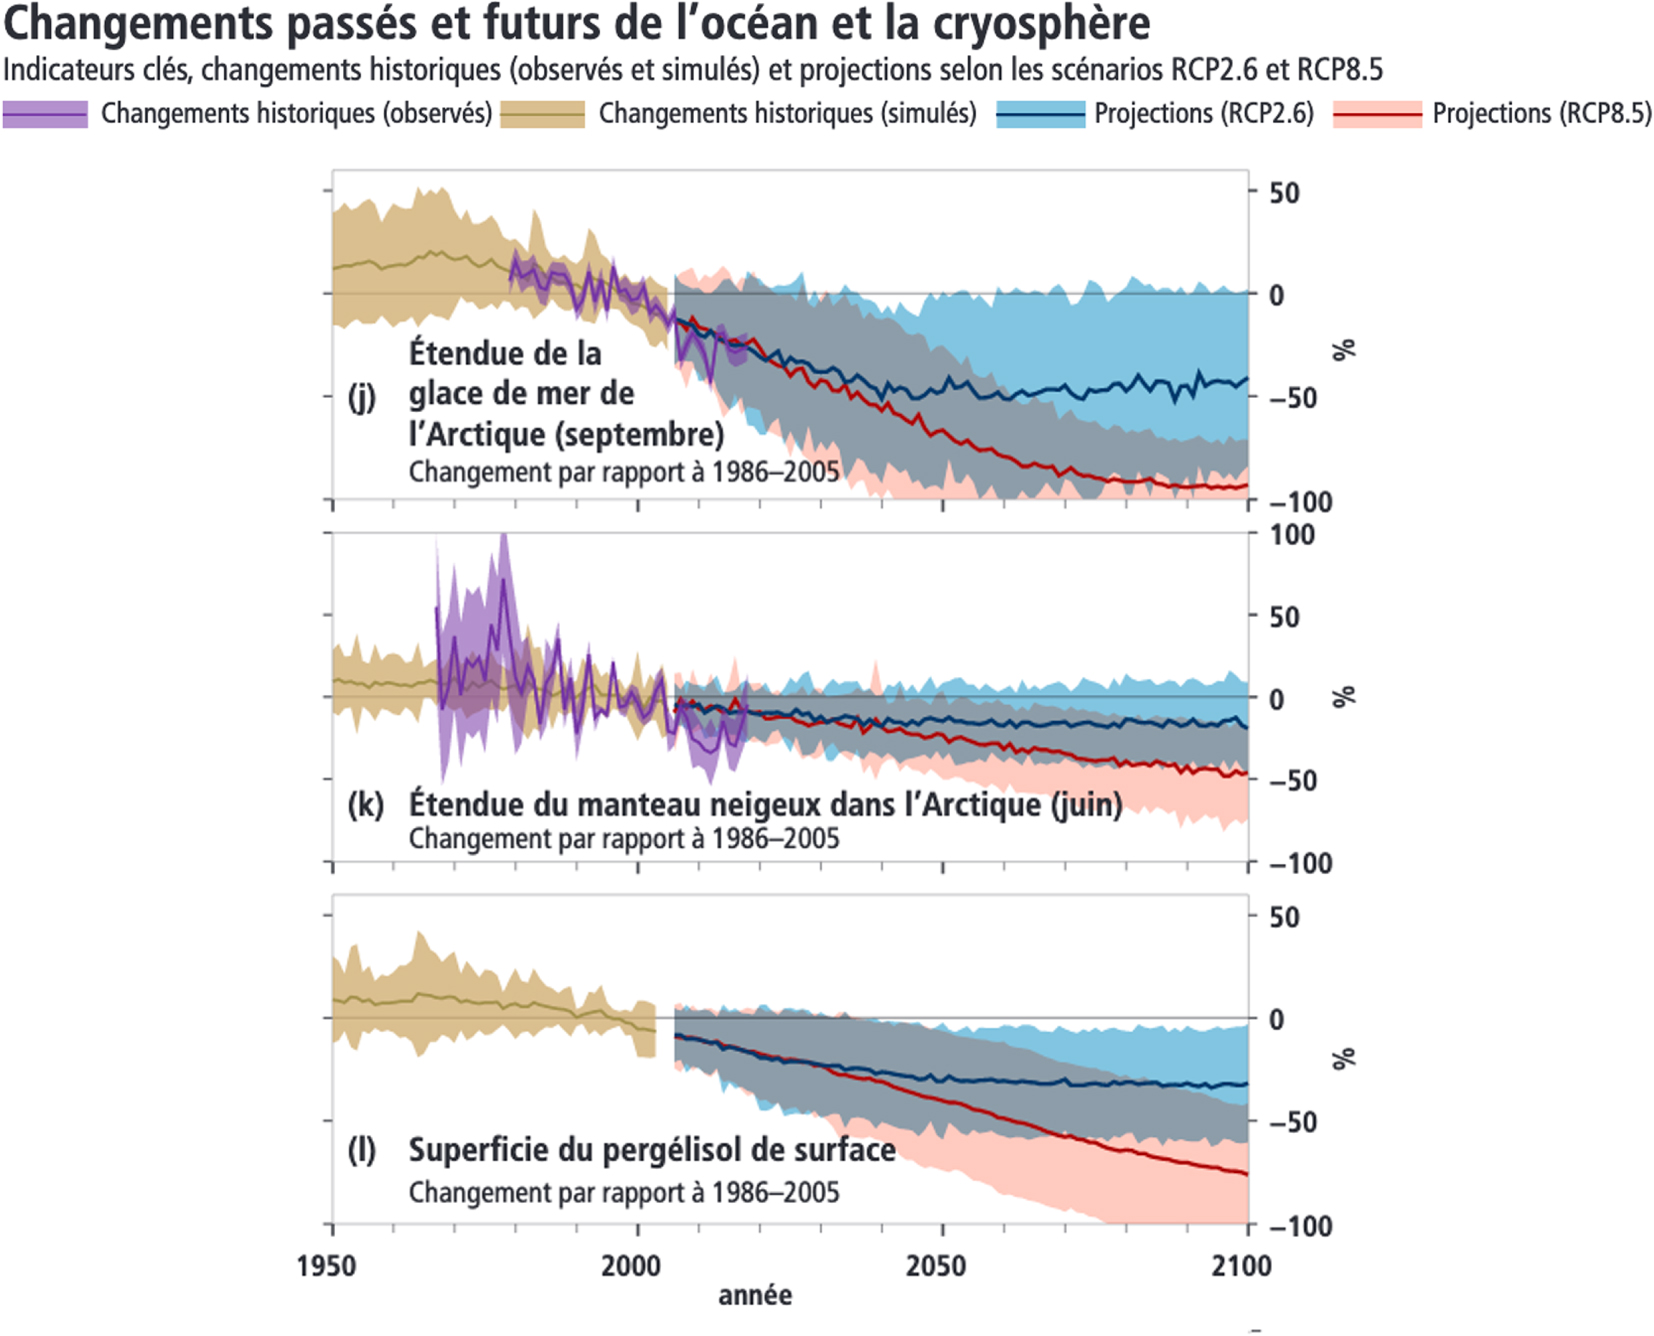
Historical simulations (yellow), observations (purple) and projections of Arctic sea ice extent changes in September, Arctic snowpack extent in June, and surface permafrost extent, compared to 1986–2005 for the SPC2.6 (blue) and SPC8.5 (red) scenarios [IPCC 2019b].
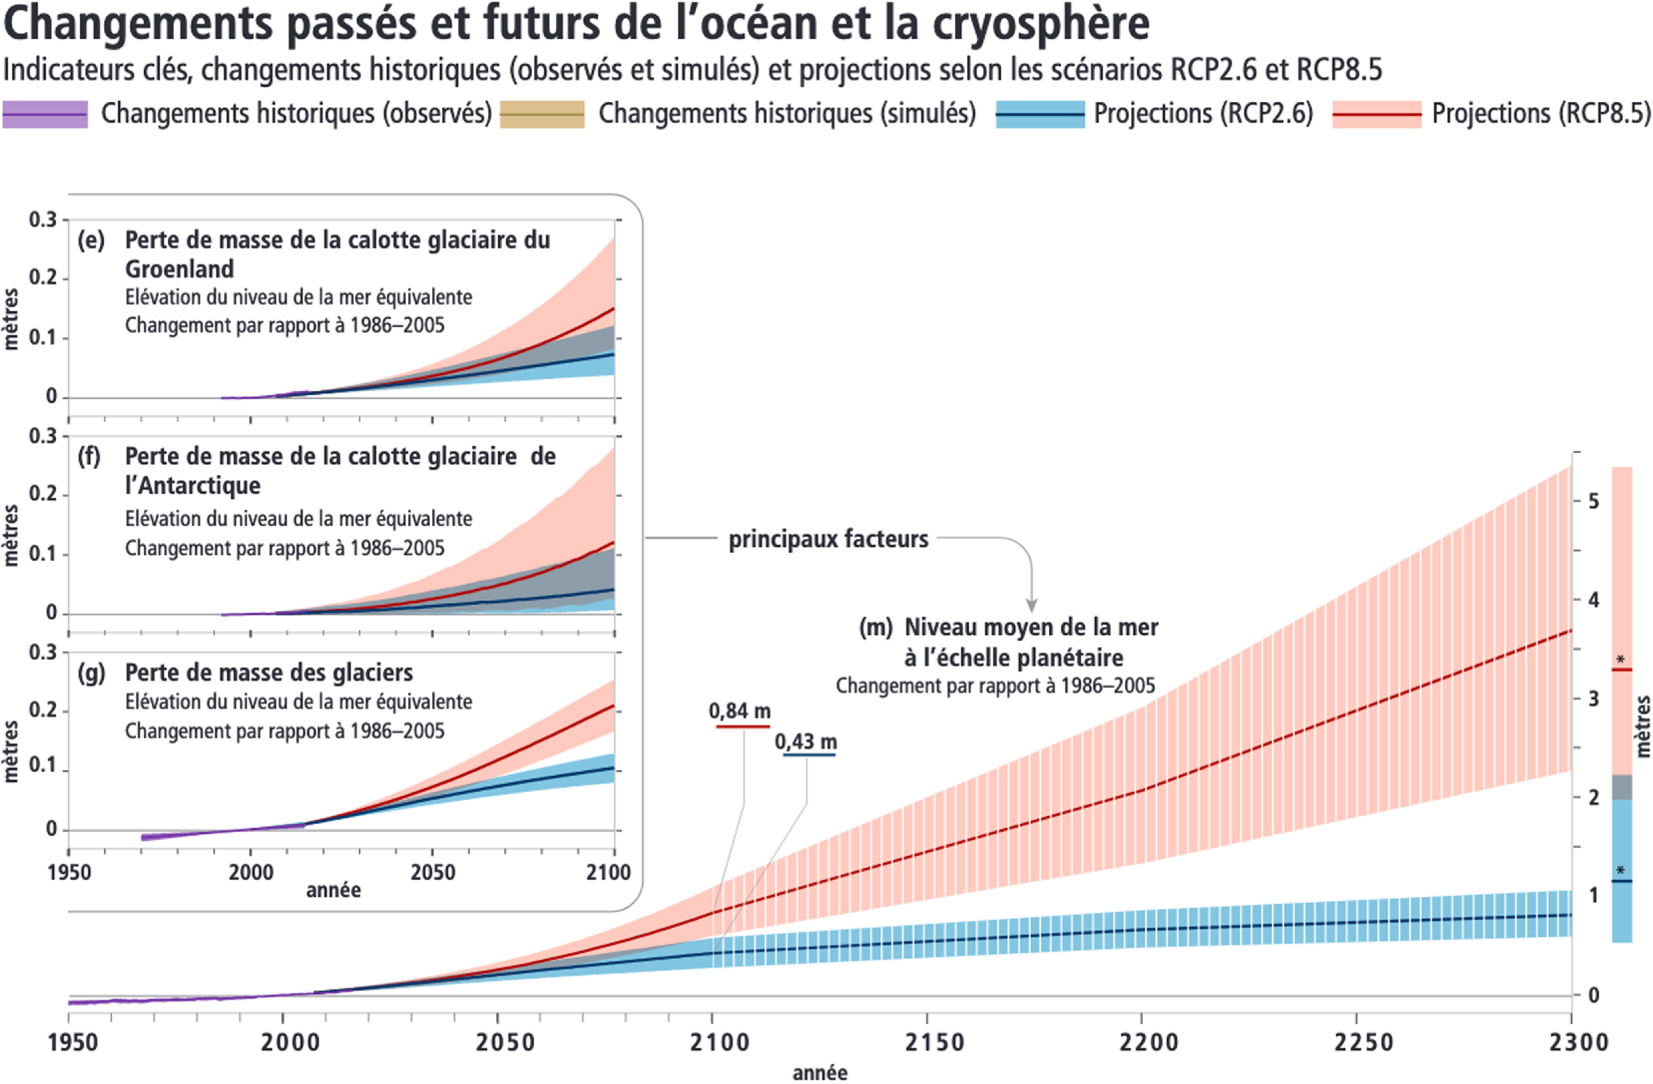
Historical simulations (yellow), observations (purple) and projections of changes in sea level corresponding to changes in the heat content of the ocean, the volume of Greenland, Antarctica and glaciers, and projections of mean sea level, compared to 1986–2005 for the SPC2.6 (blue) and SPC8.5 (red) scenarios [IPCC 2019b].
There are many solutions available now to take action, eliminating food loss and waste, transforming production, processing methods and consumption patterns, with major intersections in public health and the environment, preserving, restoring and enhancing carbon sinks. In terms of afforestation (afforestation of previously cultivated areas) and the large-scale use of crops to produce biomass for energy, there is limited theoretical potential to enhance carbon sinks, provided that this is integrated into sustainable land management. Finally, there are important options for risk management in this sector (insurance, integrated water management, fire management).
The warming is more pronounced over the continents than the global average and is already 1,5°C higher today than in 1850-1900 (Figure 15). Land conditions are affected by the increased frequency, intensity and duration of heat waves, the increased intensity of heavy rainfall, the frequency and intensity of droughts in many regions, leading to satellite observation of “browning” areas, the surface of which is smaller than the “greening” areas, due to the increase in atmospheric CO2 content and a longer growing season of plants in cold regions, but also as a result of irrigation and fertiliser use (especially in India and China). Climate change is causing climate zones to shift, affecting many species. There is an increase in land degradation in coastal areas and permafrost thaw areas.
Land use, including agriculture and forestry activities, is responsible for about 23% of global greenhouse gas emissions, or 13% of global CO2 emissions (mainly from deforestation and peatland destruction); 44% of global methane emissions (with rising emissions from ruminant and rice farming); and 82% of N2O emissions (with rising emissions from spreading and livestock farming). The food system as a whole accounts for about 1/3 of greenhouse gas emissions, with 8-10% of food loss and waste. Finally, the natural response of land to human-induced environmental change captures and stores about 29% of all global anthropogenic CO2 emissions in soils. The persistence of this sink is uncertain in a changing climate.
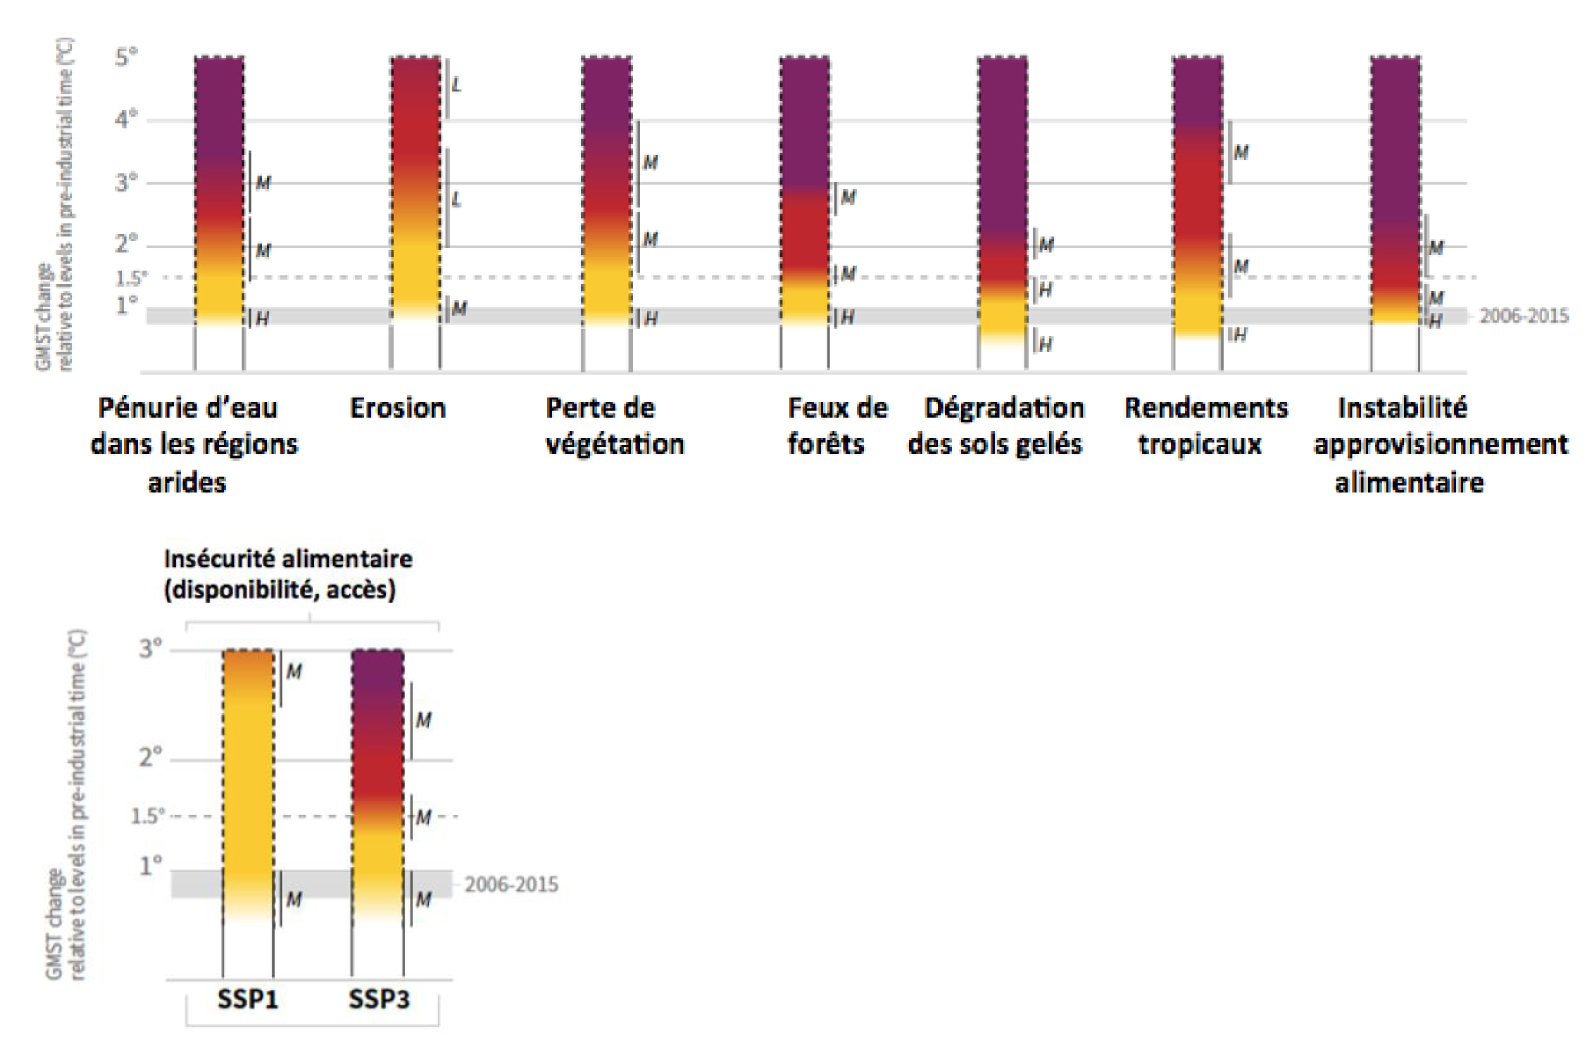
In this report, the risks associated with terrestrial processes due to climate change have been assessed as a function of the level of warming, and increase as the intensity of warming increases, over a range covering all available projections by 2100, including for scenarios of very high greenhouse gas emissions and warming up to 5°C by 2100 (Figure 16). The risks associated with forest fires increase particularly significantly between the current 1.5°C and 2°C around the Mediterranean Sea. Finally, the report highlights that the level of risk depends not only on the intensity of global warming, but also on choices in terms of socio-economic development. This is illustrated in Figure 16 for food insecurity (in terms of availability and access to food), which shows that the level of risk can be contained even for a warming of up to 2.5°C at a moderate level in a socio-economic scenario (SSP1) focusing on sustainability (demographic control, reduction of inequalities, low-carbon and resilient agricultural production, high adaptive capacity, effective land management, sustainable land management, cooperation), compared to a socio-economic scenario (SSP3) exacerbating vulnerabilities (high population growth, high inequalities, intensive consumption and production of resources and exerting strong pressures on the land, slow technological changes…) [Popp et al. 2017].
This brief presentation of this special report focuses on aspects related to the functioning of climate and impact risks, and complements another presentation focused on policy options, which were covered during the French Académie des sciences symposium in January 2020 by Jean-François Soussana, one of the main authors of the report (https://www.youtube.com/watch?v=YEn-KMQpOEs). The special report also highlights the interactions between changes in the state of the land surface, whether as a result of land use or from climate change, and regional climate: the intensity and duration of many extreme events, in particular heat waves, can be modified by changes in land use conditions. Soils that dry out (humidify) can increase (reduce) the severity of heat waves. Finally, where forest cover increases, increased evapotranspiration may result in cooler days during the growing season, and may reduce the amplitude of hot extreme events.
6. Key points of the IPCC Special Report on the Ocean and Cryosphere in a Changing Climate
This report, prepared accross IPCC Working Groups I and II (Physical Science Basis; Impacts, Adaptation and Vulnerability), focuses on how the consequences of human activities have and will affect the ocean and cryosphere (snow, ice, glaciers, ice caps, frozen soils), and their cascading consequences, physical or biogeochemical, for ecosystems and human societies that depend directly and indirectly on them (Figure 17). This report does not address mitigation options, except the assessment of carbon storage potential in coastal marine ecosystems ('blue carbon'). It is based on the assessment of nearly 7,000 publications and has received over 31,000 comments from 824 reviewers.
The entire report is available in English (www.ipcc.ch/srccl) as well as a translation into French of certain elements (technical summary, summary for policymakers, FAQs, glossary; see under "download report", at the bottom of the page "UN and other languages").
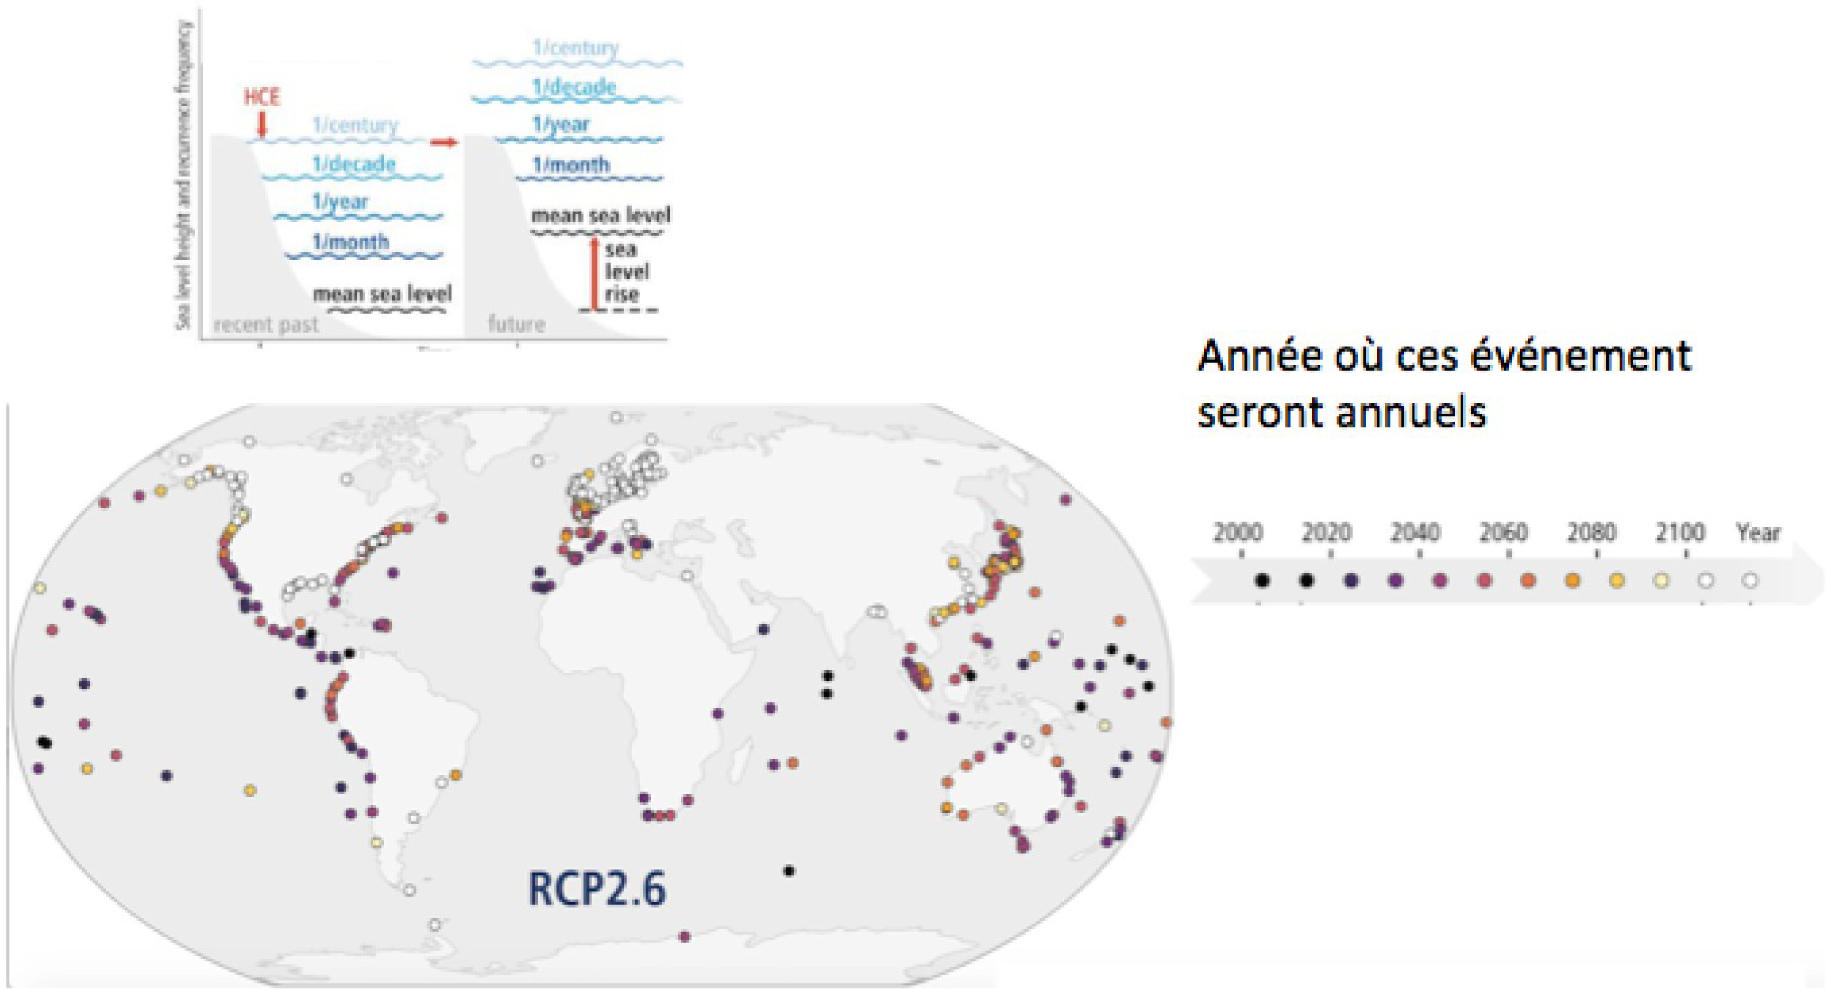
At the top, a schematic representation of high sea levels reached on a monthly, annual, decennial and centennial (HCE) scale, for the recent past, and for the future, due to the rise in mean sea level. Below, analysis of the year in which these centennial events will become annual, in the RCP2.6 scenario, based on regional sea level rise projections and known local variability at tide gauge sites [IPCC 2019b].
The main message of this report is that human-induced climate change already has a major cascading footprint on the systems on which we depend, from the top of the mountains, in the polar regions, on the coastline, to the bottom of the ocean. These changes will continue for generations to come. This inescapable dimension across decades to centuries highlights the importance of building resilience, risk management, and adaptation.
High mountain cryosphere regions are currently home to 670 million people; changes in this cryosphere also affect the billions of people living downstream, particularly through the storage of water in the cryosphere and the supply of water to rivers through melting ice during dry seasons.
In these areas, glaciers, snow, ice and frozen soils are declining and will continue to decline (Figure 18). This changes the seasons and places affected by local natural hazards, such as landslides, rockslides, avalanches and floods; alteration of terrestrial and aquatic ecosystems affect the structure and functioning of these ecosystems, with major issues of biodiversity conservation specific to high mountain cryosphere regions, and diversification issues (for snow-dependent tourism) and integrated water management including through cross-border cooperation for downstream communities. Indeed, in all scenarios, the annual and summer flow projections of glaciers peak before or at the end of the 21st century and then decrease. The consequences of these changes also affect the cultural identity of high mountain communities. This report highlights the benefits of improving knowledge and the need for local actors to increase their skills to implement risk management and adaptation strategies.
The consequences of global warming are particularly pronounced in the Arctic, where 4 million people live, and where the decline in the sea ice extent and snow cover contributes to an increased warming relative to the global average (Figure 19). In a scenario where global emissions decline sharply and warming is contained below 2°C, these changes continue until 2050 and then stabilise; in a scenario of a sharp increase in greenhouse gas emissions and warming of the order of 4°C, these changes increase until the end of the 21st century and beyond. The surface permafrost regions currently contain about twice the mass of carbon as the global atmosphere. In the first scenario, this permafrost area decreases by about 1/4 in 2100; it decreases by 3/4 in the very high-warming scenario, with significant consequences for disturbances of ecosystems and regional infrastructure, and whose consequences for greenhouse gas fluxes remain difficult to assess. The polar regions are going to be profoundly different in the future, and the extent of these changes will depend heavily on the level of warming to come. Local and global adaptation issues are major and depend on capacity, funding, and institutional support.
Changes occurring in the polar regions have global consequences, in particular through the loss of mass from the Greenland and Antarctica ice sheets. This mass loss has increased over the last decades by a factor of 2 (by surface melting) and 3 (by faster sliding) respectively, contributing, in addition to ocean warming and glacier melting, to an observed acceleration in the average rate of sea-level rise. The melting of the cryosphere has become the leading factor in sea level rise, and will to contribute to it on the scale of decades or centuries (Figure 20).
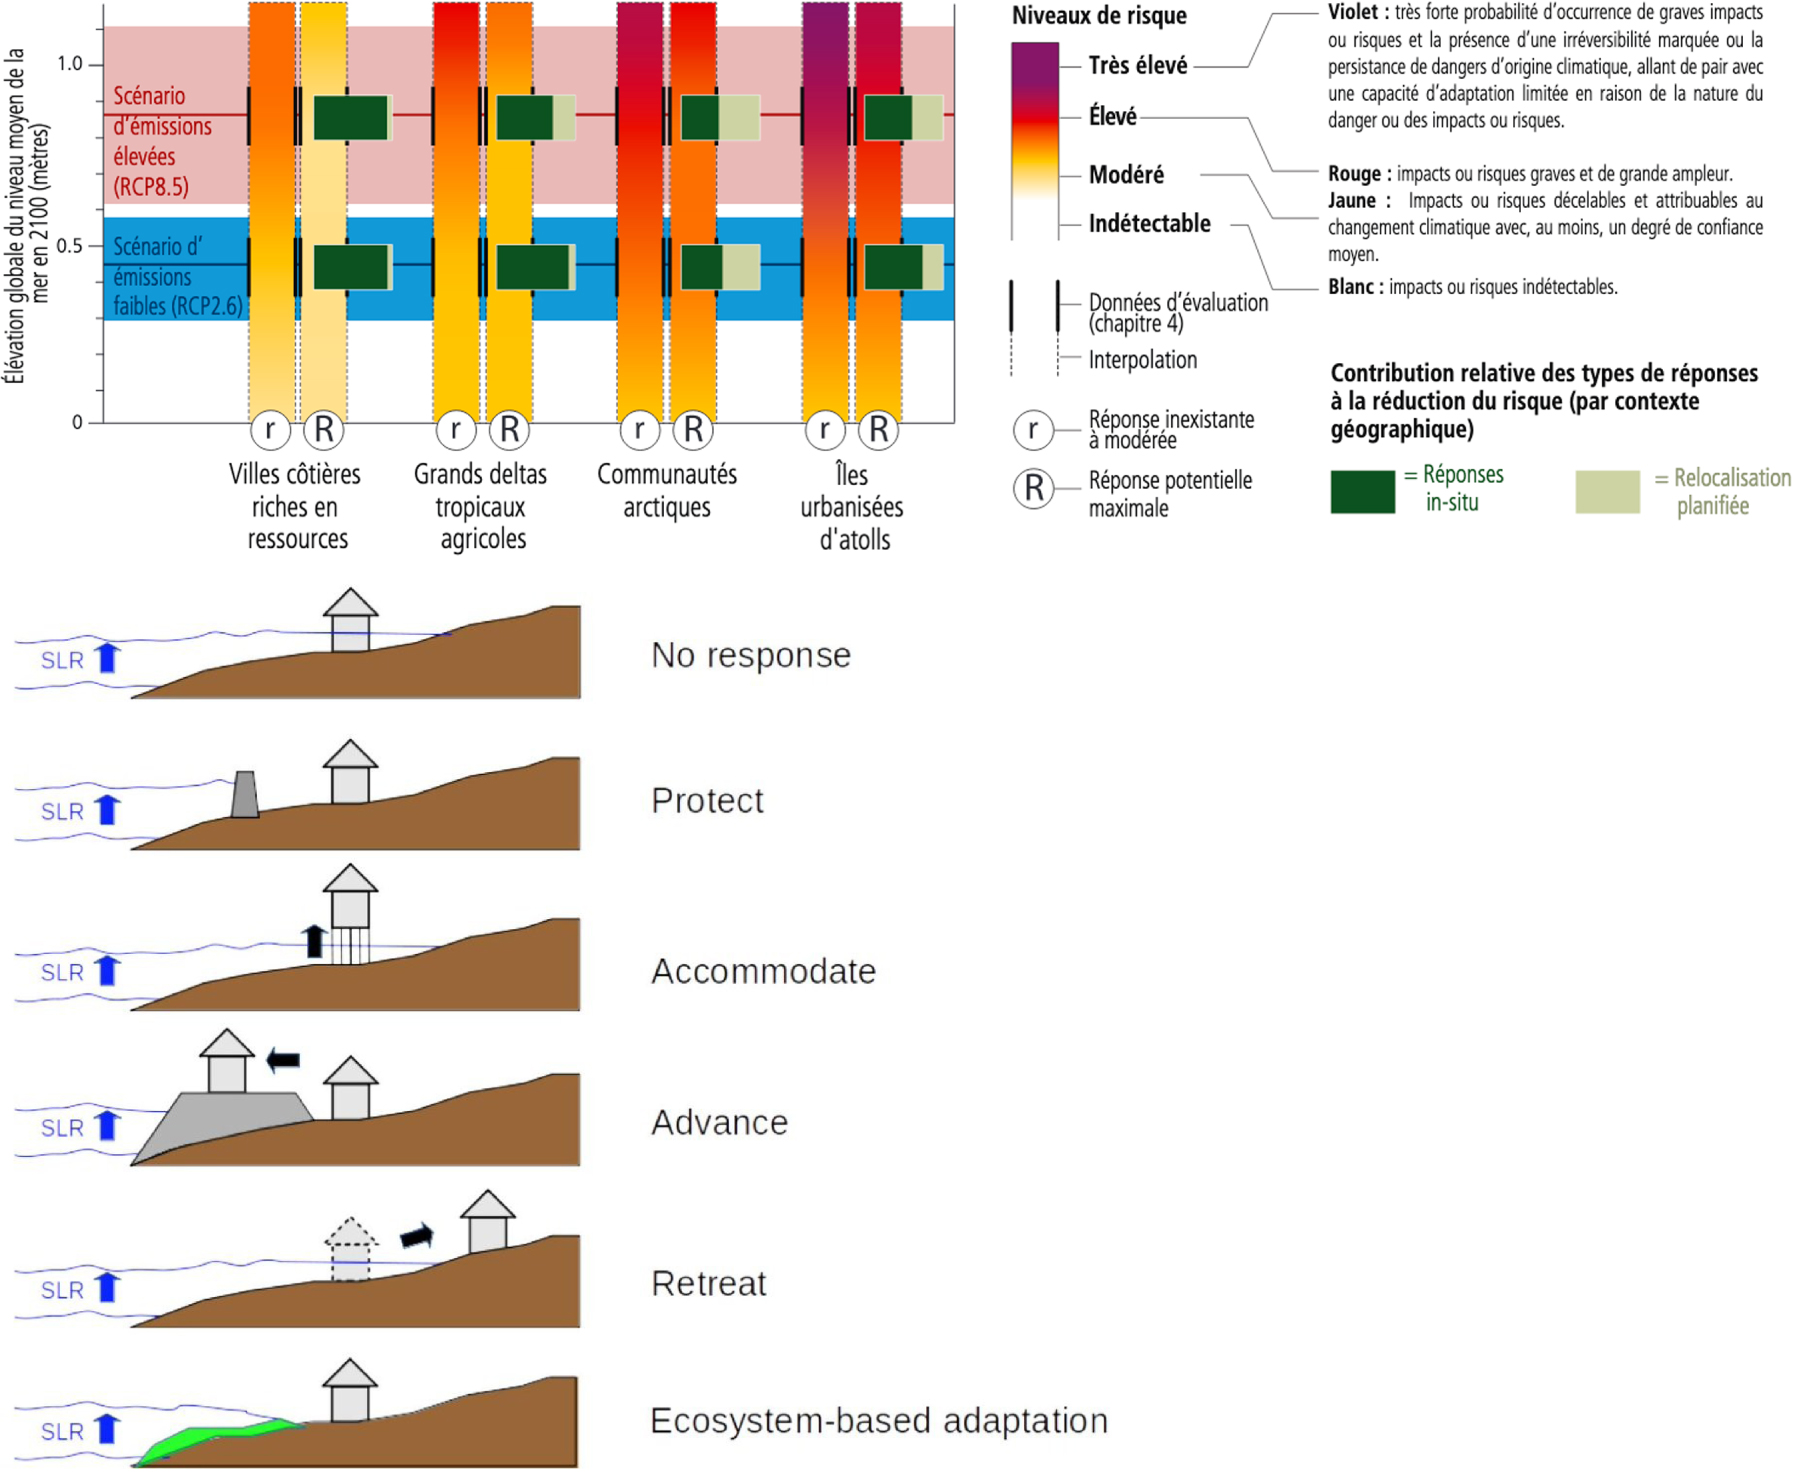
At the top, assessment of the level of risk associated with sea level rise for different geographical contexts (case studies), and risk reduction taking into account response options through adaptation and planned relocation, by 2100, and according to the amplitude of the mean sea level rise (vertical axis). Below, examples of response options [IPCC 2019b].
This rise in sea levels is a major issue for the 65 million people of Small Island Developing States and the 680 million people currently living on the coast (expected to reach 1 billion people by 2050). The main factor of uncertainty about future changes in mean sea level is the response of ice caps, including the possibility of dynamic instabilities (ice mass shifts) in some areas of Antarctica, which may increase the contribution of this region substantially over the likely range projected for 2100 and beyond. Projections estimated in this report indicate an additional sea level rise of about 45 cm by 2100 and 1 m by 2300 in a scenario of sharp greenhouse gas emission reductions, and of about 85 cm (with a likely range of up to 1.10m) in 2100 and several metres in 2300 in the most greenhouse gas-intensive scenario (Figure 21). The risks associated with the rise in mean sea level are not only those of this gradual rise, but also relate to the recurrence of very high sea level events. Events that occurred once a century in the past would occur annually by 2050 in many parts of the world, simply as a result of regional mean sea level rise (Figure 22). This does not take into account changes in other factors, such as the intensity of tropical cyclones. By 2050, many coastal cities, agricultural deltas and small islands will be exposed to flooding and land loss risks every year, and these risks will increase without major investments in adaptation.
Observations, historical simulations and projections for two contrasted ocean change scenarios [IPCC 2019b].
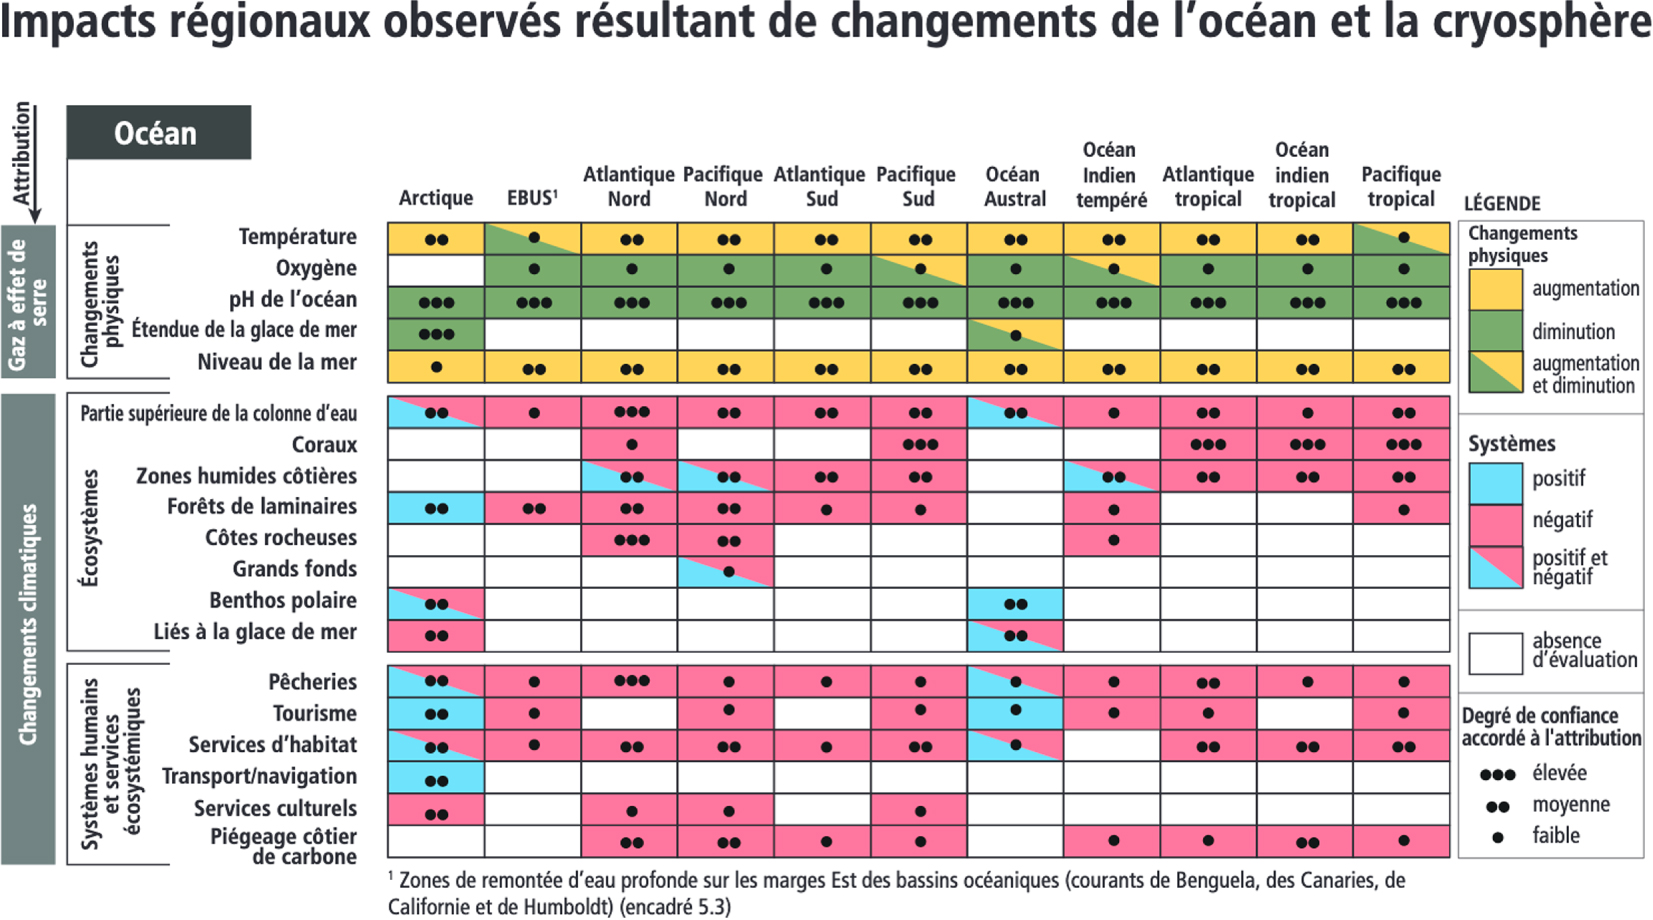
Assessment of ocean physico-chemical changes attributed to greenhouse gas emissions, and assessment of impacts on ecosystems, ecosystem services and human systems attributed to climate change, for different ocean regions. The confidence level is represented by the points. The colours of each box indicate the sign of changes, increase or decrease for the physico-chemical variables, and positive and/or negative impacts (within the same region, a heterogeneity of impacts exists). White areas indicate the aspects for which it was not possible to make an assessment of the state of knowledge [IPCC 2019b]. Masquer
Assessment of ocean physico-chemical changes attributed to greenhouse gas emissions, and assessment of impacts on ecosystems, ecosystem services and human systems attributed to climate change, for different ocean regions. The confidence level is represented by the points. The colours of ... Lire la suite
The issue of coastal management and local response measures or planning for a strategic retreat is essential to contain the risks associated with rising sea levels. The options for action depend on the context, and can rely on protection structures for dense cities, or adaptation solutions based on coastal ecosystems for agricultural delta areas. Reducing greenhouse gas emissions and implementing adaptation actions or strategic retreat measures can reduce and delay risks. As with many other aspects of the consequences of climate change, the most exposed and vulnerable communities and people are often those with the weakest capacity to respond, which also highlights the importance of cooperation in limiting loss and damage related to climate change.
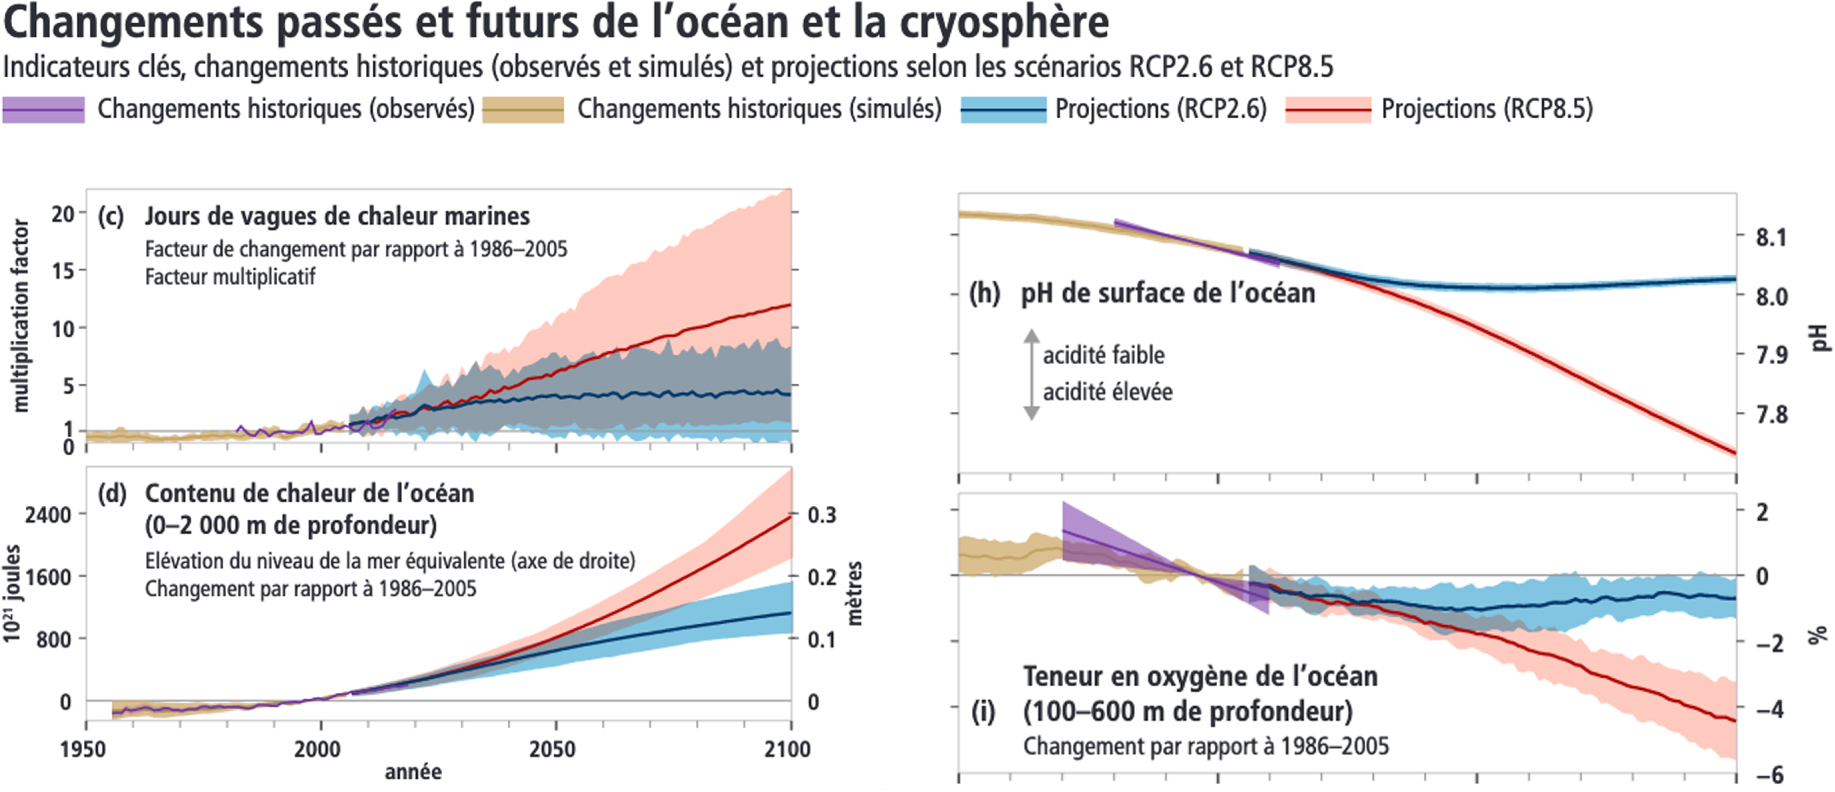
A warming ocean is an ocean with more intense and frequent marine heat waves, which continues to undergo acidification by capturing 20-30% of anthropogenic CO2 emissions, which mixes less with the ocean water due to a decrease in oxygen content below the surface (Figure 23). These changes in the ocean have (Figure 24) and will continue to have major impacts on marine life, its distribution and productivity (primary productivity, biomass of marine animals, fishing catch potential and nutritional security). Risks for all marine and coastal ecosystems are highly dependent on the level of warming, and therefore on choices made (or not) to rapidly and significantly reduce greenhouse gas emissions (Figure 25).
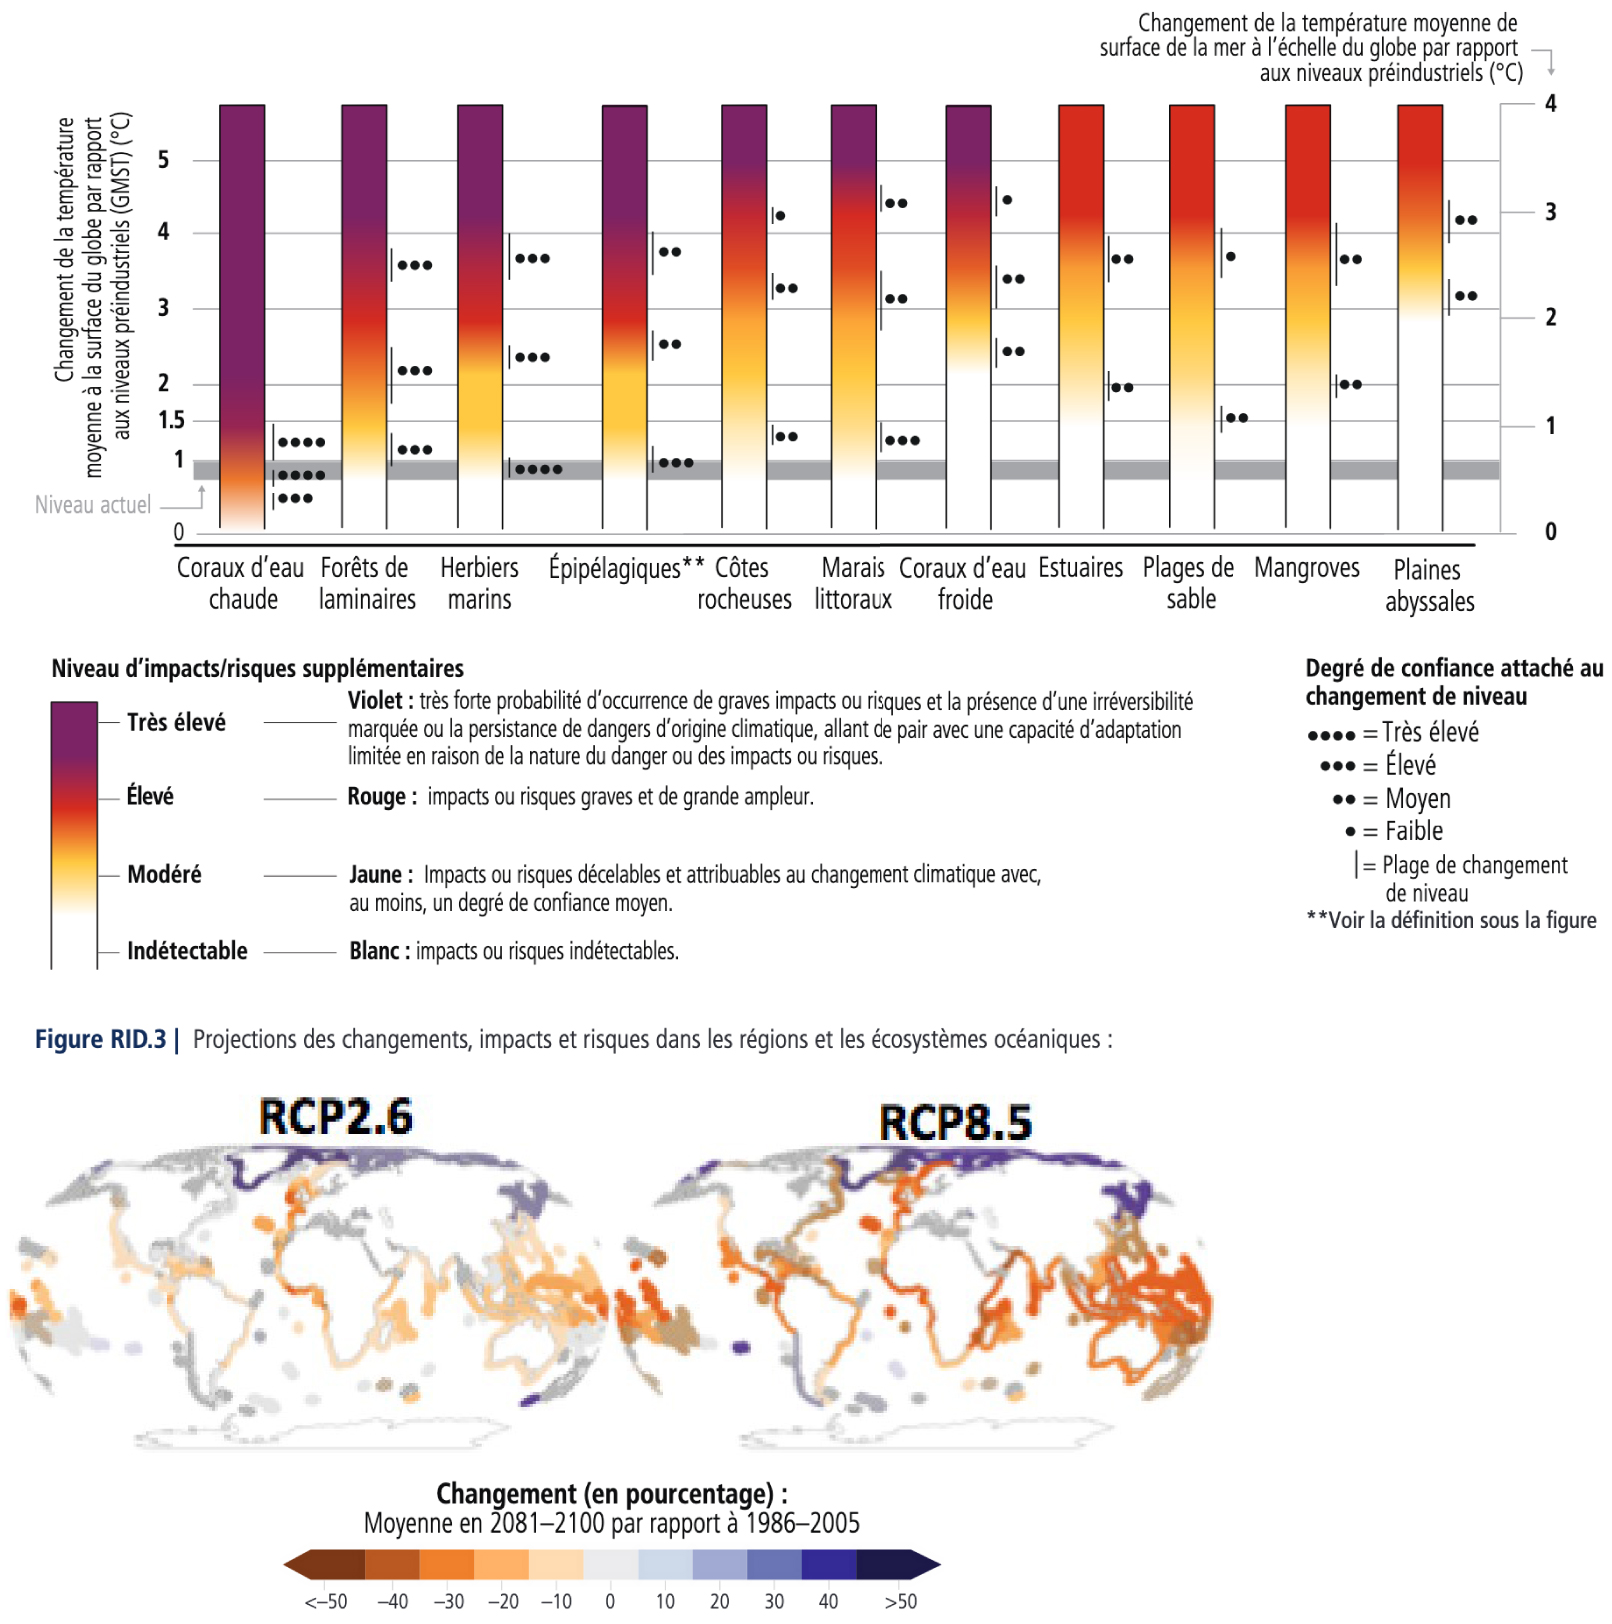
At the top, impact risk assessment (taking into account hazards, exposure and vulnerability) for a set of marine ecosystems as a function of the level of global warming. At the bottom, projections of change in maximum fishing catch potential in percent for the RCP2.6 scenarios (left) and RCP8.5 (right) in 2080–2100 compared to 1986–2005. Note that there is significant uncertainty associated with the projections for the Arctic region [IPCC 2019b].
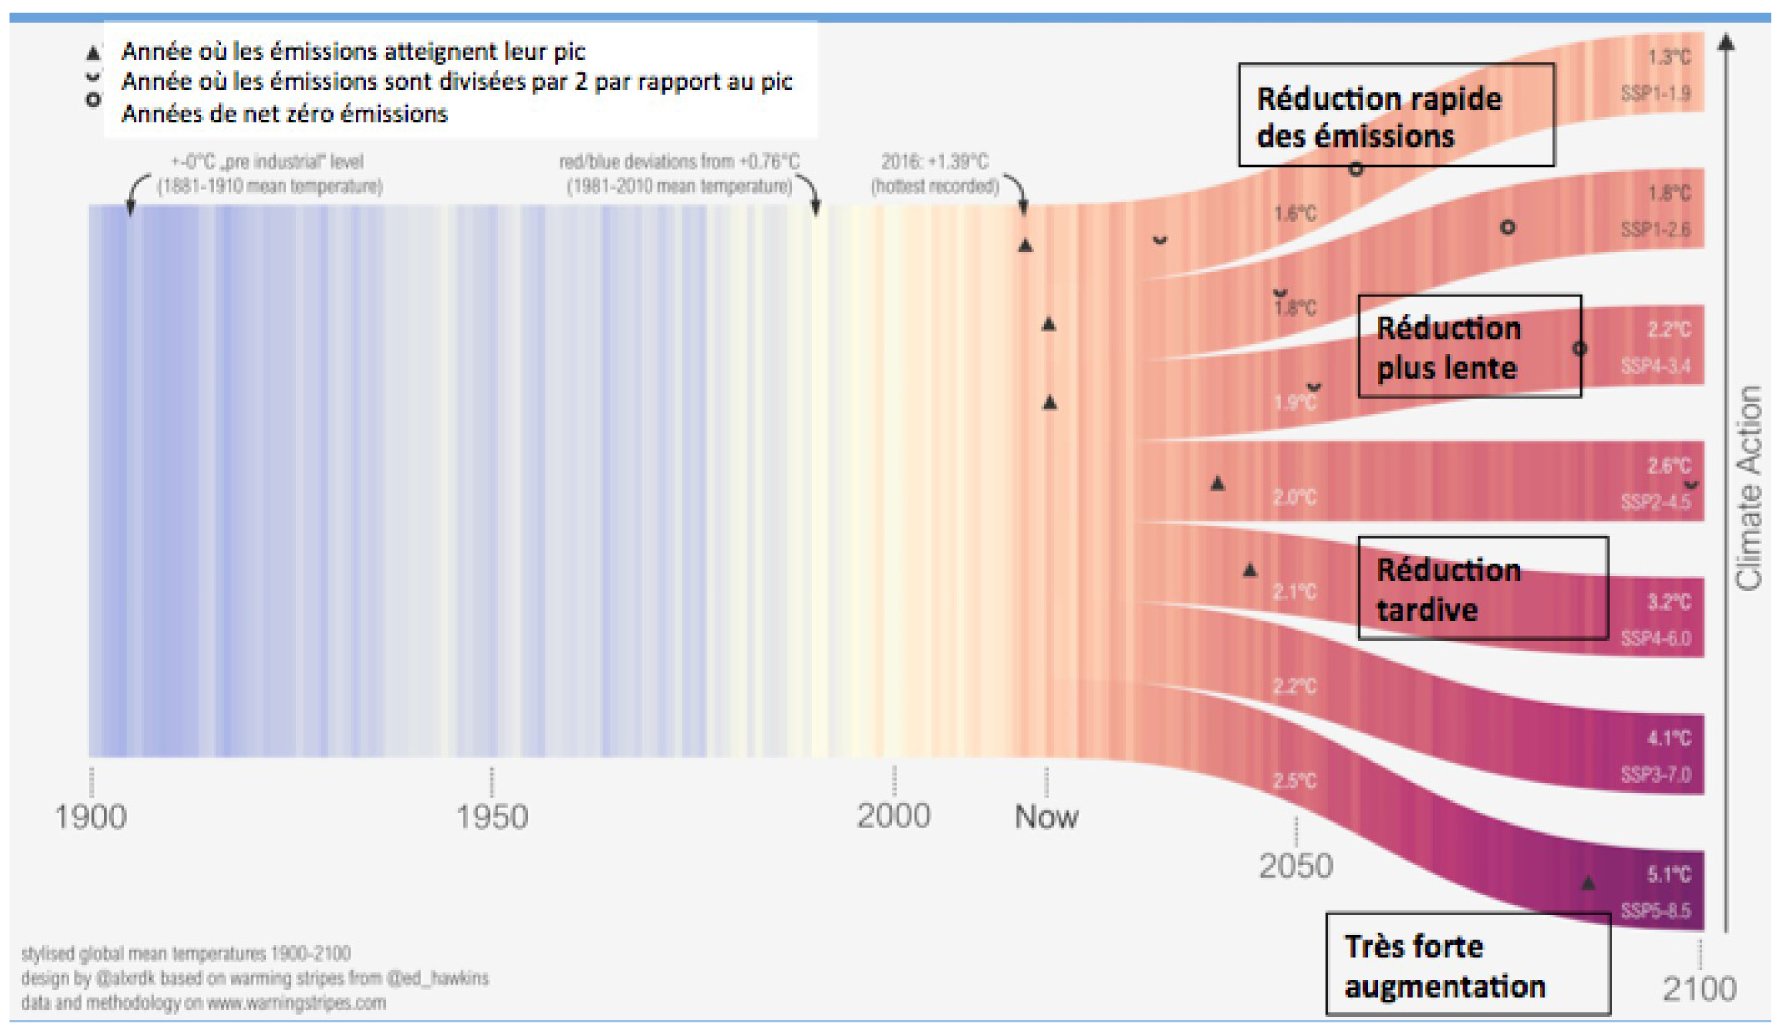
Very schematic representation of a range of possible futures, depending on the pathways of greenhouse gas emissions (the SSP scenarios, "Shared Socio Economic Pathways", which describe contrasting socio-economic changes and for which the label on the right, for example 1.9 or 8.5, is an estimate of the radiative forcing in W/m2 by 2100), representing a simplified calculation of the climate response to these different scenarios (the range of natural climate variability is not represented here), using the visual code of Figure 1 (one year, one bar, from blue to red for the difference compared to the period here 1881–1910). The observed warming is represented until 2016, then the projections. The scenarios differ in the year when global CO2 emissions peak (black triangle) and are halved from the level of this peak (black semicircle) and reach net zero (black circle). The estimated level of warming for 2050 and 2100 is indicated. Further analysis is underway to assess the uncertainty range associated with these projections, taking into account natural climate variability as well as the range of uncertainty of the climate response to radiative disturbances ("climate sensitivity"). Source: warningstripes.com. Masquer
Very schematic representation of a range of possible futures, depending on the pathways of greenhouse gas emissions (the SSP scenarios, "Shared Socio Economic Pathways", which describe contrasting socio-economic changes and for which the label on the right, for example 1.9 ... Lire la suite
Changes in the ocean are already causing changes in the distribution of fish populations, and have reduced the maximum fishing catch potential; this decline will continue in tropical regions (Figure 26), affecting communities that depend on seafood for their food and nutritional security. Policy options, such as fisheries and marine protected area management, and the reduction of other pressures, such as pollution, offer the potential to minimise livelihood risks by enabling the ocean to be more resilient.
This report on the ocean and cryosphere concludes that the sooner we act, the better we will be able to cope with inevitable changes, manage risks, improve living conditions and ensure the sustainability of ecosystems and people. It highlights the urgency of giving priority to immediate, ambitious, coordinated and tenacious action.
7. Final comments
If there is one message to take away from this state of knowledge, based on the three IPCC Special Reports of 2018 and 2019, it is that in the short term there is this imperative for adaptation action to build resilience, through risk management and adaptation, and that our choices in terms of greenhouse gas emissions will have major consequences on the extent of warming and associated risks beyond 2050. If action is taken to massively reduce global greenhouse gas emissions, it is possible to contain the extent of global warming by 2050, but other consequences, such as rising sea levels, will inevitably continue for centuries. The commitments made by different countries under the Paris Climate Agreement imply increasing global emissions of greenhouse gases until 2030; at this rate of ambition, warming is projected to reach around 2°C in 2050 and 3°C or more by 2100 (Figure 26).
These special reports show the importance of integrating all the knowledge provided by the different disciplines and the importance of putting climate action options in the broader framework of the different dimensions of sustainability (via the Sustainable Development Goals, for example) to better identify actions that maximise benefits, and take into account the risks of adverse effects. They highlights the need to combine knowledge from the academic world with the diverse knowledge of actors from the field. Finally, they highlight the importance of education and continuous training in building a skills base for climate change (the concept of "climate literacy").
At the time of writing, the COVID-19 pandemic and the lockdowns implemented to limit its spread have led to significant temporary decreases in CO2 emissions, due to a slowdown in industrial activity and land transport, but also maritime and air transport [Le Quéré et al. 2020; Liu et al. 2020], and then increased again (https://carbonmonitor.org/); experience from previous economic and financial crises shows that a rebound effect will occur. The choices that will be made in terms of boosting economic activity in the coming months will shape the pathways of greenhouse gas emissions for the years, even the decades to come [Hepburn et al. 2020].
1Intergovernmental Panel on Climate Change, GIEC in French.
2ppmv : parts per million volume.
3ZJ : zettajoule, or 1021 J.