


 CC-BY 4.0
1. Introduction
Forests in France have been absorbing carbon over at least the past 150 years, mainly due to the delayed effect of favorable tree demography, following the plantations of new forests and the expansion of trees over abandoned agricultural lands—particularly in mountain regions, northwestern plains and southern France (Lambin and Meyfroidt, 2011; Denardou-Tisserand, 2019). This trend reflects a broader European phenomenon known as the forest transition (Mather et al., 1999). Early afforestation for land protection started in the 19th century (Landes, Sologne, mountain restoration) and the long-lasting policy of coppice conversion into standard forests to deliver timber wood, initiated in 1830, has led to increased forest density. During this period, harvest pressure has lowered due to fossil fuel utilization, and remained relatively modest. Natural mortality rates were low. This transition led to a significantly larger average stock per hectare, as the demand for fuelwood declined with the development of alternative energy sources. Consequently, as wood removal from harvest and wood losses from natural mortality remained lower than the growth of forests, the result was increased carbon storage (Bontemps, Denardou, et al., 2020)—a trend also reflected in European forest statistics (Bontemps, 2021).
The French national forest inventory aims to provide a reliable estimation of wood volume and its changes through time by sampling trees at systematic locations. While it also delivers statistics on forest carbon stocks (ING, 2024), more detailed analyses of carbon fluxes intended for national and international reporting purposes are processed by CITEPA (https://www.citepa.org/), using prior expertises on the issue (e.g. CARBOFOR project, 2004). Of note, the NFI sampling design has changed over time, which currently limits the set-up of a long-term and harmonized vision of the forest carbon sink. Between 1961 and 2004, only decennial, departmental, and spatially asynchronous inventories were implemented, and all forest fluxes were estimated by retrospective methods. After the severe wind storms Lothar and Martin in 1999, extensive systematic and annual samples of non-permanent plots were established in 2005. The samples are renewed every year to meet the growing standard of annual forest inventory, thereby strengthening the forest monitoring frequency (Bontemps and Bouriaud, 2024). In 2010, initial samples started being revisited once after five years (notion of semi-permanent plots, with visits termed N and N + 5 in the following) to reliably estimate forest harvests, in addition to the standard renewal of annual systematic samples. In 2015, this system was extended to the measurement of mortality and growth. As a result, flux statistics established over the long term lack consistency across the full 1990–2022 period covered in this study.
This study is based on the publicly available data originating from the National Forest Inventory and on other data sources, processed by CITEPA, the national carbon inventory agency. We analyze how carbon stocks and fluxes causing stock changes in forests have changed between 1990 and 2022, as reflected in these official data. The analysis of the net carbon sink is complemented by studying the evolution of gains from forest growth and losses from natural mortality and harvest. The results are shown at the scale of Metropolitan France and large (NUTS2) administrative regions. We present and comment on these data, including net carbon changes and gross gains and losses at national scale in Section 3, and on a regional scale in Section 4. We show that natural mortality has increased dramatically over recent years in different regions. We present in Section 5 more information about where in France trees have been dying, which species have been dying more frequently, and which size of trees have been more affected over the last years. Section 6 is dedicated to a prospect on new mapping and estimation facilities supported by the development of remote sensing (RS) and machine-learning technologies.
2. Data sources and methods
2.1. National forest inventory
2.1.1. Sampling design and mensuration protocols
The National Forest Inventory (NFI) survey is based on a systematic, annual, two-phase (aerial and field) and two-stage sampling design, implemented to provide reliable forest estimates at national and regional scales in support of public policies. Annual samples are drawn as gridded subsets from a systematic grid, organized into panels so that both each individual year and each set of five successive years maintain systematic spatial coverage across the territory, thereby ensuring spatial representativeness at multiple temporal scales (Bouriaud et al., 2023).
A typical sampling unit is also called a ‘forest plot’ and has a maximum radius of 15 m (0.1 ha) for tree assessment and typically contains between 5 and over 100 trees. During the first visit, measurements are taken of the diameters of the observable trees (⩾7.5 cm diameter) at a conventional breast height (1.3 m above the ground), while the height is measured only for a subsample, with a statistical model-based imputation which can be applied to the tree heights that are not measured. Using allometric equations depending on height and diameter, volumes of standing wood (stem or aerial volume) in the sampled forest are obtained. Growth is estimated using tree coring at breast height, focused on the last five years of growth at the first visit, and is combined with volume allometries to estimate volume growth. It is supplemented by the total volume of new recruitments (trees that have grown above a threshold diameter in the meantime, or ingrowth term). Although future growth information will be derived from differences in tree circumference measured between successive 5-year inventories, it currently remains based on tree coring data collected at the initial (N) visit, reflecting growth over the previous five years.
The trees which were established as cut, dead or windthrown (at the N + 5 visit) also make part of the “production” variable, with the assumption that they were still growing for 2.5 years before being cut. The field measurements make an inventory of the trees that died from natural causes, i.e., were alive during the first visit but were found dead during the second one. Of note, dead trees that are harvested before the second visit (as can be the case in e.g. massive decline events such as bark beetle attacks) will not contribute to the mortality, but rather to the harvest flux. As such, massive mortality can therefore drive harvest increases, without being entirely identified as such. The census reports the percentage of trees that were harvested with evidence of being cut and removed between the first and the second visit.
Since 2010, each year, up to 7000 plots have been newly sampled based on a predefined sampling plan, and up to 7000 plots are re-visited from the same locations that were sampled for the first time 5 years before, thus in total, ca. 14 000 plots are measured each year.
Importantly, harvest measurements taken before 2010 were exploratory and long considered unreliable by the NFI, due to inaccuracies in the stump inventory and dating protocols on temporary plots. Recent research works (Audinot, 2021; Denardou-Tisserand, 2019) have confirmed their negative bias, with historical underestimation by ca. 50%. For those reasons, harvest rates have been assessed from external data sources by CITEPA before 2010, including the Enquête Annuelle de Branche from the Agricultural statistics based on wood fluxes transformed in the sawmills (AGRESTE, 2022), and the energy wood survey of environmental statistics (La consommation de bois-énergie des ménages en 2020, 2024). The temporal continuity of harvest statistics over the study period (1990–2022) is therefore not guaranteed, and has not been studied so far.
2.1.2. Associated statistical inference
To obtain the changes in volume and carbon stocks in forests over the entire country or a large region, a statistical inference method is applied to the ensemble of the forest plots, with methodologies of survey sampling (Duong et al., 2024) that allow for the computation of an uncertainty on the estimates. Currently, the precision achieved for the national estimate of growing stock volume is approximately 1.5%. On the scale of smaller regions (e.g., individual forests), the high heterogeneity of French forests—where 1-ha parcels can host diverse species, tree sizes, and management histories—results in inevitably higher uncertainty due to limited sample size. Error quantification can be accessed in practice using the online tool OCRE (https://ocre-gp.ign.fr/ocre).
Standard forest inventory statistics provide mean changes as five-year running averages to increase estimate precision. However, this comes with a known risk of lagging behind evolving forest trends or sudden events (Van Deusen, 2002). Estimates for successive median years gradually reflect such changes: for any given disturbance, a growing proportion of the annual samples includes it over the five years, until its full impact is reported without bias. For example, if a single-year climate shock causes significant tree mortality—such as the severe summer drought and widespread fires in 2022—its full effect will only be fully captured in the five-year running average by 2027. That said, statistical inference can also be performed using individual annual samples for more immediate needs, although this comes at the cost of greater uncertainty. For instance, the damage assessment following the Klaus storm in 2009 was based on plot revisits conducted within that same year (IGN, 2010).
In accordance with the NFI resolution, statistically rare events are prone to more uncertain assessments, as reflected in the variance of estimation. For instance, in 2022, 60 000 ha of forests were affected by fire events, corresponding to roughly 0.35% of the forest area. With 7000 plots re-measured in 2023, only about 25 plots would fall within a disturbance domain. This is a major reason why ongoing research in forest inventory is developing remote sensing-based inventory, and disturbance-based design approaches as monitoring options adapted to the current environment (Van Deusen, 2000).
2.2. Citepa
The most recent year for which data are available is 2023, published in 2024. The data are based on the national official report of France to the UNFCCC compiled by the national inventory agency CITEPA (https://unfccc.int/documents/627737). CITEPA provides additional information on regions of Metropolitan France in the National Inventory Document (https://unfccc.int/documents/645100). Data from different cycles of the National Forest Inventory with changes in sampling strategies were aggregated by CITEPA. The period 1976 to 2004 has ca. 12-year successive inventory cycles with fully renewed samples performed at the department administrative level (NUTS-3) with a rotation across departments every year. A non-documented interpolation method was used by CITEPA to elaborate a regional and nationwide overview of forest fluxes. The 2005–2009 period was the first period covered with systematic annually renewed samples. The period 2010 to current has added a single 5-year revisit with identification of harvested trees since 2010, and actual tracking of trees that died since 2015. To deal with those methodology changes the CITEPA methodology did not use inventories over 1976–2004, but used inventory from 2005 onwards, provided a point estimate for 1990, and made an interpolation between 1990 and 2005 (see UNFCCC National Inventory Document—2024 report https://unfccc.int/documents/645100 page 261).
3. Changes in carbon sinks on a national scale
3.1. Carbon sink from the CITEPA inventory
Figure 1a shows the carbon budget of the forest sector in France from the national inventory agency CITEPA, with negative values indicating fluxes of CO2 removed from the atmosphere and positive values indicating fluxes of CO2 lost to the atmosphere. A reporting year n uses inventory campaigns up until year n − 2 and uses a five-year moving window for the last five years. The net annual carbon balance (black curve) demonstrates a net forest carbon sink along the period. This net carbon sink increased from 49.3 MtCO2⋅yr−1 in 1990 to a peak of 74.1 MtCO2⋅yr−1 in 2008. During this first period, the linear rate of relative increase was 2.45% yr−1. After 2008, the sink declined and reached a value of 38.8 MtCO2⋅yr−1 in 2022. This large decrease in the sink after 2008 is not linear and follows three stages. From 2008 to 2013, a small decrease in the sink was observed, starting with a drop in 2009 from the Klaus storm. From 2013 to 2017, a rapid and large sink decrease of 43% was observed. After 2017, the sink remained stable at a low value of 37.8 MtCO2⋅yr−1. Over 2013–2017, we observed a slight reduction in the growth of established forests (dark green bars) together with a noticeable increase in tree mortality (red bars). Since each year, France sends a national communication to report its emissions and sinks of greenhouse gases to the United Nations Convention on climate change (UNFCCC), we collected reports published from 2020 to 2024 from the UNFCCC website to evaluate the consistency between successive reports. Significant changes are identified, with the 2021 edition underestimating the recent sink decrease, and the 2023 edition overestimating this decrease compared to the latest 2024 edition (Figure 1a). These changes reflect the inclusion of new sites measured by the inventory each year, thus impacting the five years moving window estimates (Van Deusen, 2002; Roesch et al., 2002). They are also sensitive to changes in the protocols or conventions for computing forest carbon accounting estimates (Van Deusen, 2002). Climate shocks leading to abrupt carbon losses in one year will be smoothed in time by the 5-years reporting window of inventory. For France, extra carbon losses from wildfires are however included using a specific yearly approach.
(a) Forest carbon gains and losses and net change in Metropolitan France. Carbon sequestration or CO2 removal from the atmosphere annually from the growth of living trees in established forests, the contribution of new forests, the increase in soil carbon and litter, and storage of wood products are based on either measurement campaigns from the national inventory updated each year or models and calculations for soil carbon, or using the life cycle of products for wood product pools. Carbon gains are reported as negative numbers in the figure. Carbon losses from harvest (brown), mortality (red) and large disturbances (storms) are reported as positive numbers. The net change is the thick black curve from the latest national report of France, the thin curves are previous estimates published by CITEPA in previous years. (b) Comparison between the net carbon sink in biomass reported by CITEPA (solid line representing a five years average) and our direct stock change estimate of ≈7000 forest plots measured each year during each NFI campaign with a five years running average(dotted line with black dots). The variability in the dotted curve reflects noise in the statistical sampling to have a national stock change estimate. Since 2006, the reported emissions (solid line) correspond to a 5 years smoothing of the direct stock change (dotted) and the whiskers on the right show the average uncertainty of annual fluxes (black = 1-sigma and grey = 2-sigma). (c) Net carbon sink of forests (black) and net greenhouse gas flux of the whole land use sector including forests and agriculture (pink) compared to the national neutrality trajectory (‘Stratégie Nationale Bas Carbone’ SNBC) from SNBC-2 (pink lines) revised for the current period and the two future five-years periods until 2030 and the SNBC-3 (orange lines) with the land use sector objectives being revised down. The pink curve is a smaller sink than the forest sink because of agriculture emissions of CH4 and N2O. Units are Mton CO2-equivalents.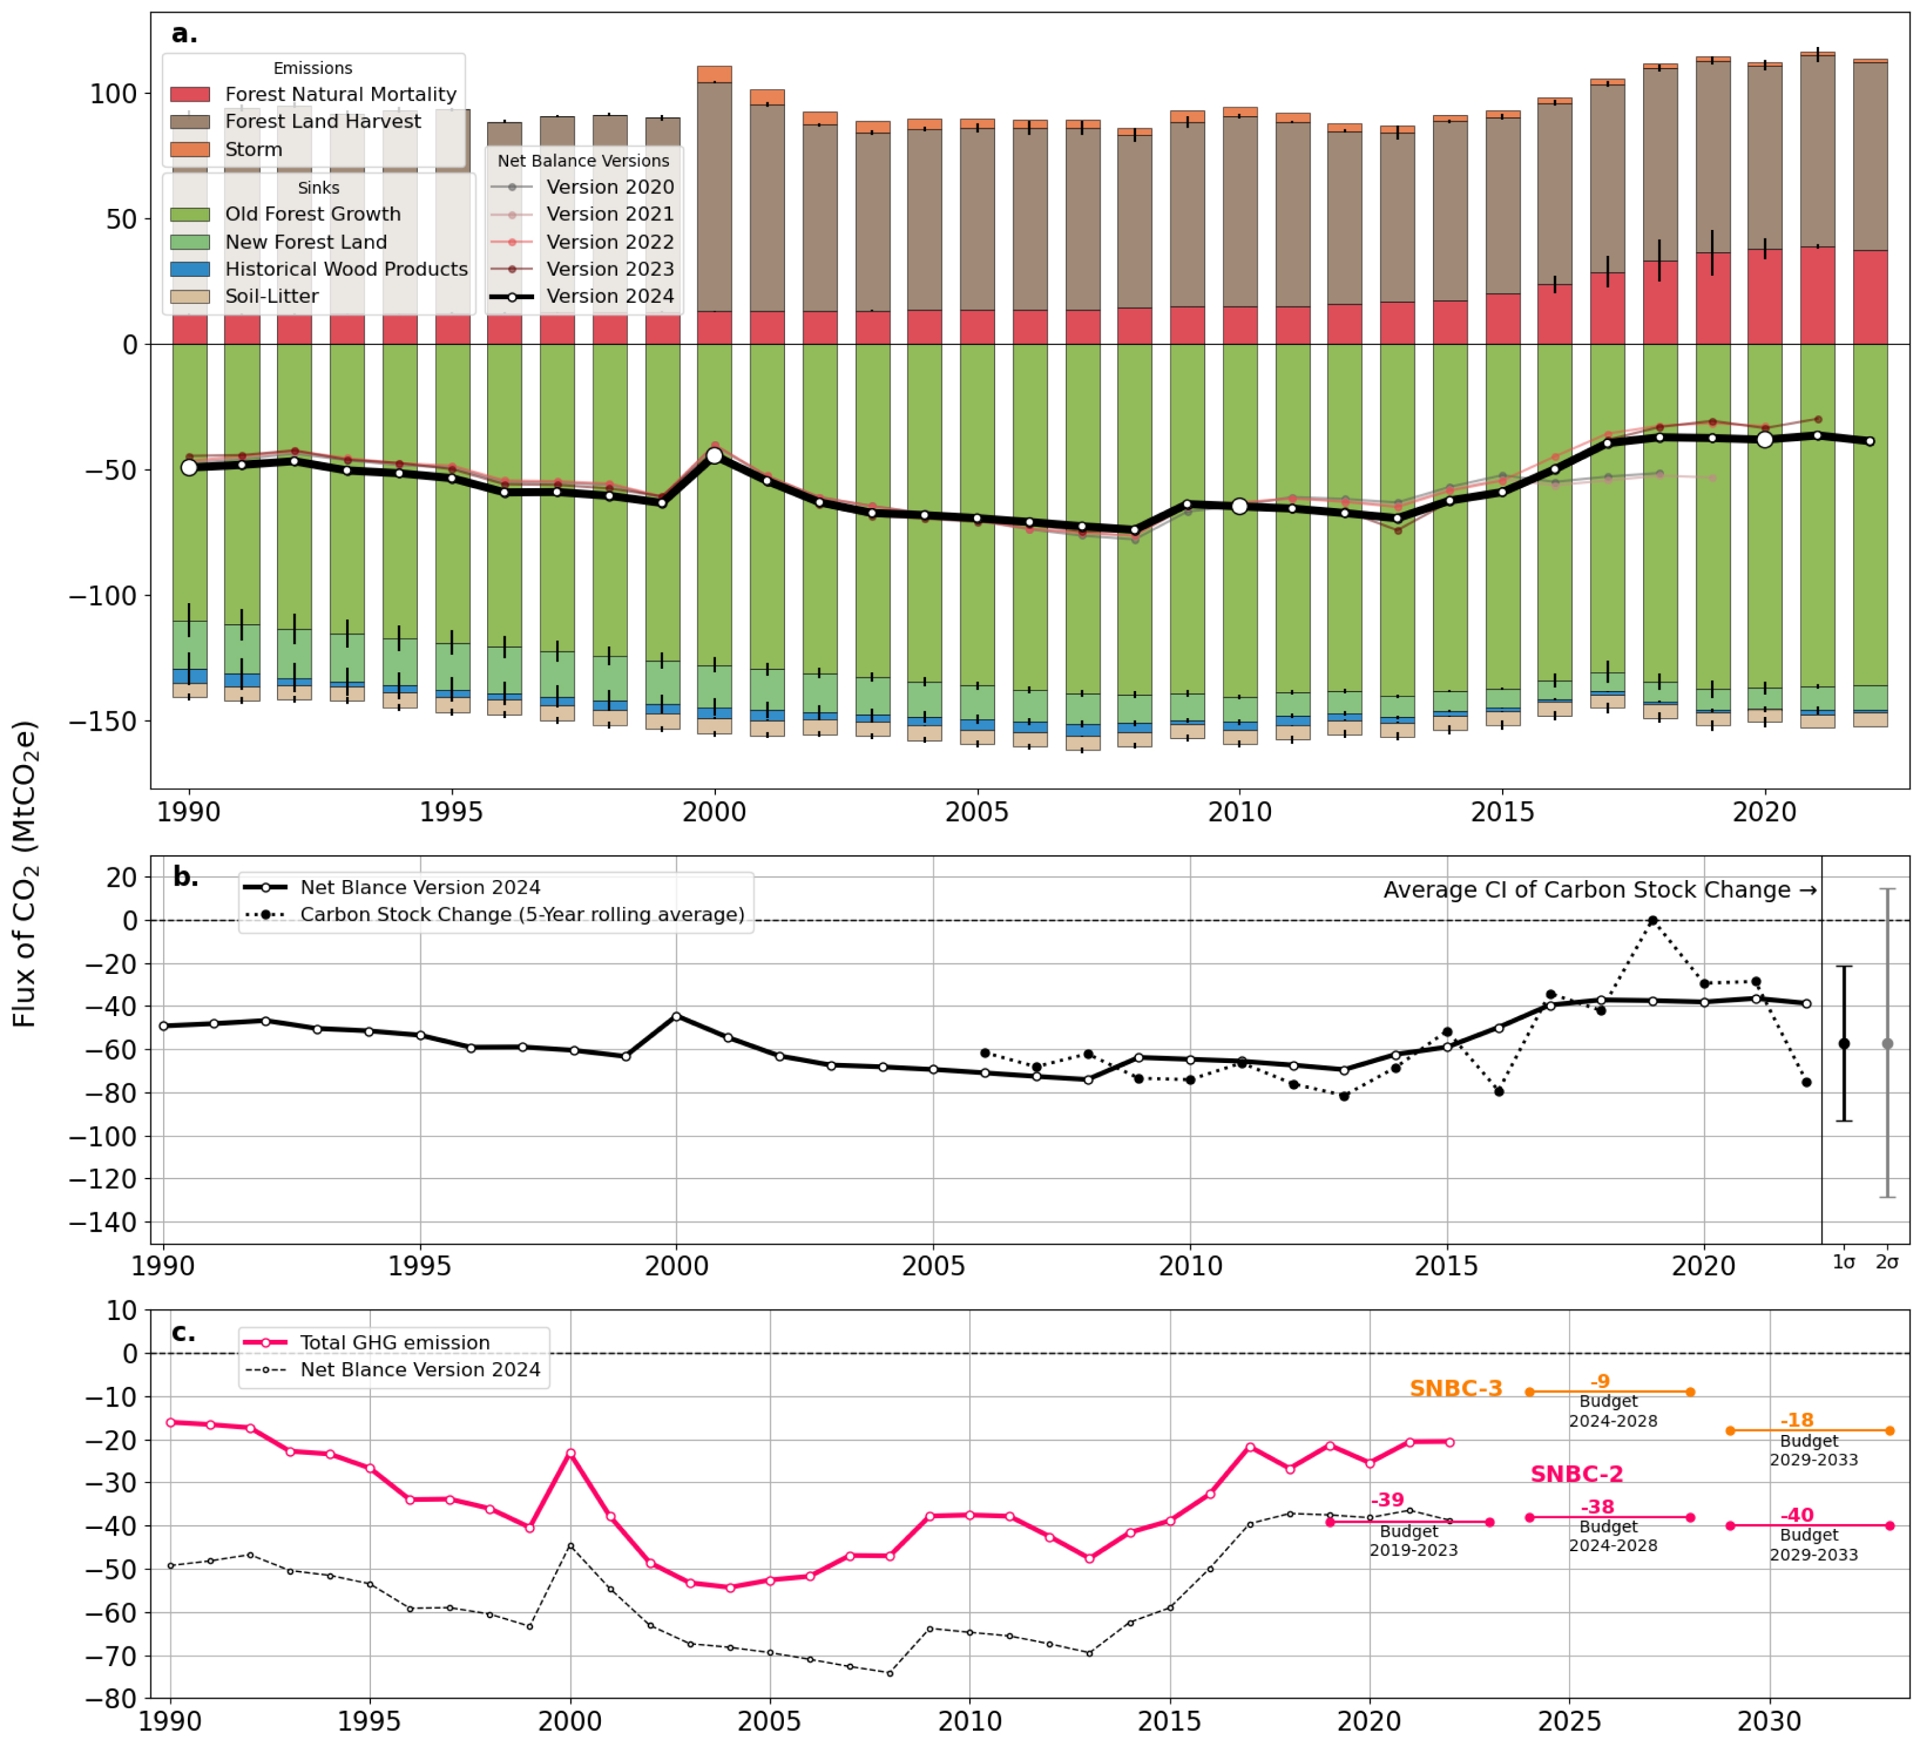
3.2. Gains
3.2.1. Growth
The annual gains were found to be dominated by the growth of established forests (light green). The growth of those forests has evolved roughly in parallel with the net carbon gain (R2 = 0.74, p < 0.05) from 1990 to 2008, with the increase and decrease in total growth before and after the maximum of the net carbon sink in 2008, explaining 47.70% of the variation of the net sink. Interestingly, the growth of forests reached a maximum in 2014, then decreased slightly by 5.51% to reach a minimum in 2017 and remained stable or slightly increased between 2017 and 2022 (see for a recent detailed analysis of inventory data Hertzog et al., 2025). New forests from areas converted from another land use (dark green) accounted for 9.3 ± 3.4% of the total annual gain, which is a CO2 removal from the atmosphere of 13.3 MtCO2⋅yr−1 and appears larger than what may be expected. The carbon sink of these new forests steadily declined from 19.49 MtCO2⋅yr−1 in 1990 to 10.05 MtCO2⋅yr−1 in 2022, and remained fairly steady until the years 2000, reflecting a slowdown in the area of new forests each year during the whole period, to which the disruption of the national forest fund plantation program (FFN) may have contributed to a delay.
3.2.2. Soils
The change in carbon stocks in deadwood, soil and litter is only reported for new forests created from other land use types (light green bar in Figure 1a) using emission factors. For established forests (dark green bars in Figure 1a), a neutrality assumption is made that there is no storage of soil carbon. In contrast, measurement of soil carbon change at 120 long-term forest monitoring sites in France (ICP-2 monitoring network, or RENECOFOR—mature forests with little management) suggests a large rate of increase in soil carbon of 1.28 tCO2⋅ha−1⋅yr−1 (Jonard et al., 2017). On the other hand, meta-analysis shows that after a clearcut and intensive management, up to 20% of the top soil carbon is lost to the atmosphere, partly neutralizing the role of a carbon sink in forest soil. This loss of carbon from management activities is not included in the National Inventory.
3.2.3. Wood products
The third component of carbon gain is the storage of wood products in long-lived pools such as construction materials, furniture and landfills. This term is not measured but calculated using harvested timber input data and sectoral models of wood transformation and lifetime in different pools. Wood products are a carbon sink, which means that their mass increased over time, but this sink represents a very small component (4.9 ± 2.60%) of the total carbon sink in the forest sector (blue bar in Figure 1a) and it decreased from 5.40 Mton CO2⋅yr−1 in 1990 to 1.09 Mton CO2⋅yr−1 in 2022. This implies that despite carbon storage in wood products being recognized as a climate mitigation option, the efficiency of this sink has decreased in France, probably reflecting an increasing share of wood harvested being transformed into fuelwood for residential heating and power production, as well as a lower quality of wood products aimed at reducing costs, which leads to more wood ending up in landfills. The limited contribution of forest products to the overall sink is also reflected in the European Forest strategy, with the priority to favor the in-situ forest sinks (European Commission, 2021).
3.3. Losses
3.3.1. Harvests
The annual losses shown as positive numbers in Figure 1a are the sum of harvest removals (brown bars) and natural mortality (red bars) encompassing disturbance-driven mortality (fires, diseases, insects, drought, frost, small storms) and background mortality induced by competition between individuals in denser forests, and large disturbance events (orange bars) mainly from two storms reaching explosive development rates, Lothar and Martin on December 26–29, 1999 and Klaus on January 23–24, 2009 (Ulbrich et al., 2001). The main factor of carbon loss remains harvests with a loss of 75.8 ± 5.1 Mton CO2⋅yr−1. The removal of wood by harvest has offset about half of the annual growth during the whole period from 1990 to 2022. More precisely, during the first period of 1990–2008 when the net carbon sink increased, the harvest offset 58.5 ± 7.8% of the growth. During the second period from 2008 to 2017 when the carbon sink quickly decreased, harvest has offset 52.0 ± 2.7% of the growth. During the more recent period from 2017 to 2022 with a stable net carbon sink at a low value, the harvest offset 55.4 ± 1.4% of the growth. The stability of this ratio indicates that there has been no long-term increase in harvest pressure in French forests. Moreover, during the entire period, variations in harvest explained 26.0% (R2 = 0.26) of the variations in the net carbon sink, thus twice as less as the variations in growth, but together accounting for 75% of the changes in the net C sink.
3.3.2. Disturbance events
The effect of salvage harvest consecutive to tree death caused by the two storms is discernible in Figure 1a. Lothar and Martin in December 1999 laid down 300 million trees (Abraham et al., 2000) that is 7% of the total growing stock volume, mainly in the Atlantic region for Martin, and in Normandy and the northern part of France for Lothar. This loss was equivalent to three years of normal harvest (Gardiner et al., 2013). A fraction of the uprooted and broken dead trees were salvaged and sold later by the wood industry, showing up as a peak of harvest in 2000 and 2001 in Figure 1a. A smaller increase of harvest is also observed after the storm Klaus in 2009 which laid down 42 millions of m3 of wood mainly in the Les Landes plantation forest (Pawlik et al., 2022). Mortality from extreme winds during these cyclones affected large contiguous areas of forests, causing massive tree losses, while small windblown events during other years may be under-sampled by the inventory. Analysis of airborne photos, ground surveys and models made it possible to estimate separately the immediate carbon losses during the srorms and the legacy carbon losses from non-harvested dead trees and branches (IFN, 2009; Les tempêtes de décembre 1999 - Bilan national et enseignements, 2003). The net CO2 emissions (orange bars in Figure 1a) represent 5.65% of the total carbon loss during the year of the event, with a legacy effect of 5.02% of the total carbon loss during the following five years.
Besides the two peaks of carbon losses from storms, the second largest cause of carbon loss after harvest is natural mortality (red bars). Between 1990 and 2001, natural mortality was stable or increased very slowly, and represented 13.1 ± 0.7 Mton CO2 per year, equivalent to 15.3 ± 0.9% of the loss due to harvest. After 2013, mortality accelerated and was multiplied by about a factor of two between 2013 and 2017. During this period which saw a large decrease of the net carbon sink, the increase of mortality explained 51.5% and a coincident increase of harvest explained 48.5% of the sink decrease, respectively. Note that the increased harvest signal could reflect the salvage harvest of recently dead trees after mortality events. Intriguingly, the crisis period of dying trees in the French forests appears to have started before severe droughts and heatwaves recorded in 2018, 2022, 2023, even though 2015 was marked by a strong water deficit (Orth et al., 2016). Between 2018 and 2022, despite more frequent and more severe summer heatwaves and droughts, natural mortality has remained large but it has not increased further (Figure 1). Over this recent period, natural mortality represented 48.7% of the losses, an unprecedented loss of wood for the economy. Mortality may form an even greater fraction of harvest since salvage harvest or sanitary cuts over insect-affected areas after mortality events will be classified as harvest by the inventory when cut during the 5 years preceding the reporting year. An accurate separation of mortality-driven and management harvests is not possible to date, as it would require a faster remeasurement of inventory plots than after 5 years, with a substantial impact on the sampling design. The issue is under consideration at a research level.
Importantly, deadwood has likely increased over time in response to recent mortality events, but changes in deadwood carbon are not measured by the inventory, except after the two cyclones and not reported in national reports. Possibly, deadwood carbon is now increasing on forest floors, which results in a transient carbon accumulation in French Forests but will give a legacy carbon emission in the near future when recent dead woody debris will decay.
3.4. Carbon sink in biomass national report vs. direct stock change from inventory
Figure 1b compares the net forest carbon sink in biomass of living trees reported by France with a direct year-to-year carbon stock change estimation from ≈7000 forest plots calculated in this study using forest inventory inference based on annual samples, with a moving average of the past five years. The variability in our biomass stock change (dotted curve in Figure 1b) reflects the statistical sampling error of the inventory when producing an annual stock estimate even after applying a 5-year smoothing, and is reflected by the large error bar on the right-hand side of Figure 1b (a reason for which annual estimates are not routinely delivered). We observe that the direct stock change method gives a smaller carbon sink smaller than the national report in 2019–2021 but a larger sin in 2022.
3.5. Implications for France’s carbon neutrality goals
France has adopted a national law on carbon neutrality (Stratégie Nationale Bas Carbone—SNBC) which defines and revises carbon emissions budgets for different sectors for successive five-year periods. For land use, land use change and forestry sector (LULUCF), the first SNBC-1 published in 2015 did not have any specific target. While other emitting sectors have specific targets, the SNBC-2 had a target sink for the LULUCF of −39 Mton CO2e⋅yr−1, revised to −43 Mton CO2e⋅yr−1 in 2024 for the first budget 2019–2023, which is about the magnitude of the forest sink alone (Figure 1c) (French Government, 2020). However, this target defined in CO2 equivalents also include emissions and absorptions in the LULUCF sector outside forests, mainly in croplands and grasslands, which have emitted around 9 Mton CO2e⋅yr−1 in recent years. Hence, the current objective of SNBC-2 for the LULUCF sector as a whole has not been met, and further goals in 2024–2028 and 2029–2033 shown in red in Figure 1b are unlikely to be achieved. The government has reduced ambition in the LULUCF sector and the SNBC-3 has proposed a more modest sink goal of −9 Mton CO2e⋅yr−1 for 2024–2028 and −18 Mton CO2e⋅yr−1 for 2029–2033 (French Government, 2024). Will the current forest sink remain stable, the objective will be met. If it further reduces in view of increased disturbances, reducing growth (Hertzog et al., 2025), and the long-delayed effect of forest renewal and afforestation policies (https://agriculture.gouv.fr/francerelance-le-renouvellement-des-forets-francaises), SNBC-3 goals set for the next decade may prove challenging to reach. We also note that increasing deadwood caused by the increase of natural tree mortality was recently added in the inventory and resulted a large upward revision of the carbon sink in French forests, with the increase in deadwood representing 41% of the sink instead of 1% before the mortality crisis as noted by Haut Conseil pour le Climat (2025). This deadwood carbon will be decomposed and re-emitted to the atmosphere as CO2 in the coming years, and will thus diminish the carbon sink in the future. In absence of a detailed description of how deadwood was included by CITEPA as cited by the Haut Conseil pour le Climat (ibid.), this component was not included in Figure 1.
4. Changes in carbon fluxes at the regional scale
4.1. Regional carbon fluxes from the CITEPA reports
To gain insight into the contribution of each region to the nation-wide reduction of the carbon sink, we analyzed regional trends. Figure 2 shows carbon gains and losses for 13 administrative regions (NUTS2) in France. Carbon removal from the atmosphere in ‘old established’ forests (light green bar) is inferred from the growth of living trees; the development of new forests (dark green) is based on a modeling approach with annual land use change data and emission factors; the increase in soil carbon and litter remains estimated as at a national level only for those new forests. Carbon losses are from harvest, mortality, and large disturbances from storms as in Figure 1a. Of note, changes in wood products pools are not reported per region but they are shown at national scale in Figure 1a.
Same as Figure 1a but for 13 administrative regions of France indicated in the map.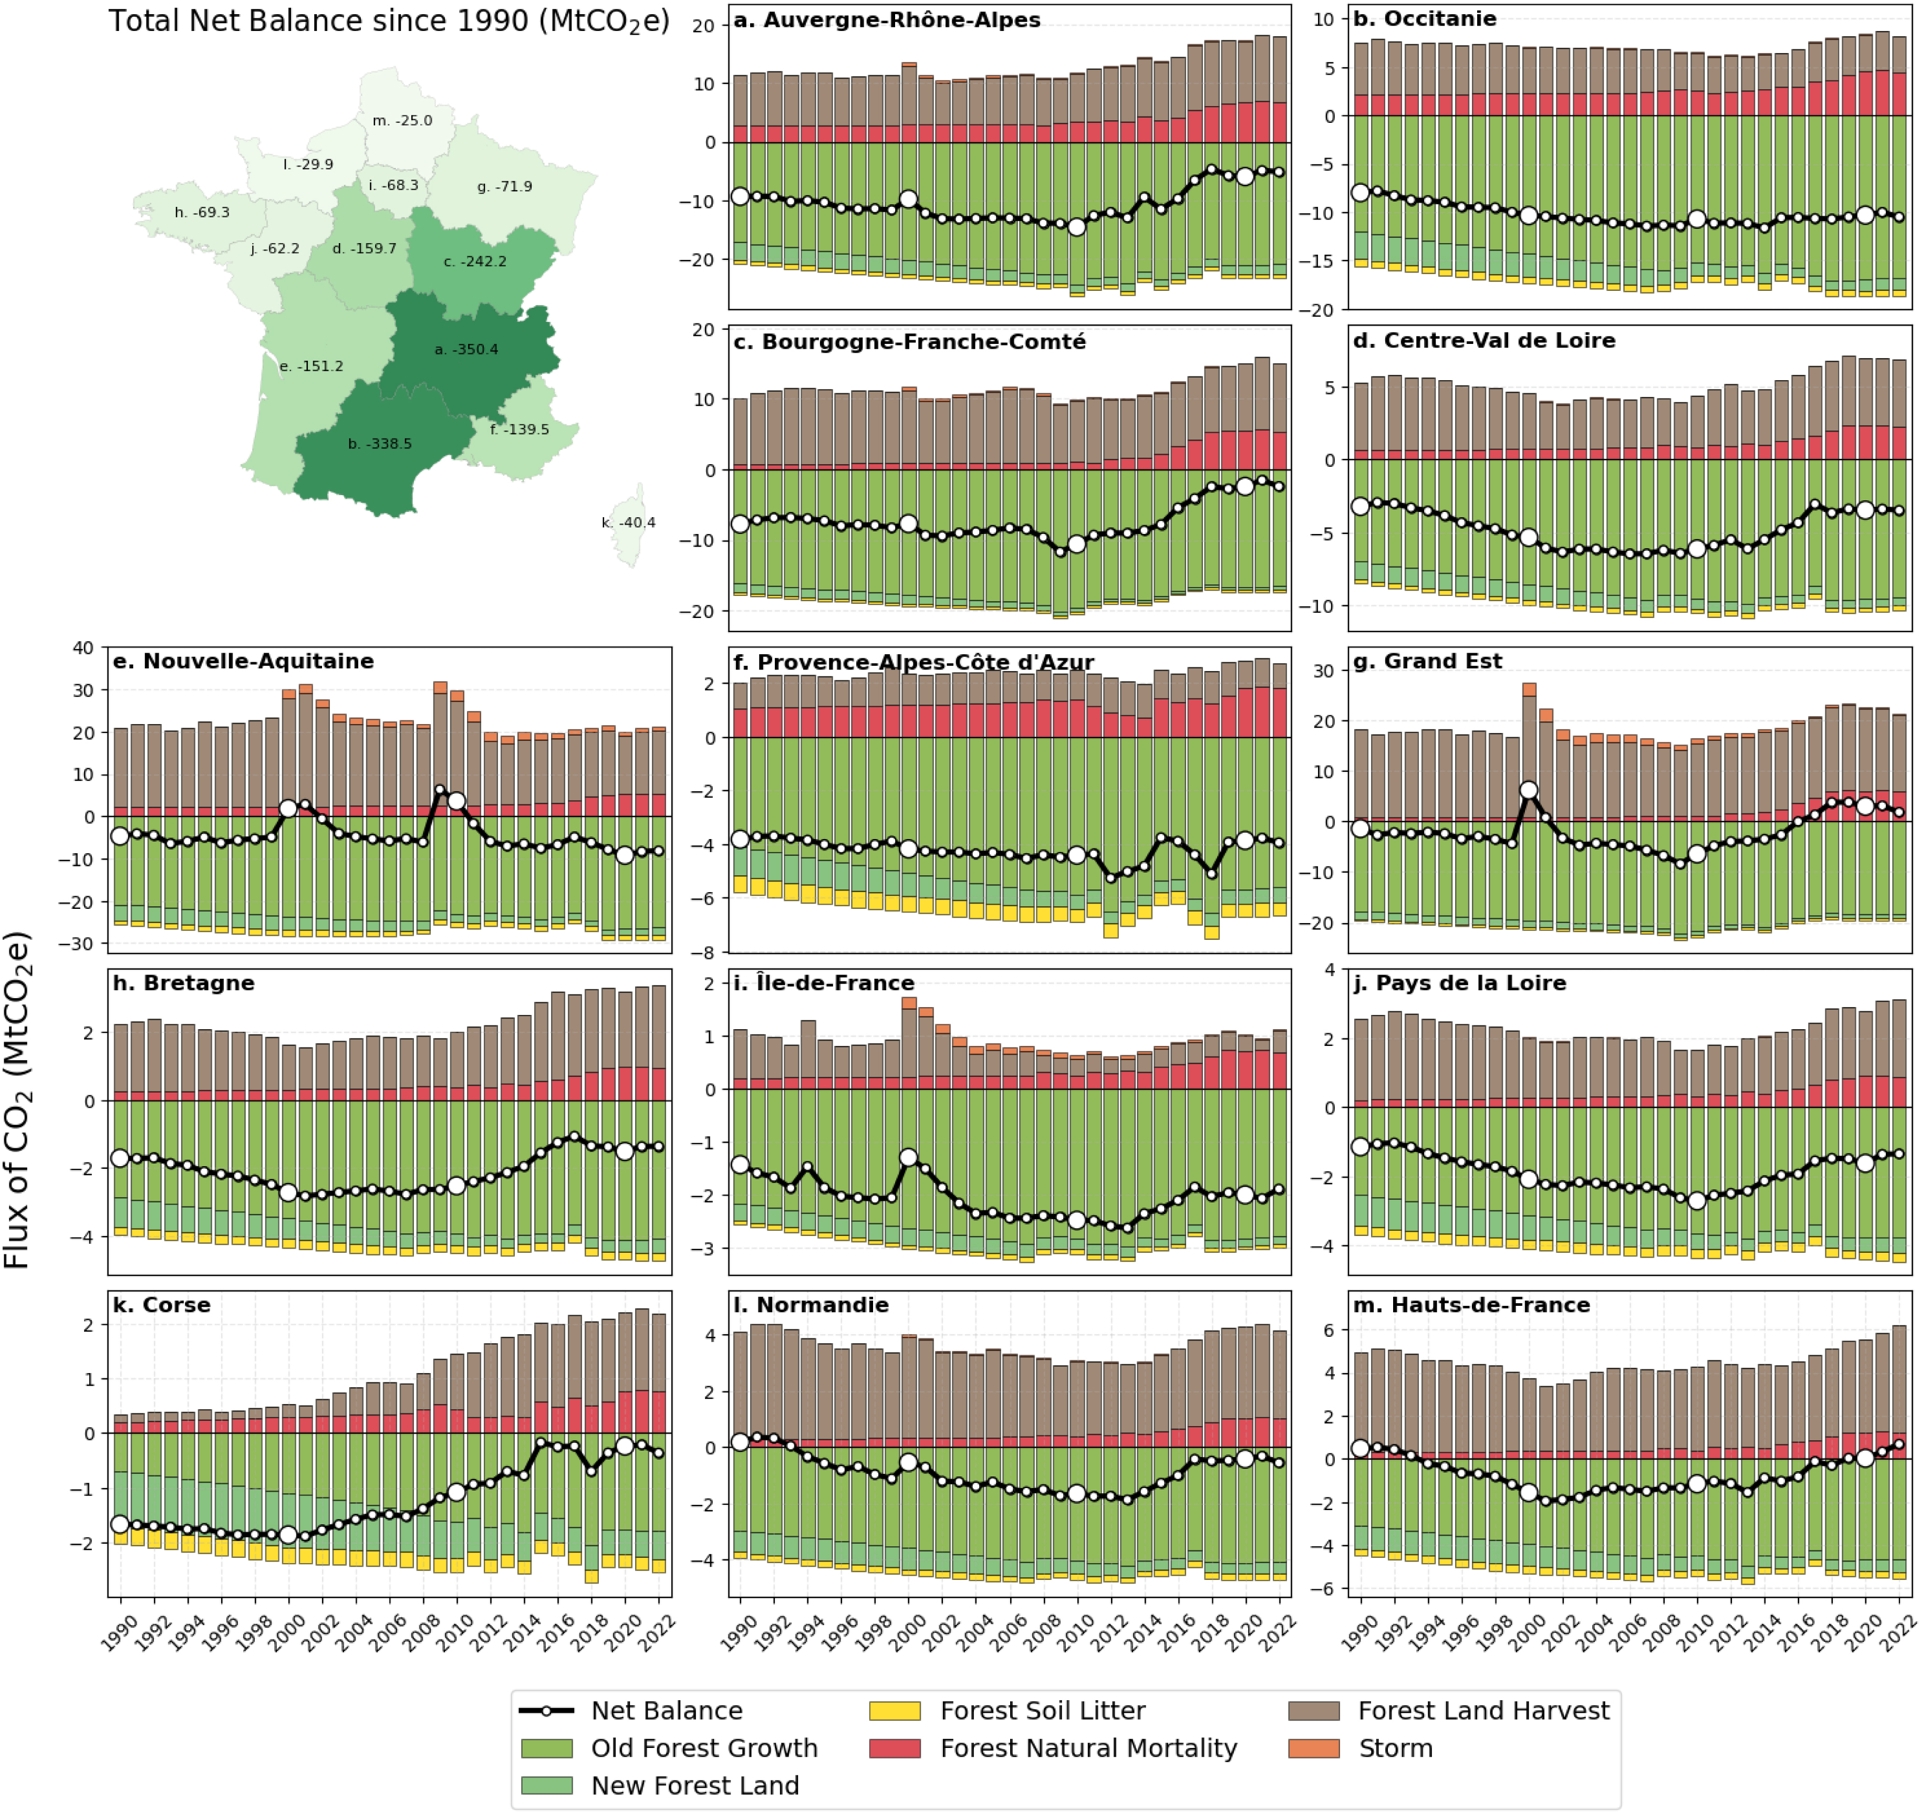
Contrasted trends were observed across the 13 regions of Metropolitan France in Figure 2. The Hauts-de-France and Grand Est forests have become net emitters of carbon to the atmosphere in recent years, meaning that they no longer contribute to mitigating climate warming. Other regions saw a strong decline of their carbon removal rates, which approached zero like in Normandy, Corsica and Bourgogne-Franche-Comté. There is no straight relationship between management intensity and the decline of the carbon sink in the west and the north of France. For instance, the intensively managed plantations of Les Landes (Figure 2e), largely reafforested after the storms of 1999 shows an increasing sink. Also, while quite intensively managed, broadleaved and conifer forests in Northern and eastern France show a strong decline (Figure 2g and 2m). The southern regions of Occitanie (Figure 2b) and Provence (Figure 2f) where forests are less intensively managed, show a sustained carbon sink. In contrast, Corsica went from a large sink to nearly zero, as harvest increased enormously in that region (Figure 2k) (Suvanto et al., 2025).
The net carbon sink reached a peak earlier than the national average (2008) in Britany (Figure 2h), Corsica (Figure 2k), Centre Val de Loire (Figure 2d), and Hauts-de-France. The steepest decline of the sink during the period when the national sink declined from 2008 to 2017 is of 8.2 ± 2.0 Mton CO2⋅yr−1 (8.7 ± 9.2% per year). The signature of the two storms is more apparent at the regional level. Lothar and Martin in 1999 caused the strongest decreases of the carbon sink in Nouvelle-Aquitaine, Grand Est and Ile de France followed by a rapid recovery in the four consecutive years whereas Klaus in 2009 affected mainly Nouvelle-Aquitaine. In each of these impacted regions, a transient increase of harvest reflecting salvage wood recovery is observed. In Provence and Corsica which are the most frequently burned regions (Vallet et al., 2023) extreme fire years of 2009 and 2016–2017 caused a loss of carbon sinks of 28.40%, followed by partial recovery. The extreme fires in 2022 in Nouvelle-Aquitaine with 23163 ha of forest area burned are not yet fully assessed in the latest 5-year average data available from the national inventory and will likely show up as a large carbon loss in that region, estimated by an independent study at 6.23 Mton CO2⋅yr−1 (ibid.).
Harvest increased dramatically in Corsica after 1998, and in Brittany and Hauts-de-France, Pays de Loire after 2013, in parallel with a rise of mortality. It is impossible to assess whether this increase in harvest is a consequence of sanitary cuts of dead trees or if it is due to other factors. Interestingly, the ratio of harvest-to-growth is larger in northern regions (average 0.86 ± 0.32) where most forests are accessible production forests than in southern and mountain regions (average 0.41 ± 0.20) where lack of access and terrain limit the extraction of wood. The lowest harvest-to-growth ratio is found in Île-de-France (0.21), Provence-Alpes-Côte d’Azur (0.22), Occitanie (0.31) and the highest one is in the intensive plantation of Les Landes with a typical harvest rotation of 20 years.
From Figure 2, natural mortality increased in all the regions almost coincidentally around the year 2013, but the magnitude of the increase differs strongly between regions, with the smallest increase in Provence-Alpes-Côte d’Azur (6.46% per year after 2013) and Occitanie (7.15% per year) and the highest in Corsica (10.40% per year) and Auvergne-Rhône-Alpes (9.28% per year). In Grand Est affected by droughts and massive bark beetle attacks on spruce forests after 2018, mortality increased dramatically after 2015. In all the regions, mortality showed a sharp increase between circa 2013 and 2017–2020 and remained stable thereafter, despite severe droughts in 2022 and 2023, but increased carbon losses may be expected from future inventory campaigns. The reasons why mortality increased in 2013 across a majority of regions is still unclear. Previous heat waves like the one of summer 2003 did not seem to cause a large increase in mortality, and the warming rates have been high over the last decades but did not suddenly accelerate in 2013. It should first be stressed that mortality encompasses both climate-driven and density-driven mortality (Charru et al., 2012), which are not separated to date. In view of forest capitalization in France (Bontemps, Denardou, et al., 2020), density-dependent mortality is prone to increase, regardless of climate change, making direct interpretation uneasy. Second, harvests are being estimated since 2010 using semi-permanent plots, while they were estimated from external and indirect sources before from the Enquête Annuelle de Branche, et enquête bois énergie. However, the years 2010–2015 are not impacted by changes in the mortality estimation protocols which became implemented in 2015, and used officially only as of 2019 based on semi-permanent plots. Changes in the NFI protocol have been implemented to increase the accuracy of forest fluxes, in a monitoring perspective requested by public policies, in view of ongoing climate change (Hervé et al., 2014). A major consequence however lies in the difficulty of obtaining a robust long-term temporal view of forest changes concomitant to accelerated climate warming in France, urging an unprecedented effort to homogenize past data and establishing a firm retrospective reconstitution of forest carbon in France.
4.2. Changes in tree mortality across regions, species, and height classes
More insight into tree mortality in France across species, and tree size classes is presented in this section by analyzing the NFI data collected during first visits between 2010 and 2018, with re-visits occurring five years later from 2015 to 2022. Following a revision of the sampling protocol in 2015, each tree in the sample (619 496 trees from 50 012 forest plots) was individually monitored to determine survival or mortality over the five-year re-visit period. This approach improved the accuracy of tree mortality estimations.
We quantified tree mortality in each plot by using two metrics: volume-based mortality, measured as the cubic meters of wood lost per year and hectare forested area (m3⋅yr−1⋅ha−1), and stem mortality rate, expressed as the percentage of censusable stems lost per year (%-stems yr−1). Mortality (M) was calculated using the formula (Kohyama et al., 2018): M = [1 − [Nt0/Nt1][1/t]] × 100, where Nt1 represents the number of trees alive at the first visit, Nt0 is the number of individuals that survived between visits, and t is the time interval between visits (five years). To focus on natural mortality, harvested trees were classified as survivors, ensuring that the estimated rates reflected mortality independent of logging. However, it is important to note that large disturbances, such as storms or bark beetle outbreaks, are often followed by rapid salvage logging. Due to the five-year revisit interval, the NFI methodology does not capture these short-term responses, meaning the reported mortality rates likely underestimate actual natural mortality. To assess uncertainty, we applied a bootstrapping approach. For each year and group (e.g., region, height class, species), we resampled the dataset and calculated the mortality rate across multiple iterations. The final estimate represents the mean mortality rate across all bootstraps.
Figure 3 presents the spatial distribution of volume-based mortality rates due to both biotic and abiotic causes, mapped using a hexagonal grid. The data revealed a clear increase in tree mortality across France, particularly after 2018, with the most pronounced effects in the northeastern regions. When aggregated over larger eco-regions from GRECO (Grandes Régions ECOlogiques) (IGN, 2024) Figure 4a, all regions show a similar mortality rate from 2015 to 2017 of 0.25 to 0.5 m3⋅yr−1⋅ha−1. In 2018, mortality rates surged in the Jura (10-fold increase from 2015 to 2023), Vosges (6-fold), and Grand Est (4-fold), in likely response to the extremely hot drought (Schuldt et al., 2020). In mountainous regions such as the Alps, Massif Central, and Pyrénées, mortality rose less drastically but continuously over time, reaching rates of approximately 0.75 m3⋅yr−1⋅ha−1. Mortality rates along the Mediterranean and Atlantic coasts are generally smaller than in other regions (<0.5 m3⋅yr−1⋅ha−1) but still showed a 2- to 3-fold larger rate in 2023 compared to 2015.
Spatial distribution of volume-based tree mortality rates across France from 2015 to 2023. Mortality rates increased substantially after 2018, particularly in northeastern regions, reflecting climate-induced stressors and pathogen outbreaks.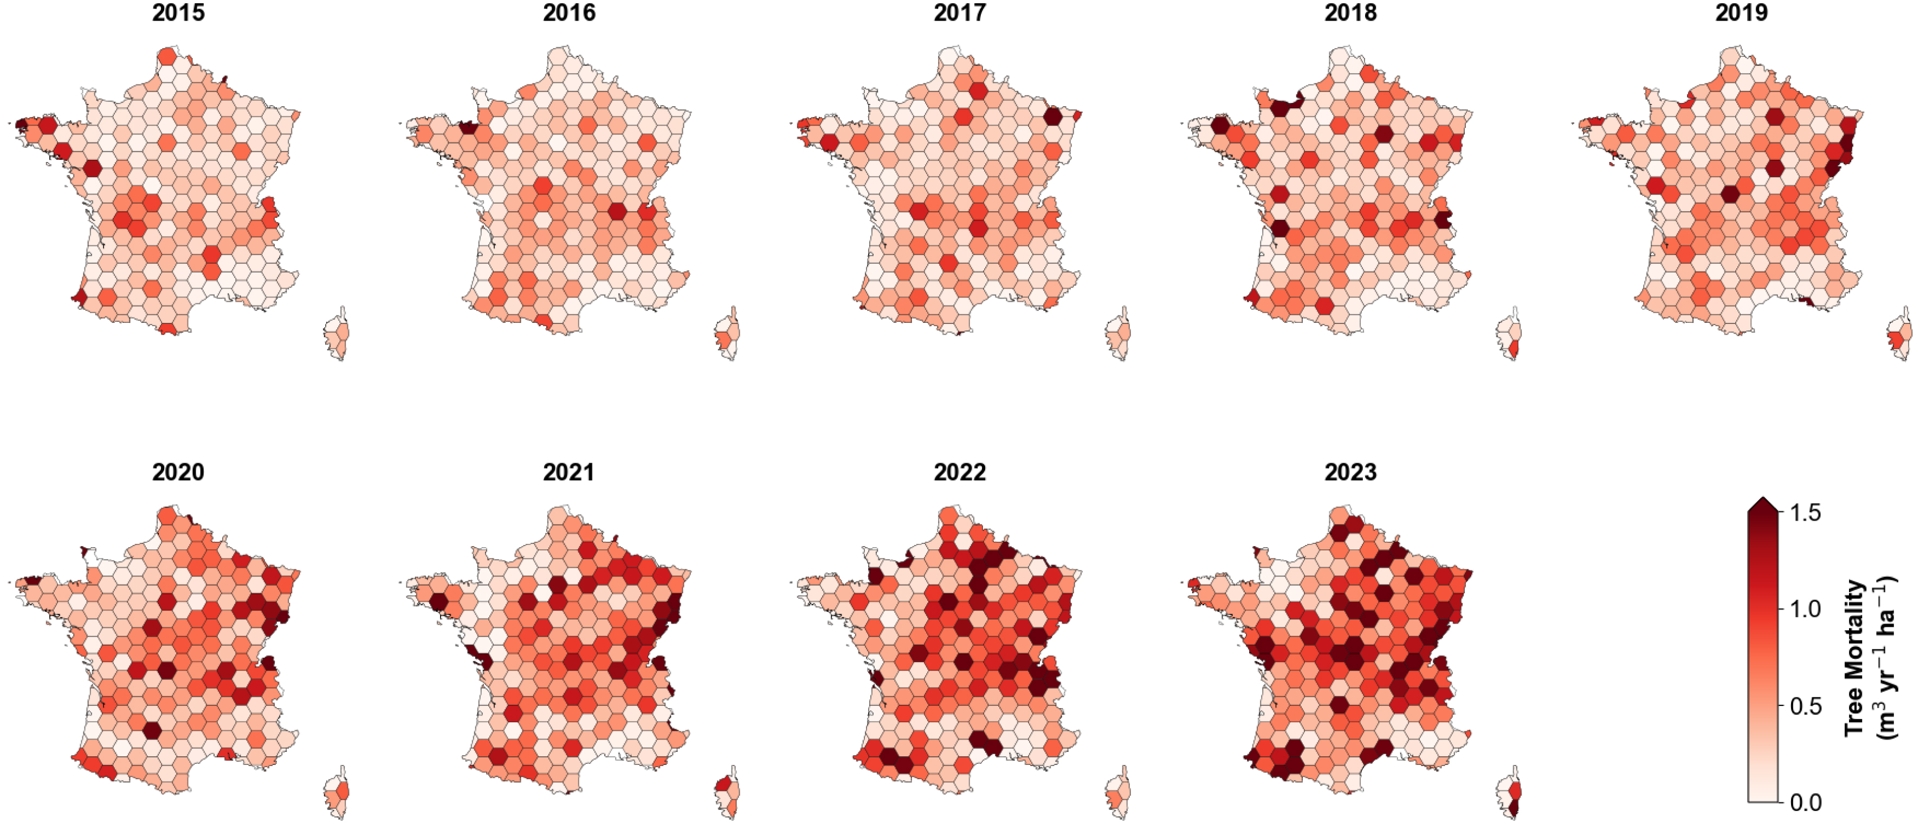
Trends in tree mortality across different categories. (a) Volume-based mortality rates trends by eco-region, showing a sharp rise in the Jura, Vosges, and Grand Est regions. (b) Volume-based mortality trends across species, with Norway spruce, European ash, and silver fir experiencing the highest volume losses. (c–d) Mortality trends by tree height class, illustrating the differential impacts on large versus small trees (taller trees contributing more to carbon losses despite lower%-based mortality rate).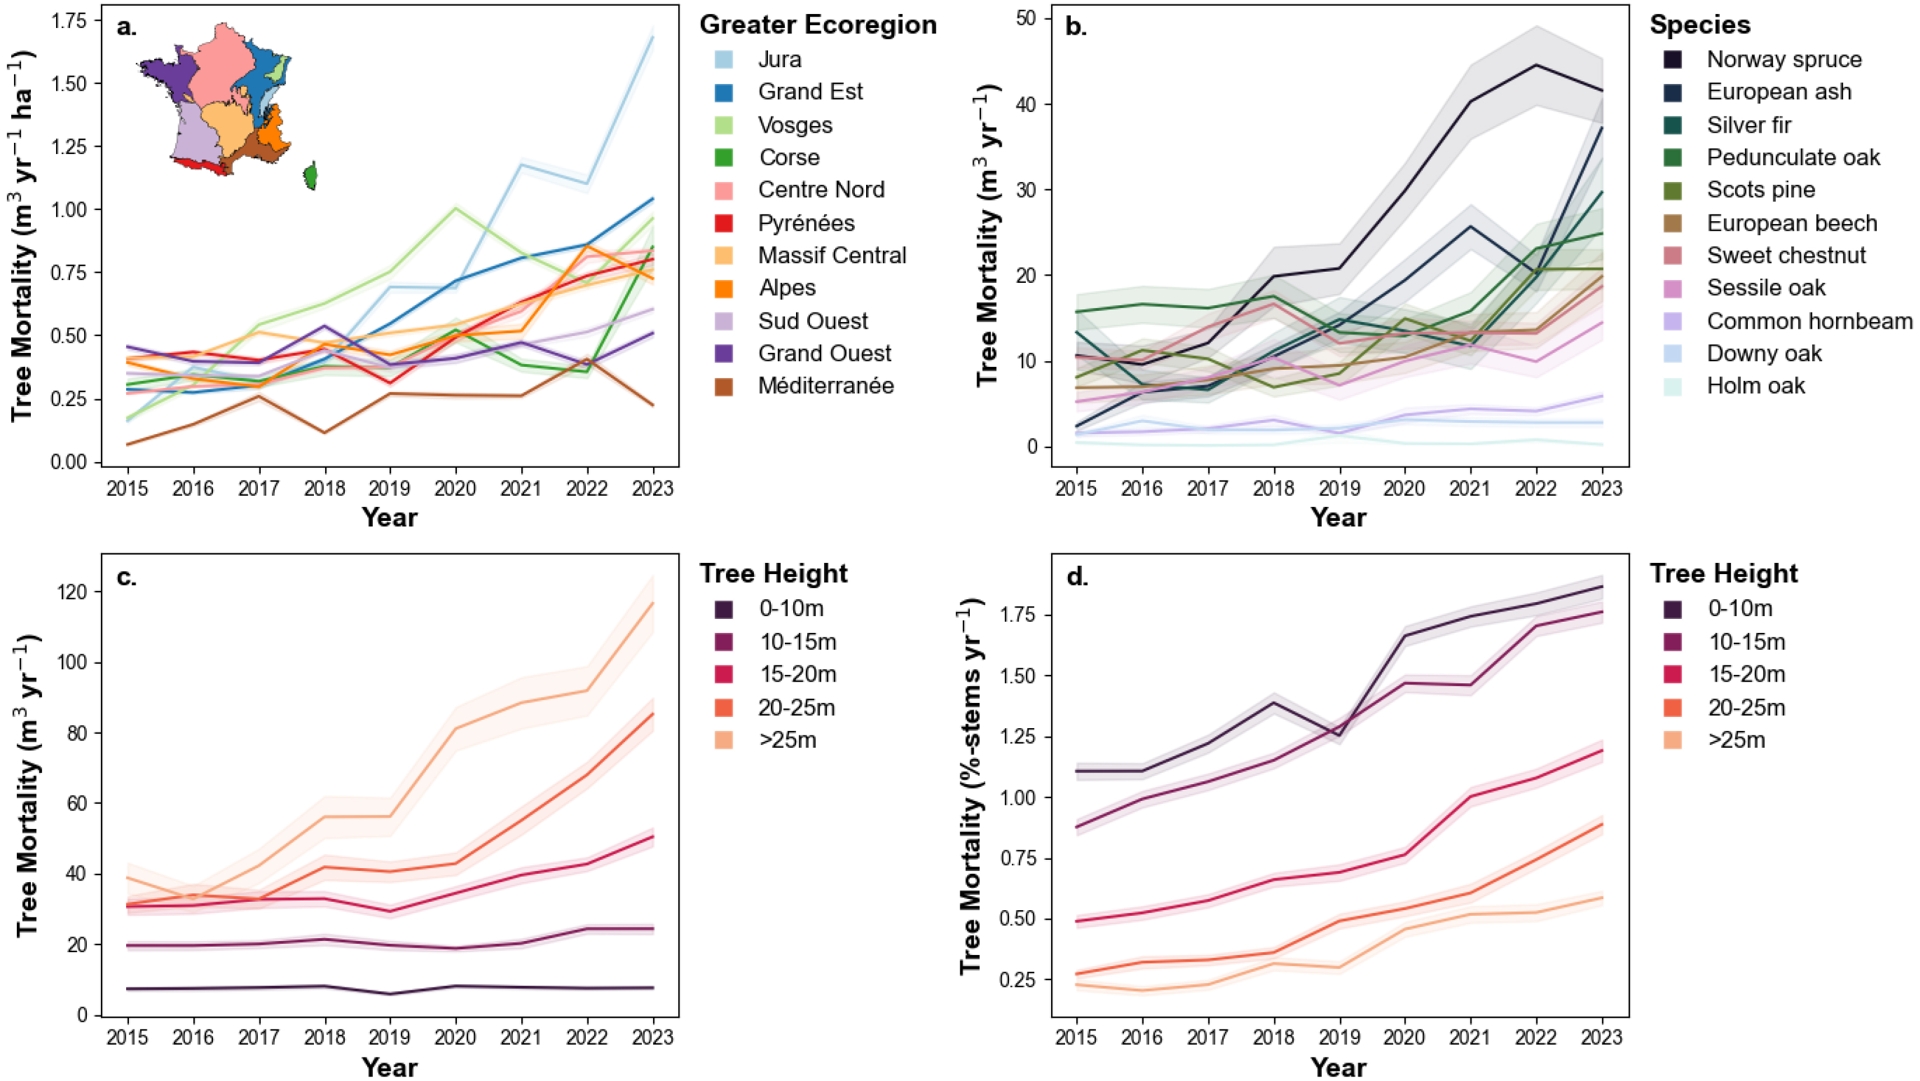
Figure 4b shows species-specific mortality trends, revealing that Norway spruce, European ash, and silver fir accounted for the highest volume-based mortality, with a sharp increase after 2018, reaching levels up to 40 m3⋅ha−1⋅yr−1. The rise in mortality among Norway spruce and silver fir is closely linked to both direct and indirect effects of climate change. A 2019 study on the Vosges forests attributed increasing mortality rates in both species to reduced water availability and severe drought events with bark beetles (Piedallu et al., 2022). Norway spruce, is highly susceptible to drought stress (Arend et al., 2021), which weakens trees and makes them more vulnerable to bark beetle infestations (Hlásny et al., 2021). These outbreaks have intensified in recent years, as climate change has created more favorable conditions for beetle populations—warmer winters improve their survival rates, while hotter summers accelerate their life cycle, allowing additional generations to develop (ibid.). The dramatic rise in European ash mortality (a 16-fold increase from 2015 to 2023) is primarily driven by the spread of the fungal pathogen Hymenoscyphus fraxineus, which can cause mortality in up to 85% of infected ash trees (Carroll and Boa, 2024). Unlike defoliating insects, which weaken but rarely kill trees, bark beetles bore through the bark of their hosts, disrupting the flow of sap and causing tree death. While beetles have long been endemic to Europe, they have not been a major source of tree mortality until recently, when summer droughts have weakened trees’ natural defenses and favored the reproductive cycle of the beetles (Lange et al., 2006). The resulting outbreaks have had widespread consequences, affecting not only France but also Belgium, Germany, Austria, and the Czech Republic (Hlásny et al., 2021).
Moreover, mortality rates have risen significantly across other major tree species in France, including European beech, oaks (pedunculate, sessile, and downy oak), common hornbeam, and sweet chestnut. Chestnut is known to suffer from pathogen attacks (Jung et al., 2018) and beech suffers from extreme droughts (Leuschner, 2020). From 2015 to 2023, mortality in these species has at least doubled, and in some cases, tripled. When looking at stem mortality rate-, ash, chestnut, and spruce had substantially larger rates than other species. This trend underscored the growing pressure that Europe’s forests face under climate change (Senf et al., 2020) emphasizing the urgent need for adaptive management strategies and targeted policy measures to safeguard the critical ecosystem functions these forests provide.
While volume-based mortality rates are particularly relevant for understanding carbon sink dynamics, they remain biased toward the mortality of large trees and provide little insight into the survival of younger tree generations, a stage at which evolutionary processes are at play through natural selection. Figures 4c and 4d illustrate trends in both volume-based mortality and stem mortality rates. While small trees (under 10 m in height) exhibited lower volume-based mortality rates compared to taller trees (over 25 m), they have significantly higher stem-based mortality rates. This reflects natural forest dynamics, where smaller trees die more due to competition for light rather than external disturbances (Westoby, 1984). The stem mortality rate indicates that mortality has increased across all height classes, highlighting the broad-scale impact of recent environmental stressors. Given the current species mix, this could limit the number of mature trees available as well as the carbon sink in the coming decades. However, shifts in species composition, with the establishment and spread of more resilient or better-adapted species, may influence long-term forest dynamics and carbon sequestration potential (Wessely et al., 2024).
Although large trees have lower mortality rates compared to smaller trees, volume-based mortality highlights their outsized contribution to carbon stock changes. This aligns with the impacts of storms discussed earlier, as larger trees are more vulnerable to windthrow (Seidl et al., 2017). Additionally, large trees are highly susceptible to drought stress due to their expansive canopies, which create a high evaporative demand and generate strong pressure gradients from soil to atmosphere (Fensham et al., 2019; Bennett et al., 2015). As structural integrity declines, tall trees become more prone to windthrow and secondary disturbances. Since tree height is also a factor of vulnerability to water stress (Koch et al., 2004) mortality rates should increase with tree height under the climatic drought pressure of the past years. In view of the relationship found in Figure 4d, density-dependent mortality in young forests is therefore interpreted to dominate this response. Further research is here needed to elucidate this response, which may stem from insufficient cover of larger height classes (beyond 30 to 40 m). Filtering out the potential increase in density-dependent mortality resulting from forest densification (Denardou-Tisserand, 2019) climate impacts is also an urgent issue (Taccoen et al., 2019).
5. New tools to monitor forests using remote sensing and ground observations: a prospect
5.1. Limits of traditional forest monitoring
Ground-based observations, such as the French National Forest Inventory surveys, provide high-quality data for monitoring short-(5-yr) to medium-(10–20 years) term forest dynamics on a national or regional scale (Figures 1, 2), for the reason that they have been designed to support the valuation and formulation of national forest policies. However, these data have several limitations to the higher spatio-temporal resolutions that form new challenges for future forest monitoring (Bontemps, Bouriaud, et al., 2022).
First, the temporal resolution for forest flux measurements is five years, as dictated by the semi-permanent plot protocol, a trade-off between detecting substantial changes and increasing the resolution with respect to previous practices (around 12 years in the former approach). Also, samples are renewed every year, allowing for quick detection of changes in, at least, state variables, but at the cost of statistical precision, leading to the standard practice of the moving-window average in annual inventory (Bontemps and Bouriaud, 2024). This low-frequency sampling of fluxes hinders the timely detection of sudden events affecting e.g. the mortality of French forests, such as the extensive wildfires of 2022, or tree mortality caused by storms and pest outbreaks, part of it being transferred to harvest fluxes when occurring earlier than 5 years. A perspective here may be to panelize the revisits across the 5 successive years, which can be operated at a constant sampling effort, yet complexifying the design. The practice is routine in some public surveys, as soon as residence times need be estimated.
Second, NFIs have been designed to be statistically representative of large territories, and do not monitor forests at a fine resolution. While the associated uncertainty is duly quantified in the variance of estimation, bias also turns out to be possible if forest events are disseminated across space to the point where they can be qualified as “rare” events, locally. Additionally, higher-resolution is of increasingly crucial interest in France, where forest parcels are often small and managed by diverse owners with distinct practices. This aspect is at the origin of two innovation strategies: (i) model-based mapping and monitoring facilities, based on remote-sensing products, and often calibrated with forest inventory data, (ii) enhanced design-based forest inventory development (also termed “multi-source” inventory; Tomppo et al., 2008) that preserves the statistical inference capacity associated with the sampling design, and whereby remote sensing products play an auxiliary role for increasing estimation precision, providing estimation on much smaller domains, and developing mapping facilities (Vega et al., 2021).
5.2. Advances in remote sensing
5.2.1. New sensors
In recent years, remote sensing (RS) technology has undergone significant advances, particularly with the development of new orbital sensors that provide data of relevance for forest monitoring. Among them, the Sentinel-2 (S2) mission, part of the European Space Agency’s (ESA) Copernicus Earth Observation Program, captures multispectral imagery at a 10-meter spatial resolution with a revisit interval of approximately 6 days in France, making it a valuable tool for detecting changes in vegetation and canopy structure. Similarly, Sentinel-1 (S1), another component of the Copernicus program, provides synthetic aperture radar (SAR) imagery at 10-meter resolution, operating independently of weather conditions and daylight, thus enhancing forest monitoring capabilities.
Beyond optical and radar remote sensing, LiDAR technology is considered as one of the most efficient data sources for forest structure analysis. LiDAR sensors measure the three-dimensional structure of forests by emitting infrared laser pulses and recording their reflection from different canopy layers. These measurements provide critical insights into forest height, biomass, and structural complexity (Balestra et al., 2024). Since 2018, NASA’s Global Ecosystem Dynamics Investigation (GEDI) mission (Dubayah et al., 2020) has delivered sparse but highly accurate data on forest vertical structures across the globe, enabling unprecedented assessments of forest height and canopy density. Specifically, canopy height, one of the most straightforward metrics derived from LiDAR measurements, has shown strong correlations with key ecological indicators such as biomass, biodiversity, and forest health (Dubayah et al., 2020; Torresani et al., 2023). Furthermore, airborne LiDAR missions, such as those conducted by national forest agencies, complement spaceborne LiDAR data by providing denser coverage (Coops et al., 2021) at finer scales like the French HD LiDAR program initiated by the IGN (Melun and Passy, 2024). Enforcing a regular HD LiDAR cover over the territory however remains largely uncertain to date.
Over the past decade, advances in artificial intelligence (AI) and machine learning, particularly deep learning models (LeCun et al., 2015), have transformed satellite remote sensing research. These frameworks can efficiently process large-scale datasets and are particularly effective with unstructured data such as images or sound. This makes them perfectly adapted for the fusion of multiple remote sensing datasets, such as GEDI LiDAR data with Sentinel-1 and Sentinel-2 imagery, to generate continuous, high-resolution maps of forest structure and biomass. The past 5 years have seen an increasing number of studies using these tools to derive such maps globally (Lang et al., 2023; Pauls et al., 2024; Tolan et al., 2024), on the continental scale (Liu et al., 2023), or national (Fayad et al., 2024; Liu et al., 2023; Schwartz, Ciais, De Truchis, et al., 2023) and the regional scale (Favrichon et al., 2025; Schwartz, Ciais, Ottlé, et al., 2024).
5.2.2. Height and biomass mapping
In France, Schwartz, Ciais, De Truchis, et al. (2023) used GEDI, Sentinel-1, and Sentinel-2 data with a U-Net model (Ronneberger et al., 2015), a deep learning approach, to generate a 10 m resolution forest height map for 2020, covering the entire metropolitan territory (Figure 5a). This map demonstrated high accuracy, with a mean absolute error of 2.94 m. It enables a detailed understanding of French forest structure at the stand level, as visible in Figure 5b. Furthermore, leveraging allometric equations from inventory data, the authors produced wood volume and biomass maps at 30 m resolution, offering a valuable snapshot of the carbon stored in French forests in 2020.
(a) Tree height map of France at 10 m resolution for the year 2020. (b) Examples at three different locations of height prediction (left) with the corresponding Google map images from 2020, 2018, and 2019 (right). Brighter colors indicate higher heights. Figure from Schwartz, Ciais, De Truchis, et al. (2023).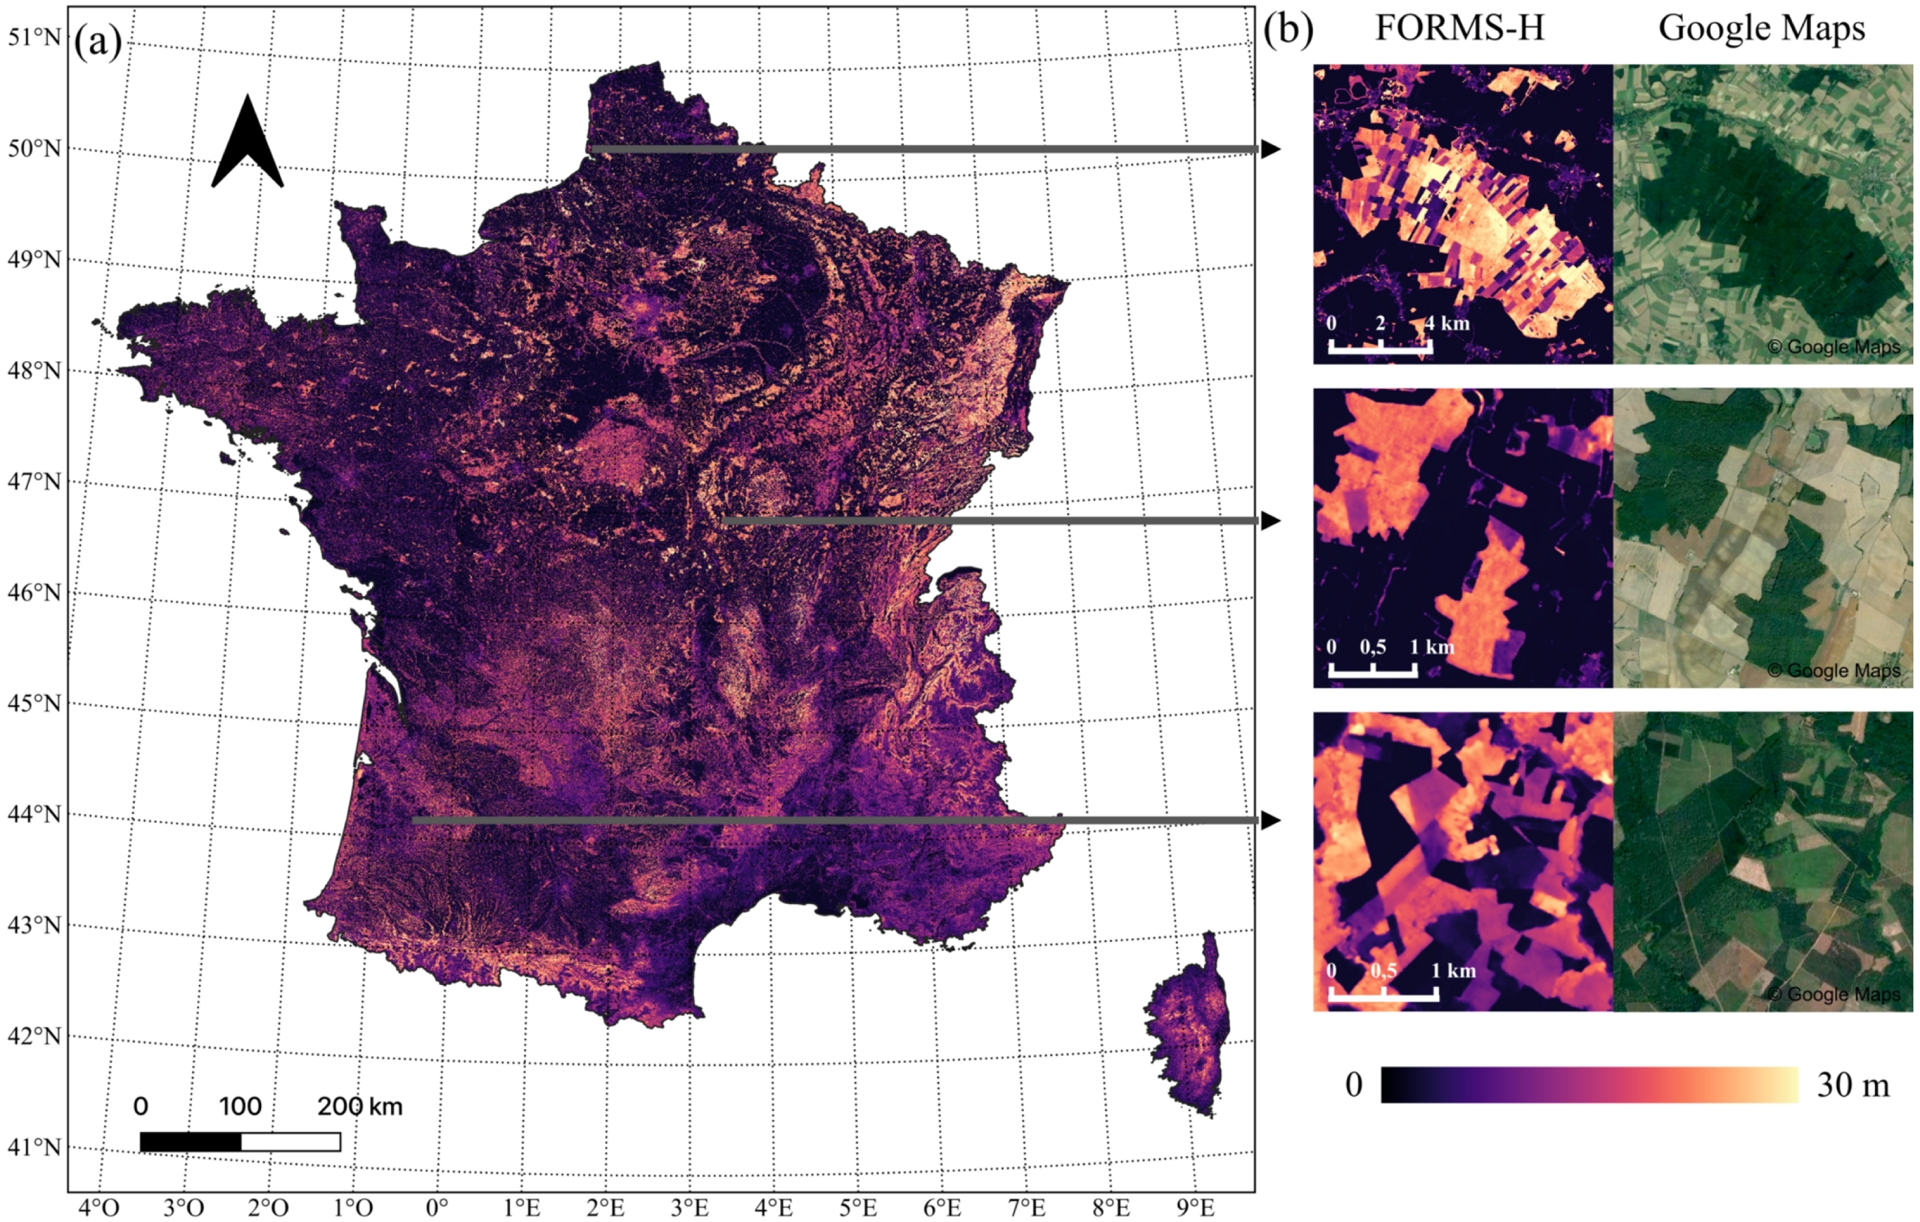
Satellite and AI-based methods for generating forest height and biomass maps have shown relatively high accuracy, particularly in temperate regions like France. However, significant uncertainties remain, especially in biomass estimation, causing a gap between the initial resolution of RS signals, and their processing into forest state variables. Biomass maps rely on allometric equations fitted by broad forest categories or biomes like in Schwartz, Ciais, De Truchis, et al. (2023) where two equations were used depending on the leaf type of the trees (broadleaf/needleleaf). However, within these broad categories, biomass is influenced by various factors beyond height, including climate conditions, tree species, forest management practices, and tree cover. In addition, volume could be more accurately reconstructed than biomass from remote sensing, given the large variations in wood density across species and forest types. These complexities make satellite-based biomass maps less reliable than the height maps they derive from. Future models should incorporate these additional variables into biomass predictions or try to map biomass from direct measurements rather than using height as a proxy. In between, such maps could be used in model-assisted small area estimation approaches to provide design-unbiased estimates of forest attributes (Zhang et al., 2022).
5.2.3. Mapping components of the carbon budget
Accurately mapping forest biomass is one of many tasks that can be addressed using Earth Observation (EO) data combined with deep learning algorithms. The rise of very high-resolution satellite imagery—such as Maxar satellites that go up to 15 cm resolution, SPOT satellites (1.5 m resolution), and the Planet Labs constellation, which provides 3.5 m resolution images of the entire globe daily—offers new opportunities to analyze forest structure changes at the tree level. Some of these private data are made available for research purposes, such as the annual SPOT mosaics in France that have been used to produce the open-canopy maps from (Fogel et al., 2025). These annual 1.5 m resolution maps have proven high accuracy in detecting individual tree removal in France’s forests. They could significantly enhance our understanding of forest disturbances and improve the existing attribution of forest losses (Fogel et al., 2025; Viana-Soto and Senf, 2025). By analyzing disturbance patterns, they could help differentiate between natural forest losses—such as windthrows, wildfires, and pest outbreaks—and human-driven factors like selective logging, clear-cuts, and salvage logging, and further estimate impacted resources (Sagar et al., 2025).
Forest carbon budget monitoring, meaning an accurate tracking of biomass losses and gains, is crucial to follow climate-related policies and reduce greenhouse gases emissions. With their frequent updates, satellite-based solutions enable this monitoring, and several projects are already operational, including forest cover loss detection (Hansen et al., 2013), tropical forest degradation and deforestation tracking (RADD alerts from Hansen et al., 2013; Reiche et al., 2021); TMF dataset from (Vancutsem et al., 2021), and clearcut monitoring in France through the SUFOSAT project (Mermoz et al., 2024). Following the pioneer work of Véga and St-Onge (2008) and Véga and St-Onge (2009) the increasing precision of new data and models will allow detecting growth signals (Véga and St-Onge, 2008; Véga and St-Onge, 2009) as well as forest losses to estimate forest carbon uptake (Renaud et al., 2017) at national to continental scales. However, few models have successfully generated consistent height time series validated with external data over large areas. In France, building on the study presented in Figure 5, the same authors attempted to address this challenge by developing a framework for predicting height annually in a consistent manner. Figure 6 provides an initial look at these time-series, where forest growth is visible year to year. In maritime pine plantations (Figure 6a) of the Landes forest, forest parcels clearly show growth between 2018 and 2024, while clearcuts, represented in red, are also distinct. In contrast, for mature forests with more complex growth dynamics, changes are less visible, and biomass accumulation in tree woody mass may be overlooked, particularly for deciduous oaks (Figure 6d).
Forest height in 2018, 2021, and 2024; Google Maps © images; and the difference between 2024 and 2018. The last column shows the height profiles drawn on the maps. The four lines correspond to different tree species: (a) Maritime pines (44.54 N, −1.03 E), (b) Poplar plantation (49.72 N, 3.86 E), (c) Larches (44,98 N, 6.47 E), (d) Deciduous oaks (48.30 N, −3.61 E). Adapted from Schwartz (2023).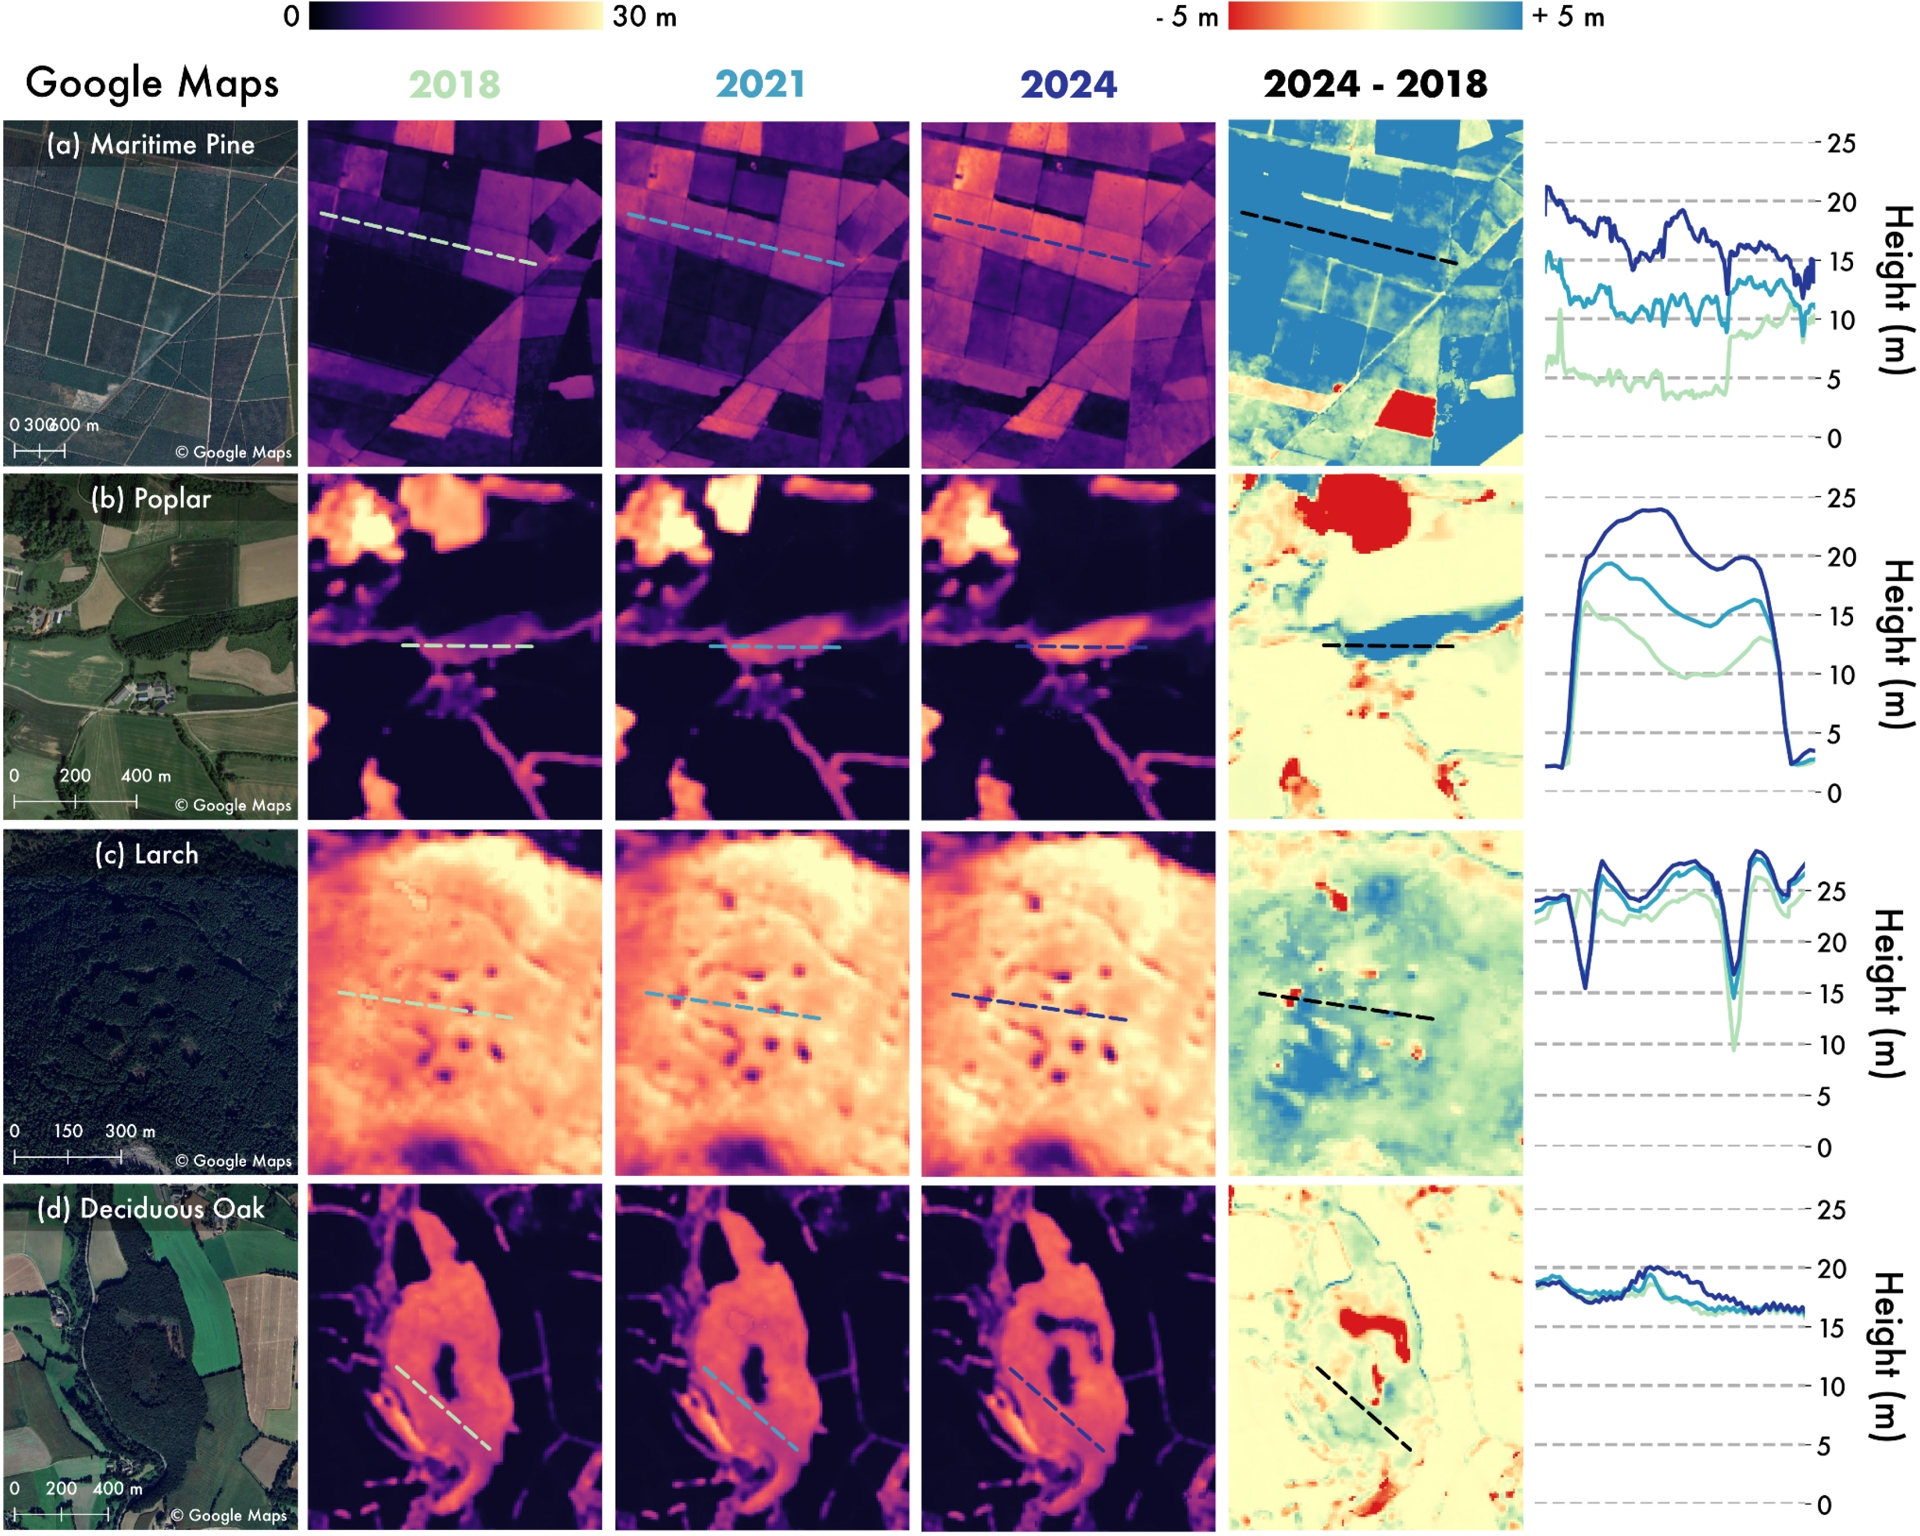
Another key but more exploratory application is the elaboration of tree species maps (Beloiu et al., 2023), which could refine height-biomass allometries and improve our understanding of forest diversity within a region. By analyzing temporal information from satellite time series, recent studies have successfully identified tree phenology and linked it with specific species, as demonstrated in Belgium by (Bolyn et al., 2022). With large labeled datasets like the Pure Forest dataset (Gaydon and Roche, 2024), future research can fully exploit remote sensing data using advanced deep learning models such as Vision Transformers (Dosovitskiy et al., 2021). These high-precision tree species maps would significantly enhance forest management, monitoring, and carbon stock estimation.
5.3. A persisting need for field measurements
While advances in remote sensing and machine learning are transforming forest monitoring, ground-truthing remains essential for accurate calibration and assessment. For example, growth measurements, crucial for estimating carbon stocks, are only possible in open canopies, requiring in situ circumference tracking as forests mature (Wernick et al., 2021). Another promising approach to upscaling mortality prediction is linking ICP (International Co-operative Programme on Assessment and Monitoring of Air Pollution Effects on Forests) crown defoliation data. A recent study using defoliation data from Scots pines in Switzerland shows that ground-assessed defoliation rates serve as early-warning signals for mortality (Hunziker et al., 2022). These insights could be expanded using remote sensing and machine learning, integrating defoliation monitoring with high-resolution satellite data like Sentinel-2 and GEDI LiDAR (Sagar et al., 2025). Similarly, Sentinel-2 can be used for early detection of bark beetle outbreaks but still needs systematic ground-truthing (Bárta et al., 2021). Additionally, citizen science can play a critical role, as initiatives such as Santé des Forêts already mobilize volunteers to report pest outbreaks, creating a valuable database for linking mortality to biotic disturbances and climatic stress. Public records, analyzed with large-scale language models, could further help reconstruct past disturbance events.
While accurate geolocation of mortality events is essential for attribution (e.g., the French NFI openly provides coordinates within a 700 m radius of the true location, a prevalent practice across world NFIs Schadauer et al., 2024), with persisting debates about making such data openly available (Gessler et al., 2024). For those NFI placed under the authority of public statistics like in France, sensitive data access for public research is now permitted and managed according to the law on statistical secrecy. Another—perhaps more crucial—issue is that the vast majority of NFI protocols are based on nested plot designs for the sake of cost reduction (not all the trees being measured), not primarily intended for remote-sensing calibration, in contrast with experimental forest plots (e.g. Seynave et al., 2018). This limitation is traded off with the statistical robustness of the systematic sampling design used in the French National Forest Inventory, which ensures unbiased estimates at large scales, making it a cornerstone of forest observation.
5.4. Advances in enhanced multisource forest inventory
While field observation can be used for the calibration and validation of RS products, it can also benefit from these to satisfy both increased precision on small domains, and mapping requirements (Kangas et al., 2018). Indeed, the classical NFI can be supplemented by AI-powered and all remote sensing-based products aforementioned, through the concept of multi-Source forest inventory, an innovation rewarded by the Marcus Wallenberg Prize in 1997 (Tomppo et al., 2008) and a matter of ongoing developments in France (Vega et al., 2021; Sagar et al., 2022). A strong advantage here is that RS products play an auxiliary role in a design-based statistical approach, and do not need to be unbiased, only informative (i.e. correlated to the attribute of interest).
Therefore, a virtuous loop can be figured out between NFI and RS product developments, the former being used for calibrating the latter in a high frequency and high-resolution perspective, while the latter will usefully feed increased precision and frequency of the former (Bontemps, Bouriaud, et al., 2022). Beyond the model-assisted paradigm, the capability of AI to improve the correlation between remote sensing and NFI will suppress the risk of bias associated with model specifications (Sagar et al., 2022) and enhance the capabilities of design-based and model-assisted small-area estimation for estimating large disturbances. For large scale (i.e., small area) disturbances, model-based small area estimates remain an option (Sagar et al., 2025) if no additional field plot can be inventoried. In this specific field, research is also ongoing to envision new and more adapted sampling strategies, using RS products as a source of prior spatialized information on disturbances, sampling strategies being directed by the former. A subsequent issue is how to best articulate such approaches with standard forest inventory, and trade the global sampling effort (Gruijter et al., 2006), in the context of their expected increased occurrence (Seidl et al., 2017). The approach may also serve the updating of inventory estimates after disturbances.
Given the demonstrated complementarity of these AI-powered and remote sensing-based models (Besic et al., 2025; Sagar et al., 2022), we can thus confidently state that holistic monitoring approaches—combining satellite observations, AI, and structured field data—will be essential for improving mortality predictions and understanding forest carbon dynamics and, for improving forest monitoring in general (Bontemps, Bouriaud, et al., 2022).
5.5. Paths for NFI-driven assessment of the long-term C forest sink
The present aim of tracking changes in the forest carbon sink and its components over a long-term period (1990–2022) has not been frequently addressed to date, and it highlighted clear limitations associated with the different tools contributing to this monitoring, for it to be accurate and homogeneous over time. These limitations call for some minimum caution in the interpretations of the results, and also come along with additional recommendations to the community:
(i) Forest harvest reconstitutions over the long term—before 2010, no accurate field monitoring of forest removals was implemented, making the NFI data non-operative in this respect, and requiring external and indirect quantification approaches (including the Enquête Annuelle de Branche, for wood sawn in the industries) routinely using for forest carbon reporting. With forest growing stock being however estimated with high precision (around 1.5% at country scale, and at a much higher precision in former decennial inventories), it is suggested that forest harvests be retrospectively reconstituted by equating the annual difference of carbon stocks (net carbon sink) to the sum of forest fluxes. The approach has been successfully tested over ancient departmental inventories (Denardou-Tisserand, 2019), and can be generalized to all available inventories.
(ii) Delivering long time series of forest attributes—Old inventories were based on asynchronous departmental surveys, which form a systematic limit for a rapid production of forest time series at different scales at which statistical precision is sufficient (GRECO/SER ecological classifications, or NUTS-3/NUTS-2 levels of EU administrative units). Using interpolation and aggregations, time series of forest state variables (area, total stock and biomass) and fluxes (growth, harvest, mortality) should also be produced for these different classifications. The linearity of these reconstitutions makes the delivery of associated confidence intervals prone to rapid development.
(iii) Updating the wood density component of the aerial forest carbon sink—Highly diversified forests of the French territory pose a sharp limit on the accuracy of wood density quantification across tree species (>150 found at the censusable stage in France). While the Carbofor project remains a cornerstone support, some density records however remaining doubtful. Yet, an unprecedented effort relying on a collaboration between IGN and INRAE has been consented since 2015, with a view to establish a systematic wood density record for French forests, based on the sampling design of the national forest inventory. These open data (Cuny et al., 2025) should be used whenever aerial tree carbon stocks/sinks are requested, and may lead to a positive reevaluation of forest carbon. Wood density models are now under development that will capture the intraspecific diversity associated to tree and stand attributes.
(iv) Tracking for total natural tree mortality in forests—Whereas mortality was the matter of restricted concern for up to one decade, its abrupt increase after severe drought or pest-related disturbances has drawn attention onto this flux (e.g. Taccoen et al., 2019). In spite of major improvements introduced in the French NFI with the semi-permanent design, 5 years can remain limiting for mortality assessment after massive events, with the risk of both underestimating natural mortality, and overestimating planned harvests. Complementary perspectives rely on both progress in forest inventory design (e.g. spatially systematic panelling of plot revisits across 5 years has no cost difference), and the development of density-dependent mortality models for better separating demographic and environmental mortality, and developments in remote sensing technologies, from which one may expect bias-correction options in view of the higher frequency of these products. For these reasons, it is urged to amplify the scientific dialog between remote sensing and forest inventory science on this topic.
6. Concluding remarks and recommendations
We have shown that French forests experienced an alarming decline of their carbon sink which went from 49.3 MtCO2⋅yr−1 in 1990 to 37.8 MtonCO2⋅yr−1 in 2022. This decrease took place mainly from 2013 to 2017 and seems to be associated with an abrupt rise of both natural mortality from climate change and to a parallel rise of harvests. This harvest increase could reflect salvaged trees after natural dieback. In recent years, two northern regions have become net carbon emitters to the atmosphere and other regions have carbon fluxes that have decreased and are now close to zero. In contrast, southern regions remained stable carbon sinks both in intensively managed Atlantic forests in Les Landes and lightly managed Mediterranean forests. These findings make the country’s carbon neutrality target out of reach for the current period as it was based in the initial SNBC (2020) from data from 2018 which defined as a target a sink of 41 MtCO2⋅yr−1 in the forest sector in 2015, then revised to 39 MtCO2⋅yr−1 in the second SNBC-2 budget for 2019–2023. Even this less ambitious objective became unachievable in light of the continued decrease of the carbon sink, and has been revised in SNBC-3 down to 9 MtCO2⋅yr−1 (Figure 1c). The new objective may still be challenging to reach in light of continuing greenhouse gas emissions in the agriculture sub-sector and rising tree mortality decreasing the forest sink in the coming years.
Our findings show that tree mortality has become a key driver of the declining carbon sink in France (see also Haut Conseil pour le Climat, 2025), with significant regional differences and species-specific trends. The acceleration of mortality since 2013, independent of harvest trends, suggesting that climate-induced stressors—especially droughts and biotic disturbances—are reshaping forest dynamics. Given the delayed detection of mortality in panelized annual national forest inventories, complementing field-based observations with high-resolution remote sensing and citizen science initiatives could provide earlier warning signals and improve attribution of mortality drivers. In this context, we strongly recommend that deadwood carbon stock changes caused by increased mortality should be included in carbon accounting and subsequent reports.
The national inventory is a unique resource to monitor long-term carbon trends in forests and forms one of the bases for the France national reporting to the UNFCCC. However, both the current sampling scheme and the global sampling effort do not allow for year-to-year monitoring of changes, and cannot attribute the epicenters and severity of carbon losses occurring through disturbances as soon as these are small-scale. Satellite imagery provides excellent coverage down to tree level but requires ground data to provide robust maps of carbon accounting. We recommend here to develop artificial intelligence and data integration methods to monitor gains of forest carbon from satellite and airborne imagery.
In this respect, the recent inclusion of the national forest inventory in the framework of public statistics (under the authority of the CNIS council) has led to specify and enforce data diffusion rules and methods to both satisfy the needs of public research and the statistical secrecy law, permitting in particular the exact spatial matching of high-resolution satellite products and field data. Additional recommendations can be formulated, including the provision of geospatial information on forest clearcuts, and natural disturbances such as insects, drought mortality events based on the best available science, the measure of deadwood changes as an overlooked carbon stock in French forests, the development of artificial intelligence and data integration methods to monitor gains or losses of forest carbon from satellite and airborne imagery.
Acknowledgements
PC acknowledges support from the EYE CLIMA HE project Grant Agreement No. 101081395, the French German AI4FOREST project (ANR-22-FAI1-0002-01). PC, NB and CV from the CNES TOSCA FOREST-C50m project.
Declaration of interests
The authors do not work for, advise, own shares in, or receive funds from any organization that could benefit from this article, and have declared no affiliations other than their research organizations.