


 CC-BY 4.0
1. Introduction
The Quaternary period (the last 2.6 million years, Ma) is marked by an alternance between cold intervals, characterized by low sea levels and extensive ice sheets, known as glacial periods, and warmer intervals, characterized by high sea levels and reduced Northern Hemisphere ice sheets, known as interglacial periods. These cycles evolved from 40 to 100 ka (kiloyears), between the Early and Late Pleistocene. Past interglacial periods follow the glacial Terminations, which involve rapid and nonlinear responses of ice volume reduction, atmospheric CO2 concentrations increase, and temperature change to external astronomical forcing. During these large climatic transitions, external forcing is primarily determined by seasonal and latitudinal variations in insolation, which are driven by changes in orbital parameters such as precession, obliquity, and eccentricity (Hays et al., 1976). The increase in summer insolation at high latitudes in the Northern Hemisphere has been identified as a primary driver of the melting of large ice sheets covering some continental regions at latitudes higher than 50°N during glacial periods (J. Imbrie, Boyle, et al., 1992). In addition to orbital forcing, glacial Terminations involve numerous feedback mechanisms within the Earth system. The processes at play include changes in albedo, atmospheric greenhouse gas concentrations, ocean circulation and stratification, atmospheric dust contents, and biological productivity (Berends et al., 2021). Understanding how different processes contribute to climate change and interact with each other requires precise timing of the variations recorded in various Earth compartments (ocean, biosphere, atmosphere, cryosphere).
Climate and environmental changes have been documented through various archives, each providing complementary information. Ice cores provide unique records up to 800 ka BP (Before Present) of greenhouse gases concentration from air bubbles trapped in ice, as well as local temperature from analyses of water isotopes (e.g., Barnola et al., 1987; Jouzel et al., 2007). Marine sediment cores provide proxy records related to ocean temperature, ocean circulation, and ice volume, with a temporal coverage of several Ma (e.g., Emiliani, 1955; Broecker and van Donk, 1970; Waelbroeck et al., 2008; Lisiecki and Raymo, 2005; Elderfield et al., 2012). For example, δ18Obenthic variations reflect global sea level changes and seawater temperature (Shackleton, 1967). Continental climate and environmental reconstructions rely on diverse terrestrial archives or records, such as speleothems, lake sediments, loess sequences, pollen, dated groundwater, as well as moraine deposits (e.g., Williams et al., 1997; Wang, Cheng, Edwards, An, et al., 2001; Moine et al., 2017; Sánchez Goñi et al., 2023; Seltzer et al., 2021; Martin et al., 2020). For instance, the δ18Ocalcite from Chinese speleothems reflect both changes in the strength of the Asian monsoon as well as changes in the precipitation source regions. Lower δ18Ocalcite implies higher spatially integrated monsoon rainfall between the tropical monsoon sources and the cave site and/or higher summer monsoon rainfall in the cave region (e.g., Chiang et al., 2015; Orland et al., 2015).
Each site of the different archive has its own chronology, defined as an age-depth relationship based on absolute dating constraints and/or modelling (e.g. ice sheet modelling to estimate the thinning function in ice core; see Parrenin, Rémy, et al. (2004)). Over the past few years, analytical advances have significantly improved the chronology of these archives. For deep polar ice cores, absolute age constraints can be derived from isotopic measurements of argon, based on the atmospheric increase of 40Ar derived from the radioactive decay of 40K in the Earth’s crust (Bender et al., 2008). Other chronological constraints in ice cores can be obtained from 81Kr or 36Cl/10Be radiometric dating (Buizert et al., 2015; Kappelt et al., 2025) or from combined orbital tuning tools such as air content, δ18O of O2, and δO2/N2 in trapped air (Oyabu, Kawamura, Buizert, et al., 2022; Bouchet et al., 2023). For sediment cores, in addition to the continuous improvements in 14C radiometric dating for age younger than 55 ka BP (e.g., Reimer et al., 2020), it is now possible to obtain precise radiometric ages, with dating uncertainties approching 0.1%, using the 40Ar/39Ar dating method on tephras or associated volcanic material (e.g., Giaccio et al., 2017; Schaen et al., 2020). Finally, the increasing precision of Uranium–Thorium (U–Th) dating for speleothems makes them reference archives for chronology over the last 640 ka (Hellstrom, 2006; Cheng, Edwards, Sinha, et al., 2016). Currently, U–Th dating leads to dating uncertainties better than 0.5% (e.g., Cheng, Edwards, Shen, et al., 2013; Cheng, Edwards, Southon, et al., 2018).
Still, in the absence of robust and continuous constraints for all archives, and in order to compare the timing of changes in external forcing with that of climate responses, it is necessary to establish a common chronology across archives based on climate alignment strategies (Govin et al., 2015; Past Interglacials Working Group of PAGES, 2016). Absolute dates obtained from speleothems often provide a reference timescale on which the chronologies of ice cores and marine sediments cores can be aligned. Bajo et al. (2020) estimated the ages of Terminations XII and X by establishing stratigraphic links between North Atlantic sediment cores and an Uranium–Lead (U–Pb) dated Italian speleothem records. Hobart et al. (2023) developed a chronology for marine sediments over the last 640 ka by matching marine cores with East Asian U–Th dated speleothem records. Extier et al. (2018) proposed to match the δ18O of O2 trapped in polar ice cores with the δ18Ocalcite in East Asian speleothems, as both proxies are related to the intensity of the water cycle in low latitudes. Because O2 has a residence time of 1 to 2 ka in the atmosphere, the change in δ18O of O2 is much smoother than the change in δ18Ocalcite which results in an uncertainty when using such matching as detailed in Extier et al. (ibid.). This effort in the construction of multi-archive chronologies can now be supported by the development of specialized optimization tools (e.g., Parrenin, Bouchet, et al., 2024), which have been used to provide first multi-archive chronologies over the last 60 ka (Bazin, Lemieux-Dudon, et al., 2019; Parrenin, Bouchet, et al., 2024).
In this study, we build upon previous advancements and propose a methodology to establish a coherent chronology among marine sediment cores, speleothems, and ice cores over the last 640 ka. We chose to adhere to published methods of synchronization between archives. We first present the approach used to develop the multi-archive chronology and the archives to be included. Next, we evaluate the sensitivity of the resulting chronologies to different synchronization strategies. Finally, we discuss how various underlying assumptions influence the inferred phase relationchip between atmospheric CO2 concentrations and variations related to sea level and deep ocean temperature, inferred from δ18Obenthic, at the onset of glacial Terminations over the last 640 ka.
2. Methods
2.1. Paleochrono-1.1 tool for multi-archive chronology construction
The new Bayesian dating tool employed here is the Paleochrono-1.1 Python software (Parrenin, Bouchet, et al., 2024), which has already been used for reference ice core chronologies (Oyabu, Kawamura, Buizert, et al., 2022; Oyabu, Kawamura, Fujita, et al., 2023; Bouchet et al., 2023; Mulvaney et al., 2023) and for developing a multi-archive chronology between ice cores and speleothems (Parrenin, Bouchet, et al., 2024). The general idea of this inverse model is to combine different sources of chronological information: prior knowledge of the archiving process, accumulation or sedimentation rate, together with various chronological observations, e.g. radiometric ages or visual layers. Background parameters are employed to calculate a prior age model for each site integrated in the dating experiment. For each site, the model incorporates its (1) dated horizons, i.e. depth levels dated using independent method, (2) stratigraphic links with other sites, i.e. depths that are know, or assumed, to have the same age, and (3) intervals of know duration. Once these dating constraints are provided, the model statistically adjusts the prior age scale within the confidence range given as input, optimizing the compromise between all chronological constraints across sites. The resulting age scale is referred as the posterior age model and is given by Paleochrono-1.1 along with the posterior 1𝜎 uncertainty.
The model is designed to accommodate two distinct types of archives which are referred as:
- the simple archives, which have one unique depth-age relationship, constant density, and no post-depositional thinning of the annual horizontal layers. Speleothems and marine cores should be considered as simple archives in Paleochrono-1.1, although marine cores may be affected by thinning (Athy, 1930). In the absence of information, a constant deposition rate can be used as prior, with variations allowed within an uncertainty range (Parrenin, Bouchet, et al., 2024). Paleochrono-1.1 can then reconstruct a variable deposition rate from chronological information (dated horizons and stratigraphic links). However, in periods without age constraints, the posterior chronology is determined exclusively by the prior deposition rate, a critical limitation given that speleothems and marine cores often display highly irregular deposition patterns.
- the ice-core archives, which are associated with one age scale for the ice and another one for the air enclosed, variable density, and are affected by post-depositional thinning of the annual horizontal layers. In background scenarios, sedimentation rates vary with depth according to temperature reconstruction calculated from water isotopes profiles following the theoretical approach based on the Clausius–Clapeyron relationship (Lorius et al., 1985; Ritz, 1992). The background thinning function decreases with depth and is calculated from an ice flow model (e.g., Bouchet et al., 2023; Parrenin, Bouchet, et al., 2024). The background lock-in depth is classically estimated using gas measurements in ice cores or a firn densification model (e.g., Bazin, Landais, et al., 2013; Bréant et al., 2017; Bouchet et al., 2023).
A detailed description of the model and its application is provided in Parrenin, Bouchet, et al. (2024).
2.2. Reference chronological experiments
Our study builds on the new reference chronology for deep ice cores AICC2023 (Bouchet et al., 2023), developed using Paleochrono-1.1 which integrates five ice cores: EPICA Dome C, EPICA Dronning Maud Land, Vostok, Talos Dome, and North GRIP (Figure 1). In this study, we focus on EPICA Dome C, the only ice core encompassing the last 640 ka in the AICC2023 timescale. Indeed, the drilling attempt at Dome C gave a 3260 m long core, providing a continuous ice core record covering the last 800 ka (EPICA Community Members, 2004).
Map of archives locations included in our multi-archive chronology. The five ice cores are represented by squares, the IODP U1308 marine core by a dot, and the caves where the different speleothems originate by triangles.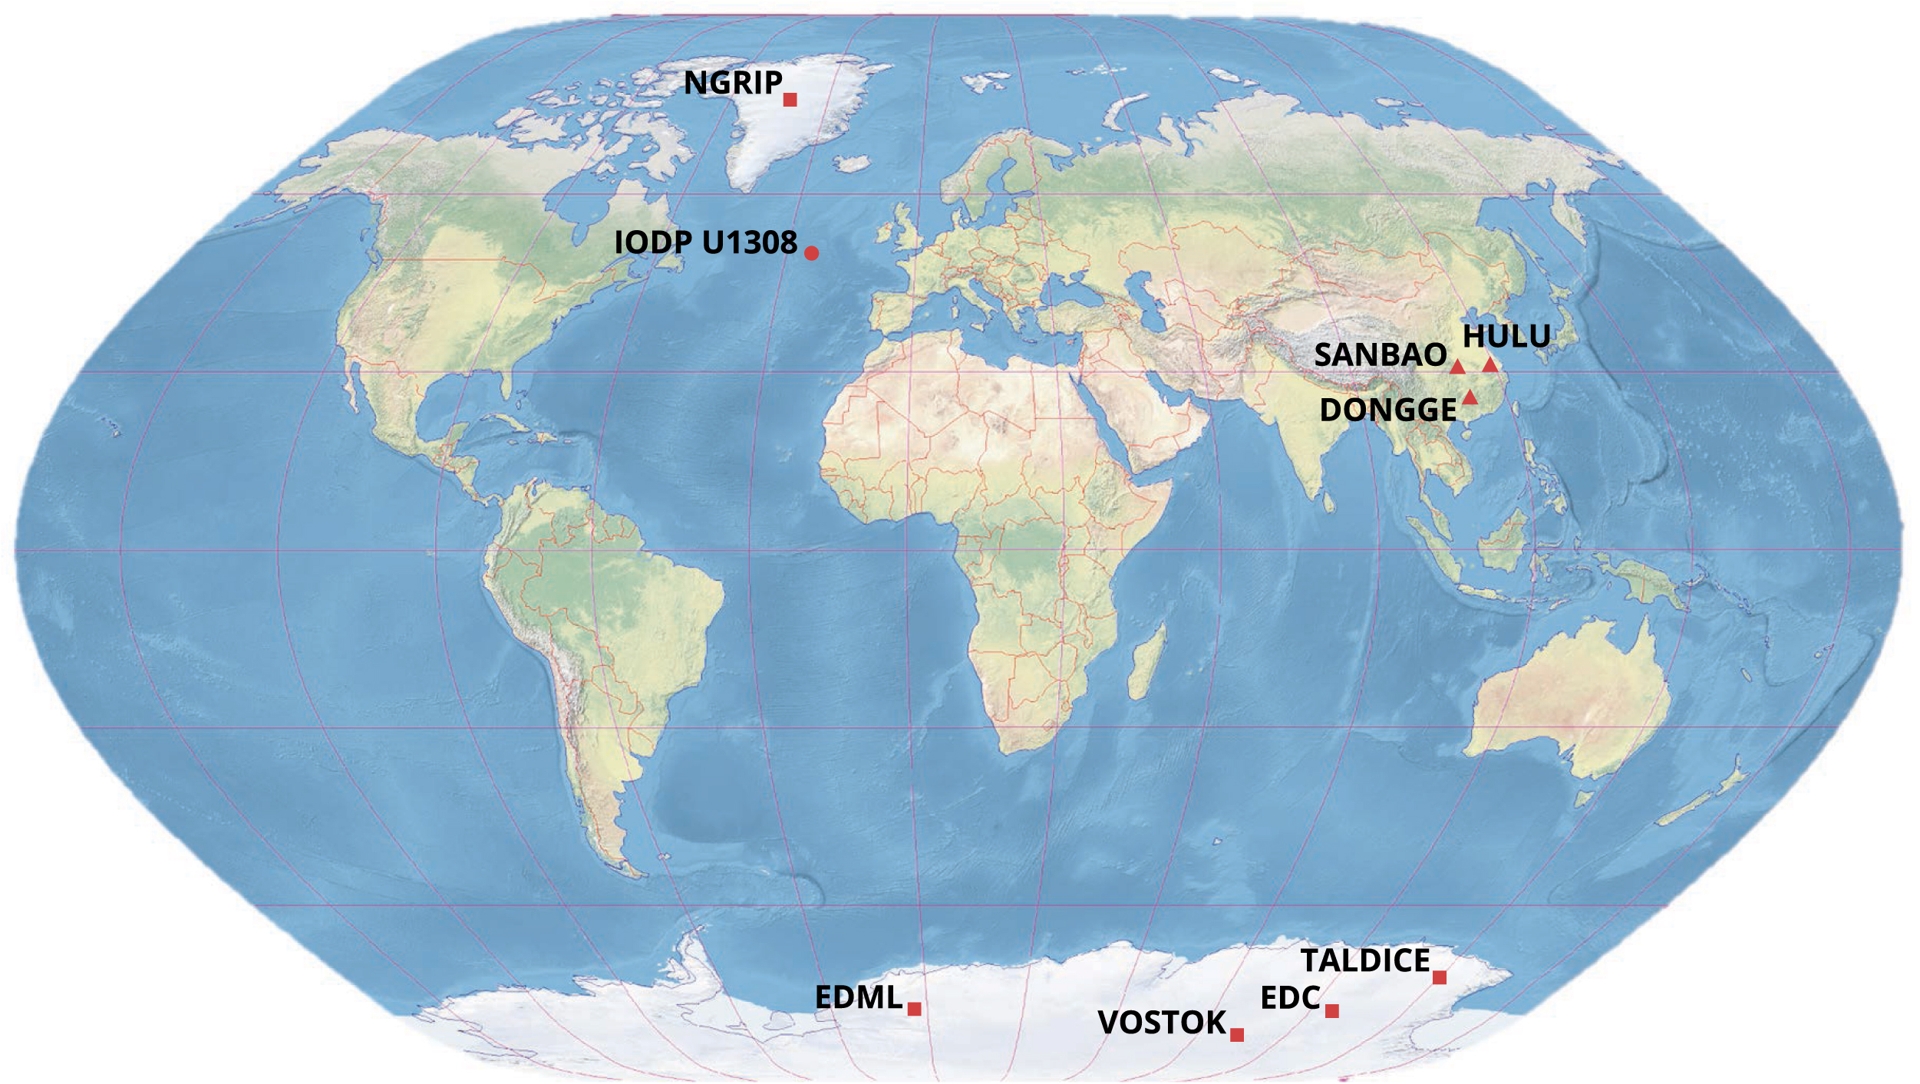
We also used the Paleochrono-1.1 experiment AICC2023-Hulu (Parrenin, Bouchet, et al., 2024). This experiment complements the AICC2023 experiment by incorporating two Chinese speleothems from Hulu Cave (Figure 1), MSL and MSD. These speleothems cover the last glacial period, from 55 to 18 ka BP (Wang, Cheng, Edwards, An, et al., 2001), providing the first multi-archive dating over this interval. Stratigraphic links between speleothems and ice cores are based on the results from Adolphi et al. (2018) and Corrick et al. (2020) showing that millennial-scale Dansgaard–Oeschger (DO) events of the last glacial period, are synchronously archived in the δ18Ocalcite records of East Asian speleothems, and in the global atmospheric CH4 record measurements in the air trapped in the ice core. Following these findings, Parrenin, Bouchet, et al. (2024) established connections at the onset of each abrupt DO event between (1) the North GRIP δ18Oice and the MSD δ18Ocalcite; (2) the MSD δ18Ocalcite and the MSL δ18Ocalcite; and (3) the MSL δ18Ocalcite and the EPICA Dome C CH4. In this study, the mid-slope method was applied, assuming a globally synchronous timing for rapid warming transitions and δ18Ocalcite changes. A constant uncertainty of 100 years (1𝜎), to account for synchronization errors during a DO transition (Corrick et al., 2020; Capron et al., 2021), was assigned to these stratigraphic links used as input in Paleochrono-1.1.
2.3. New sites implemented in our study
While the multi-archive dating experiment in Parrenin, Bouchet, et al. (2024) was limited to the last glacial period, we aim here at studying older Terminations. To achieve this, we require a well-constrained reference archive spanning several hundred thousand years. We therefore used the composite δ18Ocalcite record from Chinese speleothems, which covers the full U–Th dating range, up to 640 ka (Cheng, Edwards, Sinha, et al., 2016), allowing us to study the last seven Terminations. We also aim at broadening this study through implementation of marine core to identify temporal phasing between changes in atmospheric greenhouse concentrations and δ18Obenthic. We detail below the different sites implemented in our new Paleochrono-1.1 experiments in order to infer several multi-archive common chronologies. The associated reference provides the background chronological information implemented in the Paleochrono-1.1 software.
- EPICA Dome C ice core (EDC); Bouchet et al. (2023)
- EPICA Dronning Maud Land ice core (EDML); Bouchet et al. (ibid.)
- Talos Dome ice core (TALDICE); Bouchet et al. (ibid.)
- Vostok ice core; Bouchet et al. (ibid.)
- North GRIP ice core (NGRIP); Bouchet et al. (ibid.)
- MSD speleothem; Parrenin, Bouchet, et al. (2024)
- MSL speleothem; Parrenin, Bouchet, et al. (ibid.)
- Chinese speleothem composite, including records from Sanbao, Hulu, and Dongge caves; this study
- IODP U1308 marine core; this study.
We provided new background files for the two new sites (viii) and (ix) as input to Paleochrono-1.1 based on the data already published from other studies (Table 1). The other background files were already provided in Bouchet et al. (2023) and Parrenin, Bouchet, et al. (2024). We established different sets of stratigraphic links between EDC and these new sites based on different climatic assumptions hence we produced different test chronologies.
Specific background parameters used in Paleochrono-1.1 for IODP U1308 and for the Chinese speleothem composite
| Parameters | Speleothem δ18Ocalcite composite | IODP U1308 |
|---|---|---|
| Top age (yr) | 410 | 186 |
| Top age uncertainty (yr) | 100 | 500 |
| Top depth (m) | 0.001 | 0.01 |
| Bottom age (yr) | 641 500 | 650 330 |
| Bottom depth (m) | 0.656 | 41.48 |
| Deposition rate (m/yr) | 1.02 × 10⁻⁶ | 6.38 × 10⁻⁵ |
| Deposition rate uncertainty 𝜎 | 2 | 0.5/1/2 |
| Correlation length 𝜆 (yr) | 100 | 1000/2000/5000 |
The IODP U1308 values for deposition rate uncertainty and correlation length reflect the range of parameters tested in this study.
2.4. Chronological information related to the sites newly integrated in the dating experiment
2.4.1. The Chinese speleothem δ18Ocalcite composite
We use the δ18Ocalcite composite record from Cheng, Edwards, Sinha, et al. (2016) which is based on an assemblage of multiple distinct speleothems from Hulu, Dongge, and Sanbao caves in China (Figure 1), extending back to 640 ka BP. This composite record can be dated with 655 absolute ages based on U–Th radiometric dating, from the individual speleothems (Wang, Cheng, Edwards, Kong, et al., 2008; Cheng, Edwards, Broecker, et al., 2009; Cheng, Edwards, Shen, et al., 2013; Cheng, Edwards, Sinha, et al., 2016; Cheng, Edwards, Southon, et al., 2018), and was integrated as a single archive into the dating experiment, along with its 655 absolute dated horizons. For integration into Paleochrono-1.1, we need to have the archive record on a depth scale. However, a composite speleothem does not have an intrinsic depth, as it results from the assemblage of multiple distinct speleothems (Cheng, Edwards, Sinha, et al., 2016). As a consequence, we assigned a fictitious depth to the dated horizons (see Supplementary).
2.4.2. The IODP U1308 marine core
The IODP U1308 is one of the sites used in Hobart et al. (2023), and among these, it showed both the most continuous record and the highest resolution of δ18Obenthic during our studied period. This sediment core provides high-resolution records of δ18Obenthic, measured from the carbonate shells of benthic foraminifera, as well as indirect ice-rafted debris (IRD) proxies, spanning the past 1.5 Ma (Channell et al., 2008; Hodell et al., 2008). The indirect IRD proxies used in this core are bulk δ18O (proxy for biogenic versus terrestrial in the carbonate source), the ratios of calcium and silicon to strontium, bulk density and magnetic susceptibility (Hodell et al., 2008). The IODP U1308 marine core was drilled in the Northern Atlantic (Figure 1), in the Ruddiman Belt (Ruddiman and McIntyre, 1977).
The initial age model of IODP U1308 was constructed using, both, radiocarbon dates and oxygen isotope stratigraphy (Hodell et al., 2008). For the first 35 ka, radiocarbon dates were not measured in the Site IODP U1308 but in the DSDP Site 609 marine core (Bond et al., 1993), and then transferred to the depth scale of Site U1308. From 35 to 60 ka BP, the U1308 δ18Obenthic record was correlated to the MD95-2042 marine core on the SFCP04 time scale (Shackleton et al., 2004). For older ages, the U1308 δ18Obenthic record was then correlated to the stacked δ18Obenthic record LR04 (Lisiecki and Raymo, 2005). Given the numerous assumptions made in the initial age model of IODP Site U1308, we chose not to use any of the constrained ages in our dating experiment. Moreover, the age model of the LR04 record is based on orbital tuning assumptions (J. Imbrie and J. Z. Imbrie, 1980; Lisiecki and Raymo, 2005), which obviously cannot be used in a chronology intended to test orbital forcing hypotheses (Huybers and Wunsch, 2005).
2.4.3. Background parameters for new sites
Marine core and speleothem are considered as simple archives in Paleochrono-1.1 and the specific background parameters are listed in Table 1. Since the speleothem composite is the shortest temporal archive used in this study, the chronology is limited to its duration and thus extends back to 640 ka BP.
We assigned a lower age uncertainty at the top for the speleothem than for the marine core because the top of the speleothem is well defined and dated, whereas the top of the marine core is not. The deposition rate is calculated based on the initial chronology, the age and the depth at the top and bottom, for each archive. To ensure the consistency of deposition rates, we focused our analysis of the marine core in Paleochrono-1.1 on the extent covered by our new chronology (i.e. 640 ka BP), rather than extending it to the full core depth at around 1.5 Ma BP.
Following Parrenin, Bouchet, et al. (2024) for the MSD and MSL speleothems, we assigned a value of 2 for the deposition rate uncertainty 𝜎 of the Chinese speleothem composite, i.e. the deposition rate is allowed to vary by the square of an exponential factor (e𝜎). For the marine core deposition rate, we tested different values for 𝜎 between 0.5 and 2 to evaluate how this choice impacts the resulting chronology. This range reflects the potential variability in deposition rates observed in the sedimentary record (ibid.). Although Paleochrono-1.1 does not account yet for the small thinning of marine cores, this limitation is largely compensated for by the uncertainty imposed on the deposition rate, even for a 𝜎 of 0.5, which corresponds to a variation of up to +65% in the imposed sedimentation rate.
A correlation length 𝜆 of 100 years allows for century-scale variations in the deposition rate to be taken into account. We adopted this value for the speleothem composite, also following Parrenin, Bouchet, et al. (ibid.), to allow for centennial-scale variations. For IODP U1308, we tested 𝜆 values of 1000, 2000 and 5000 years to smooth the record at a millennial scale and avoid abrupt change in deposition rate close to stratigraphic tie points. For simple archives, the 𝜎 and 𝜆 values within the ranges presented here represent the limits of the plausible natural variability of the archives.
2.4.4. Stratigraphic links between archives
Tie points are proposed to test the chronological implication of aligning marine sediment core and ice core with the speleothems δ18Ocalcite following different synchronization approaches suggested in published studies and detailed in Section 3. We followed (1) the approach of Extier et al. (2018) and Bouchet et al. (2023) who matched the δ18O of O2 trapped in polar ice cores with the δ18Ocalcite in East Asian speleothems at both millennial and orbital scales, (2) the approach of Buizert et al. (2015), Cheng, Edwards, Sinha, et al. (2016) and Parrenin, Bouchet, et al. (2024) who matched the rapid variations of CH4 trapped in polar ice cores with the rapid variations of δ18Ocalcite in East Asian speleothems and (3) the approach of Hobart et al. (2023) who matched IRD records from marine sediment core with rapid variations in δ18Ocalcite of Chinese speleothem records (Table 2).
Setting of the different speleothem-ice core (SI) and speleothem-marine core (SM) chronological tests
| Configuration | Climate alignment approach | Complementary configuration | Source | Tie point number |
|---|---|---|---|---|
| SI1 | Midpoint of increase/decrease in δ18Ocalcite − Midpoint of decrease/increase in δ18Oatm | SM1 | Bouchet et al. (2023) | 49 |
| SI2 | Onset of decrease in δ18Ocalcite (WMI end) − Onset on CH4 increase | SM1 | This study | 16 |
| SI3 | Midpoint of decrease in δ18Ocalcite (WMI end) − Midpoint on CH4 increase | SM1 | This study | 16 |
| SM1 | AAMV onset/end in δ18Ocalcite − IRD onset/end | SI1 | Hobart et al. (2023) | 40 |
| SM2 | AAMV onset/end in δ18Ocalcite − IRD onset/end | SI1 | This study | 37 |
All SI experiments were performed using the SM1 configuration between IODP U1308 and the speleothem composite, and all SM experiments were performed using SI1 configuration between EDC and the speleothem composite. WMI: Weak monsoon intervals; AAMV: Abrupt Asian monsoon variability.
2.5. Use of the Rampfit algorithm to identify the onset of past Terminations in proxy records
To determine objectively the timing of the start t1 and end t2 evolution in CO2 and in δ18Obenthic during Terminations, we employed the Ramp function regression approach, known as Rampfit (Mudelsee, 2000). Rampfit is a regression-based statistical technique that fits a linear trend between two stable states, a ramp function, to time series data. It estimates the timing of the ramp’s beginning t1 and end t2, as well as the parameter values at the start f1 and end f2 of the ramp. This results in a continuous function f(t) divided into three distinct intervals (Figure 2):
- f(t) = f1 if t < t1
- f(t) evolves linearly from f1 to f2 if t1 < t < t2
- f(t) = f2 if t > t2.
Example of Rampfit results for EDC CO2 (Lüthi et al., 2008; Bereiter et al., 2015; Nehrbass-Ahles et al., 2020) during Termination I. The red line represents the ramp that best fits the data. Arrows indicate the levels f1 and f2 at the beginning t1 and at the end t2 of the ramp.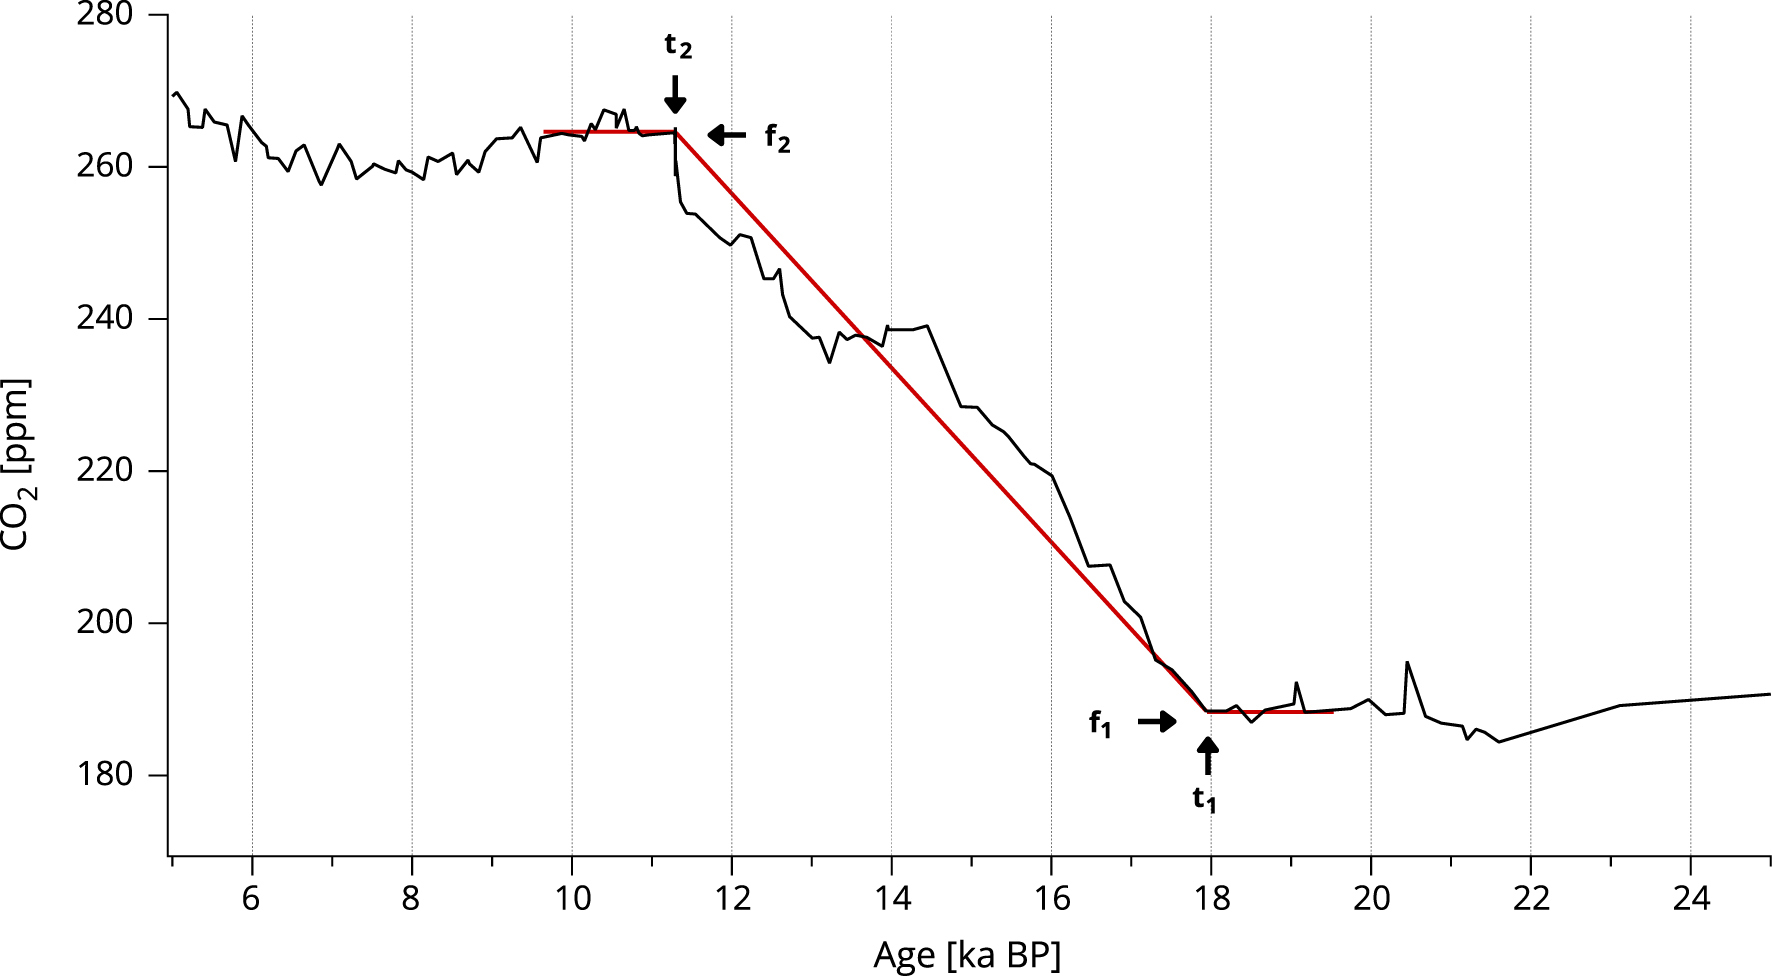
Uncertainties in the timing and parameter values are assessed through 400 bootstrap simulations (Politis and Romano, 1994; Mudelsee, 2000).
The Rampfit algorithm offers an objective approach to identify change points within a dataset. There are nevertheless some parameters that need to be subjectively chosen in the fitting procedure that influence the result, such as the selection of the fit interval. We chose a 8 ka time window on each onset. This interval is large enough to ensure that the beginning of the increase is captured, allowing Rampfit to fully identify the onset. For Termination III, we selected 4 ka intervals in order to highlight two distinct periods of increase. Rampfit minimizes the systematic deviations from constant glacial and interglacial levels and from the assumed linear change from glacial to interglacial conditions even if we are aware that Terminations do not always conform to this simplified shape.
While we are aware of the limitations of the ramp model, we believe it still provides valuable insights into the phasing of glacial Terminations. We want to highlight the system’s major properties without fully capturing the complexity of the data or potential noise. Rampfit has previously been used in several studies to investigate phase relationships making it pertinent to our study (e.g., Röthlisberger et al., 2008; Landais et al., 2013; Govin et al., 2015). In the following, we use the Rampfit description complementary to the display of the full structure of the Terminations to provide some numbers on the relative phasing of CO2 and δ18Obenthic changes over the glacial Terminations.
3. Results of sensitivity tests
In this section, we show the chronologies resulting from synchronization hypotheses between speleothems and ice core records, hereafter SI experiments, as well as between speleothems and marine core, hereafter SM experiments (Tables 2 and 3).
List of experiments used in this study
| Experiment | Tie points uncertainty (yr) | IODP U1308 𝜎 | IODP U1308 𝜆 (yr) |
|---|---|---|---|
| SI1 | Bouchet et al. (2023) | 1 | 2000 |
| SI2 (100 yr) | 100 | 1 | 2000 |
| SI2 (2000 yr) | 2000 | 1 | 2000 |
| SI3 (100 yr) | 100 | 1 | 2000 |
| SI3 (2000 yr) | 2000 | 1 | 2000 |
| SM1 | Hobart et al. (2023) | 1 | 2000 |
| SM1 (0.5–1000) | Hobart et al. (2023) | 0.5 | 1000 |
| SM1 (0.5–5000) | Hobart et al. (2023) | 0.5 | 5000 |
| SM1 (2–1000) | Hobart et al. (2023) | 2 | 1000 |
| SM1 (2–5000) | Hobart et al. (2023) | 2 | 5000 |
| SM2 (100 yr) | 100 | 1 | 2000 |
| SM2 (2000 yr) | 2000 | 1 | 2000 |
The experiments presented are based on the different configurations listed in Table 2 and represent the various chronological sensitivity tests. These tests are based on four parameters: the choice of tie points (different configurations, see Table 2), the tie points uncertainty (1𝜎), the deposition rate uncertainty 𝜎, and the correlation length 𝜆.
3.1. Alignment of ice records to speleothems
We used the East Asian speleothem composite and the Antarctic EDC ice core to test different alignment assumptions over the last 640 ka.
3.1.1. δ18Ocalcite–δ18Oatm approach
Extier et al. (2018) suggested that the variations in δ18Oatm from ice cores could be aligned with the variations in δ18Ocalcite from low-latitude speleothems. Although on orbital timescales this synchronization is subject to some uncertainties, for example regarding the residence time of atmospheric oxygen as detailed in the study of Extier et al. (ibid.), this uncertainty remains smaller than that associated with other dating methods previously used. This approach was subsequently used in AICC2023, the new official EDC chronology, to create gas age constraints for EDC between 640 and 100 ka BP.
Here, we follow this approach in a slightly different way. In AICC2023, the EDC chronology was tuned to the speleothem chronology which led to the assignment of dated horizons to depth levels where δ18Oatm variations were aligned with δ18Ocalcite variations. In the present study, we allow the ice core and speleothem chronologies to vary within their prescribed uncertainty range during the optimisation process of Paleochrono-1.1. As a consequence, the 49 dated horizons from δ18Oatm to δ18Ocalcite matching proposed in AICC2023, are now stratigraphic links between the Chinese speleothem composite and EDC (gray bars in Figure 3 and Table S1). The remaining dated horizons are thus the pre-600 ka BP air age constraints derived from δ18Oatm based on orbital forcing, and from 81Kr (Bouchet et al., 2023) (Figure 4, pink bars). This first Paleochrono-1.1 dating experiment is named SI1. Bouchet et al. (ibid.) stratigraphic links uncertainties are used.
Alignment of EDC and Chinese speleothem δ18Ocalcite records for the last 640 ka. (a) EDC δ18Oatm on the AICC2023 gas age scale (Extier et al., 2018; Grisart, 2023). (b) Chinese δ18Ocalcite on U–Th age scale (Cheng, Edwards, Sinha, et al., 2016). (c) EDC CH4 (Loulergue et al., 2008) on the AICC2023 gas age scale. Tie points represented by vertical gray bars are used in the SI1 test chronology, those by vertical red bars are used in the SI2 test chronologies, and those by vertical blue bars are used in the SI3 test chronologies.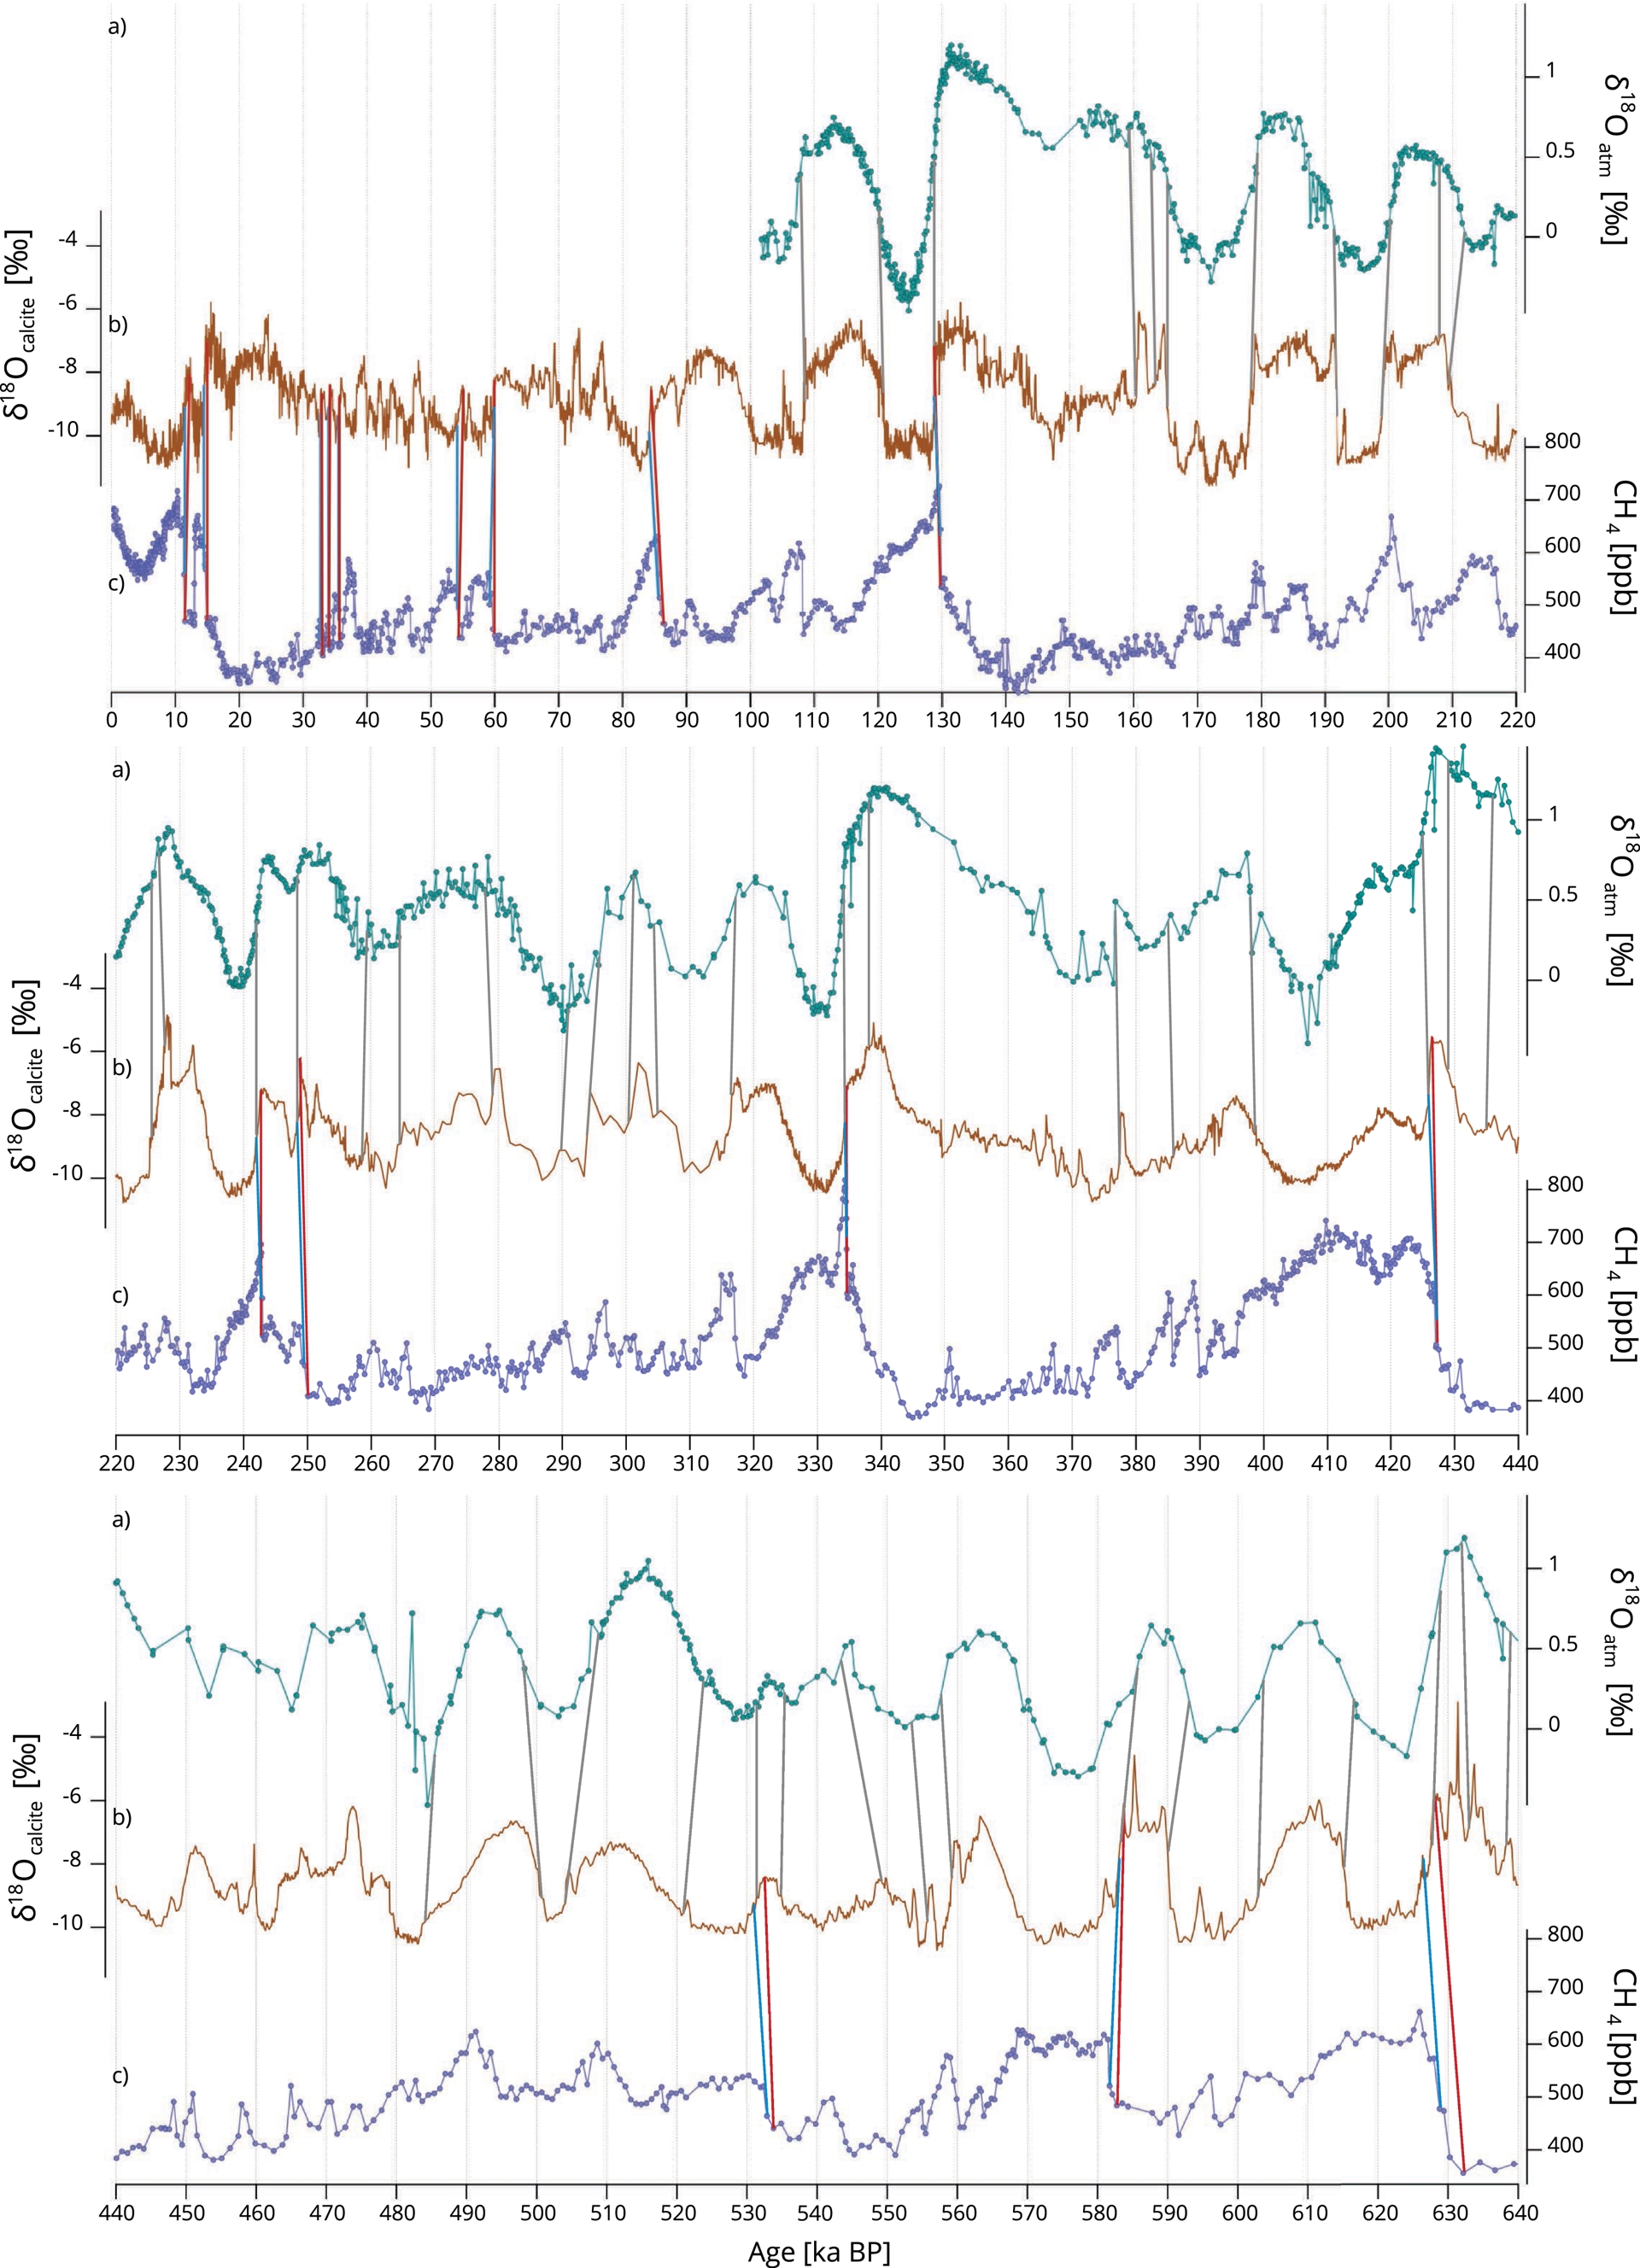
EDC gas age difference between its initial chronology AICC2023 (Bouchet et al., 2023) and different test chronologies obtained with Paleochrono-1.1 over the last 640 ka. The gas age difference is calculated as per AICC2023—test chronologies. A negative (positive) difference indicated that the new chronology leads (lags) AICC2023. The test chronologies are constructed, between the Chinese speleothem composite and EDC, by matching (1) the δ18Ocalcite and the δ18Oatm (SI1, gray line); (2) the beginning of the δ18Ocalcite decrease and the beginning of the CH4 increase (SI2, red lines); (3) the mid-point of the δ18Ocalcite decrease and the mid-point of the CH4 increase (SI3, blue lines). Bottom vertical bars represent the age of corresponding tie points. Top vertical bars represent (1) the Chinese speleothem composite dated horizons (black); (2) the AICC2023 EDC ice age constraints (green); (3) the AICC2023 EDC gas age constraints (pink). Gray rectangles indicate interglacials from MIS 15 to MIS 1.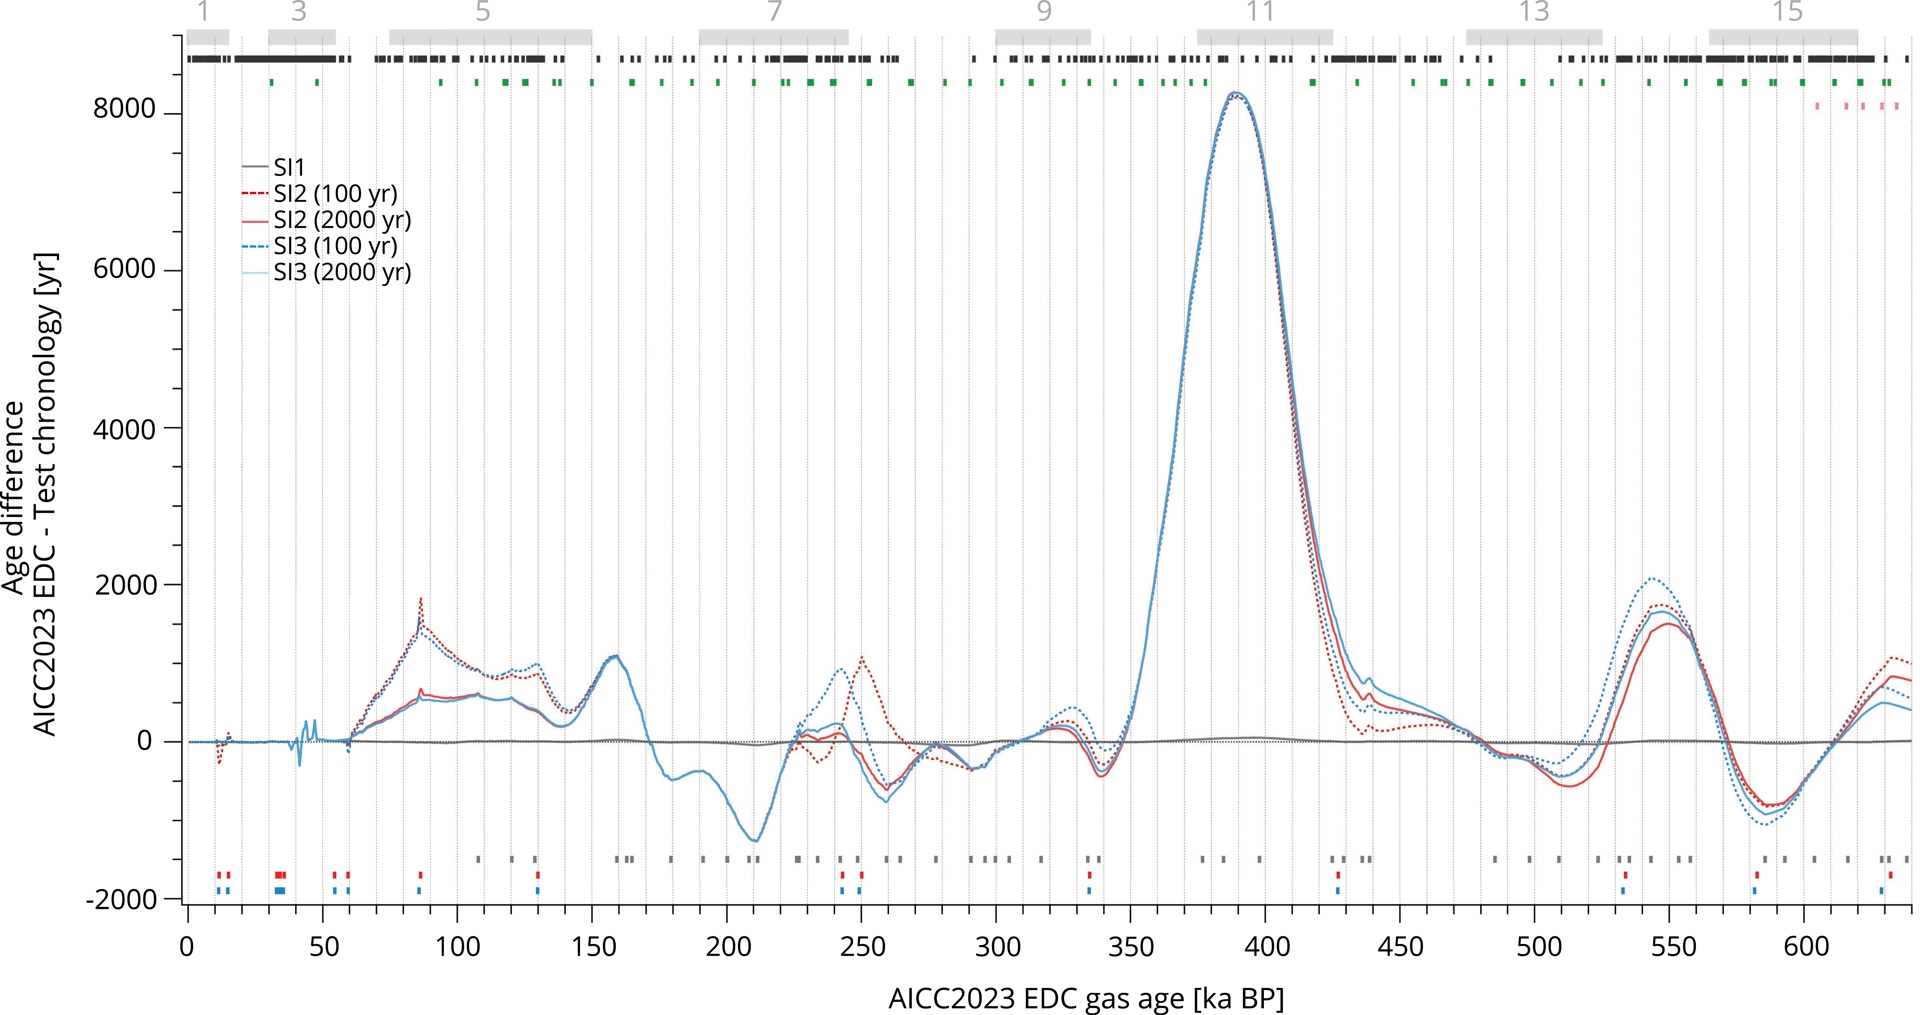
3.1.2. δ18Ocalcite–CH4 approach
In two additional dating experiments (SI2 and SI3), we explored an alternative synchronization method between EDC and the Chinese speleothem stack already proposed by Buizert et al. (2015) and Parrenin, Bouchet, et al. (2024) for the last 60 ka. In these studies, the authors matched abrupt increases in CH4 over DO events with the decreases of δ18Ocalcite in some Chinese speleothems. We tested the application of this method to the last 640 ka.
The mechanism behind this alignment is the intensification of the Asian monsoon resulting in the expansion of wetland areas. Because wetlands represent a significant source of methane emissions, such expansion leads to an increase in atmospheric CH4. For our study, we assume that the abrupt ends of Weak Monsoon Intervals (WMIs), associated with a decrease in speleothem δ18Ocalcite, as defined and identified by Cheng, Edwards, Broecker, et al. (2009) in East Asian speleothem, coincide with abrupt increases in atmospheric methane observed in ice core records. Cheng, Edwards, Broecker, et al. (ibid.) and Cheng, Edwards, Sinha, et al. (2016) identified eleven WMIs over the past 640 kyr: nine during Terminations, including Terminations IIIa and VIIa (ibid.), and two during the transitions from MIS 5.2 to MIS 5.1 and from MIS 4 to MIS 3, which we all used as stratigraphic links. The WMI identified in these two studies occurred notably during deglaciations. Additionally, we established stratigraphic links for well-resolved and easily identifiable DO events in CH4 and δ18Ocalcite, DO events 5.2, 6, 7, and 14 according to Rasmussen et al. (2014). We did not establish stratigraphic links for DO events 8, 10, 11, and 12, as they were already used as stratigraphic ties in our study between the MSL δ18Ocalcite and the EDC CH4 (see Section 2 and Parrenin, Bouchet, et al. (2024)).
Since the correspondence between δ18Ocalcite and methane changes was not always straightforward over the past 640 ka, we decided to employ two alignment methods. In the first experiment SI2, we matched the onset of the δ18Ocalcite decrease with the onset of the methane increase (Figure 3, red bars). In the second approach SI3, we aligned the midpoints of the δ18Ocalcite decreases and of the methane increases (Figure 3, blue bars), following the methodology of Buizert et al. (2015) and Parrenin, Bouchet, et al. (2024). This approach appears to be in reasonably good agreement with the δ18Ocalcite–δ18Oatm method. A total of 16 δ18Ocalcite–CH4 stratigraphic links are determined over the last 640 kyr for each experiment (red and blue bars in Figure 3 and Tables S3 and S4).
For each SI2 and SI3 experiment, we tested two extreme uncertainty values associated with the stratigraphic links in Paleochrono-1.1 Each experiment uses two different uncertainty values: 100 and 2000 years. The 100 year uncertainty is a rough estimate of the synchronization error during DO events, based on the duration of transitions observed in different archives (Corrick et al., 2020; Capron et al., 2021; Parrenin, Bouchet, et al., 2024). The 2000 year uncertainty corresponds to the maximum temporal resolution of EDC methane data around 640 ka BP (Loulergue et al., 2008). It would be interesting to determine an uncertainty value for each event individually, but this goes beyond the scope of the present study, which rather aims to test the maximum margins of error that could result from constructing such chronologies.
3.1.3. Impacts of tie point selection and associated uncertainties on the chronology
There are not much differences between AICC2023 and the new SI1 timescale for EDC (Figure 4, gray line). Some small shifts are observed, such as a shift of approximately 100 years toward older ages at 210 and 290 ka BP, and a shift of around 180 years toward younger ages at 390 ka BP. During these three periods, the ages of the dated U–Th horizons of the speleothem have larger uncertainty (around 1000 years) compared to the surrounding ages, providing weaker constraints. This results in an increase in the uncertainty (1𝜎) of the EDC SI1 chronology by approximately 50 years during these three periods compared to AICC2023. The use of multi-archive chronologies can lead to slightly increased age uncertainties, as it involves combining the chronological uncertainties associated with each individual site.
There are strong impacts of SI2 and SI3 stratigraphic links on EDC timescale, with a tendency to delay the initial chronology by an average of about 400 years (Figure 4). The impact of the CH4 tie points is most apparent when their 1𝜎 uncertainty is low, and when EDC ice age constraints (total air content and δO2/N2) (Bouchet et al., 2023) and gas age constraints are lacking, as illustrated by the dark red and blue curves, and the scarcity of green and pink bars in Figure 4. The largest difference is seen during MIS 11 (Figure 4), due to the lack of dated horizons and stratigraphic links in this period when using the δ18Ocalcite–CH4 approach. Cheng, Edwards, Sinha, et al. (2016) do not identify any WMI between 420 and 340 ka BP (Figure 3b), and there are no significant abrupt increase in methane (Figure 3c). Additionally, between 366 and 475 ka BP, the absolute ice age constraints (Figure 4, green bars) have a large uncertainty of 6000 years (Bouchet et al., 2023). This is due to the low eccentricity context of MIS 11 leading to subtle variations in insolation, smaller δO2/N2 changes (see Figure 1 in Bouchet et al. (ibid.)), and a deficient coherency between total air content record and integrated summer insolation (see Figure 2 in Bouchet et al. (ibid.)). Orbital tuning methods are not reliable for this period.
3.2. Alignment of marine record to speleothems
We used the East Asian speleothem composite and the IODP U1308 sediment core to test different alignment assumptions over the last 640 ka.
3.2.1. δ18Ocalcite–IRD approach
Hobart et al. (2023) linked North Atlantic marine sediment cores to the Chinese speleothem composite record using correlation of IRD layers in North Atlantic cores with Abrupt Asian Monsoon Variability (AAMV) recorded in Chinese speleothem δ18Ocalcite records. The beginning of an AAMV event corresponds to an abrupt increase in δ18Ocalcite. The end is more gradual but is defined as the point where the δ18Ocalcite value becomes similar to that at the beginning of the AAMV. Because IODP U1308 has multiple indirect IRD proxies, all proxies were compared simultaneously when identifying IRD events, but only bulk δ18O is shown on Figure 5 because this record has the highest resolution. The AAMV events were identified by Hobart et al. (ibid.) using the detrended δ18Ocalcite record from Cheng, Edwards, Sinha, et al. (2016), which removes orbital-scale components. We used the 40 stratigraphic links identified by Hobart et al. (2023), for Site U1308 (displayed in Figure 5, with gray and black bars, and compiled in Table S5) in the SM1 experiment. We applied the same uncertainty attached to stratigraphic links as in Hobart et al. (ibid.).
Alignment of IODP U1308 IRD proxy and Chinese δ18Ocalcite records between 650 and 250 ka BP. (a) Detrended Chinese δ18Ocalcite records on U–Th age scale (Cheng, Edwards, Sinha, et al., 2016). (b) IODP U1308 bulk δ18O used as indirect IRD proxy (Hodell et al., 2008) (axis has been reversed). Tie points represented by vertical dotted black bars are used in both SM1 and SM2 test chronologies, those by vertical dashed gray bars are used only in SM1 test chronology, and those by vertical solid purple bars are used only in SM2 test chronologies.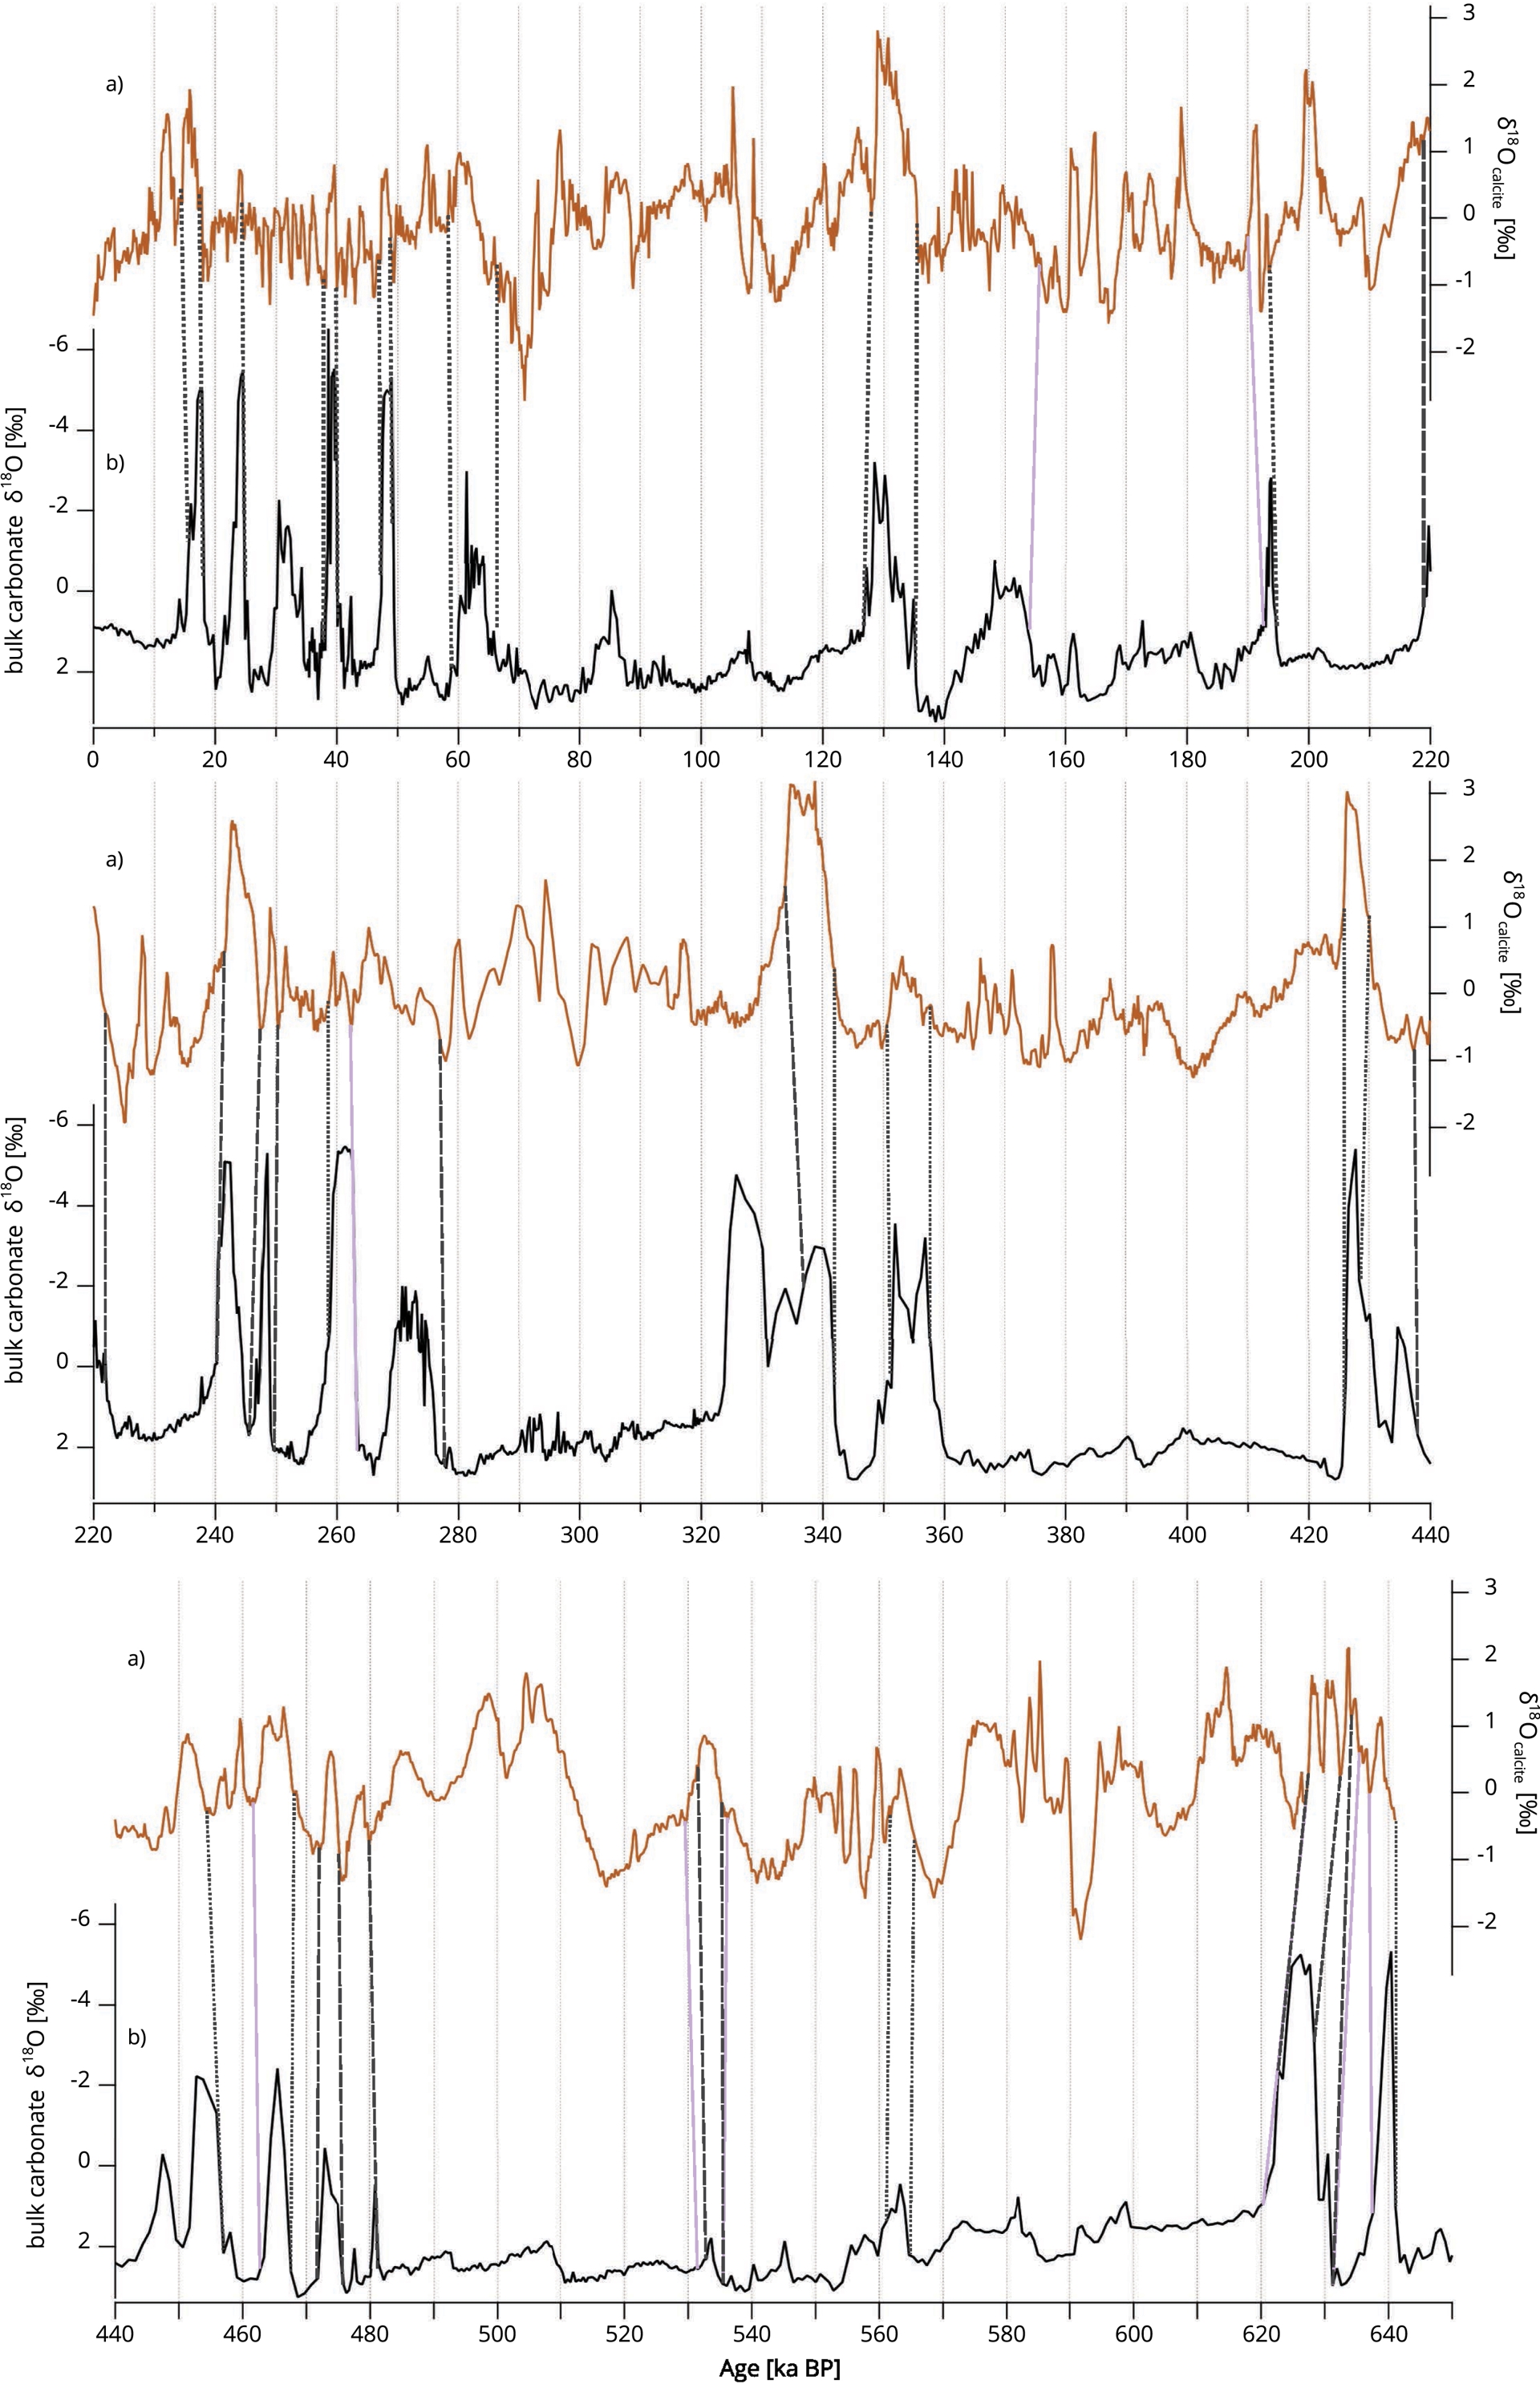
In addition, we performed sensitivity tests on the uncertainties associated with the background accumulation rate 𝜎 and values of the correlation length 𝜆 on IODP U1308. The initial SM1 experiment was conducted using a 𝜎 of 1 and a 𝜆 of 2000 years (Table 3). These values appear to be consistent with typical estimates for a marine sediment core. To assess the impact of these parameters on the resulting chronology, we also tested different combinations of 𝜎 and 𝜆 (Table 3).
We tested the sensitivity of the chronology to the choice of tie points by using different tie points in the SM2 experiment. To achieve this, we used Hobart et al. (ibid.) stratigraphic ties and chose to remove, add, or adjust several tie points. All stratigraphic links described below are given only by the age of the speleothem tie point for simplicity, therefore on U–Th age scale (Cheng, Edwards, Sinha, et al., 2016). We decided to remove the six stratigraphic links identified by Hobart et al. (2023) at 437.4, 334, 277.2, 222, and 218.8 ka BP because the AAMV identification was unclear (Figure 5). A stratigraphic tie point at 479.8 ka BP was also rejected because it was difficult to clearly identify the IRD associated with the AAMV (Figure 5). Two stratigraphic links, identified by Hobart et al. (ibid.) at 475.4 and 472.2 ka BP, correspond to an IRD peak recorded in the bulk carbonate of IODP U1308 but not in the other IRD proxies of the core. Therefore, we decided not to select these stratigraphic links for the sensitivity experiment SM2. In contrast, some visible AAMV events were not taken into account in Hobart et al. (ibid.). For the SM2 sensitivity test, we thus decided to add stratigraphic links at 156.78 and 88.78 ka BP. We also added tie points at the end and beginning of AAMV events when these were easy to detect at 461.84, 262.4, and 190 ka BP (Figure 5). Additionally, we decided to shift the speleothem tie points at 535.2 and 531.6 ka BP to 536.2 and 529.6 ka BP, respectively, to rather align the beginning and end of the AAMV (Figure 5). The δ18Ocalcite signal prior to 600 ka BP does not resemble the IRD signal of IODP U1308, making the identification of stratigraphic links in this period more complicated. Therefore, we removed a speleothem tie point at 632.4 ka BP, added one at 637 ka BP, and shifted two to 635.4 and 627 ka BP to account for the beginnings and ends of AAMV and IRD events (Figure 5). The 37 stratigraphic tie points used in SM2 over the last 640 kyr are displayed in Figure 5 (purple and black bars) and compiled in Table S6.
We then varied the uncertainties associated with the stratigraphic links in Paleochrono-1.1 for the SM2 experiment, testing two extreme values: 100 and 2000 years. These uncertainties correspond to the same order of magnitude as those used in Hobart et al. (2023). The SM2 experiment was performed using a deposition rate uncertainty 𝜎 of 1 and a 𝜆 of 2000 years (Table 3).
3.2.2. Impacts of tie point and background parameters selection on the chronology
Figure 6 represents the difference between the initial chronology of IODP U1308 (Hodell et al., 2008) and the SM1, SM2 (100 yr) and SM2 (2000 yr) chronologies, in order to investigate the influence of the choice of stratigraphic alignment and the associated uncertainties (see Table 3). The largest differences are observed during the MIS 9, 13 and 15, mainly due to what we called the background chronology. The background chronology corresponds to the prior chronology of our archive in Paleochrono-1.1, that is, a constant sedimentation rate roughly matching the average actual rate over the past 640 ka, and without any chronological constraints (see Section 2). The difference between the initial chronology of IODP U1308 and its background chronology is shown in Figure S1. This Figure highlights significant chronological discrepancies, up to 20 000 years across several periods, caused by variations in the sedimentation rate. These discrepancies are reduced by the influence of chronological constraints, here stratigraphic links, in the posterior age model as modeled by Palechrono-1.1 (Figure 6).
IODP U1308 age difference between its initial chronology (Hodell et al., 2008) and different test chronologies (SM1 and SM2) obtained with Paleochrono-1.1 over the last 640 ka. The age difference is calculated as per initial–test chronologies. A negative (positive) difference indicated that the new chronology leads (lags) the initial chronology. Bottom vertical bars represent the age of corresponding tie points. Gray rectangles indicate interglacials from MIS 15 to MIS 1.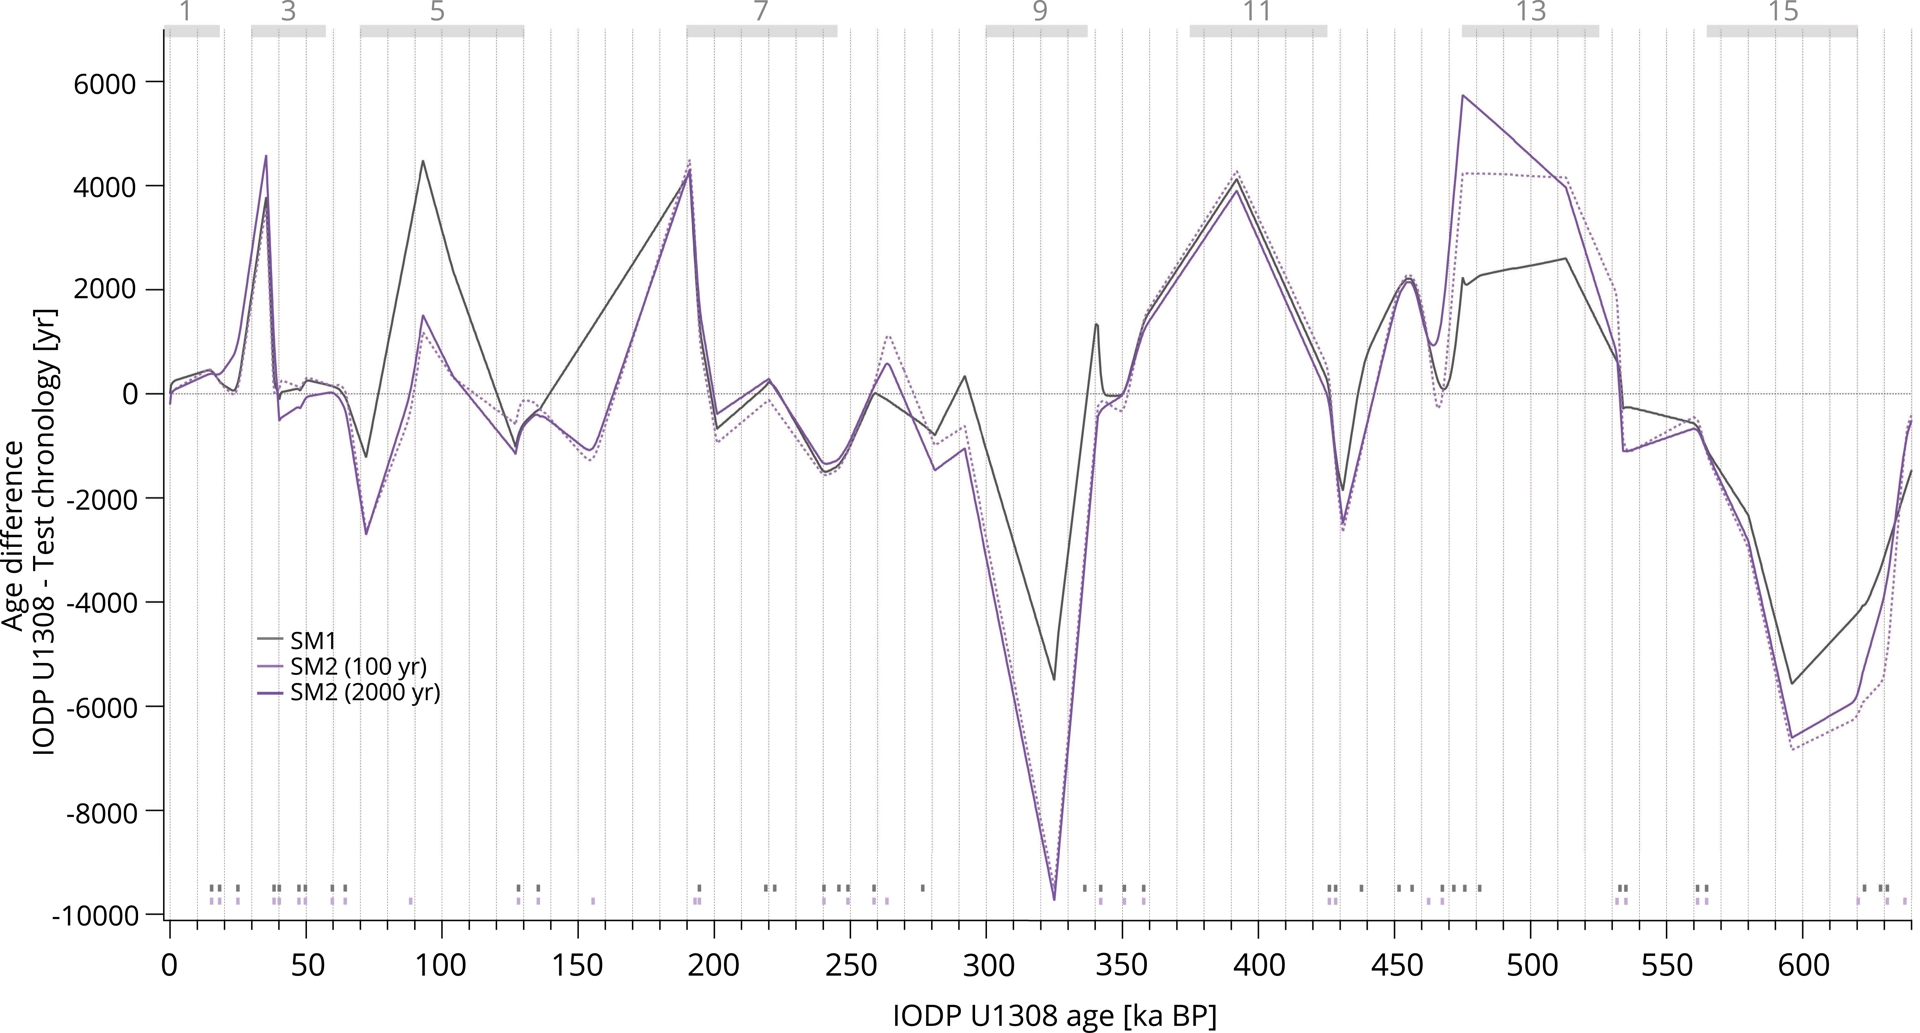
According to Figure S1, for the three periods mentioned above, there is a chronological offset ranging from 8000 to 20 000 years. These discrepancies persist in the posterior chronologies because there are no age constraints for these intervals (Figure 6, bottom vertical bars). Indeed, these are periods with no recorded IRD peaks (Figure 5). This underscores both the importance of sedimentation rate selection in simple archive, especially when rates are highly variable (see Section 2), and the limitations of the alignment method δ18Ocalcite–IRD, which does not allow for continuous stratigraphic correlation throughout the entire record.
Having decided not to use dated horizons for Site U1308 in Paleochrono-1.1 (see Section 2), the new chronologies are highly dependent on the stratigraphic alignments. This is evident in Figure 6, which shows large differences between the gray curve and the purple curves. The difference between the initial chronology of IODP U1308 and the various chronologies generated by varying the deposition rate uncertainty 𝜎 and correlation length 𝜆 is shown in Figure S2, illustrating the influence of these two parameters on the posterior chronologies.
4. Sequence of climatic events over glacial Terminations
4.1. Initial chronologies
Figures 7 and S3 show the comparison between paleorecords from various regions across the Earth on their independent timescales. While the onset of interglacials is related to an increased Northern Hemisphere summer insolation, the exact timing of relative changes of insolation, CO2 and δ18Obenthic is still a major question in paleoclimate science due to complex interactions involving astronomical forcing, ice volume, greenhouse gases concentration levels, and temperature. Termination VII appears at odd with the general behavior with EDC CO2 starting to increase during the minimum phase of the boreal summer insolation. Additionally, the CO2 increase is quite steep compared to the slow increase of the δ18Obenthic decrease (related to sea level and deep-sea temperatures) during this deglaciation (Figure 7).
Evolution of climate over Terminations. (a) Summer solstice insolation at 65°N (Laskar et al., 2004). (b) Atmospheric CO2 concentration from EDC (Lüthi et al., 2008; Bereiter et al., 2015; Nehrbass-Ahles et al., 2020) on AICC2023 age scale. (c) δ18Obenthic record from IODP U1308 on its initial age scale (axis is reversed) (Hodell et al., 2008). (d) Chinese δ18Ocalcite records on U–Th age scale (axis is reversed) (Cheng, Edwards, Sinha, et al., 2016). (e) IODP U1308 bulk δ18O used as indirect IRD proxy on its initial age scale (axes are reversed) (Hodell et al., 2008).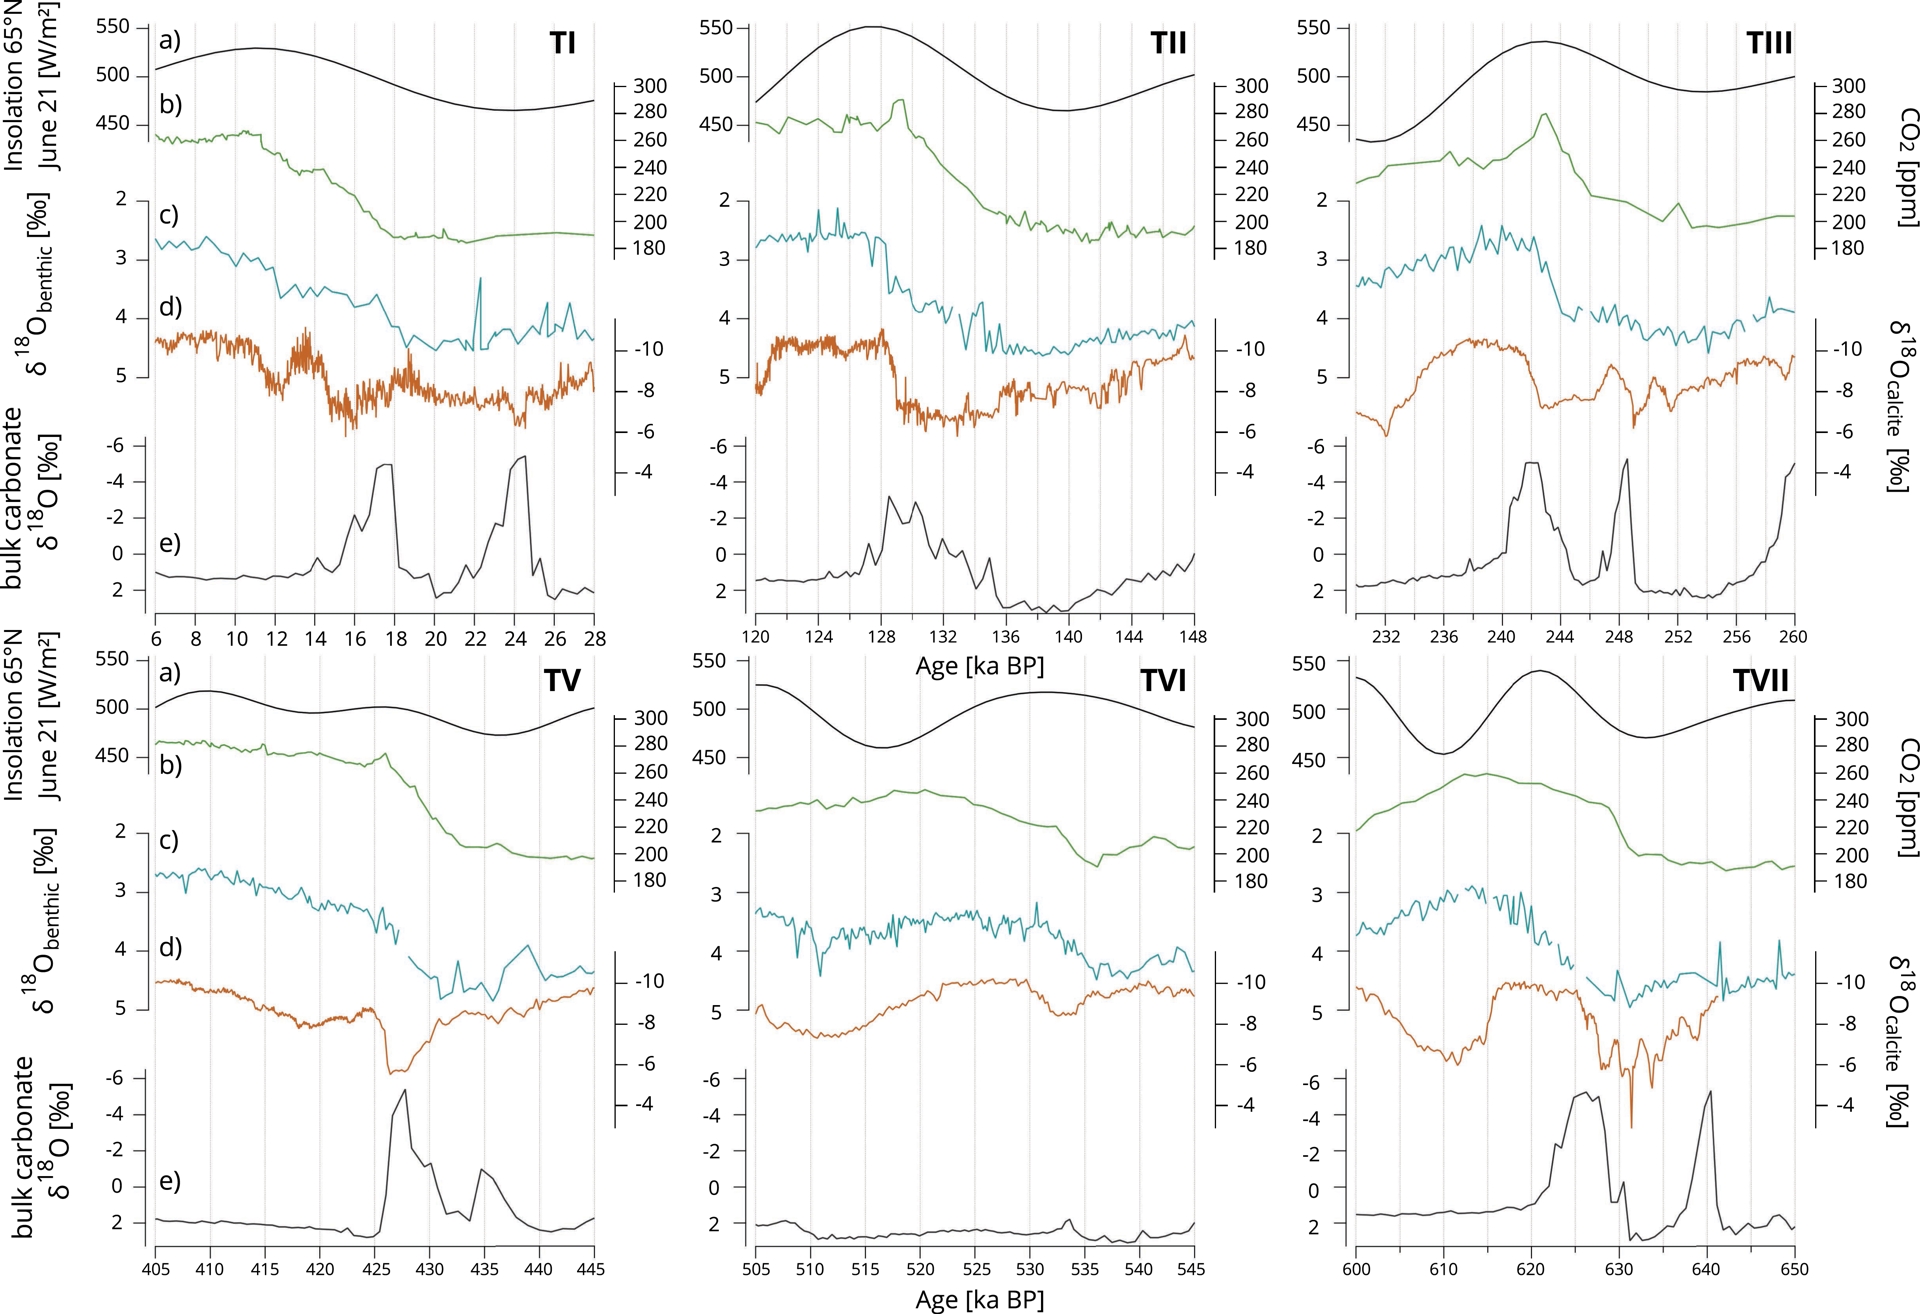
A more precise examination of the sequences of climatic events across each Termination would be required for a better understanding of the mechanisms involved. The establishment of a coherent chronology for glacial and marine cores over the past seven Terminations will help us better understand the sequence of climatic events by comparing EDC CO2 and the δ18Obenthic from IODP U1308. Only one Termination is excluded from our study, Termination IV (around 340 ka BP), because benthic foraminifera at Site U1308 are scarce during this period (Hodell et al., 2008) (see Figure S3).
4.2. Sequence of CO2 versus δ18Obenthic at the onset of the different Terminations
To study the temporal shift between changes in CO2 concentration and changes in δ18Obenthic over Terminations, we used the Rampfit method described above. The results of Rampfit on archives initial chronologies during Terminations VII, VI, V, III, II, and I are represented in Figure 8 together with the original curves of CO2 and δ18Obenthic. Note that we followed Röthlisberger et al. (2008) approach and considered the Termination III as a two-steps Termination. For the considered Terminations, the onset of the CO2 increase either leads or is concommittant (Terminations I and VI), within chronological uncertainties, with the δ18Obenthic decrease when using initial chronologies.
CO2 and δ18Obenthic over glacial Terminations and ramps estimated by Rampfit. (a) Atmospheric CO2 concentration from EDC (Lüthi et al., 2008; Bereiter et al., 2015; Nehrbass-Ahles et al., 2020) on AICC2023 age scale. (b) δ18Obenthic record from IODP U1308 on its initial age scale (axes are reversed) (Hodell et al., 2008). Ramps are shown as solid lines (red for CO2 and purple for δ18Obenthic). Increase starting points are indicated by vertical dashed bars. Termination III is treated as a two-step event.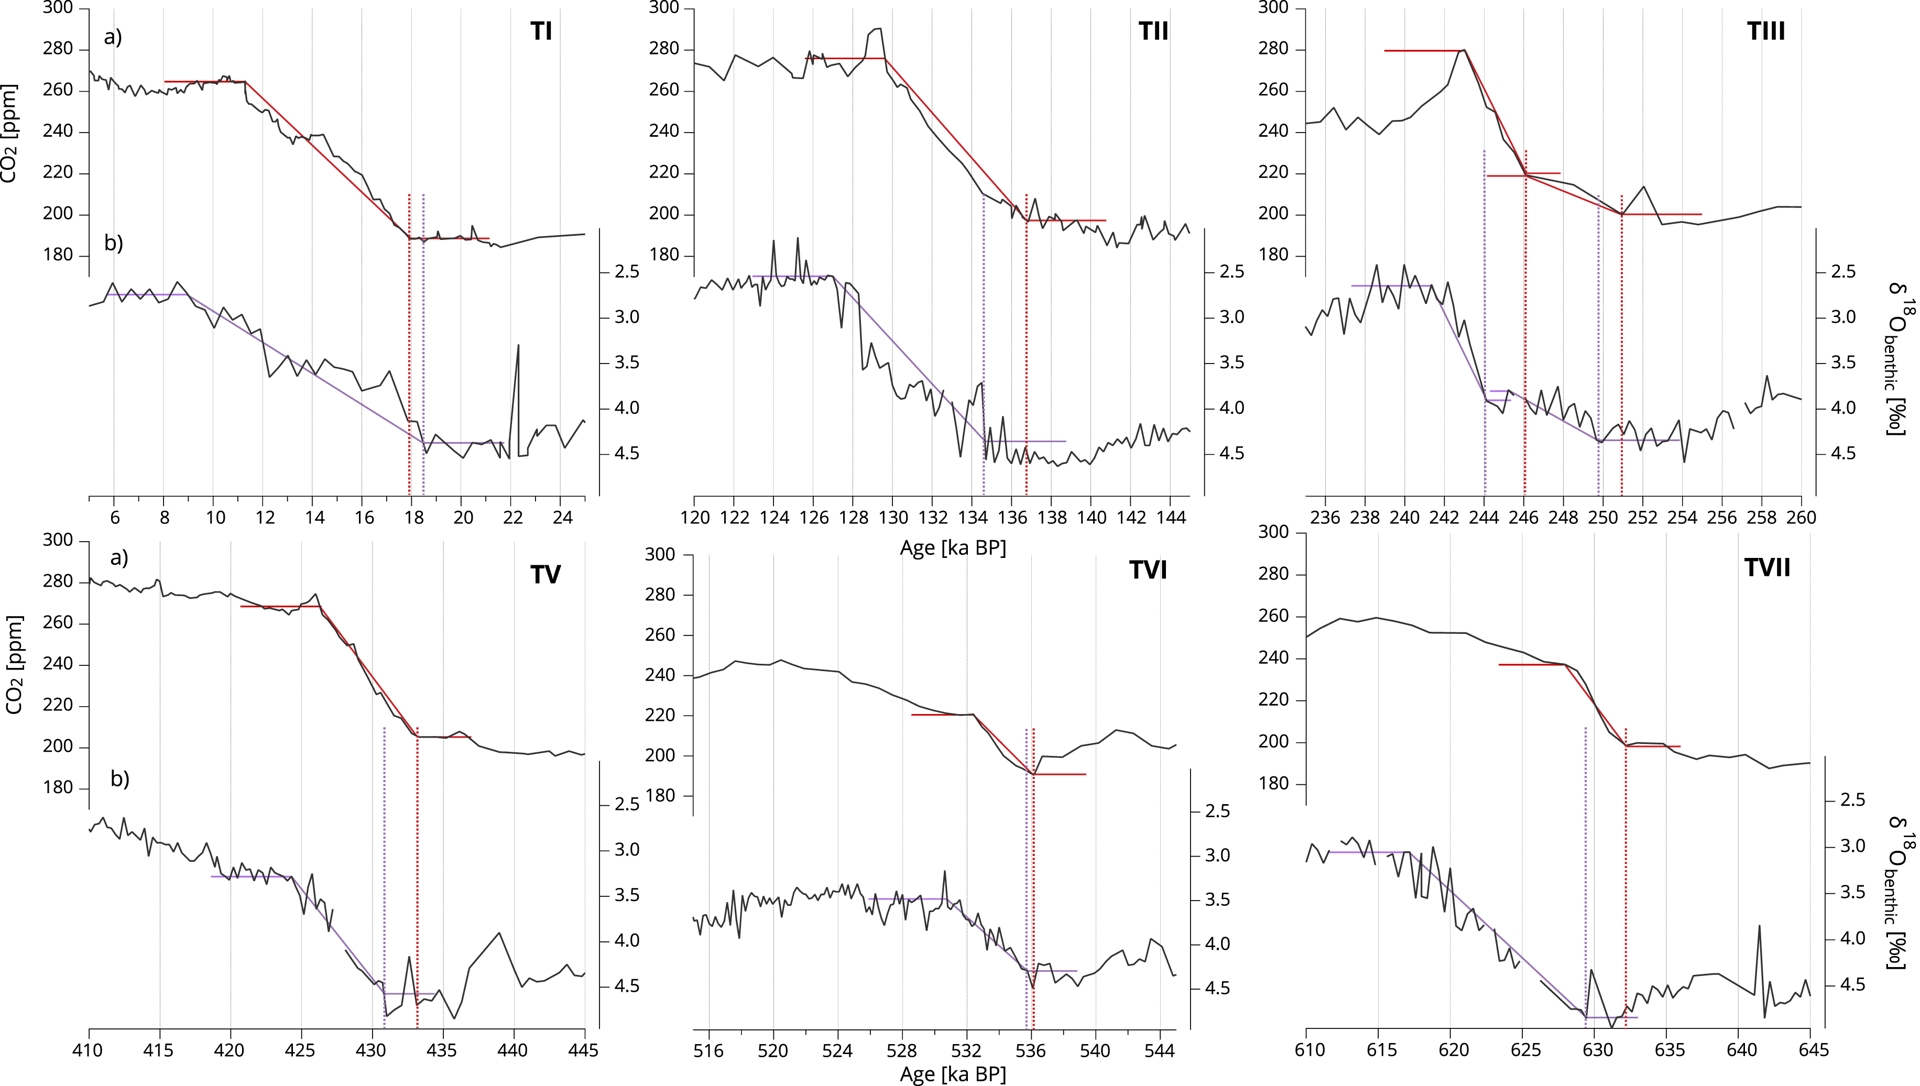
We also evaluated the onset of each Termination for these two parameters across all the different chronology tests built in this study (Table 3). The temporal phasing estimates between them vary among the different assumptions used for chronological matching. This result is illustrated in Figure 9 using a scatter plot to visualize the leads and lags between CO2 increase and δ18Obenthic decrease observed as determined through the Rampfit approach. A negative (positive) difference on the y-axis of Figure 9 indicates that the onset of the deglacial rise in CO2 leads (lags) the decrease in δ18Obenthic. As we study only one δ18Obenthic record from North Atlantic, a point of inflection may reflect a regional temperature signal rather than a global change in sea level or deep ocean temperature. This is why we also indicate for comparison the phase relationship between CO2 increase and the LR04δ18Obenthic stack decrease on their initial chronologies (Figure 9, green squares).
Temporal phasing at the onset of the past Terminations, as determined by Rampfit. A positive phasing indicated that the onset of the deglacial decrease in the δ18Obenthic leads the increase in EDC atmospheric CO2 concentration. Black squares: Comparisons between the IODP U1308 δ18Obenthic, on its initial chronology (Hodell et al., 2008), and the CO2, on AICC2023. Gray squares: Comparisons between the δ18Obenthic on SM1, and the CO2 on SI1. Purples triangles: Comparisons between the δ18Obenthic on SM2 (100 yr) and SM2 (2000 yr), and the CO2 on SI1. Orange triangles: Comparisons between the δ18Obenthic on SM1 (0.5–1000) and SM1 (0.5–5000), and the CO2 on SI1. Hexagons: Comparisons between the δ18Obenthic on SM1 (2–1000) and SM1 (2–5000), and the CO2 on SI1. Diamonds: Comparisons between the δ18Obenthic on SM1, and the CO2 on SI2 (100 yr) and SI2 (2000 yr). Dots: Comparisons between the δ18Obenthic on SM1, and the CO2 on SI3 (100 yr) and SI3 (2000 yr). Green squares: Comparisons between the δ18Obenthic of LR04, on its initial chronology (Lisiecki and Raymo, 2005), and the CO2 on AICC2023. All the experiments are described in Tables 2 and 3. The background rectangles highlight the range of results obtained from the new chronologies. Therefore, they frame the temporal offsets estimated in this study and exclude the offsets between initial chronologies (black squares) and between AICC2023 and LR04 (green squares). The black and green squares may fall within these rectangles, which would indicate that previously published results lie within the range of possibilities proposed in this study.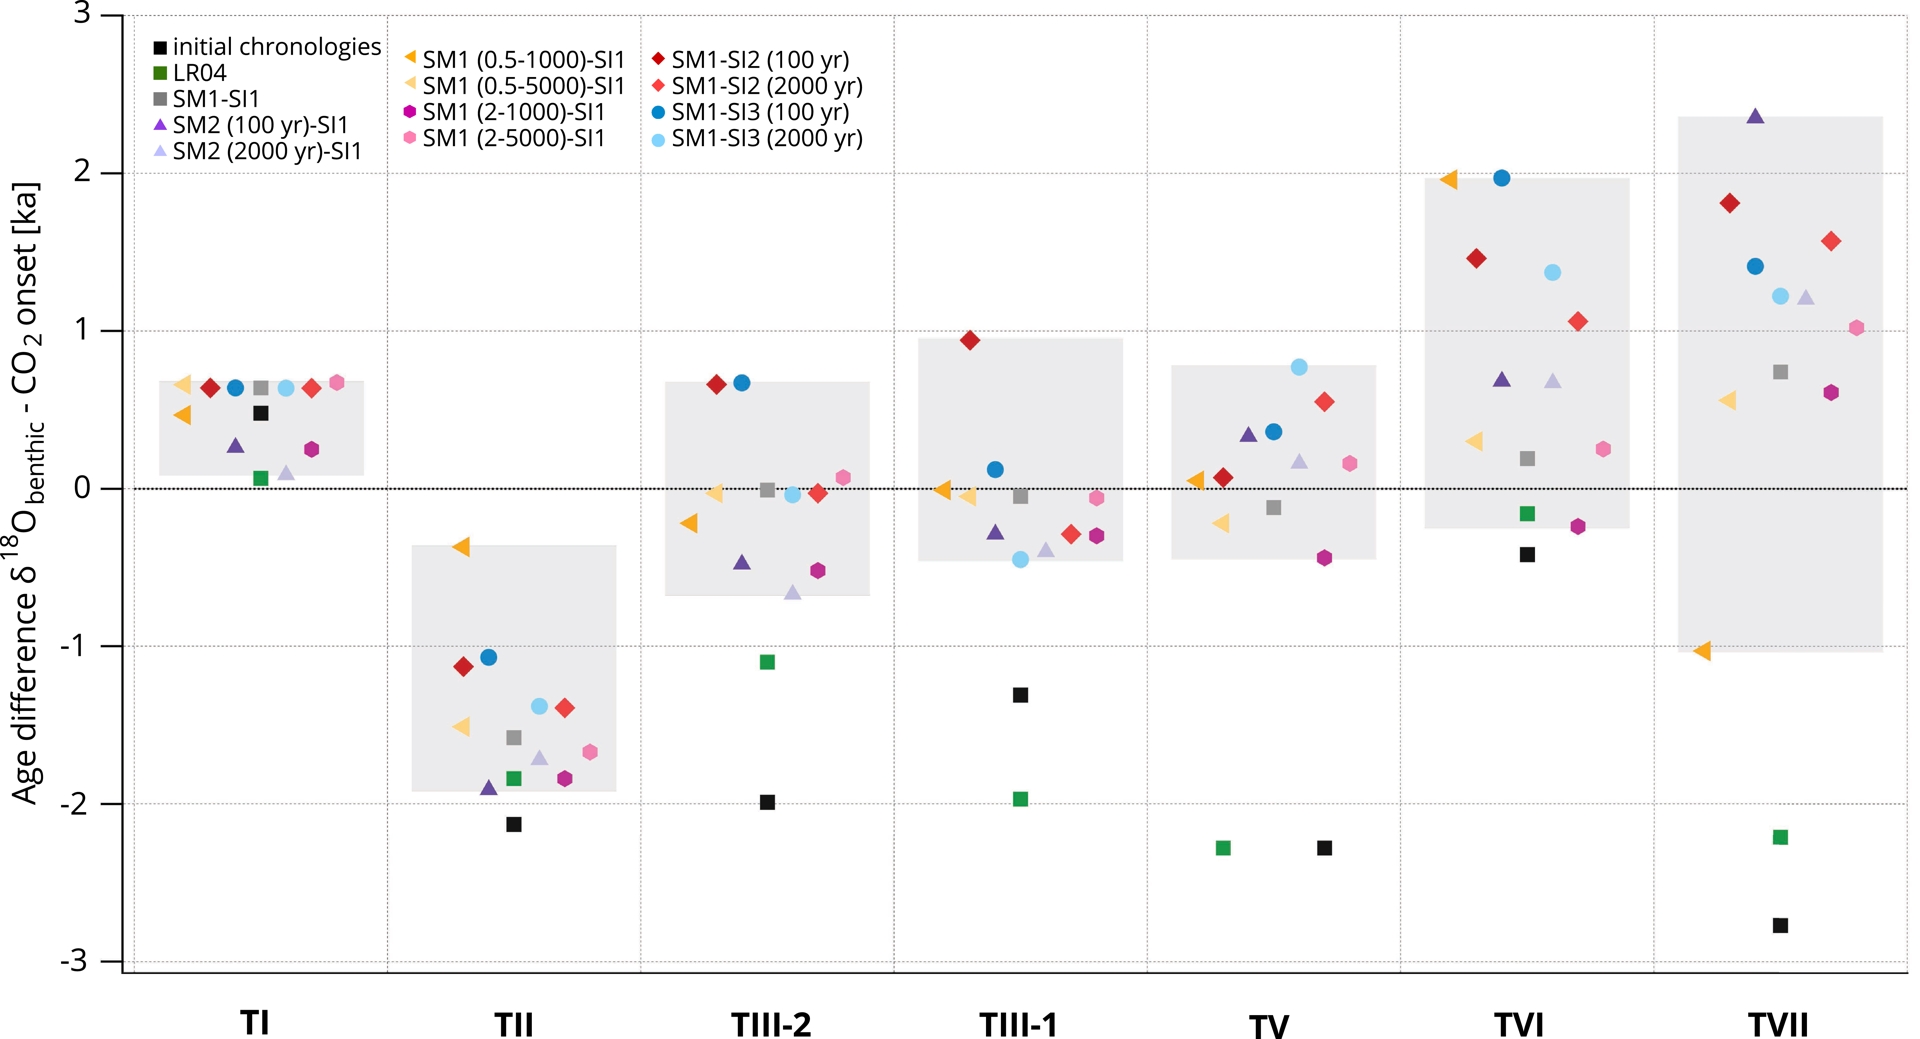
As already shown in Figures 7 and 8, the use of initial chronologies generally indicates a lead of the CO2 increase relative to the δ18Obenthic signal (Figure 9, black squares). This lead typically spans a few millennia, except during Terminations I and VI, where changes in atmospheric CO2 and δ18Obenthic are nearly synchronous, with a phase difference of less than 500 years. For Terminations I and II, the differences in CO2–δ18Obenthic phasing between the initial and new chronologies remain minor and do not alter the overall phase relationship: during Termination I, the δ18Obenthic slightly leads the CO2, whereas CO2 rises first during Termination II. For the other Terminations, the differences are more substantial, with shifts greater than 1 ka, and up to 5 ka at the onset of Termination VII for the SM2 (100 yr)–SI1 chronology, when comparing with the initial chronology.
As shown in Figure 9, the temporal relationship between atmospheric CO2 and δ18Obenthic remains robust for the different chronological tests across a range of tested uncertainties, including those related to stratigraphic tie points, the background accumulation rate uncertainty 𝜎, the correlation length 𝜆, and changes in tie point selection (SM1 versus SM2). Indeed, although for most Terminations the results obtained in this study do not allow us to clearly determine which record increased first, and therefore do not fully resolve the mechanisms involved in the initiation of the Terminations, they do provide a well-defined temporal uncertainty window. This window, calculated as the difference between the maximum and minimum age offsets across the new experiments (see black rectangles in Figure 9), encompasses all plausible chronological uncertainties. This window spans approximately 0.6 ka for TI, 1.5 ka for TII, 1.3 ka for TIII-2, 1.4 ka for TIII-1, 1.2 ka for TV, 2.2 ka for TVI, and 3.4 ka for TVII. Given that the initial uncertainty between CO2 and δ18Obenthic exceeded 4 ka, based on the chronological uncertainties of AICC2023 and LR04, and considering that the IODP U1308 age model provides no dating uncertainty, our method represents a significant improvement. These results underscore the coherency of our multi-archive chronological approach, combining stratigraphic constraints from diverse archives with the Paleochrono-1.1 optimization framework. Figures S4 and S5 display the different proxy used in this study on the different new chronologies for each Terminations.
4.3. Dating of the Terminations
The creation of common chronologies incorporating both marine sediment and ice cores using different assumptions also allows us to propose absolute dating uncertainties. We concentrate here on the timing of the onset of the Terminations as indicated by the onset of the δ18Obenthic decrease. The onset ages of Terminations for IODP U1308 and LR04 were estimated using the Rampfit approach (Table 4). The IODP U1308 age uncertainties incorporate both the difference in chronology between the different sensitivity tests and the uncertainty produced by the Paleochrono-1.1 model. These include uncertainties in the dating constraints (both absolute dating constraints and stratigraphic tie points) as well as in the deposition rates.
Estimated ages of the IODP U1308 δ18Obenthic onset decrease during the past 640 ka terminations
| Age of Terminations onset (ka BP) | |||
|---|---|---|---|
| IODP U1308 (this study) | Hobart et al. (2023) | LR04 | |
| TI | 18.4 [17.5–19.3] | 17.5 [16.1–18.5] | 18 |
| TII | 135.3 [133.3–137.6] | 133.0 [130.7–142.7] | 135 |
| TIII-2 | 245.8 [244.4–247.2] | - | 245 |
| TIII-1 | 250.8 [249.6–251.9] | 246.3 [244.9–252.1] | 249 |
| TV | 433.3 [431.2–435.4] | 429.9 [428.2–433.8] | 431 |
| TVI | 536.7 [534.7–539.0] | 533.5 [531.5–535.0] | 536 |
| TVII | 633.0 [629.8–636.1] | 629.4 [627.6–633.0] | 630 |
Termination III is treated as a two-step event. Ages of Termination onset using the different chronological tests from this study are compared with those of previous studies, which also examine the onset of δ18Obenthic changes during deglaciations. The onset values for IODP U1308 represent the average of δ18Obenthic onset ages derived from our different chronological experiments. Uncertainty values are indicated in brackets. Results from Hobart et al. (2023) are based on a North Atlantic δ18Obenthic stack, while LR04 represents a global δ18Obenthic stack. The cell left empty represents the case when the study did not publish ages for TIII-2.
While using a stack of sediment cores would offer a more representative reconstruction of deep-ocean temperature and sea-level changes during deglaciations, our results based on a single core remain consistent, within error margins, with previous studies based on core stacks (Lisiecki and Raymo, 2005; Hobart et al., 2023) (Table 4).
5. Conclusion and perspectives
In this study, we have developed a first coherent chronology integrating ice core, speleothem and sediment core archives over the past 640 000 years. The resulting chronology is based on the AICC2023 ice core timescale (Bouchet et al., 2023), East Chinese speleothems (Wang, Cheng, Edwards, An, et al., 2001; Cheng, Edwards, Sinha, et al., 2016) and the IODP U1308 sediment core (Channell et al., 2008; Hodell et al., 2008). This multi-archive framework, produced using the Paleochrono-1.1 dating model (Parrenin, Bouchet, et al., 2024) which combines stratigraphic constraints and absolute dating, represents a methodological advance for studying glacial–interglacial transitions. Three types of climatic alignments were used and discussed in the construction of this chronology: the δ18Ocalcite–δ18Oatm and δ18Ocalcite–CH4 links between Asian speleothems and an Antarctic ice core, and the δ18Ocalcite–IRD links between Asian speleothems and a North Atlantic sediment core.
Sensitivity tests explored the impact of climate alignment assumptions, uncertainties associated with stratigraphic tie points and uncertainties attached to the background scenario emphasizing the importance of robust methods to ensure the reliability of multi-archive chronologies. The resulting chronologies show coherent results over Terminations when comparing the relative timing of CO2 versus δ18Obenthic changes despite the large range of assumptions and uncertainties explored. This result supports our approach based on the incorporation of stratigraphic links between different archives into the Paleochrono-1.1 model, allowing the combination of the chronological constraints from each archive. This approach appears particularly adapted for archives that often lack absolute dating constrains, such as marine core.
In the future, improvements to the Paleochrono model could advance multi-archive chronologies by incorporating, for example, sediment core thinning and potential phase offsets between signals, which are currently assumed to be strictly synchronous.
Moreover, alignments between marine cores and ice cores could also be considered, allowing the extension of the multi-archive chronology to the deep part of EDC, between 800 and 600 ka BP, and to the oldest Terminations recorded (TIX to TVII). Dust-dust and paleomagnetism-10Be alignments may be envisaged and even combined (e.g., Martinez-Garcia et al., 2011; Cauquoin, 2013; Wolff et al., 2022). In parallel, the chronology of the EDC deepest part could be independently improved using new measurements of dating proxies, such as δ15N, δO2/N2 and δ18O of O2.
Acknowledgements
This research has been supported by the European Research Council, H2020 European Research Council (ICORDA (grant no. 817493)). Development of the Paleochrono model was funded by CNRS/INSU/LEFE projects IceChrono and CO2Role. EA acknowledges the financial support from the French National Research Agency programs “ToBE” (ANR-22-CE01-0024) and “AEON” (ANR-23-CE01-0024). EC received the financial support from the French National Research Agency under the “Programme d’Investissements d’Avenir” through the HOTCLIM project (ANR-19-MPGA-0001).
Our thanks go to Elisabeth Michel, Steve Barker and Eric W. Wolff for sustaining the discussion.
Declaration of interests
The authors do not work for, advise, own shares in, or receive funds from any organization that could benefit from this article, and have declared no affiliations other than their research organizations.